
Tree-Ring Inferred Drought Variations in the Source Region of the Yangtze, Yellow, and Mekong Rivers over the Past Five Centuries


1
Beijing Municipal Climate Center, Beijing Meteorological Service, Beijing 100089, China
2
State Key Laboratory of Vegetation and Environmental Change, Institute of Botany, Chinese Academy of Sciences, Beijing 100093, China
*
Author to whom correspondence should be addressed.
Water 2024, 16(8), 1186; https://doi.org/10.3390/w16081186
Submission received: 26 March 2024
/
Revised: 16 April 2024
/
Accepted: 17 April 2024
/
Published: 22 April 2024
(This article belongs to the Section Water and Climate Change)
Abstract
:The climate in the source region of the Yangtze River, Yellow River, and Mekong River is of great research interest because of its sensitivity to global change and its importance in regulating water resources to densely populated and vast areas downstream. A five-century long record of spring (May–June) for the Palmer Drought Severity Index (PDSI) was reconstructed for this region using tree-ring width chronologies of Qilian juniper (Juniperus przewalskii Kom.) from five high-elevation sites. The reconstruction explained 46% variance in the PDSI during the instrumental period 1955–2005. The reconstructed PDSI showed that the occurrence of dry extremes became frequent during the last century relative to the previous four centuries. The standard deviation of the reconstructed PDSI in the 100-year window showed that the recent century held apparent high values of standard deviation in the long-term context. Sustained droughts occurred in periods 1582–1631, 1737–1757, 1772–1791, 1869–1891, 1916–1939, and 1952–1982, whereas relatively wet intervals were observed in 1505–1527, 1543–1564, 1712–1736, 1792–1816, 1852–1868, 1892–1915, and 1983–2008. Notably, in the context of the past five centuries, the study region showed an increased inter-annual variability in the recent century, suggesting an intensified hydroclimatic activity possibly associated with global warming. Moreover, through diagnostic analysis of atmospheric circulation, we found that the negative phase East Asian–Pacific teleconnection pattern may be likely to trigger drought in the study region.
1. Introduction
Located in the northeastern Qinghai-Tibetan Plateau (NE-QTP), the source region of three major rivers (i.e., Yangtze River, Yellow River, and Mekong River) is an important component of the “water tower” of East Asia [1]. This region is also an important water resource reserve and ecological barrier in China and even in East Asia, which is characterized by rich alpine biological resources, a fragile ecological environment and sensitivity to climate change [2,3]. Changes in climate and its extremes over this region not only influence local ecosystems, environment and water resources, but also the security of food, energy and water in the downstream areas [4]. Therefore, there is an urgent need to conduct more scientific study on conservation techniques in this region because of its unique and significant strategic position with respect to national ecological security.
Climate change in this region exerts significant impacts on water resources not only at the regional scale but also on lower reaches of the rivers, thus influencing the life of a dense human population [5]. Both the regional climate and ecosystems show significant changes over the NE-QTP region due to global warming [6,7]. The rate of warming in this region from 1982 to 2015 was four times the global warming rate, which would accelerate vegetation growth in the region [8]. Both ecological restoration and warming climate change favorably impact regional runoff in the NE-QTP region [9]. It was reported that the water resources and precipitation in this region significantly declined in the 1990s, but returned to above normal during the last decade [10,11]. However, other studies reported that the regional runoff showed a continuous decreasing trend during recent decades [12,13], yet different spatial and seasonal characteristics were reported [14]. Historical changes in climate and ecology were found to cause significant reductions in mean and high flows over the Yellow River headwaters during 1979–2005, which potentially increased drought risk over its downstream areas [15]. Changes in temperature and precipitation alter the regional water cycle and ecological environment of the NE-QTP region, which have changed the spatial patterns of ecological services [16]. Recent research suggests that the NE-QTP region will become warmer and wetter in the future. Extreme precipitation will also increase at the 1.5 °C global warming level [17]. These reveal that the frequency and magnitude of hydroclimate extremes have increased in the context of global warming. However, how the hydroclimate extremes would respond to the 1.5 °C/2 °C warming, and how much ecological factors contribute are still unknown. These observations were short in length, making it difficult to obtain the full spectrum of regional hydroclimate variability. Thus, it is imperative to put the recent changes into the context of a longer time scale to better understand its temporal patterns of variability.
Reconstructions of past climate by high-resolution proxies, such as tree rings and ice cores, are useful approaches for evaluating present conditions in the context of the long-term past [18,19,20]. Several studies based on tree rings have been conducted to investigate the drought–wetness variations on the NE-QTP. Gou et al. (2007) [21] reconstructed the streamflow variations of the Yellow River over the past six centuries and found an increasing trend during much of the twentieth century but decreasing after the 1980s. It was also reported that precipitation has undergone a slowly increasing trend over the past five centuries in the middle of Qilian Mountain, and the probability of intensified rainfall events seemed to increase during the past two centuries [22]. Ham et al. (2023) [23] found that the variability of precipitation became larger under the ongoing climate warming. Nevertheless, a drying trend in recent decades was detected from the stable carbon isotope record of Qinghai spruce [24]. Zhang et al. (2011) [25] also pointed out that drought events became more frequent during the 20th century. Reconstructed precipitation over the past 1000 years in Delingha exhibited a decrease in magnitude after 1850 [26]. Liu et al. (2021) [27] found that the reconstructed runoff in the source region of the Yangtze River had periodic changes with multiple time scales of quasi 16–32 years and significantly correlated with the North Atlantic Oscillation (NAO) and Pacific Decadal Oscillation (PDO). However, the possible causes of hydroclimate extremes in the NE-QTP region are still not fully understood. To date, it remains unclear as to the long-term moisture variability and its potential causes, possibly due to the spatial complexity of the study areas.
In this study, we attempted to (1) establish a regional chronology based on tree rings sampled in the source region of the three great rivers (hereafter TRS-region for short), (2) reconstruct the regional drought–wetness variations for the past five centuries, and (3) check whether the frequency and severity of drought events have increased in the context of the long past, and identify their potential causes. The remainder of this paper is organized as follows: the materials and methods are introduced in Section 2, the results are presented in Section 3, the discussions are described in Section 4, and conclusions are provided in Section 5.
2. Materials and Methods
2.1. Tree-Ring Data
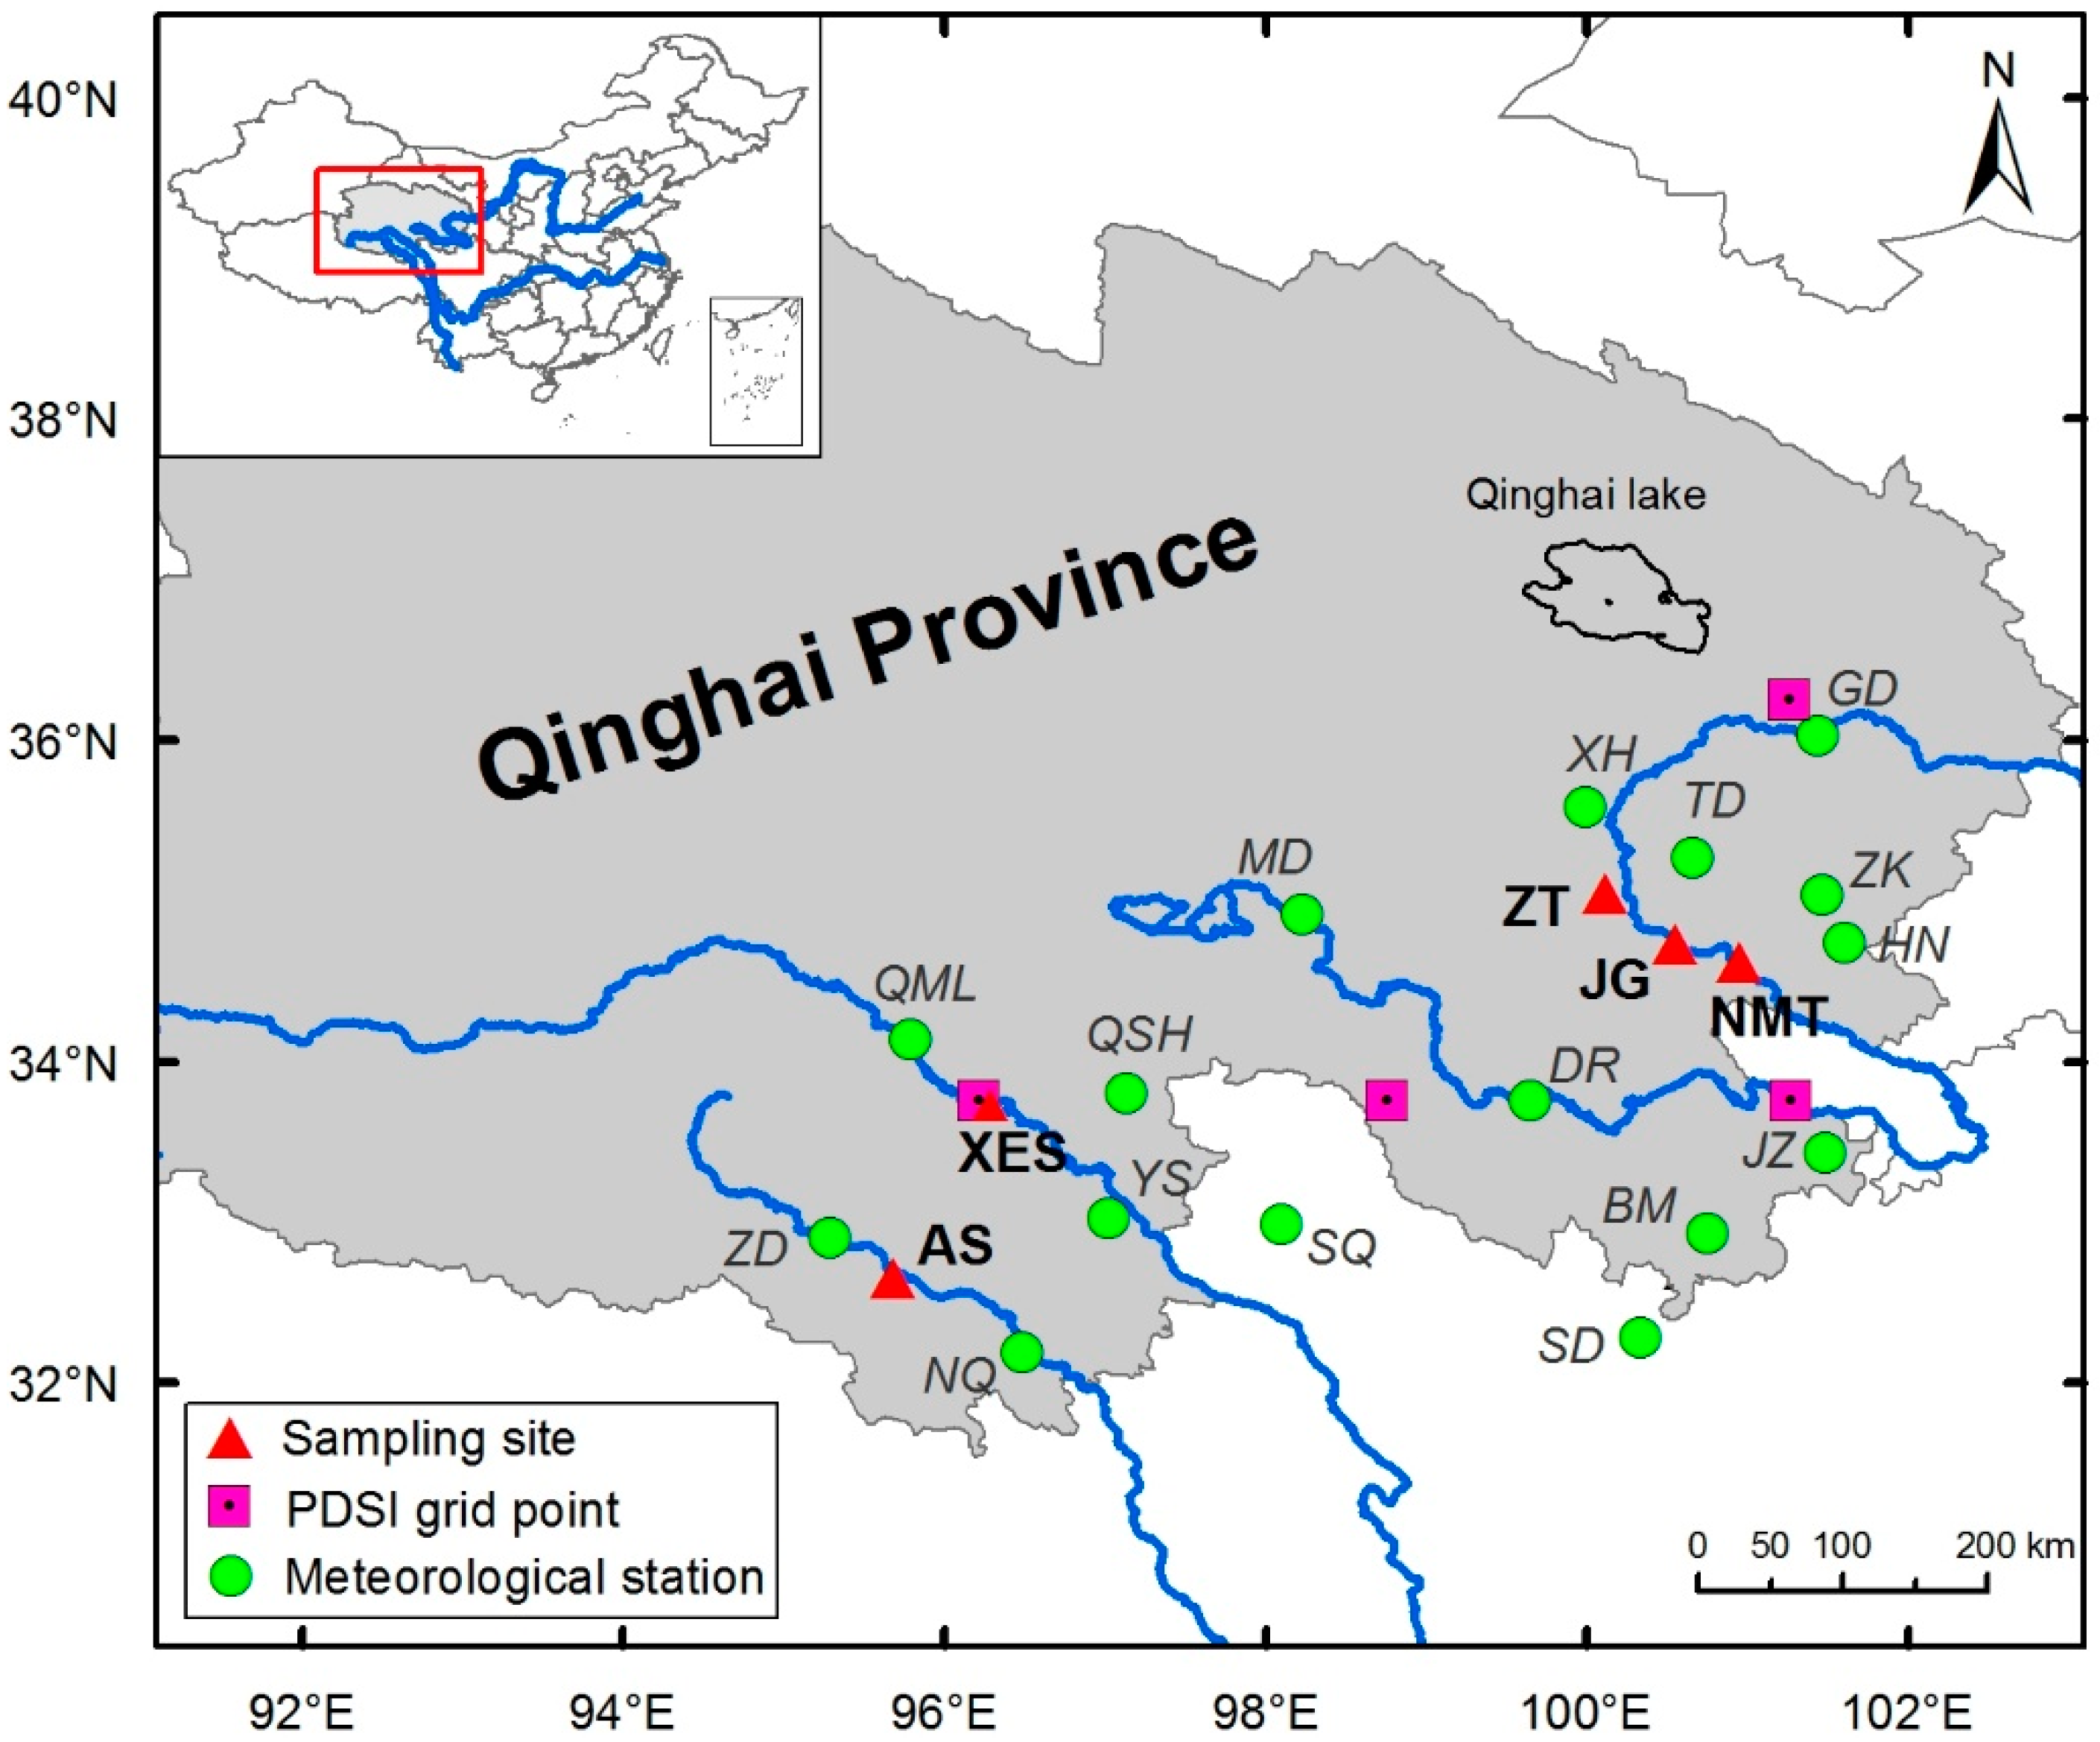
The tree species under study is Qilian juniper (Juniperus przewalskii Kom.), which is the dominant species in natural forests in the TRS-region. It is recognized as a long-lived and climate-sensitive species in previous dendrochronology studies [28]. Sampling was conducted in five sites with relatively less disturbance on Anyemaqen Mountain (Figure 1, Table 1). Increment cores were sampled at breast height from trees that had no sign of obvious rot and damage in the stem. Samples from ZT and NMT were also used for analyses in a separate study [29].
In the laboratory, core samples were prepared following the standard dendrochronological procedures [30]: cores were air-dried, mounted, and glued firmly in grooved wooden bars and sanded with progressively finer sandpaper up to 1000 grit. Increment cores were then measured for annual radial growth to the nearest 0.001 mm, using LINTAB measurement equipment (Frank Rinn, Heidelberg, Germany). The ring-width series were crossdated by visual examination of plotted series, identification of problematic rings under the microscope, and correction of the measured series with the TSAP 4.81 software package. The crossdating was further validated using the program COFECHA. Site chronologies were derived by averaging individually standardized cores using the program ARSTAN [31], which applied a cubic spline with a 50% response frequency cut-off at the half length of the series to preserve high-frequency growth variance while removing age-related growth trends. The early section of chronologies was truncated with the threshold of 0.85 in expressed population signal (EPS) to denote sufficient strength of the signal for use in paleoclimate reconstruction.
Figure 1.
Map showing the locations of tree-ring sampling sites, the nearby meteorological stations, and PDSI grid points developed by Dai et al. (2004) [32] in the northeastern Qinghai-Tibetan Plateau.
Figure 1.
Map showing the locations of tree-ring sampling sites, the nearby meteorological stations, and PDSI grid points developed by Dai et al. (2004) [32] in the northeastern Qinghai-Tibetan Plateau.
2.2. Meteorological Data
The study area is characterized by a continental arid climate, primarily influenced by the Westerlies and Asian Monsoon. Sixteen meteorological stations were selected around the five sampling sites (Figure 1). The multi-year average climatic pattern in the mean monthly temperature and monthly precipitation is similar among these stations, with a common rainy season during the period from June to September (Figure 2). Meteorological data of 10 stations (ZD, NQ, QML, YS, SQ, QSH, DR, MD, XH, and HN), which were nearby the sampling sites selected to compose the regional chronology and covering a common period (1961–2008) as long as possible, were standardized and averaged to illustrate the general climatic characteristics in the study area (Figure 2). Palmer Drought Severity Index (PDSI) data spanning the instrumental period (1955–2005) were extracted from a globally gridded PDSI database [32] for the four relevant grid points (Figure 1). PDSI data for the four grids (35°–37.5° N, 100°–102.5° E and 32.5°–35° N, 95°–102.5° E) were standardized and averaged to represent the regional moisture conditions.
2.3. Methods
Pearson correlation was employed to investigate the nature of the climate–tree growth relationship. These analyses used an 18-month climate window extending from May of the previous year to October of the current growth year. Various multi-month seasons of climate, the averages of temperature/PDSI or totals of precipitation, were also tested. Based on the results of climate–tree growth analyses, a transfer model was developed using a linear regression technique in which the tree ring was the predictor variable and climate was the predictand variable.
Leave-one-out verification was conducted to verify the performance of the transfer model. The criteria used in the verification included Pearson’s correlation coefficient (R), reduction of error (RE), sign test (ST), and product mean test (PMT). RE is a measure of shared variance between actual and estimated series, with a positive value suggesting that the reconstruction is stable and valid [33].
3. Results
3.1. Characteristics of Tree-Ring Width Data
Tree-ring width chronologies were developed for each of the five sampling sites (Table 2, Figure 3). Among these five chronologies, the JG chronology exhibited the highest mean sensitivity (MS) and standard deviation (SD), and showed greater inter-annual and decadal variability than other chronologies (Figure 3). Most of the chronologies had typical autoregressive properties, indicating that the chronologies contained considerable low-frequency variance related to growth conditions and tree physiology [33]. The results of common period analysis in 1901–2000 showed that the chronology JG displayed the highest Rbar, SNR, EPS, and PC1 variance (tree-to-tree common signal), reflecting that tree rings in this site hold the strongest common signals among individual trees. The five site chronologies showed similarity in decadal variability (Figure 3). Relatively low growth was shown during the periods 1741–1757, 1834–1850, 1868–1885, and 1915–1934, and relatively high growth was shown in the period 1650–1666. For most of the sites, tree growth increased in recent decades. Similarity among the five site chronologies was examined by computation of Pearson’s correlation coefficients between each pair of the chronologies (Table 3). Sites XES, NMT, and ZT practically had significantly positive correlations with each of the other sites, respectively.
3.2. Regional Tree-Ring Width Chronology
Figure 4 shows the results of the correlation analysis between the chronology of each site and the monthly PDSI of the neighboring grids for the period 1955–2005. Tree growth of five sites, i.e., ZT, JG, NMT, XES, and AS, had a strong and positive relationship with monthly PDSI, especially for May and June of the growth year. Also, considering the high correlations among these five site chronologies (Table 3), the tree-ring width data of these five sites contained common moisture signals of the study region. Therefore, we pooled together the ring-width data from 168 cores of the five sites to create the regional tree-ring width chronology using the same standardization method as in producing site chronologies (Figure 5). The standard regional chronology that had an EPS > 0.85 was 504 years in length, spanning from 1505 to 2008 AD.
3.3. Relationships between Regional Tree-Ring Width Chronology and Regional Climate
Regional climate data were generated by averaging the observations from 10 weather stations and four PDSI grids covering the spatial distribution of the five tree-ring sites. Figure 6 shows the growth–climate relationship for the regional chronology with monthly mean temperature, precipitation, and PDSI in the TRS-region. At the p < 0.05 level of significance, ring width was negatively correlated with temperature in May, and positively correlated with the precipitation in May and June (r = 0.511, n = 48). A significant positive correlation was found between the temperature in prior October and current July. The tree-ring width showed a significant and positive correlation with PDSI from previous October to current June. The Pearson correlation analysis showed that the tree-ring indices were most strongly correlated with the May–June mean PDSI (r = 0.676, n = 51, p < 0.0001).
3.4. Reconstruction of May–June PDSI
A transfer function was developed by the linear regression model, using May–June PDSI as the dependent variable and the regional tree-ring width chronology as the independent variable. As shown in Table 4, the transfer function, which took the form PDSIM-J = 3.631× RC − 3.521, accounted for 45.7% of the instrumental PDSI variance in May–June over the calibration period (1955–2005). Variation in the reconstructed spring PDSI agreed well with that of the observed series (Figure 7a). Model residuals were reasonably normally distributed and showed low autocorrelation (AR(1) = 0.127, with a non-significant Durbin–Watson statistic). The leave-one-out cross-validation confirmed the good performance of the transfer function (Table 4). The positive value of RE (0.393) indicated the reliability of the derived reconstruction. The results of the ‘sign’ test and product mean test exceeded the 99% confidence level, additionally demonstrating the validity of our regression model [33,34]. Therefore, this model was deemed acceptable and applied to the full chronology.
Spring (May–June) PDSI was reconstructed for the period 1505–2008 AD by applying the regional tree-ring chronology to the transfer function (Figure 7b). The reconstructed PDSI exhibited considerable variations on decadal to multi-decadal timescales, as shown by the 30-year low-pass filter curve. As shown by the 30-year low-pass filter curve, relatively dry periods (below the mean for more than 15 years in succession) occurred during 1582–1631, 1737–1757, 1772–1791, 1869–1891, 1916–1939 and 1952–1982. In contrast, relatively wet intervals (above the mean for more than 15 years in succession) were observed in 1505–1527, 1543–1564, 1712–1736, 1792–1816, 1852–1868, 1892–1915, and 1983–2008.
The frequency of extreme single year events was examined for the past five centuries. Years in which the reconstructed PDSI exceeded ±1.5 standard deviation (SD) were defined as extreme single-year events. The top five severely extreme years were identified in 1953, 1824, 1995, 1749, and 1539 for droughts and in 1989, 1835, 1525, 1800, and 1955 for wetness, respectively, most of which arose in the nineteenth and twentieth centuries. The occurrence of dry extremes became significantly frequent during the last century (11 events in total) relative to the previous four centuries (Figure 8). Standard deviation of the reconstructed PDSI in a 100-year window showed that the last century had apparent high values of standard deviation.
4. Discussion
4.1. Climate–Growth Relationships
Drought stress in May–June appears to be the critical limiting factor for S. przewalskii tree growth in the Anyemaqen Mountains, as indicated by positive correlations with precipitation and negative correlations with temperature (especially for May). The high (low) May temperature could intensify (weaken) evapotranspiration and result in a narrow (wide) ring when precipitation is less abundant. This drought-stress growth pattern during the growing season is widely documented in some dendroclimatological studies of the same species reported earlier on the NE-QTP [35,36,37,38]. It is conceivable that, in the arid and semiarid regions, the arrival of early summer monsoon rainfall in May and June, providing the main water source for tree growth, plays an important role in enhancing earlywood formation [39,40].
4.2. The Characteristics of PDSI Variation in the Recent Century
In the context of the reconstructed PDSI variation for the past 504 years, an evident wetting trend has been observed since the 1950s. However, a much larger amplitude of dry–wet variations was also depicted during the recent century, and particularly drought events became more frequent. It was in basic agreement with the assessments of Zhang et al. (2011) [21], which pointed out that historical drought events became more frequent during the 20th century in China and the Qilian Mountains, respectively. Some previous studies also reported the wetting trend along with increasing interannual variability during recent decades in the Qinghai-Tibetan Plateau [41]. Therefore, it probably suggested a possible link with intensified hydroclimatic activity under the ongoing global warming. This finding was consistent with the results inferred from both observations and modeling [42,43]. The hydroclimate variability was closely associated with internal atmosphere variability, and also significantly dominated by ENSO activity, particularly on the interannual timescale [18,43,44].
4.3. Comparison of Our Reconstruction with Other Records
Our PDSI reconstruction was in good agreement with previous reconstructions of drought variation inferred from tree rings and ice cores on the NE-QTP. We compared our PDSI reconstruction with other chronologies developed from the regions relatively close to our sampling sites. Relatively dry epochs in the 1590s, 1770–1790s, and 1880–1890s were observed as below-average tree growth in the tree ring width chronologies on the NE-QTP [36,45]. The depressive tree growth during the period AD 1815–1824 was also reflected by tree rings in Wulan [35], and the southeastern Tibetan Plateau [46]. In addition, the dry epoch in the 1920s–1930s was widely recorded in the Qinghai-Tibetan Plateau [21], the northwest [47], and north central China [40,48,49]. These correspondences imply that the drought–wetness variation over the NE-QTP in large spatial scale is consistent in low frequency.
Some extreme dry and wet years identified in this study were coincident with a variety of historical records and other tree-ring records. The severe dry years occurred in 1602, 1665, 1785, 1879, 1927, 1942, 1953, and 1960, and severe wet years that occurred in 1904, 1911, and 1943 were validated in the historical archives of drought and flood events in the Yellow River basin (online materials from www.yellowriver.gov.cn). The extreme dry years of 1539, 1749, 1770, 1824, and 1918 were recorded in a historical compendium of Chinese meteorological records developed by Zhang (2004) [50] using various ancient books. A typical severe drought event in 1876–1878 [21,51] was also captured in this PDSI reconstruction on the NE-QTP. Otherwise, the extremely dry year of 1995 was also seen for the PDSI reconstructions of Guiqing and Kongtong Mountain in north China, which corresponded to El Niño [48,52].
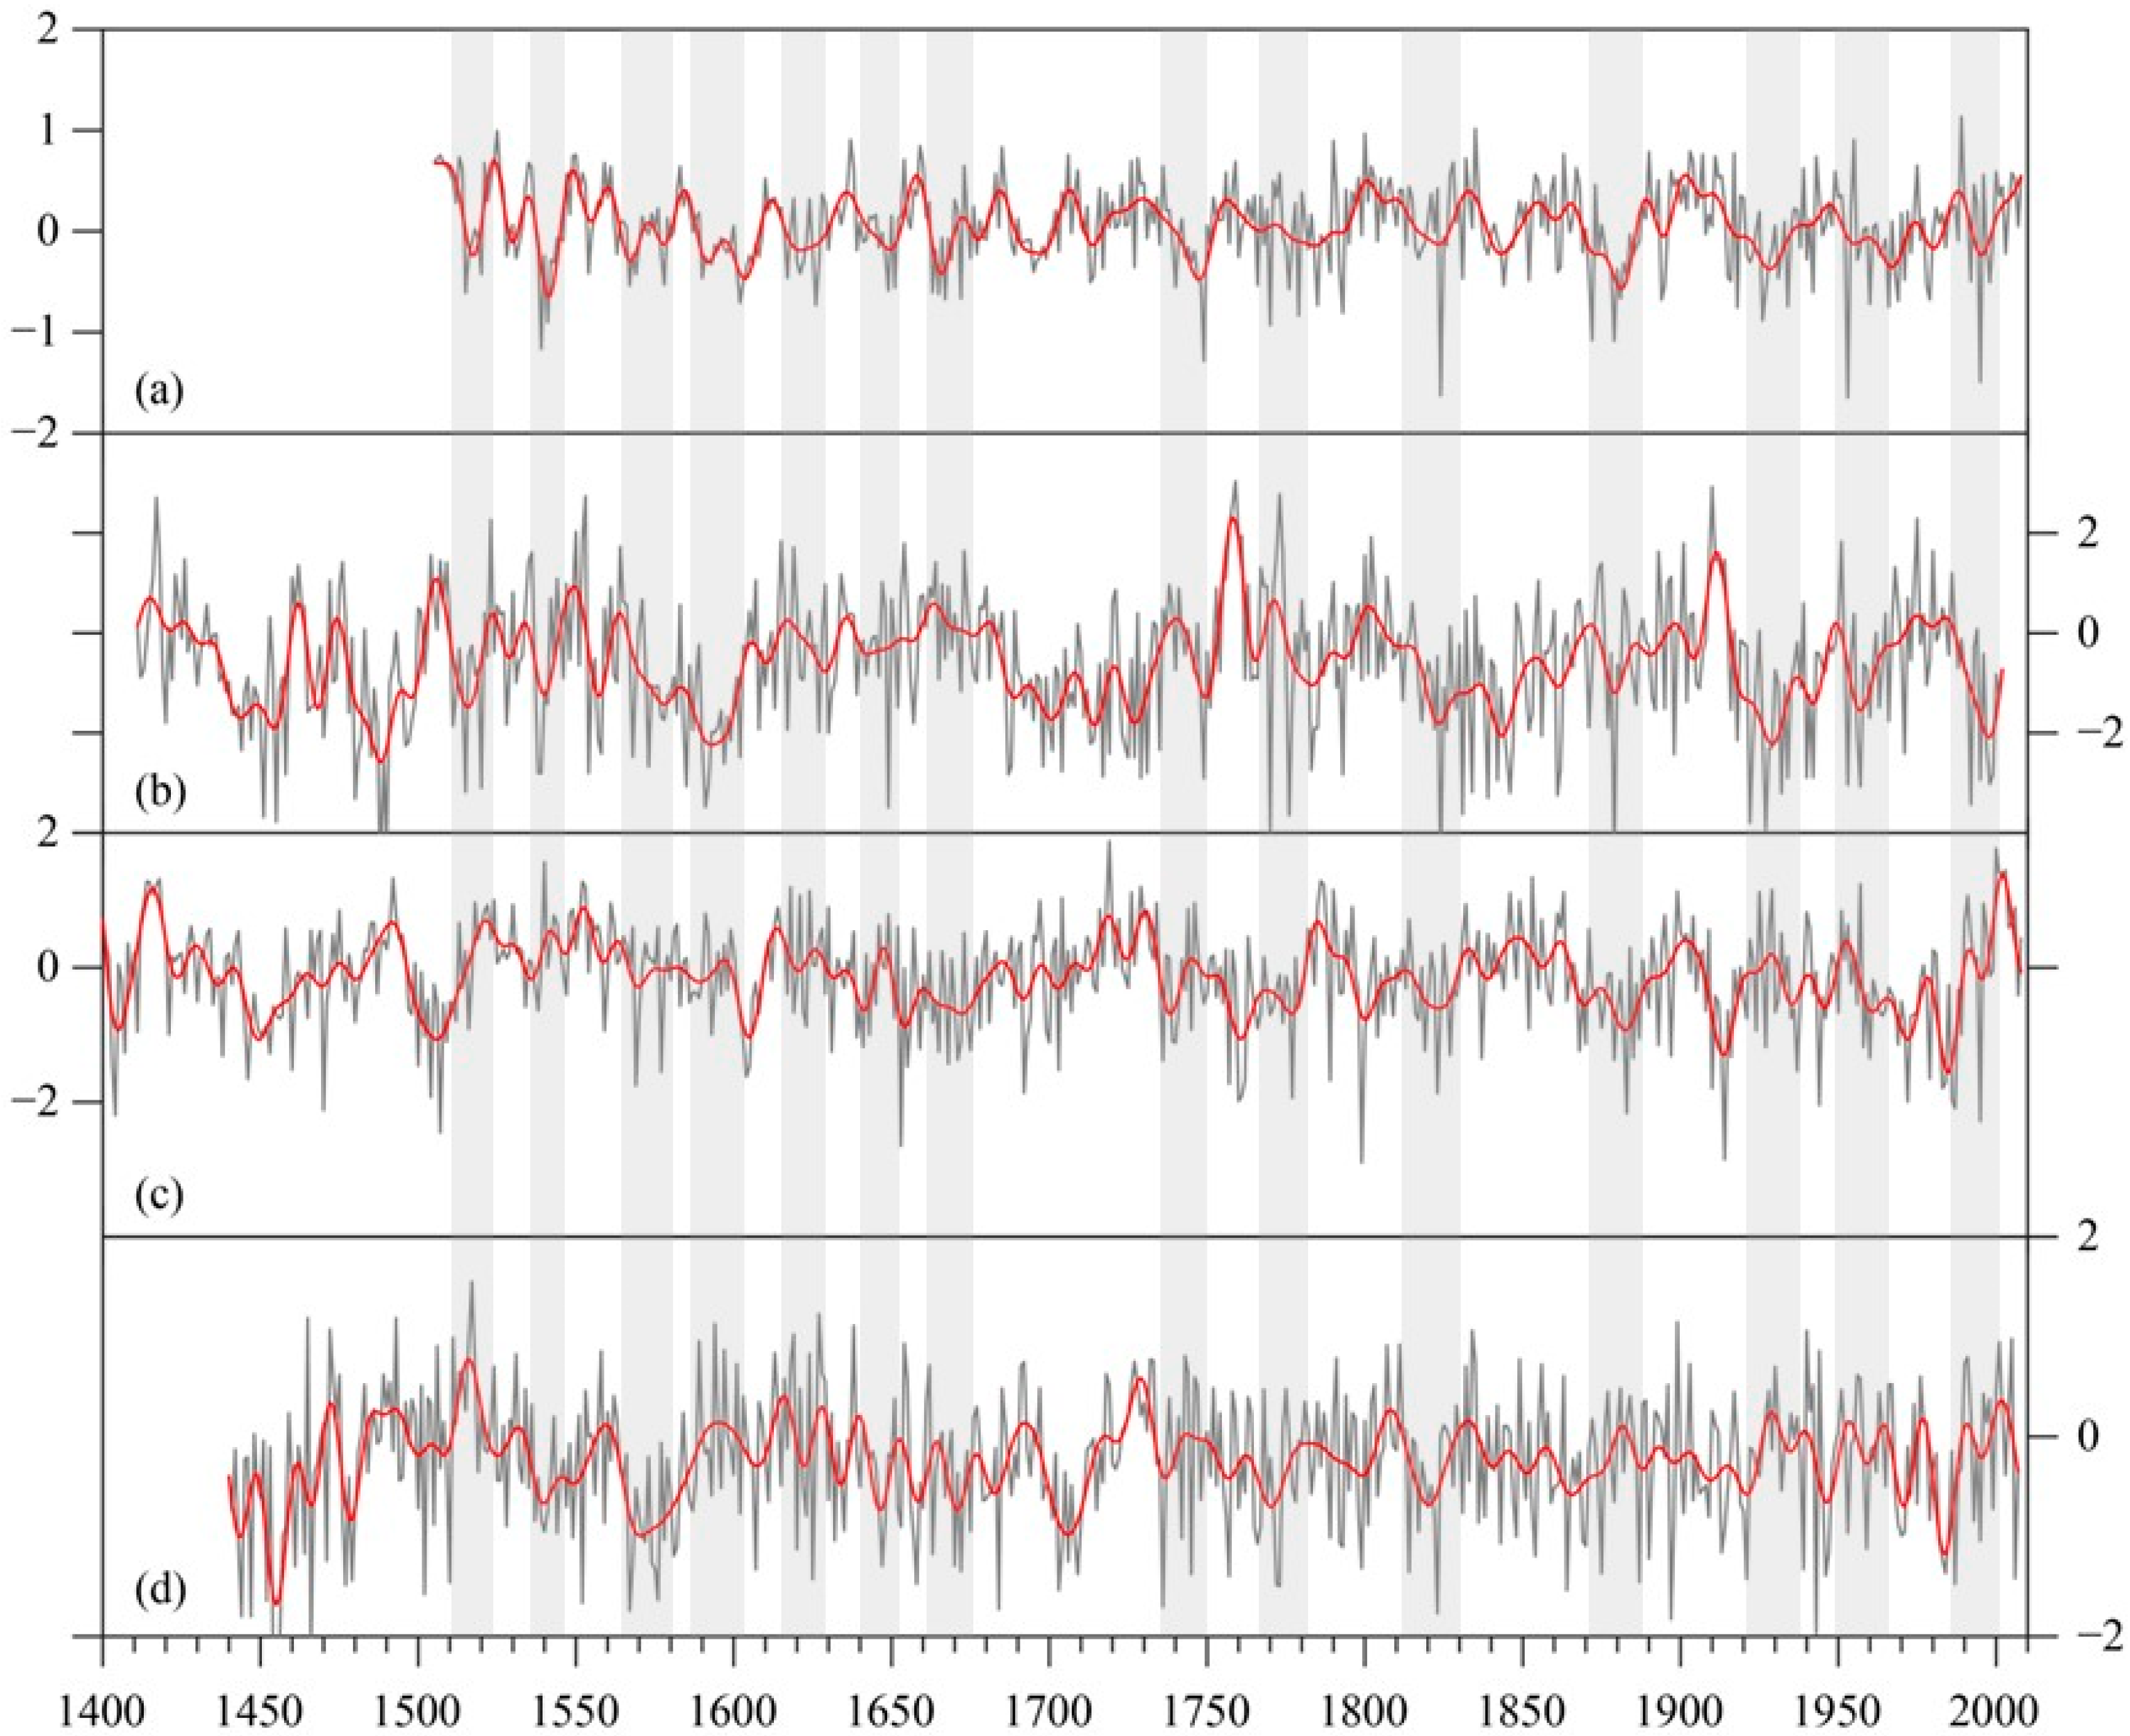
The reconstructed PDSI in this study was compared with other PDSI reconstructions in the northeastern and southeastern Qinghai-Tibetan Plateau (SE-QTP) (Figure 9). Some common dry intervals were shown in the 1530s–1540s, 1560s–1570s, 1620s, 1740s, 1770s, 1810s–1820s and 1870s. However, there were evident differences in the spatial pattern of dry and wet variations during certain periods. For example, after experiencing a dry period in the 1740s, the NE-QTP became wet, but the SE-QTP continued to be dry; after the dry epoch of the 1770s, the NE-QTP became wet, but the SE-QTP continued to be dry. The dry intervals that occurred in our study during the 1510s, 1590s, 1780s, and 1920s, which were consistent on the NE-QTP [21,36,53], corresponded with wet conditions on the SE-QTP [29,44]. These differences reflected the spatial pattern changes of dry and wet signals over this area, which may have been influenced by the strengthening/retreat of climate systems such as the South Asian Monsoon and the mid-latitude Westerlies [29,54].
4.4. Atmospheric Teleconnection
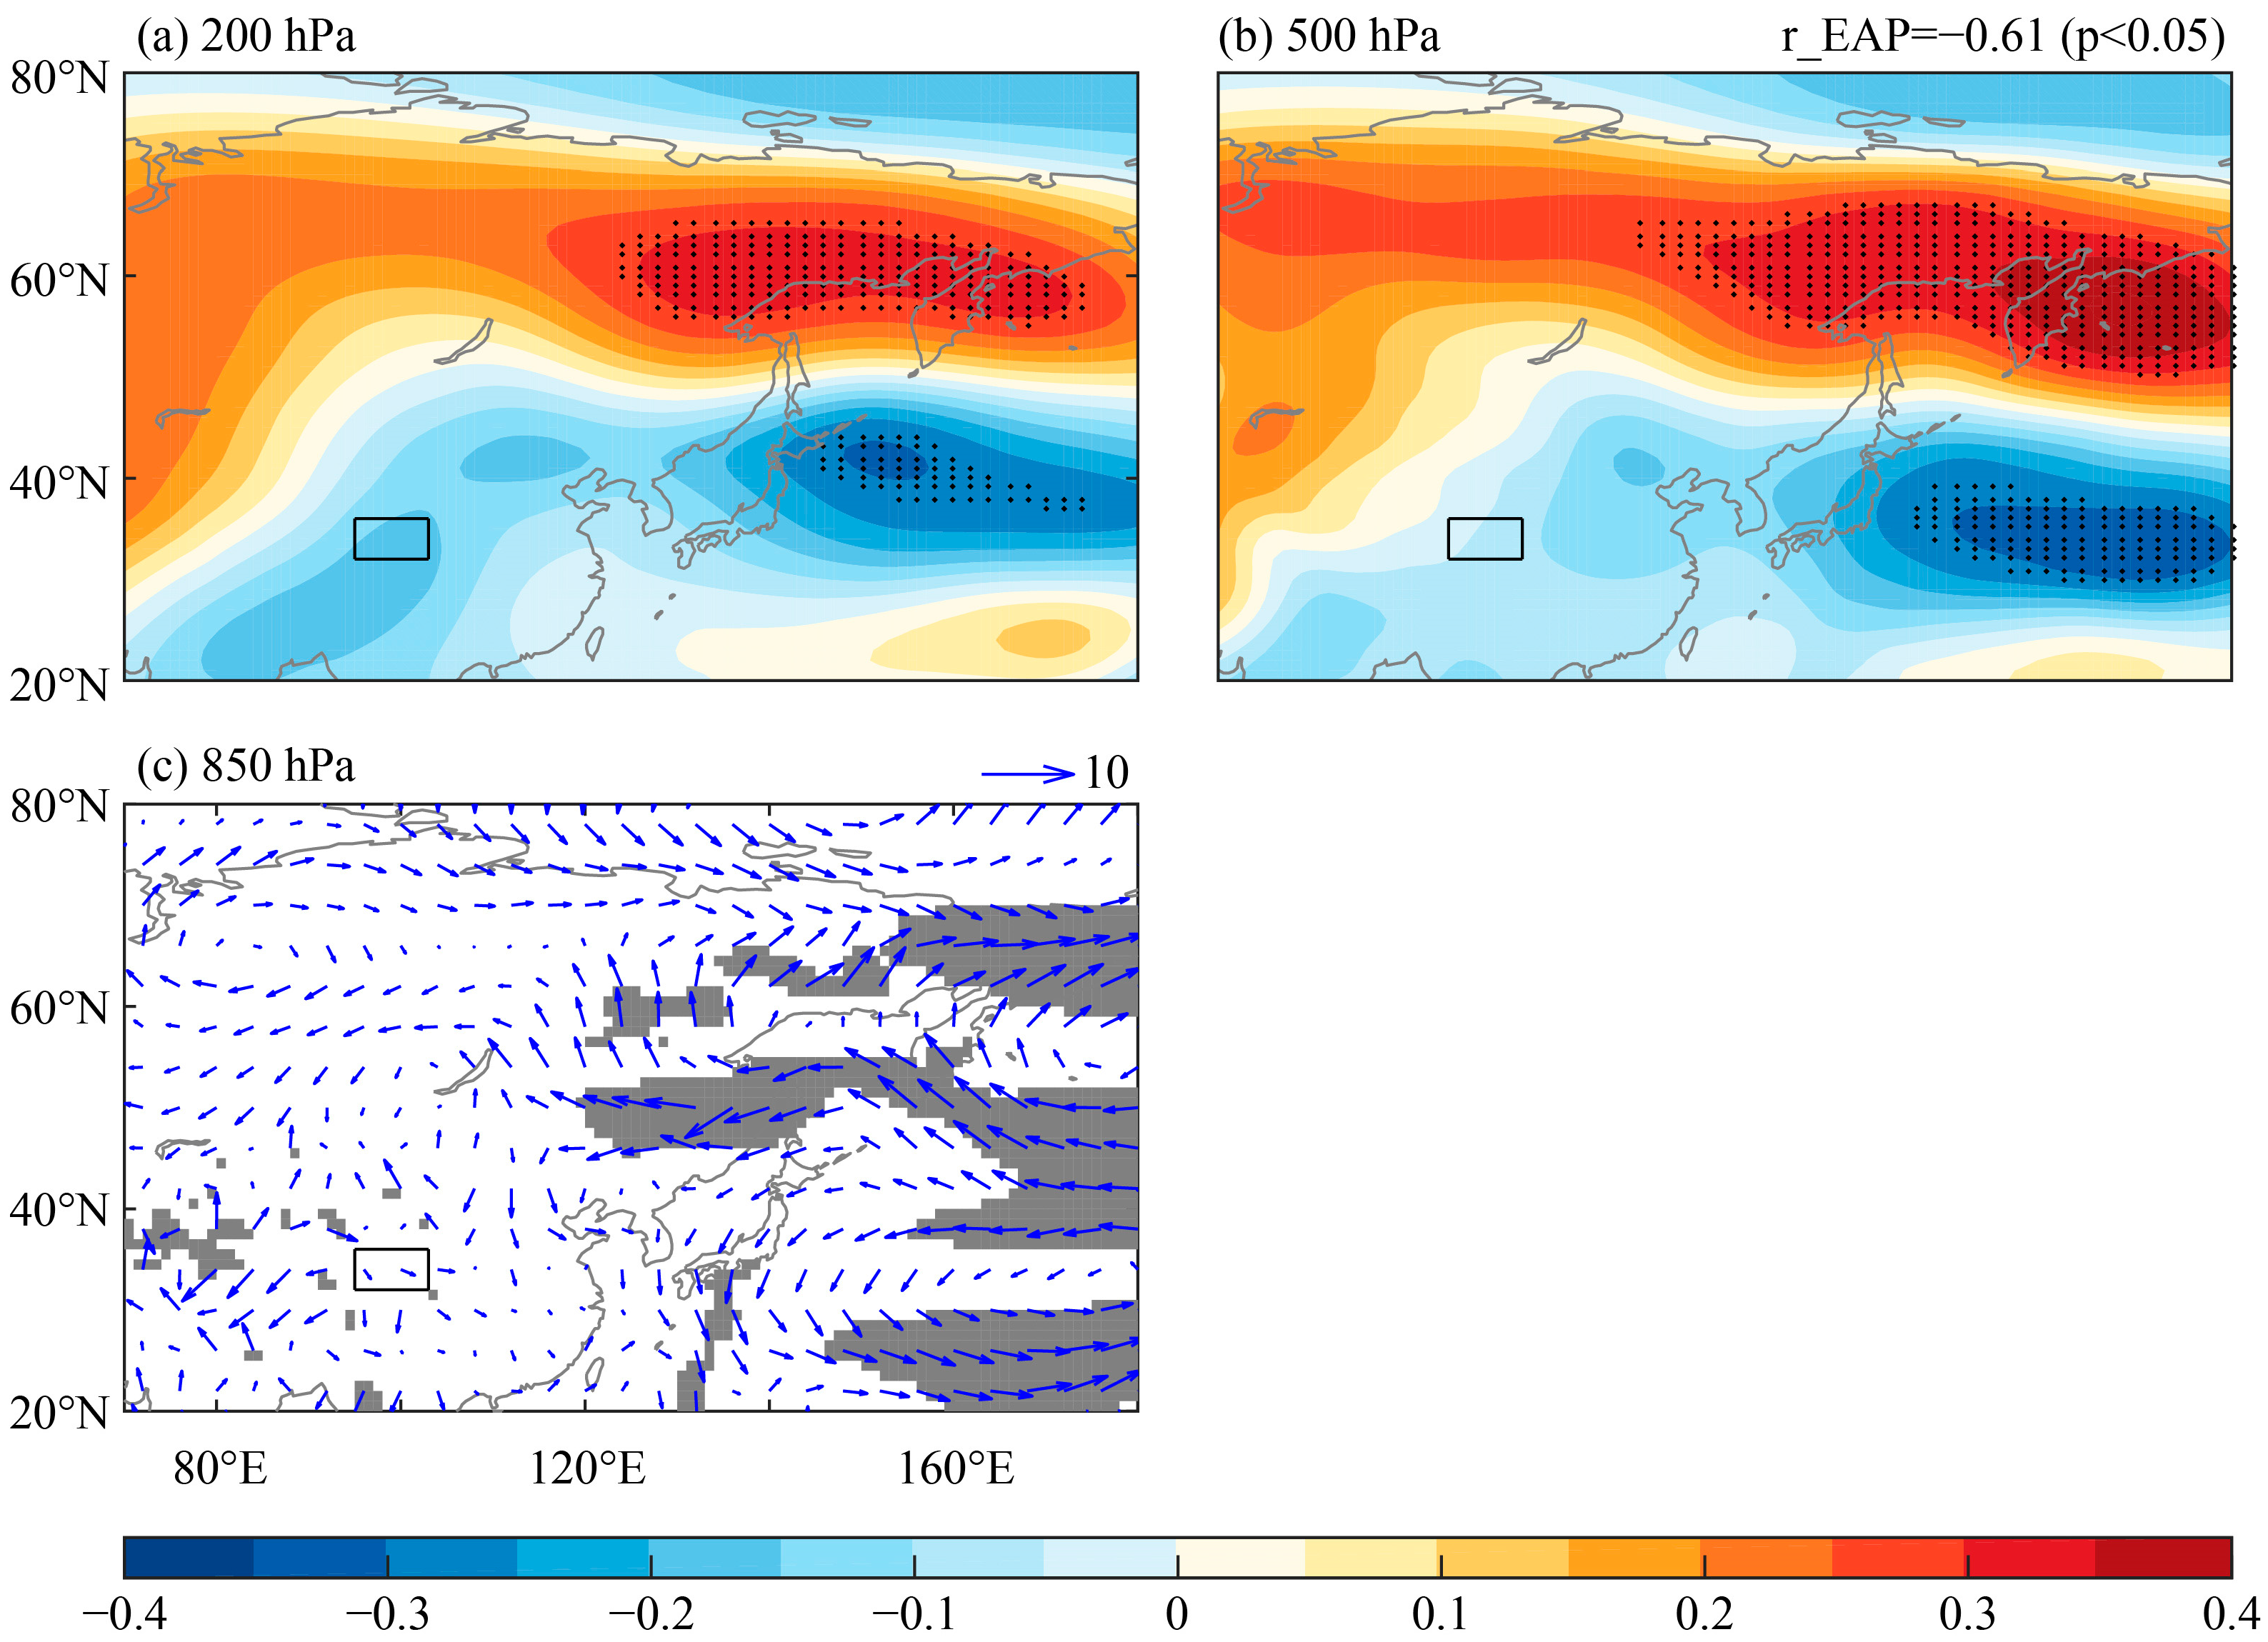
Figure 10 shows the spatial regression patterns between reconstructed PDSI and atmospheric circulation during the period of 1955–2008. From the 200 hPa geopotential height, we found a significant high pressure anomaly center in the North Pacific to eastern Russia, and at the same time a significant low pressure anomaly center in the Central Pacific. The spatial pattern of the anti-phase geopotential height is similar to the East Asian–Pacific (EAP) teleconnection pattern. The EAP teleconnection is a meridional wave train existing in the East Asia monsoon region, which mainly reflects the seesaw relationship of atmospheric pressure systems between the Sea of Okhotsk and the northwest Pacific Ocean [56,57]. The EAP index includes the following two steps. The EOF1 mode is first calculated using the 500 hPa standardized potential height anomalies between 0°–5° N and 100° E–180°. Then, the difference of the two central points between 140° E, 70° N and 130° E, 45° N is determined. In the 500 hPa potential height, we also found an anti-phase spatial pattern between the North and Central Pacific Ocean. The reconstructed mean May–June PDSI in the TRS-region and EAP teleconnection had a high negative correlation (p < 0.05), and the correlation coefficient reached −0.61. In addition, we also analyzed the wind anomalies at the 850 hPa pressure level and found that there were northerlies in eastern China and the eastern edge of the Qinghai Tibet Plateau. Considering the scarcity of water vapor from the boreal, we suggested that due to the influence of negative phase EAP, insufficient water vapor conditions from eastern China to the eastern edge of the Qinghai Tibet Plateau often led to drought, which has been confirmed by Yu et al. (2009) [58]. These results were consistent with the statistical characteristics of more drought events in the reconstructed mean May–June PDSI in the TRS-region shown in Figure 7 and Figure 8. The above-mentioned findings suggested that the hydroclimate in the TRS-region may be influenced by the negative phase EAP teleconnection pattern, leading to water vapor scarcity in the area and triggering drought.
5. Conclusions
Based on the tree-ring width chronologies of the Qilian juniper (Sabina przewalskii Kom.), derived from five sites in the source region of the three great rivers on the NE-QTP, some conclusions can be drawn. Despite the complicated landforms and spatial differences in the local environment and tree growth, it is possible to establish a model using a regional network of tree-ring width chronologies to reflect large-scale drought variation. The strength of the relationship between regional chronology and drought variation highlights the critical importance of spring (May–June) moisture availability to tree growth of Qilian juniper in the NE-QTP. Our reconstruction was in general agreement with previous dendroclimatological studies of the same species in other areas of the Qinghai-Tibetan Plateau, and well reflected the regional drought variability on inter-annual and inter-decadal scales. Notably, in the context of the past five centuries, the study region showed apparent high values of standard deviation and relatively more frequent drought extremes in recent centuries, suggesting an intensified hydroclimatic activity possibly associated with global warming. Through diagnostic analysis of the spatial regression patterns between reconstructed PDSI and atmospheric circulation (e.g., 200 hPa and 500 hPa geopotential height and 850 hPa wind), we inferred the hydroclimate in the TRS-region may be influenced by the negative phase EAP teleconnection pattern, leading to water vapor scarcity in the area and triggering drought.
Author Contributions
Conceptualization: P.X., M.B. and Q.-B.Z.; Software: P.X., M.B. and L.L.; data curation: P.X., M.B. and L.L.; analysis: P.X., M.B. and Q.-B.Z.; writing—original draft: P.X. and M.B.; writing—review and editing: Q.-B.Z. All authors have read and agreed to the published version of the manuscript.
Funding
This study is supported by the National Natural Science Foundation of China projects (No. 41901017, 42305055, and 32271886) and the youth innovation team of China Meteorological Administration (No. CMA2024QN12).
Data Availability Statement
The climate data were obtained from the National Meteorological Information Center, China Meteorological Administration (http://data.cma.cn/).
Acknowledgments
We kindly thank the field work team for sample collection, Hongyan Qiu for assistance in the laboratory and Jianping Duan for helpful discussion.
Conflicts of Interest
The authors declare no conflicts of interest.
References
- Xu, X.; Lu, C.; Shi, X.; Gao, S. World water tower: An atmospheric perspective. Geophys. Res. Lett. 2008, 35, 5. [Google Scholar] [CrossRef]
- Zhao, Z.L.; Zhang, Y.L.; Liu, L.S.; Liu, F.G.; Zhang, H.F. Recent changes in wetlands on the Tibetan Plateau: A review. J. Geogr. Sci. 2015, 25, 879–896. [Google Scholar] [CrossRef]
- Chen, D.J.; Zhong, L.S.; Fan, J.; Yu, H.; Yang, D.; Zeng, Y.X. Evaluation and structural analysis of the functions of the Tibetan Plateau National Park Cluster. J. Geogr. Sci. 2022, 32, 957–980. [Google Scholar] [CrossRef]
- Pan, Y.; Zhu, J.; Zhang, Y.J.; Li, Z.N.; Wu, J.X. Poverty eradication and ecological resource security in development of the Tibetan Plateau. Resour. Conserv. Recycl. 2022, 186, 106552. [Google Scholar] [CrossRef]
- Fan, J.W.; Shao, Q.Q.; Liu, J.Y.; Wang, J.B.; Harris, W.; Chen, Z.Q.; Zhong, H.P.; Xu, X.L.; Liu, R.G. Assessment of effects of climate change and grazing activity on grassland yield in the Three Rivers Headwaters Region of Qinghai-Tibet Plateau, China. Environ. Monit. Assess. 2010, 170, 571–584. [Google Scholar] [CrossRef] [PubMed]
- Bibi, S.; Wang, L.; Li, X.P.; Zhou, J.; Chen, D.L.; Yao, T.D. Climatic and associated cryospheric, biospheric, and hydrological changes on the Tibetan Plateau: A review. Int. J. Climatol. 2018, 38, e1–e17. [Google Scholar] [CrossRef]
- Kuang, X.X.; Jiao, J.J. Review on climate change on the Tibetan Plateau during the last half century. J. Geophys. Res.-Atmos. 2016, 121, 3979–4007. [Google Scholar] [CrossRef]
- Bai, Y.F.; Guo, C.C.; Degen, A.A.; Ahmad, A.A.; Wang, W.Y.; Zhang, T.; Li, W.Y.; Ma, L.; Huang, M.; Zeng, H.J. Climate warming benefits alpine vegetation growth in Three-River Headwater Region, China. Sci. Total Environ. 2020, 742, 140574. [Google Scholar] [CrossRef]
- Feng, A.Q.; Li, Y.Z.; Gao, J.B.; Wu, S.H.; Feng, A.X. The determinants of streamflow variability and variation in Three-River Source of China: Climate change or ecological restoration? Environ. Earth Sci. 2017, 76, 696. [Google Scholar] [CrossRef]
- Jiang, Y.; Li, S.; Shen, D.; Chen, W. Climate change and its impact on the regional environment in the source regions of the Yangtze, Yellow and Lantsang rivers in Qinghai-Tibetan Plateau during 1971–2008. J. Mt. Sci. 2012, 30, 461–469. [Google Scholar]
- Zhou, D.G.; Huang, R.H. Response of water budget to recent climatic changes in the source region of the Yellow River. Chin. Sci. Bull. 2012, 57, 2155–2162. [Google Scholar] [CrossRef]
- Lan, Y.; Zhao, G.; Zhang, Y.; Wen, J.; Liu, J.; Hu, X. Response of runoff in the source region of the Yellow River to climate warming. Quat. Int. 2010, 226, 60–65. [Google Scholar] [CrossRef]
- Zhang, Y.; Zhang, S.; Zhai, X.; Xia, J. Runoff variation and its response to climate change in the Three Rivers Source Region. J. Geog. Sci. 2012, 22, 781–794. [Google Scholar] [CrossRef]
- Xu, W.; Gu, S.; Su, W.; Jiang, S.; Xiao, R.; Xiao, J.; Zhang, J. Spatial pattern and its variations of aridity/humidity during 1971–2010 in Three-River Source Region on the Qinghai-Tibet Plateau. Arid. Land Geogr. 2012, 35, 46–55. (In Chinese) [Google Scholar]
- Ji, P.; Yuan, X. High-resolution land surface modeling of hydrological changes over the Sanjiangyuan region in the eastern Tibetan Plateau: 2. Impact of climate and land cover change. J. Adv. Model. Earth Syst. 2018, 10, 2829–2843. [Google Scholar] [CrossRef]
- Zheng, D.F.; Wang, Y.H.; Hao, S.; Xu, W.J.; Lv, L.T.; Yu, S. Spatial-temporal variation and tradeoffs/synergies analysis on multiple ecosystem services: A case study in the Three -River Headwaters region of China. Ecol. Indic. 2020, 116, 3086. [Google Scholar] [CrossRef]
- Zhao, Q.; Ding, Y.H.; Wang, J.; Gao, H.; Zhang, S.; Zhao, C.; Xu, J.; Han, H.; Shangguan, D. Projecting climate change impacts on hydrological processes on the Tibetan Plateau with model calibration against the glacier inventory data and observed streamflow. J. Hydrol. 2019, 573, 60–81. [Google Scholar] [CrossRef]
- Cook, E.R.; Anchukaitis, K.J.; Buckley, B.M.; D’Arrigo, R.D.; Jacoby, G.C.; Wright, W.E. Asian monsoon failure and megadrought during the last millennium. Science 2010, 328, 486–489. [Google Scholar] [CrossRef] [PubMed]
- Yang, B.; Qin, C.; Wang, J.; He, M.; Melvin, T.M.; Osborn, T.J.; Briffa, K.R. A 3,500-year tree-ring record of annual precipitation on the northeastern Tibetan Plateau. Proc. Natl. Acad. Sci. USA 2014, 111, 2903–2908. [Google Scholar] [CrossRef]
- Yao, T.D.; Duan, K.; Xu, B.; Wang, N.; Guo, X.; Yang, X. Precipitation record since AD 1600 from ice cores on the central Tibetan Plateau. Clim. Past 2008, 4, 175–180. [Google Scholar] [CrossRef]
- Gou, X.H.; Chen, F.H.; Cook, E.; Jacoby, G.; Yang, M.; Li, J. Streamflow variations of the Yellow River over the past 593 years in western China reconstructed from tree rings. Water Resour. Res. 2007, 43, W06434. [Google Scholar] [CrossRef]
- Tian, Q.H.; Zhou, X.J.; Gou, X.H.; Zhao, P.; Fan, Z.X.; Helama, S. Analysis of reconstructed annual precipitation from tree-rings for the past 500 years in the middle Qilian Mountain. Sci. China Earth Sci. 2012, 55, 770–778. [Google Scholar] [CrossRef]
- Ham, Y.G.; Kim, J.H.; Min, S.K.; Kim, D.; Li, T.M.; Timmermann, A.; Stuecker, M.F. Anthropogenic fingerprints in daily precipitation revealed by deep learning. Nature 2023, 622, 301–307. [Google Scholar] [CrossRef] [PubMed]
- Liu, X.H.; Shao, X.M.; Wang, L.L.; Liang, E.; Qin, D.H.; Ren, J.W. Response and dendroclimatic implications of δ13C in tree rings to increasing drought on the northeastern Tibetan Plateau. J. Geophys. Res. Biogeosci. 2008, 113, 11. [Google Scholar] [CrossRef]
- Zhang, Y.; Shao, X.M.; Yin, Z.Y.; Liang, E.Y.; Tian, Q.; Xu, Y. Characteristics of extreme droughts inferred from tree-ring data in the Qilian Mountains, 1700–2005. Clim. Res. 2011, 50, 141–159. [Google Scholar] [CrossRef]
- Shao, X.M.; Huang, L.; Liu, H.B.; Liang, E.Y.; Fang, X.Q.; Wang, L.L. Reconstruction of precipitation variation from tree rings in recent 1000 years in Delingha, Qinghai. Sci. China Earth Sci. 2005, 48, 939–949. [Google Scholar] [CrossRef]
- Liu, J.; Qin, N.S.; Li, J.J.; Zhou, B.; Luo, Y. Characteristics of reconstructed runoff variation and its response to climate change in the source region of Yangtze River from 1374 to 2012. Quat. Sci. 2021, 41, 1683–1696. [Google Scholar]
- Shao, X.M.; Xu, Y.; Yin, Z.Y.; Liang, E.; Zhu, H.; Wang, S. Climatic implications of a 3585-year tree-ring width chronology from the northeastern Qinghai-Tibetan Plateau. Quat. Sci. Rev. 2010, 29, 2111–2122. [Google Scholar] [CrossRef]
- Zhang, Q.B.; Evans, M.N.; Lyu, L. Moisture dipole over the Tibetan Plateau during the past five and a half centuries. Nat. Commun. 2015, 6, 8062. [Google Scholar] [CrossRef]
- Stokes, M.A.; Smiley, T.L. An Introduction to Tree-Ring Dating; University of Arizona Press: Tucson, AZ, USA, 1996. [Google Scholar]
- Cook, E.R. A Time Series Analysis Approach to Tree-Ring Standardization. Ph.D. Dissertation, University of Arizona, Tucson, AZ, USA, 1985. [Google Scholar]
- Dai, A.G.; Trenberth, K.E.; Qian, T. A global dataset of palmer drought severity index for 1870–2002: Relationship with soil moisture and effects of surface warming. J. Hydrometeorol. 2004, 5, 1117–1130. [Google Scholar] [CrossRef]
- Cook, E.R.; Briffa, K.R.; Jones, P.D. Spatial regression methods in dendroclimatology: A review and comparison of two techniques. Int. J. Climatol. 1994, 14, 379–402. [Google Scholar] [CrossRef]
- Fritts, H.C. Tree Rings and Climate; Academic Press: New York, NY, USA, 1976. [Google Scholar]
- Huang, J.G.; Zhang, Q.B. Tree rings and climate for the last 680 years in Wulan area of northeastern Qinghai-Tibetan Plateau. Clim. Chang. 2007, 80, 369–377. [Google Scholar] [CrossRef]
- Li, J.; Cook, E.R.; D’Arrigo, R.; Chen, F.; Gou, X.; Peng, J.; Huang, J. Common tree growth anomalies over the northeastern Tibetan Plateau during the last six centuries: Implications for regional moisture change. Global. Chang. Biol. 2008, 14, 2096–2107. [Google Scholar] [CrossRef]
- Yin, Z.Y.; Shao, X.M.; Qin, N.S.; Liang, E.Y. Reconstruction of a 1436-year soil moisture and vegetation water use history based on tree-ring widths from Qilian junipers in northeastern Qaidam Basin, northwestern China. Int. J. Climatol. 2008, 28, 37–53. [Google Scholar] [CrossRef]
- Zhang, Y.; Shao, X.M.; Xu, Y.; Wilmking, M. Process-based modeling analyses of Sabina przewalskii growth response to climate factors around the northeastern Qaidam Basin. Chin. Sci. Bull. 2011, 56, 1518–1525. [Google Scholar] [CrossRef]
- Ding, Y.H.; Sun, Y.; Wang, Z.Y.; Zhu, Y.X.; Song, Y.F. Inter-decadal variation of the summer precipitation in China and its association with decreasing Asian summer monsoon Part II: Possible causes. Int. J. Climatol. 2009, 29, 1926–1944. [Google Scholar] [CrossRef]
- Fang, K.Y.; Gou, X.H.; Chen, F.H.; Frank, D.; Liu, C.; Li, J.B.; Kazmer, M. Precipitation variability during the past 400 years in the Xiaolong Mountain (central China) inferred from tree rings. Clim. Dynam. 2012, 39, 1697–1707. [Google Scholar] [CrossRef]
- Xiong, J.N.; Yong, Z.W.; Wang, Z.G.; Cheng, W.M.; Li, Y.; Zhang, H.; Ye, C.C.; Yang, Y.M. Spatial and Temporal Patterns of the Extreme Precipitation across the Tibetan Plateau (1986–2015). Water 2019, 11, 1453. [Google Scholar] [CrossRef]
- IPCC. Climate Change 2013: The Physical Science Basis. Contribution of Working Group I to the Fifth Assessment Report of the Intergovernmental Panel on Climate Change; Cambridge University Press: Cambridge, UK, 2013. [Google Scholar]
- Seager, R.; Naik, N.; Vogel, L. Does global warming cause intensified interannual hydroclimate variability? J. Clim. 2012, 25, 3355–3372. [Google Scholar] [CrossRef]
- Fang, K.Y.; Gou, X.H.; Chen, F.H.; Li, J.B.; D’Arrigo, R.; Cook, E.; Yang, T.; Davi, N. Reconstructed droughts for the southeastern Tibetan Plateau over the past 568 years and its linkages to the Pacific and Atlantic Ocean climate variability. Clim. Dynam. 2010, 35, 577–585. [Google Scholar] [CrossRef]
- Gou, X.H.; Chen, F.H.; Jacoby, G.; Cook, E.; Yang, M.X.; Peng, H.F.; Zhang, Y. Rapid tree growth with respect to the last 400 years in response to climate warming, northeastern Tibetan Plateau. Int. J. Climatol. 2007, 27, 1497–1503. [Google Scholar] [CrossRef]
- Liang, E.Y.; Shao, X.M.; Xu, Y. Tree-ring evidence of recent abnormal warming on the southeast Tibetan Plateau. Theor. Appl. Climatol. 2009, 98, 9–18. [Google Scholar] [CrossRef]
- Fang, K.Y.; Gou, X.H.; Chen, F.H.; Cook, E.; Li, J.B.; Buckley, B.; D’Arrigo, R. Large-scale precipitation variability over northwest China inferred from tree rings. J. Clim. 2011, 24, 3457–3468. [Google Scholar] [CrossRef]
- Fang, K.Y.; Davi, N.; Gou, X.H.; Chen, F.H.; Cook, E.; Li, J.B.; D’Arrigo, R. Spatial drought reconstructions for central High Asia based on tree rings. Clim. Dynam. 2010, 35, 941–951. [Google Scholar] [CrossRef]
- Fang, K.Y.; Gou, X.H.; Chen, F.H.; Liu, C.Z.; Davi, N.; Li, J.B.; Zhao, Z.Q.; Li, Y.J. Tree-ring based reconstruction of drought variability (1615–2009) in the Kongtong Mountain area, northern China. Glob. Planet. Chang. 2012, 80, 190–197. [Google Scholar] [CrossRef]
- Zhang, D.E. A Compendium of Chinese Meteorological Records of the Last 3000 Years; Jiangsu Education Press: Nanjing, China, 2004; p. 366. [Google Scholar]
- Zhang, D.E.; Liang, Y. A long lasting and extensive drought event over China during 1876–1878. Adv. Clim. Chang. Res. 2010, 6, 106–112. [Google Scholar]
- Fang, K.Y.; Gou, X.H.; Chen, F.H.; D’Arrigo, R.; Li, J.B. Tree-ring based drought reconstruction for the Guiqing Mountain (China): Linkages to the Indian and Pacific Oceans. Int. J. Climatol. 2010, 30, 1137–1145. [Google Scholar] [CrossRef]
- Peng, J.F.; Liu, Y.Z. Reconstructed droughts for the northeastern Tibetan Plateau since AD 1411 and its linkages to the Pacific, Indian and Atlantic Oceans. Quat. Int. 2013, 283, 98–106. [Google Scholar] [CrossRef]
- Tian, L.D.; Masson-Delmotte, V.; Stievenard, M.; Yao, T.D.; Jouzel, J. Tibetan Plateau summer monsoon northward extent revealed by measurements of water stable isotopes. J. Geophys. Res. Atmos. 2001, 106, 28081–28088. [Google Scholar] [CrossRef]
- Wang, J.L.; Yang, B.; Ljungqvist, F.C. Moisture and Temperature Covariability over the Southeastern Tibetan Plateau during the Past Nine Centuries. J. Clim. 2020, 33, 6583–6598. [Google Scholar] [CrossRef]
- Wang, J.B.; Wen, Z.P.; Wu, R.G.; Guo, Y.Y.; Chen, Z.S. The mechanism of growth of the low-frequency East Asia-Pacific teleconnection and the triggering role of tropical intraseasonal oscillation. Clim. Dynam. 2016, 46, 3965–3977. [Google Scholar] [CrossRef]
- Ling, S.N.; Lu, R.Y. Tropical Cyclones over the Western North Pacific Strengthen the East Asia-Pacific Pattern during Summer. Adv. Atmos. Sci. 2022, 39, 249–259. [Google Scholar] [CrossRef]
- Yu, S.Q.; Shi, X.H.; Lin, X.C. Interannual variation of East Asian summer monsoon and its impacts on general circulation and precipitation. J. Geogr. Sci. 2009, 19, 67–80. [Google Scholar] [CrossRef]
Figure 2.
Temperature and precipitation of the regional climate based on the 10 meteorological stations surrounding the sampling sites for the period 1961–2008 in the northeastern Qinghai-Tibetan Plateau.
Figure 2.
Temperature and precipitation of the regional climate based on the 10 meteorological stations surrounding the sampling sites for the period 1961–2008 in the northeastern Qinghai-Tibetan Plateau.

Figure 3.
Tree-ring width chronologies of Juniperus przewalskii Kom. for each site in the northeastern Qinghai-Tibetan Plateau. The superimposed blue line is the 11-year running average. All series were truncated with the threshold of 0.85 in EPS.
Figure 3.
Tree-ring width chronologies of Juniperus przewalskii Kom. for each site in the northeastern Qinghai-Tibetan Plateau. The superimposed blue line is the 11-year running average. All series were truncated with the threshold of 0.85 in EPS.
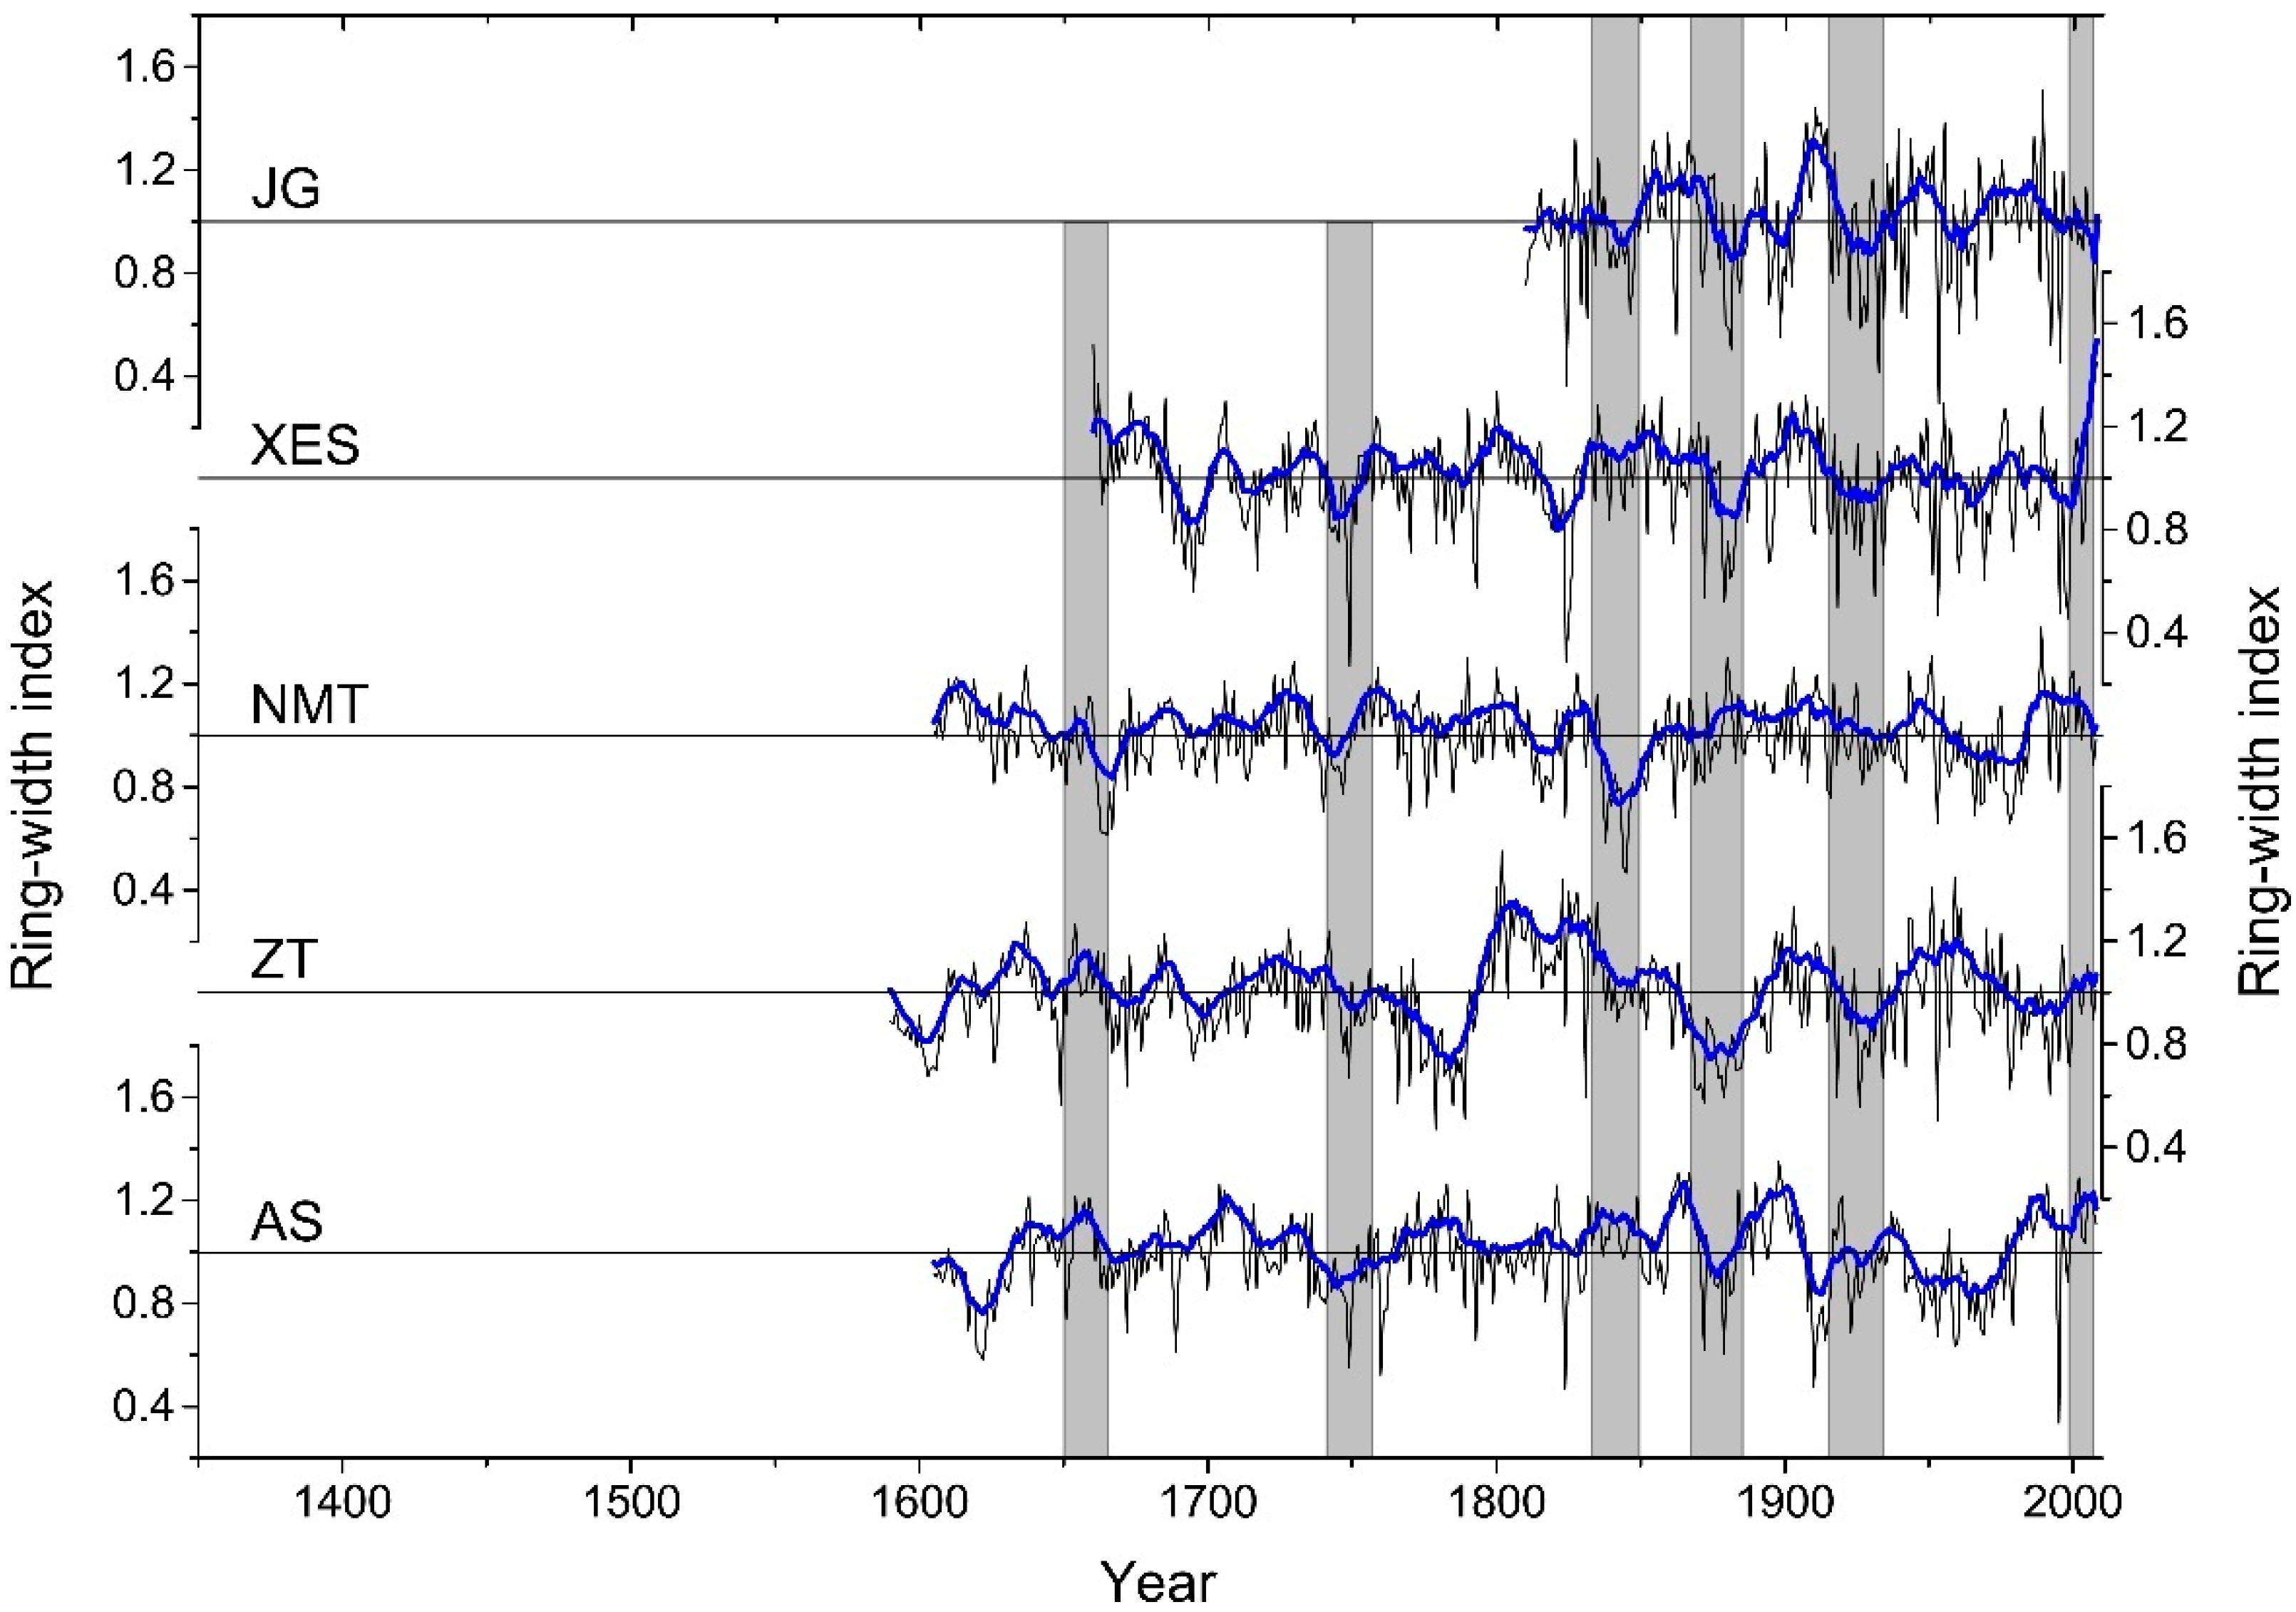
Figure 4.
Correlation analysis between the chronology of each site and monthly PDSI of the neighboring grid point for the period 1955–2005. The size of the solid circle represents the magnitude of positive correlation coefficient. The shaded area indicates significance at p < 0.05 level, and “pJul” means July in the previous year.
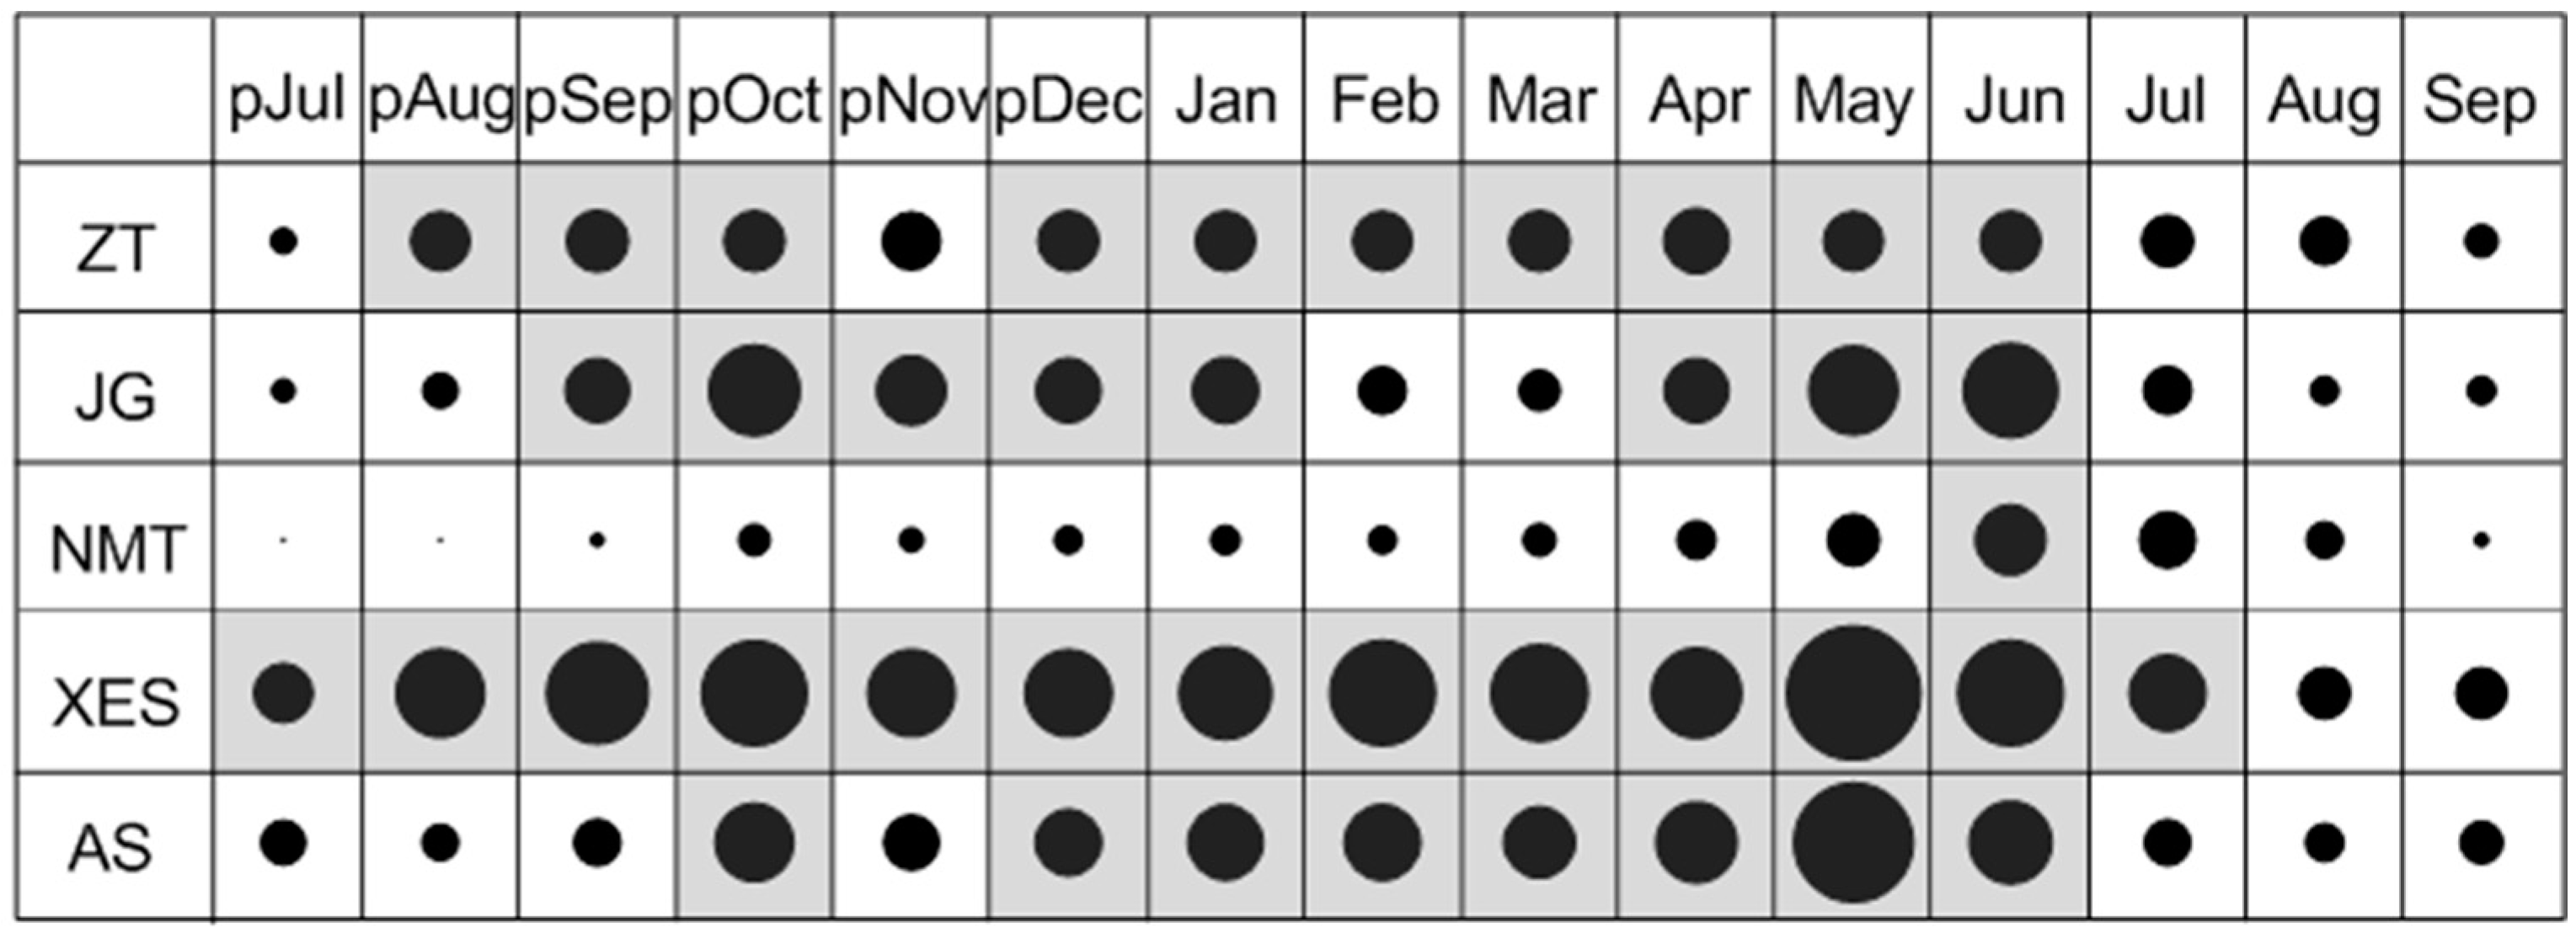
Figure 5.
Regional tree-ring width chronology of Juniperus przewalskii Kom.and the sample replication in the northeastern Qinghai-Tibetan Plateau. The arrow denotes the year with EPS > 0.85.
Figure 5.
Regional tree-ring width chronology of Juniperus przewalskii Kom.and the sample replication in the northeastern Qinghai-Tibetan Plateau. The arrow denotes the year with EPS > 0.85.

Figure 6.
Correlation coefficients between the regional chronology and climate records (temperature and precipitation averaged from a composite of 10 nearby meteorological stations, and PDSI data averaged from the four relevant grid points) from previous May to current October over the period 1961–2008 (time span 1955–2005 for PDSI). The horizontal dashed lines denote the 95% significance levels; “pM” means May in the previous year; “MJ” means May to June.

Figure 7.
(a) Comparison between observed and reconstructed mean May–June PDSI for their common period 1955–2005. (b) Reconstruction of May–June PDSI from tree-ring width in the northeastern Qinghai-Tibetan Plateau. Superimposed on the reconstruction is a 30-year low-pass filter. The blue and red bars correspond to extreme wet/dry years (exceeding mean ± 1.5 SD), and the shaded area is the 95% confidence interval.
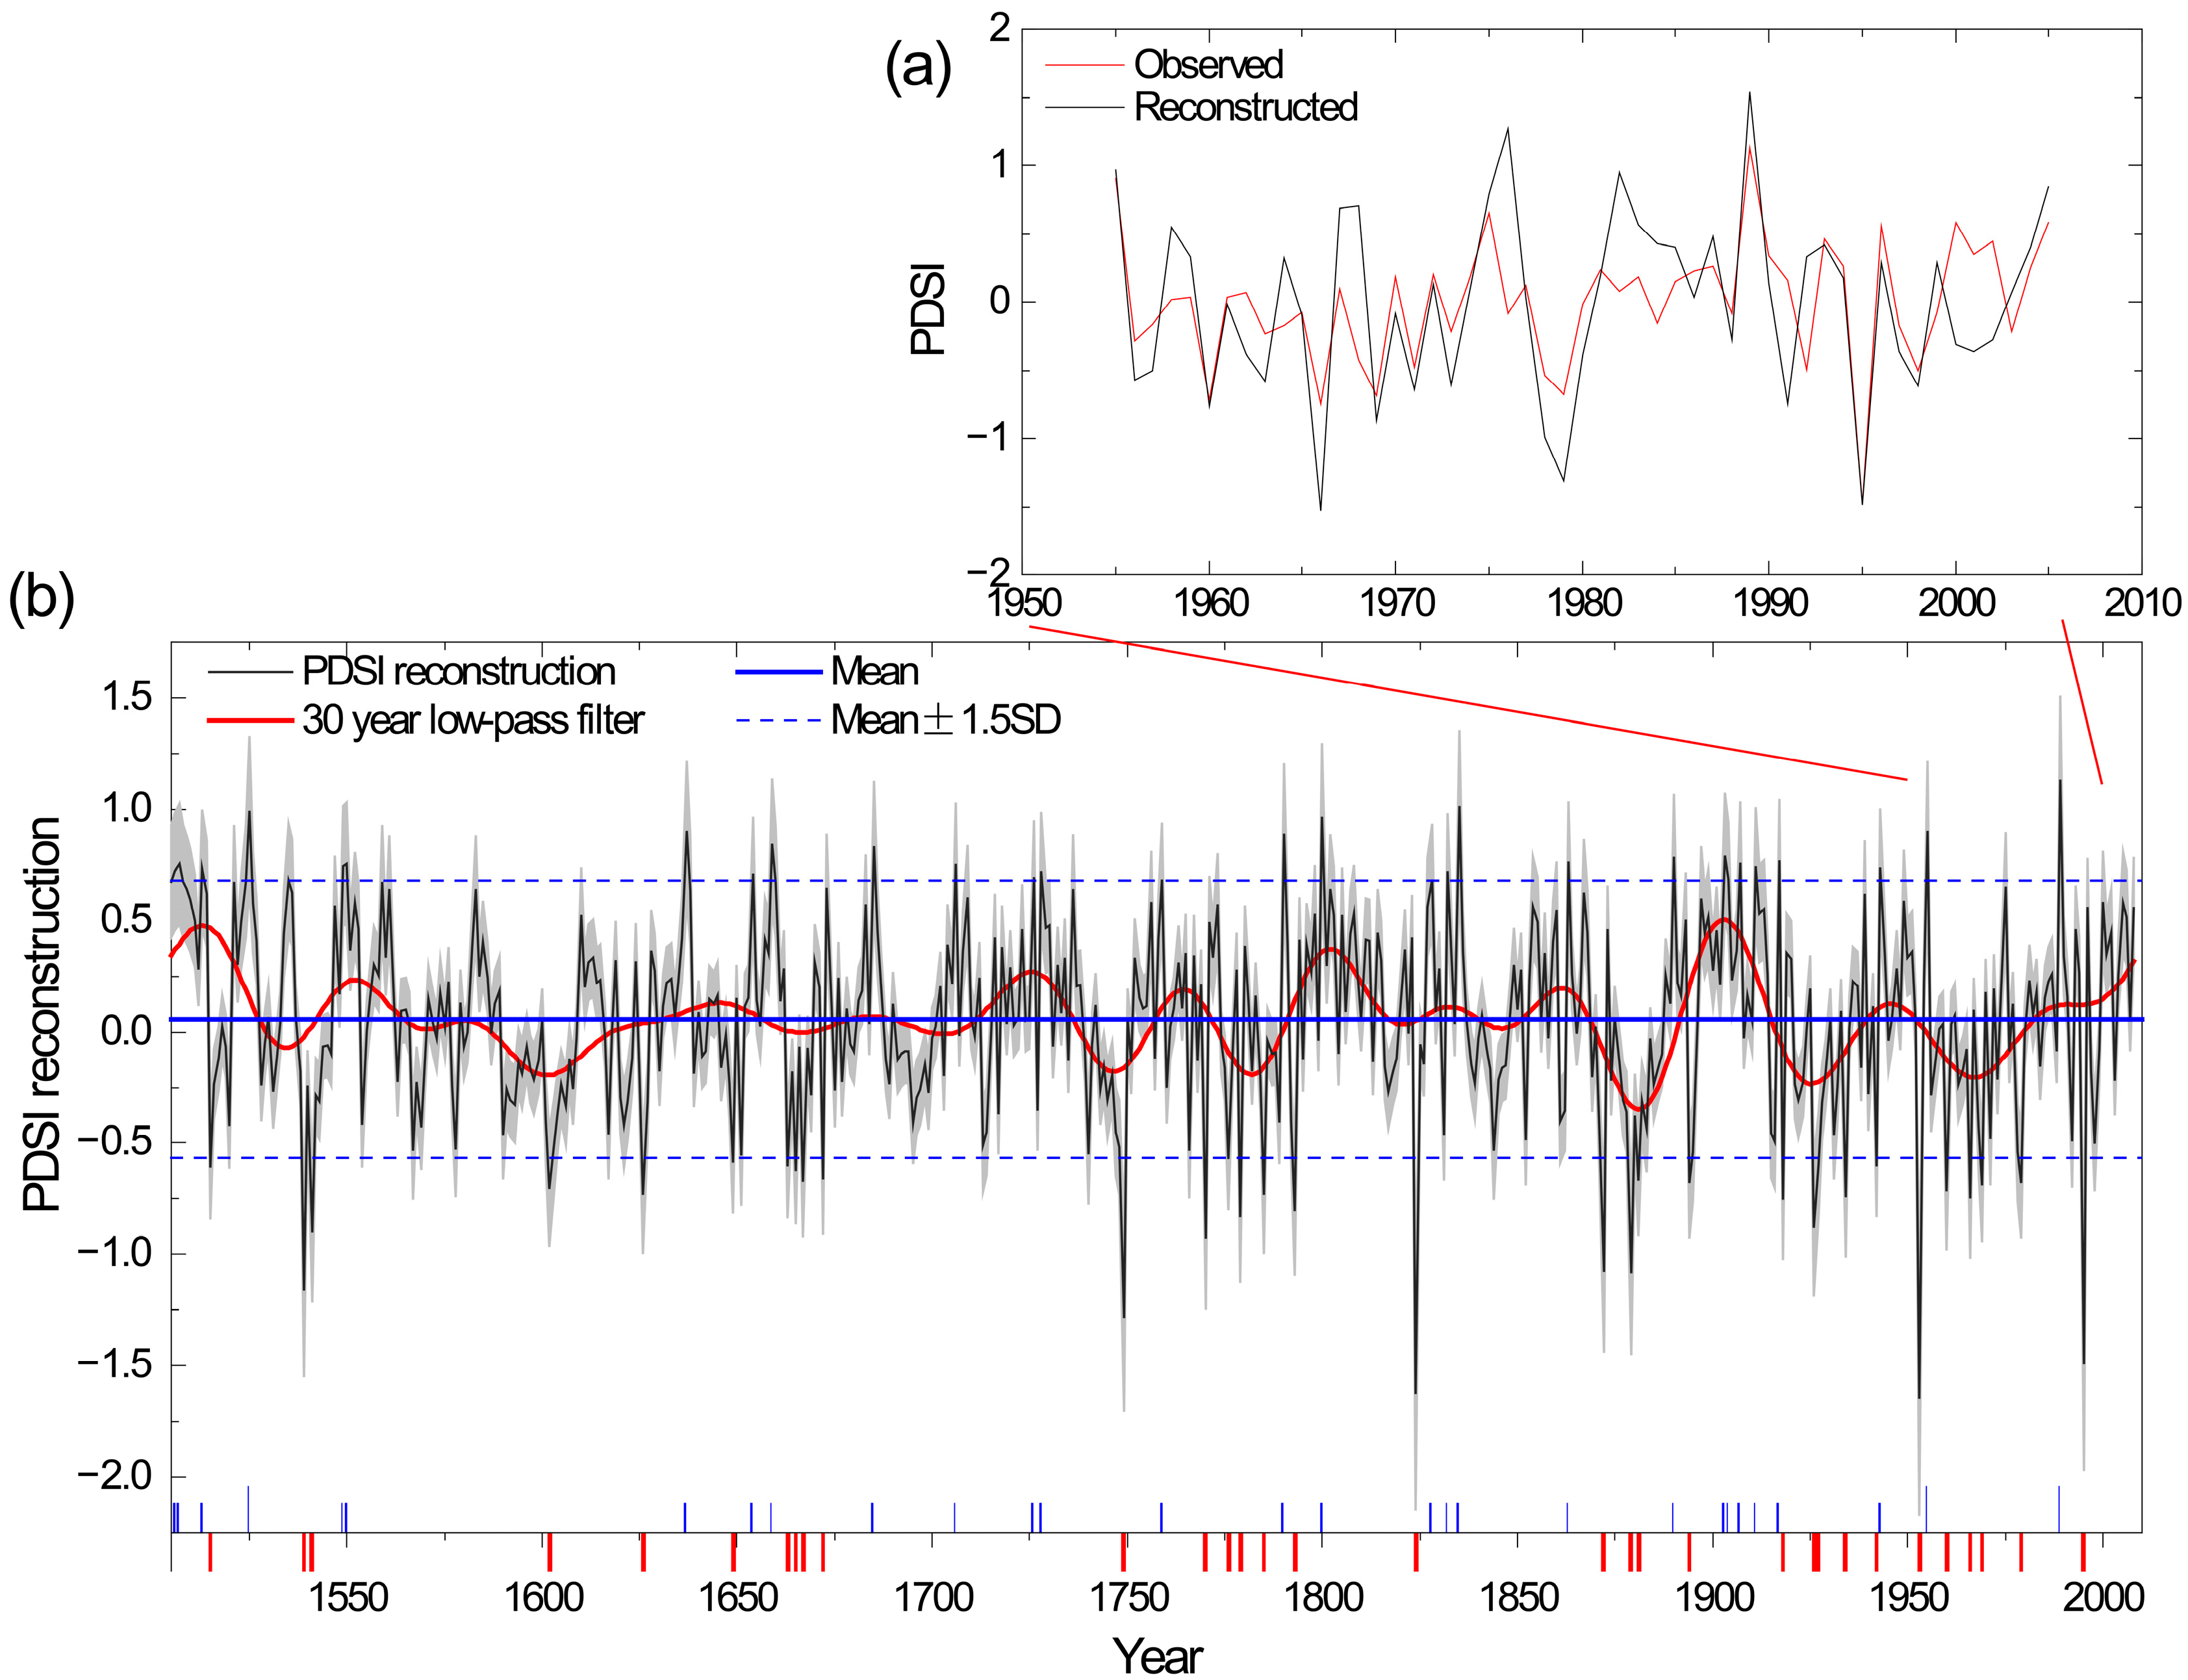
Figure 8.
(a) Box-whisker plot: distribution of the standard deviation for each 100 years based on bootstrap sampling (N = 5000). The ends of the whiskers represent the 5th percentile and the 95th percentile. (b) Bar chart: the counts of dry (red bar) and wet (blue bar) extremes for each 100 years.
Figure 8.
(a) Box-whisker plot: distribution of the standard deviation for each 100 years based on bootstrap sampling (N = 5000). The ends of the whiskers represent the 5th percentile and the 95th percentile. (b) Bar chart: the counts of dry (red bar) and wet (blue bar) extremes for each 100 years.
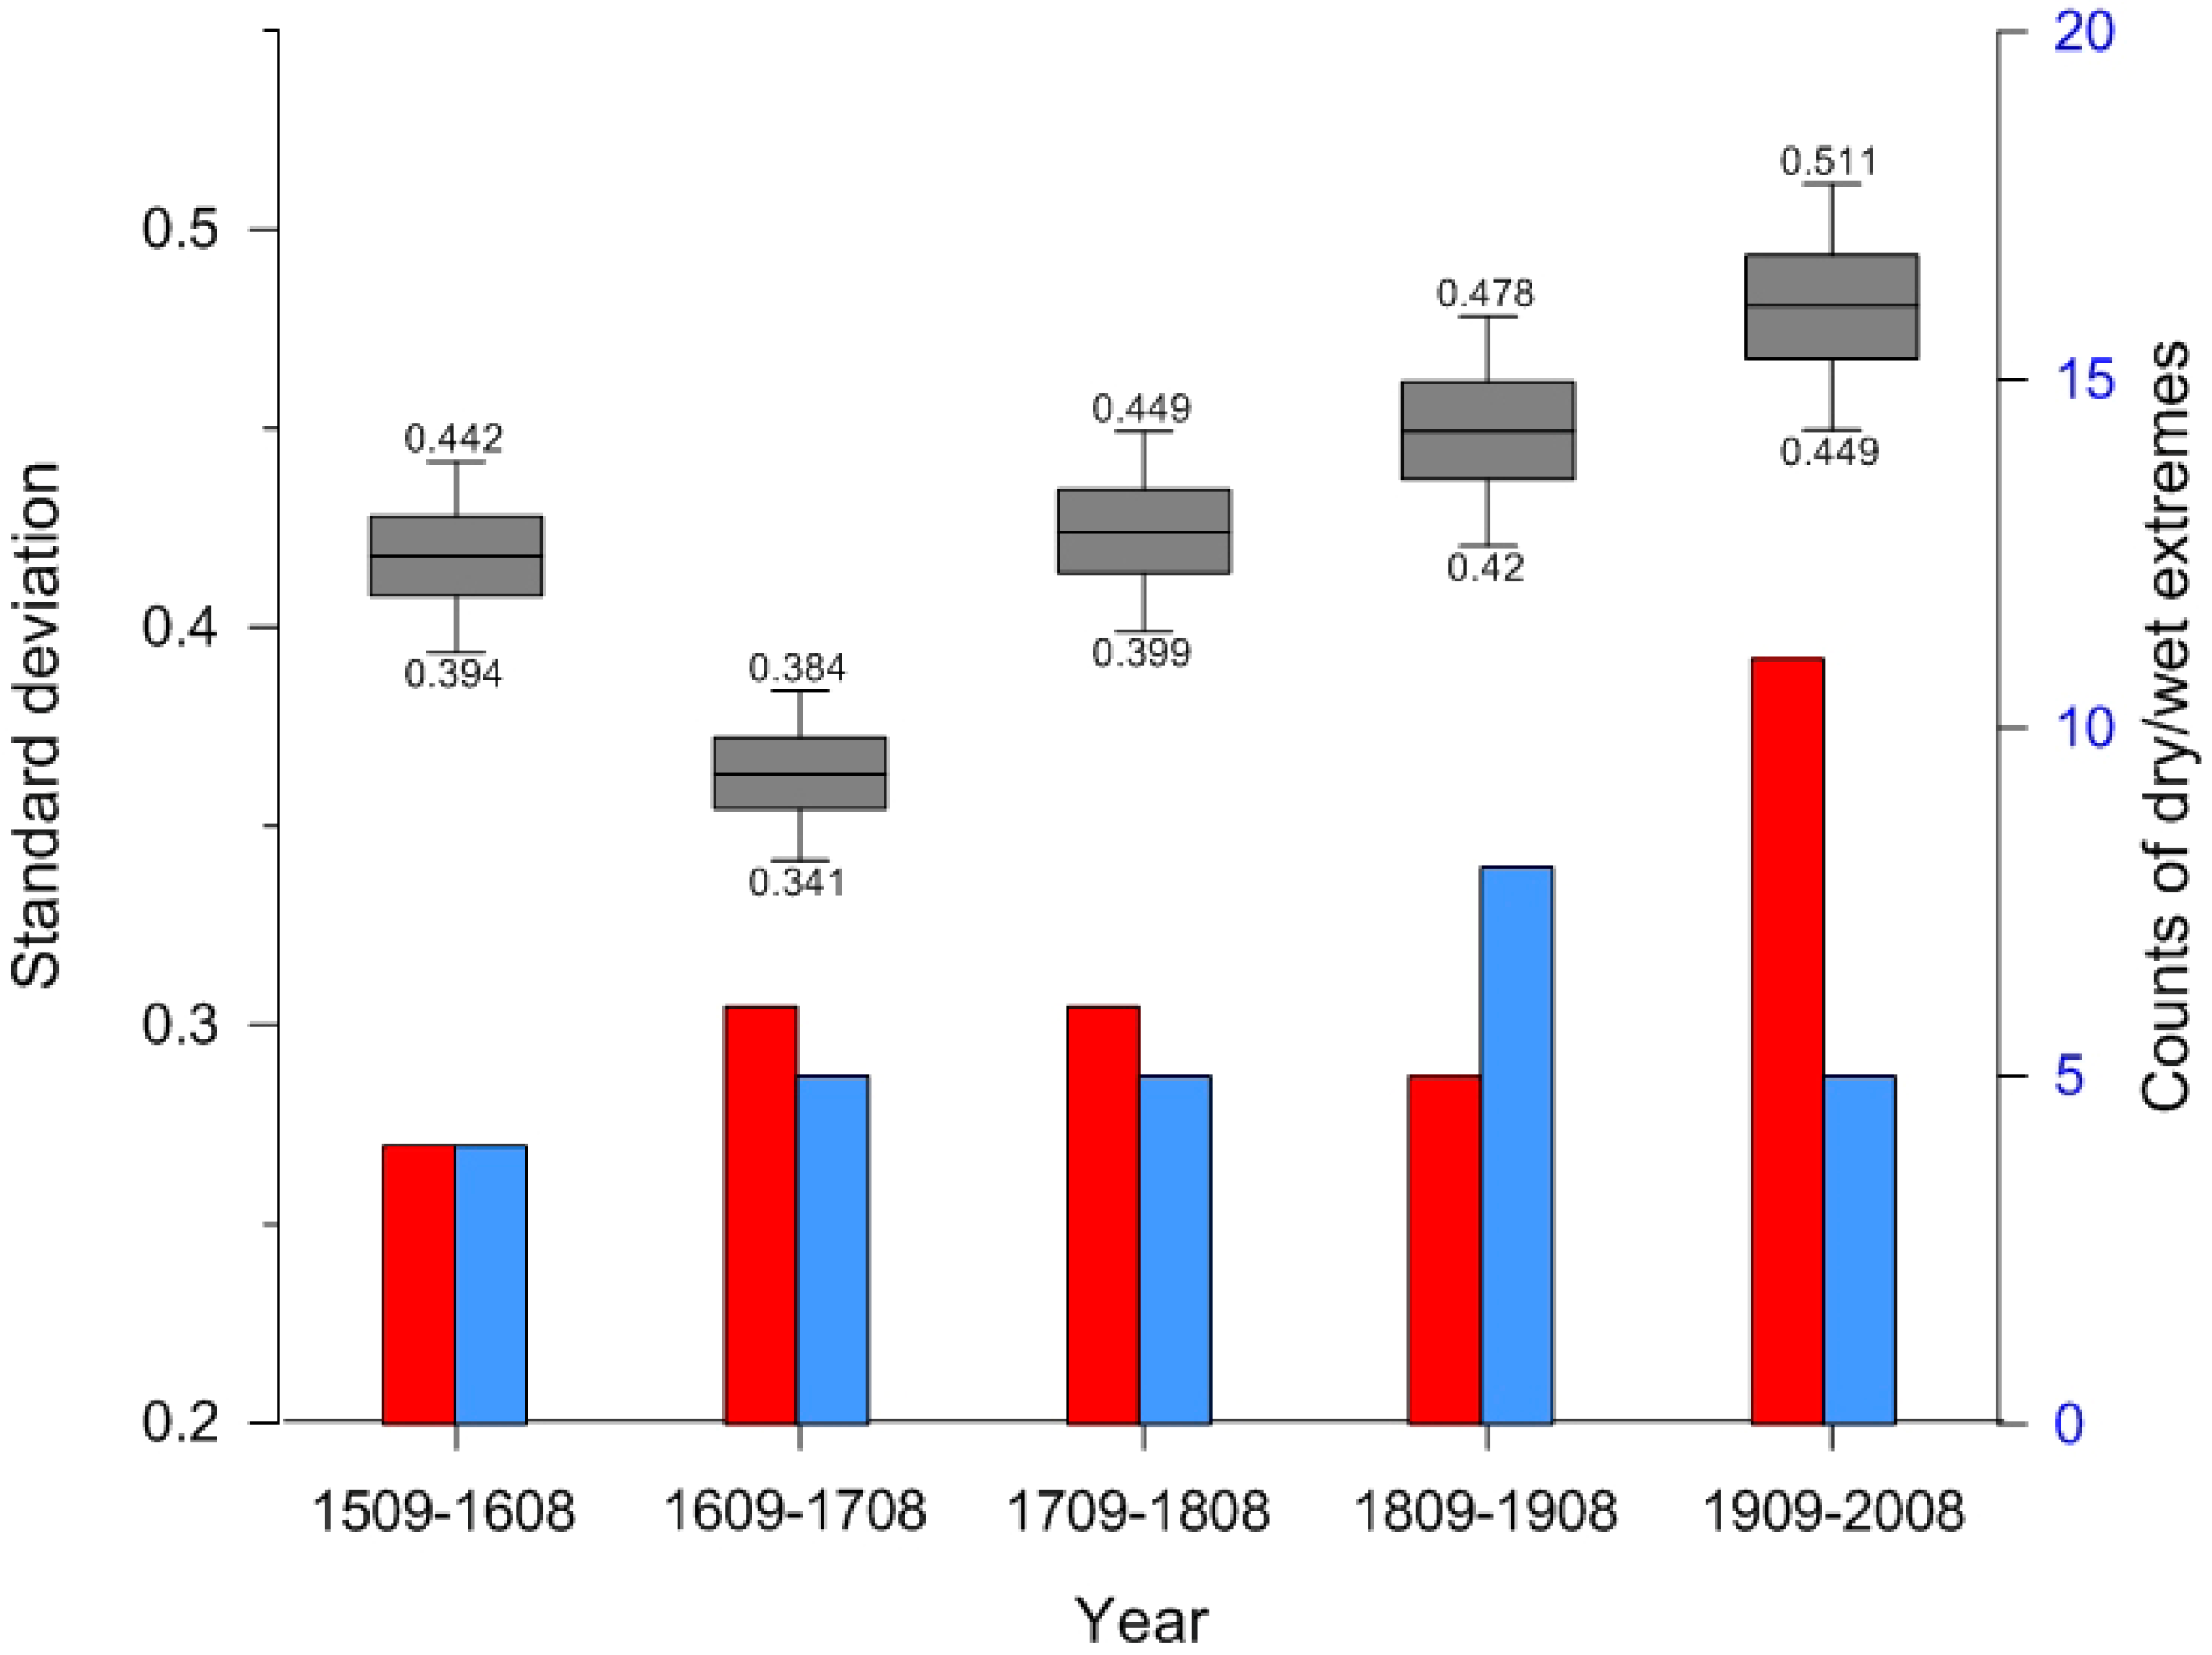
Figure 9.
Comparison of reconstructed PDSI in this study and other PDSI reconstructions of adjacent region. (a) Reconstructed May–June PDSI in this study; (b) reconstructed annual PDSI in the northeastern Qinghai-Tibetan Plateau (Peng and Liu, 2013) [53]; (c) reconstructed May–June PDSI in the southeastern Qinghai-Tibetan Plateau (Wang et al., 2020) [55]; (d) reconstructed annual PDSI in the southeastern Qinghai-Tibetan Plateau (Fang et al., 2010) [44]. All bold red lines were smoothed by a 10-year low-pass filter.

Figure 10.
Spatial regression patterns between reconstructed mean May–June PDSI and geopotential height anomalies at pressure levels of 200 hPa (a), 500 hPa (b), and wind anomalies at the 850 hPa pressure level (c) during the period of 1955–2008. (The correlation coefficients of reconstructed mean May–June PDSI and EAP teleconnection index are shown in the upper right corner of (b); the black rectangle indicates the location of the sampling sites; the black dots and gray shades indicate passing the 0.05 confidence level).

Table 1.
Detailed information for the five sampling sites in the source region of the three great rivers on the northeastern Qinghai-Tibetan Plateau.
Table 1.
Detailed information for the five sampling sites in the source region of the three great rivers on the northeastern Qinghai-Tibetan Plateau.
| Site | Code | Latitude | Longitude | Elev. (m) | Cores |
|---|---|---|---|---|---|
| Angsai | AS | 32°39′ | 95°41′ | 4051 | 34 |
| Jungong | JG | 34°44′ | 100°33′ | 3538 | 30 |
| Ningmute | NMT | 34°37′ | 100°57′ | 3575 | 34 |
| Xiaersi | XES | 33°44′ | 96°15′ | 4234 | 39 |
| Zhongtie | ZT | 35°03′ | 100°07′ | 3831 | 31 |
Table 2.
The statistics of each standard chronology (common period analyses for 1901–2000).
| Site | Period (EPS > 0.85) | MS | SD | AC1 | Rbar | SNR | EPS | PC1 Variance |
|---|---|---|---|---|---|---|---|---|
| AS | 1605–2008 | 0.12 | 0.168 | 0.591 | 0.237 | 7.456 | 0.882 | 29.5% |
| JG | 1810–2008 | 0.232 | 0.224 | 0.218 | 0.476 | 21.8 | 0.956 | 50.9% |
| NMT | 1605–2008 | 0.13 | 0.158 | 0.481 | 0.201 | 8.03 | 0.889 | 25.3% |
| XES | 1660–2008 | 0.185 | 0.197 | 0347 | 0.23 | 10.17 | 0.91 | 27.5% |
| ZT | 1590–2008 | 0.155 | 0.183 | 0.439 | 0.293 | 10.37 | 0.912 | 33.1% |
Notes: MS, mean sensitivity; SD, standard deviation; AC1, first-order serial autocorrelation; Rbar, mean inter-series correlation; SNR, signal to noise ratio; EPS, expressed population signal; PC1 variance, variance explained by the first principal component (PC1).
Table 3.
Correlation coefficients of each chronology pair for the ring width (EPS > 0.85).
| JG | NMT | XES | ZT | ||
|---|---|---|---|---|---|
| AS | r | 0.142 * | 0.239 ** | 0.415 ** | 0.145 ** |
| n | 199 | 404 | 349 | 404 | |
| JG | r | 0.401 ** | 0.362 ** | 0.395 ** | |
| n | 199 | 199 | 199 | ||
| NMT | r | 0.230 ** | 0.383 ** | ||
| n | 349 | 404 | |||
| XES | r | 0.305 ** | |||
| n | 349 |
Notes: * p < 0.05, ** p < 0.01. n, the number of data pairs.
Table 4.
Statistics of calibration and leave-one-out verification results for the regression model in the common period 1955–2005.
Table 4.
Statistics of calibration and leave-one-out verification results for the regression model in the common period 1955–2005.
| Calibration (Model: PDSIM-J = 3.631 × RC − 3.521) | Leave-One-Out Verification | |||||||
|---|---|---|---|---|---|---|---|---|
| Period | r | R2 | R2adj | F | r | RE | Sign Test | Pmt |
| 1955–2005 | 0.676 | 45.7% | 44.6% | 41.2 | 0.628 | 0.393 | 37+/14− ** | 2.42 ** |
Notes: r, correlation coefficient; R2 and R2adj, coefficients of determination and adjusted coefficients of determination of regression analysis; F, F statistic for regression model significance; RE, the reduction of error; Sign test, sign of paired observed and estimated departures from the mean based on the number of agreements/disagreements; Pmt, the product mean test. ** Significant at p < 0.01.
Disclaimer/Publisher’s Note: The statements, opinions and data contained in all publications are solely those of the individual author(s) and contributor(s) and not of MDPI and/or the editor(s). MDPI and/or the editor(s) disclaim responsibility for any injury to people or property resulting from any ideas, methods, instructions or products referred to in the content. |
© 2024 by the authors. Licensee MDPI, Basel, Switzerland. This article is an open access article distributed under the terms and conditions of the Creative Commons Attribution (CC BY) license (https://creativecommons.org/licenses/by/4.0/).
Share and Cite
MDPI and ACS Style
Xing, P.; Bai, M.; Zhang, Q.-B.; Lyu, L. Tree-Ring Inferred Drought Variations in the Source Region of the Yangtze, Yellow, and Mekong Rivers over the Past Five Centuries. Water 2024, 16, 1186. https://doi.org/10.3390/w16081186
AMA Style
Xing P, Bai M, Zhang Q-B, Lyu L. Tree-Ring Inferred Drought Variations in the Source Region of the Yangtze, Yellow, and Mekong Rivers over the Past Five Centuries. Water. 2024; 16(8):1186. https://doi.org/10.3390/w16081186
Chicago/Turabian StyleXing, Pei, Mengxin Bai, Qi-Bin Zhang, and Lixin Lyu. 2024. "Tree-Ring Inferred Drought Variations in the Source Region of the Yangtze, Yellow, and Mekong Rivers over the Past Five Centuries" Water 16, no. 8: 1186. https://doi.org/10.3390/w16081186
Note that from the first issue of 2016, this journal uses article numbers instead of page numbers. See further details here.