Article

Study on the Synergistic Effects of Karst Carbon Sink and Vegetation Carbon Sink in Watersheds under Different Geological Backgrounds—A Case Study of Darongjiang and Lingqu Watersheds

1
College of Earth Sciences, Guilin University of Technology, Guilin 541004, China
2
Institute of Karst Geology, Chinese Academy of Geological Sciences CAGS, Key Laboratory on MNR & CZAR, Guilin 541004, China
3
Guilin Karst Geology Observation and Research Station of Guangxi, Guilin 541004, China
4
Guangxi Pingguo Karst Ecosystem National Field Scientific Observation and Research Station, Guilin 541004, China
5
International Research Centre on Karst under the Auspices of UNESCO, Guilin 541004, China
*
Authors to whom correspondence should be addressed.
Water 2024, 16(8), 1192; https://doi.org/10.3390/w16081192
Submission received: 11 March 2024 / Revised: 10 April 2024 / Accepted: 19 April 2024 / Published: 22 April 2024

Abstract

:
In this study, the hydrochemistry-runoff method and remote sensing estimation method were used to calculate the karst carbon sink flux (KCSF) and the forest vegetation carbon sequestration flux (FVCSF) in Darongjiang (DRJ) and Lingqu (LQ) watersheds. The results show the following: (1) The KCSF in DRJ and LQ watersheds is 238.43 × 10⁵ t·y−1 and 353.44 × 10⁵ t·y−1, respectively. Influenced by changes in flow rate, the two watersheds both show that their KCSF is higher in the rainy season than in the dry season. (2) The FVCSF in DRJ and LQ watersheds was 680.78 × 10⁷ t·y−1 and 229.63 × 10⁷ t·y−1, respectively. Through comparison, it can be seen that the FVCSF is much higher than the KCSF in both watersheds, but the FVCSF and the KCSF are at the same order of magnitude. (3) Through further analysis of the influence factors on the FVCSF and the KCSF, we found that the highest values of FVCSF are mainly distributed around Kitten Mountain on the upper reach and along the LQ watershed. That may be because most of the upper reach areas are mountainous forestland, and the strong weathering of rocks in the LQ watershed promotes the development of forest vegetation carbon sequestration. Therefore, it can be inferred that there is a certain synergistic effect between the karst carbon sink (KCS) and the forest vegetation carbon sequestration (FVCS) in the study area, and such a synergistic effect is caused by rock weathering.

1. Introduction

Nowadays, global climate change is one of the scientific issues that attracts the most attention. Due to the strategic needs of China, such as “carbon peaking” and “carbon neutrality”, it has become a research hotspot to evaluate and explore the carbon sink potential of terrestrial ecosystems [1]. Among many potential means, ecosystem carbon sinks, especially vegetation system carbon sinks, have been recognized by many scholars [2]. To achieve “carbon peaking and neutrality”, we need to reduce emissions and enhance terrestrial ecosystems’ carbon neutrality [3,4]. The carbon neutrality capability of a region comes from two parts. i.e., rock weathering carbon sink and ecological carbon sink [5]. Rock weathering carbon sinks mainly include carbonate and silicate weathering carbon sinks [6]. Carbonate rock reacts with CO2 in water, creating karst landforms and dissolved inorganic carbon, forming a carbon sink known as the “karst carbon sink” (KCS) [7]. Ecological carbon sink refers to the process, activity, or mechanism by which ecosystems remove CO2 from the atmosphere, and it is an important part of the carbon neutrality capacity of terrestrial ecosystems [8]. Vegetation acts as a significant carbon pool in terrestrial ecosystems by absorbing CO2 from the atmosphere through photosynthesis and other pathways. This natural function helps maintain atmospheric CO2 balance and reduce greenhouse gas emissions [9,10]. Since FVCS and KCS have strong potential to help China reach carbon peaking and carbon neutrality goals, they have become hot topics in the field of carbon cycle research [11,12].
Regarding the research on forest vegetation carbon sequestration (FVCS), researchers mainly focus on the application of FVCS calculation methods [13,14,15]. With the increasing value of forest carbon sinks, China has carried out a large number of practical activities and theoretical research on afforestation-related projects [16,17,18,19,20,21,22]. Currently, the primary method for studying vegetation carbon storage is by converting biomass into carbon storage [23,24,25,26]. The key to this method lies in the calculation of biomass, which is then multiplied by the carbon content coefficient to obtain carbon sequestration. Remote sensing-based estimation methods are widely used for vegetation carbon storage due to their convenient data acquisition and broad coverage. Li et al. [13] used the remote sensing estimation method to estimate the FVCSF in state-owned forest farms in Shaanxi Province from 2000 to 2020. Compared to vegetation carbon sinks, the instability of karst carbon sinks leaves them far from entering the carbon market, but they have the potential to become one of the favored means of removing carbon dioxide from the atmosphere [27]. In the early 1990s, Yuan Daoxian proposed the idea of studying karst formation from the perspective of the interaction among the four major spheres, which promoted the implementation of the project “Geology, Climate, Hydrology, and Karst Formation” (1990–1994), created the theory of karst dynamics [28], and promoted continuous research on KCS [29,30,31,32].
On the one hand, Chinese vegetation has enormous carbon sequestration potential [33]. With increasing attention to ecological protection, China’s forests are enhancing their carbon sequestration capacity through afforestation. On the other hand, the southwestern region of China is widely distributed with carbonate rocks. Therefore, in some regions, there are conditions for both vegetation and karstification. During early KCS research, scholars discovered a strong correlation between KCS and FVCS. Such research includes the studies of typical karst springs in Mashan Nongla, Guangxi, and Jinfoshan, Chongqing [34], the 2-year experimental study of Zhang et al. [35], who used standard dissolution specimens taken from four land use types and different interfaces in the Yunnan Stone Forest Global Geopark, and the study of Zhou et al. [36]. They all found that the progressive succession of vegetation can greatly promote the progress of karstification, increase the dissolution rate of carbonate rock, and increase KCSF. However, although previous studies have explored the impact mechanisms of vegetation on the karst carbon sink in different land use types, there is still a lack of in-depth coupled research on the interaction mechanisms between KCS and FVCS.
China’s extensive karst distribution, covering one-third of its land area, with over 40% located in the southwestern region, indicates significant potential for KCS development [29,37,38]. The source and destination of vegetation carbon in southwest karst areas are unique, complicated, and different from those in non-karst areas [39,40]. To explore the interaction between FVCS and KCS, we studied two small watersheds—DRJ and LQ—chosen for their consistent climatic conditions and distinct geological backgrounds. Monthly-scale hydrochemistry and flow data, in combination with data such as net primary productivity (NPP) and vegetation area in the watersheds, were used to study the synergistic effects of FVCS and KCS under the influence of different geological backgrounds and land use types. Hopefully, this study could provide some guidance for research on CO2 emission reduction in watersheds.

2. Research Area Overview

The Darongjiang watershed (DRJ) is located in the northern part of Rongjiang Town, Xing’an County, Guilin City, Guangxi. It originates on the eastern slope of Kitten Mountain, the highest peak in South China. In the study area, DRJ flows from north to south (till the outlet controlled by the Darongjiang Water Level Station), with a main stream length of 55.7 km, an average annual runoff of 1.32 × 10⁹ m3 [41], and a watershed area of 719 km2. The Lingqu watershed (LQ) is located in Xing’an County, Guilin City, Guangxi, and flows from east to west (till the outlet controlled by the Lingqu Water Level Station), with a main stream of 48.2 km, an average gradient of 5.4‰, an average annual runoff of 3.68 × 10⁸ m3, and a watershed area of 248 km2 [42]. In addition, the outcrops in the watersheds include the sandy mudstone of member I, Cambrian Qingxi Formation (∈q1), the sandstone interbedded with shale of Bianxi Formation (∈b), the limestone of Lower Ordovician Baidong Formation (O1b), the mudstone interbedded with sandstone of Huang’ai Formation (O1h), the mudstone interbedded with sandstone of Shengping Formation (O1S), and the limestone of Lower Devonian Donggangling Formation (D2d). The lithologies in the DRJ and LQ are quite different (Figure 1). The carbonate rocks in the DRJ watershed are mainly distributed in the Rongjiang Basin downstream, covering an area of about 62 km2, accounting for about 9% of the total area of the watershed. LQ watershed has obvious karst landform characteristics; the rocks are mostly carbonate rocks with many caves and gaps; the carbonate rocks are mainly distributed in the northern part of the watershed, covering an area of about 118 km2, accounting for about 48% of the total area of the watershed [43].
Both the watersheds are located in the area where the mid-subtropical area meets the south subtropics. In terms of vegetation division in China, they are located in the transition zone between the subtropical evergreen broad-leaved forest region, the eastern humid broad-leaved forest subregion, and the southern subtropical evergreen broad-leaved forest subregion. Their zonal vegetation is evergreen broad-leaved forest. The soil in DRJ is mainly zonal red soil and mountain yellow soil, and the lands are mainly used as forestland and cultivated land (including orchard land and vegetable garden land) [44,45]. The lands on both sides of the river are fertile and serve as a commodity grain production area. LQ watershed has the characteristics of a high rock exposure rate, discontinuous soil distribution, shallow soil layer, high calcium content, and low moisture content. In the watershed, most of the suitable plants are resistant to drought, barrenness, and stony environments [46]. In the karst mountainous area of LQ, due to frequent human activities and natural disturbances, the original vegetation has been largely destroyed, and the existing vegetation is mainly evergreen/deciduous broad-leaved hardwood forest.

3. Materials and Methods

3.1. Sample Collection and Testing

From March 2021 to February 2022, hydrological annual regular monitoring and sampling were conducted on LQ and DRJ cross-sections before they joined in Rongjiang Town, Xing’an County, Guilin City. The sampling frequency was once a month. Considering the easy degassing characteristics of karst water, to prevent CO2 in water samples from escaping to the atmosphere during transportation, storage, and other processes, the HCO3 concentration was determined on site using the alkalinity kit produced by Merck KGaA in Germany Darmstadt. The kit had an accuracy of 0.1 mmol·L−1, each sample was titrated 2–3 times, and the average error was <5%. Other indicators of the samples, including K+, Na+, Ca2+, Mg2+, Cl, SO42−, and NO3, were determined in the laboratory. Cations (K+, Na+, Ca2+, and Mg2+) were analyzed using the Dionex ICS1500(Produced in Sunnyvale, USA) ion chromatograph with a test accuracy of 0.01 mg·L−1; anions (SO42−, NO3, and Cl) were analyzed using the Metrohm MIC ion chromatograph with a test accuracy of 0.01 mg·L−1; the average errors of anion and cation concentrations were <5%. The testing was completed by the Resources and Environment Supervision and Inspection Center, the Institute of Karst Geology, the Chinese Academy of Geological Sciences, and the Guangxi Key Laboratory of Karst Dynamics, Ministry of Natural Resources.

3.2. Data Processing

The Piper (trilinear) diagram in Origin was used to statistically analyze the conventional hydrochemical parameters of karst surface water samples. The lithological overview map of DRJ and LQ watersheds was drawn using ArcGIS 10.8, and the flow data were downloaded from the website of the Hydrological Center of Guangxi Zhuang Autonomous Region (http://swzx.gxzf.gov.cn/, accessed on 28 September 2023). The land cover data in this article were sourced from Globe Land 30 (http://www.globallandcover.com/, accessed on 13 September 2023), with a spatial resolution of 30 m. The vegetation NPP data were sourced from the MOD17A3HGF product based on the MODIS satellite released by the National Aeronautics and Space Administration (NASA) of the United States, with a spatial resolution of 500 m.

3.3. Hydrochemistry-Runoff Method

The traditional hydrochemistry-runoff method is a carbonate weathering carbon sink calculation model that can only estimate the overall amount of carbonate weathering in the watershed [47]. Based on the karst dynamic system, the model can be used to calculate the KCSF generated by the karstification of carbonate rocks in the watershed by combining the concentration of HCO3 with runoff data in the watershed. The formula is as follows [48,49,50,51,52]:
F = n × HCO 3   ×   Q   × M ( CO 2 ) M ( HCO 3 )
where F is the amount of CO2 absorbed by karstification; n is the coefficient, because in the process of carbonate rock weathering to absorb atmospheric CO2 to generate HCO3, only half of the carbon comes from the atmosphere, and the other half of the carbon comes from the rock weathering, and it cannot be counted as an atmospheric carbon sink. Therefore, in the study area, n is 0.5; [HCO3] is the HCO3 concentration in the watershed, in mg·L−1; Q is the flow rate, in m3/s; M (CO2) is the relative molecular mass of CO2; M (HCO3) is the relative molecular mass of HCO3. One typical reaction form of carbonate rocks (limestone) is as follows:
CaCO3 + H2O + CO2 ⇌ 2HCO3 + Ca2+
From Equation (1), the amount of CO2 absorbed in DRJ and LQ watersheds during the rainy season (March to August) and the dry season (September to February of the next year) can be calculated. Then, the amount of CO2 in the water consumed by carbonate rock dissolution during the monitoring period can be calculated, and that is the KCSF during the monitoring period, and its unit is t.

3.4. Calculation of FVCSF

The remote sensing estimation method was used to calculate the biomass distribution of forest ecosystems so as to estimate the carbon storage of forest ecosystems. Various plants in the ecosystem absorb CO2 in the atmosphere through photosynthesis, produce organic matter such as glucose, and release O2; the chemical equation is 6CO2 + 6H2O = C6H12O6 + 6O2, i.e., 1.63 g of CO2 is fixed for every 1 g of dry matter formed by vegetation. Net primary productivity (NPP) of vegetation refers to the organic dry matter production of green plants per unit time and unit area after deducting autotrophic respiration. The carbon content in the dry matter accounts for about 45% of the NPP. Obviously, plants have significant carbon sequestration and emission reduction effects. Therefore, in combination with NPP data, the FVCSF can be calculated using the formula below [53]:
C = ( NPP 0.45 )   ×   1.63
CS = C × S
In Formulas (3) and (4), C is the FVCSF per unit area, in “g/m2”. From the land use data, the woodland area is used as the approximate forest area S, and then the CS is estimated using Formula (4) in “t”.

4. Results

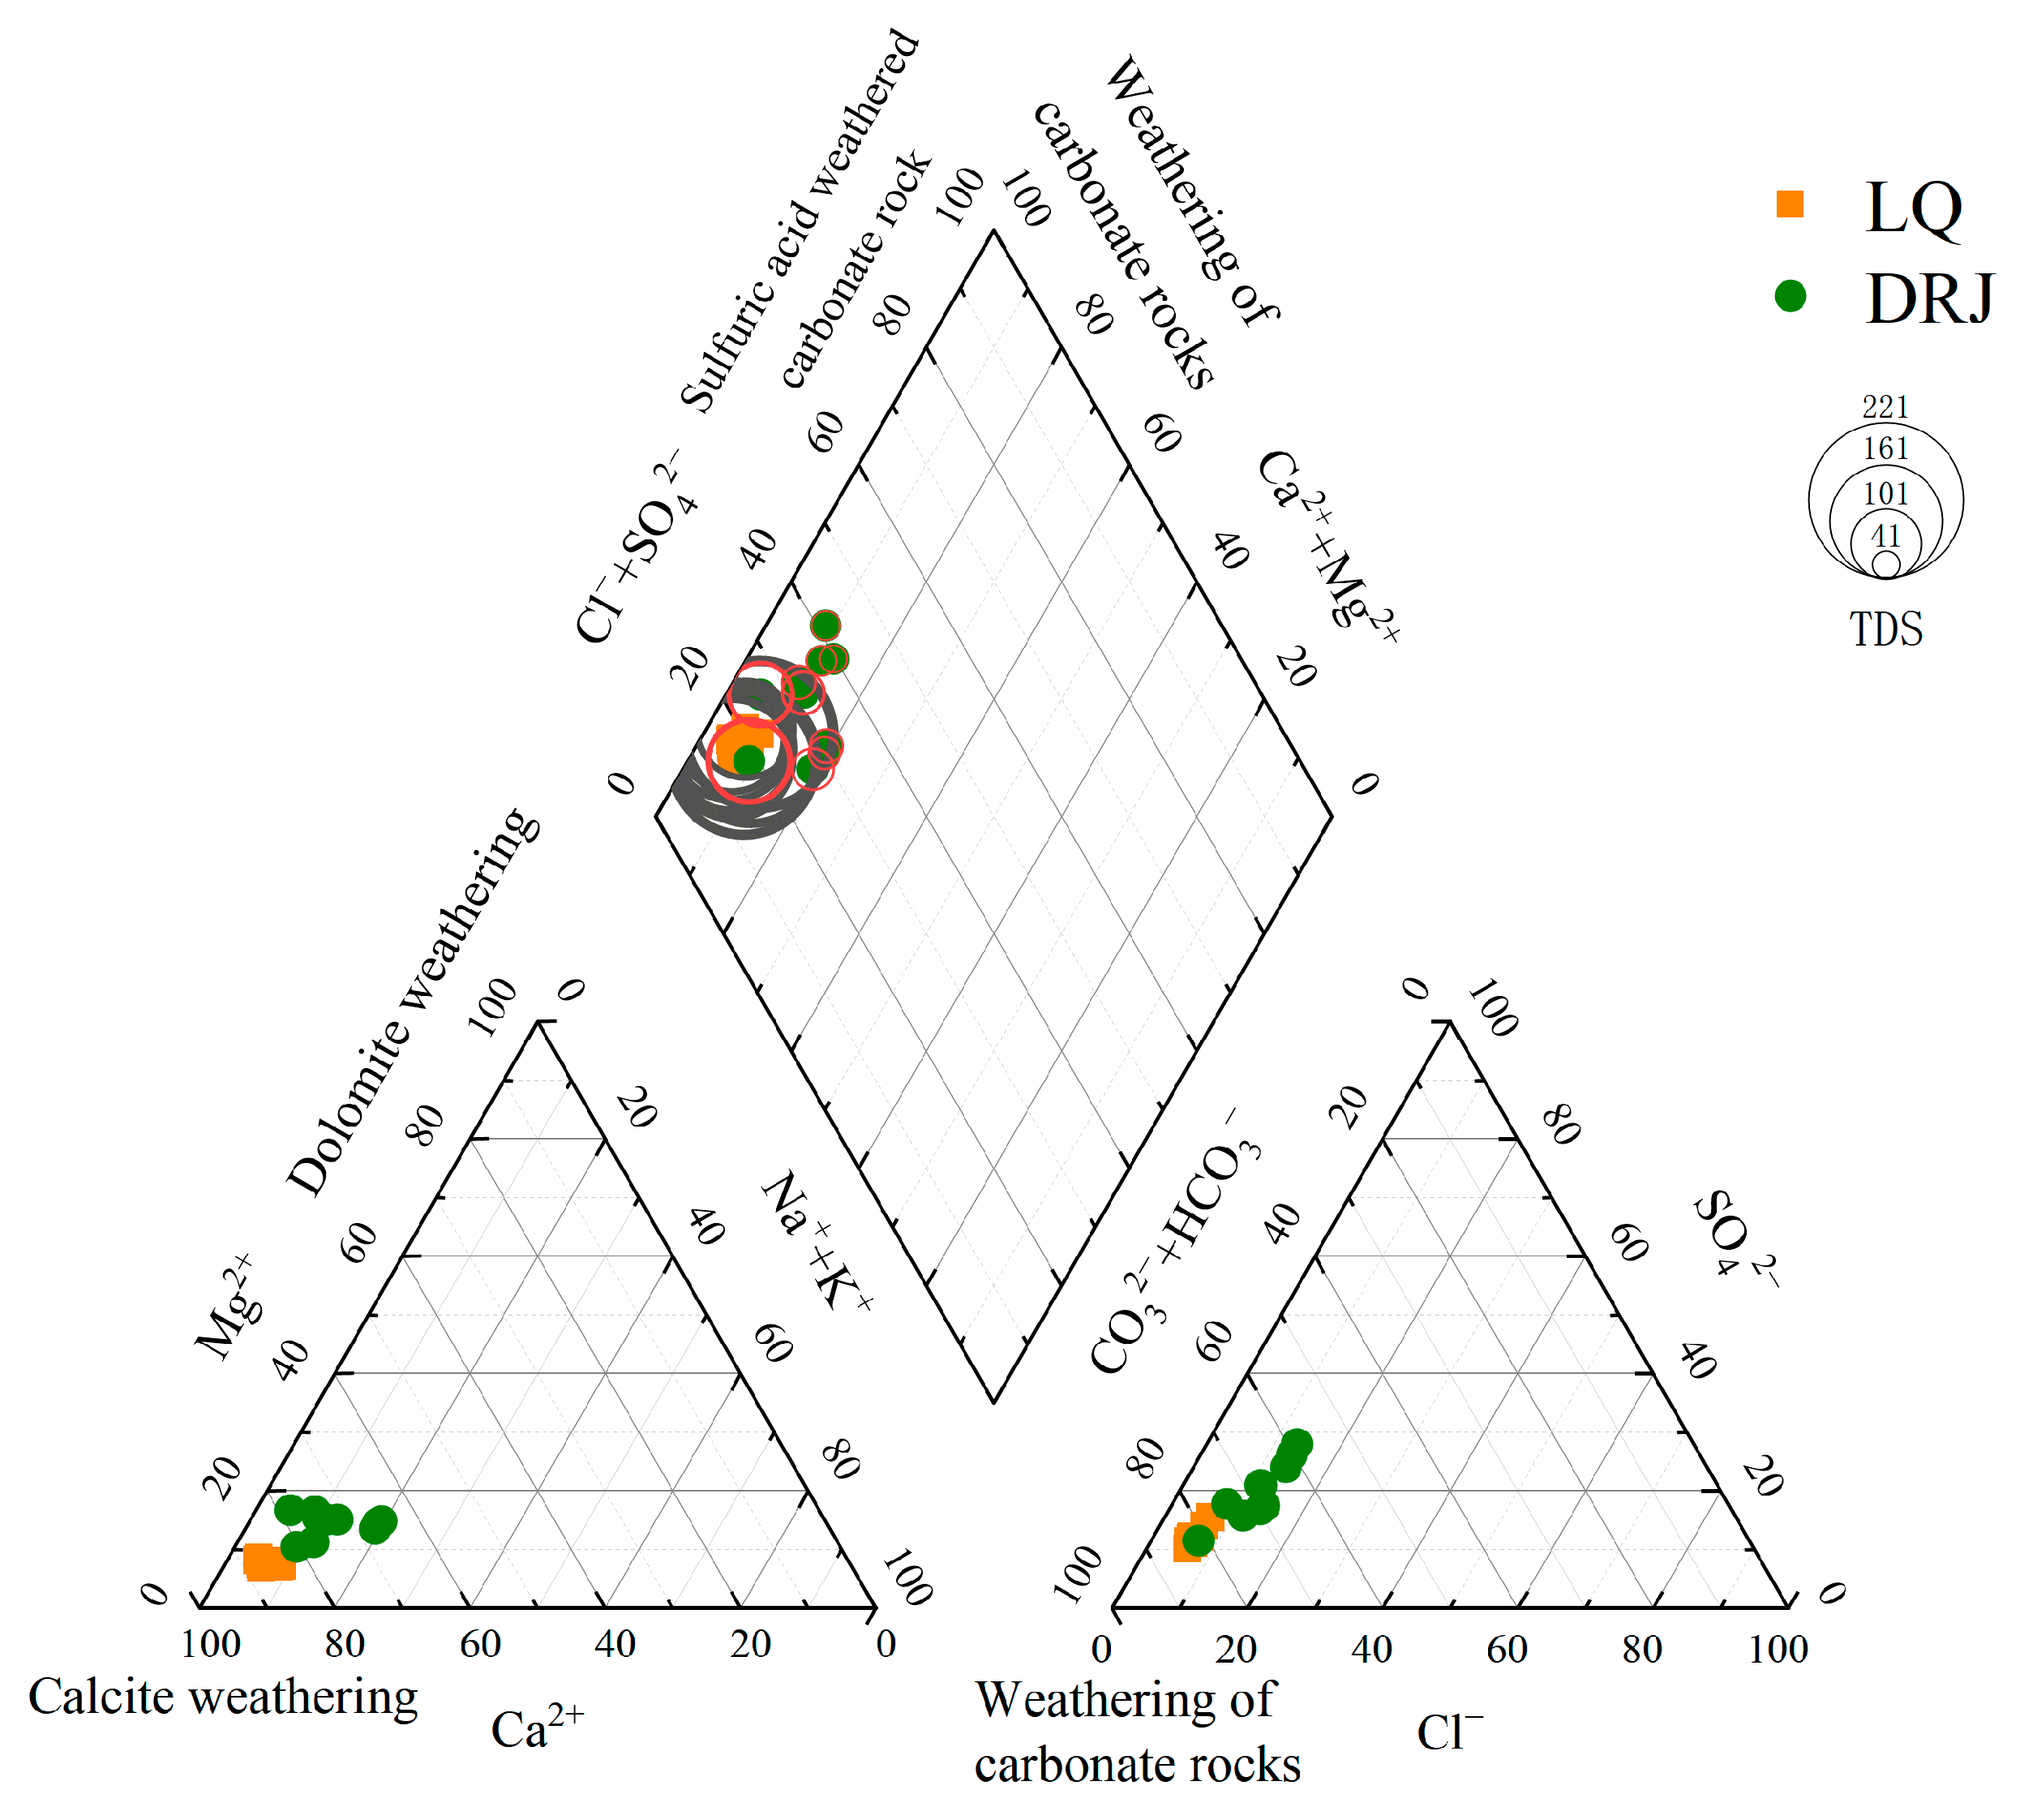
4.1. Hydrochemical Characteristics in the Study Area

Table 1 shows the composition of hydrochemical components in the DRJ and LQ river sections. Their water temperature ranges are 11.30–25.76 °C and 10.32–28.56 °C, respectively, with an average of 19.28 °C and 20.29 °C. Their pH values range from 6.79 to 8.14 and 7.57 to 8.46, with an average of 7.68 and 8.09, respectively. Their conductivity ranges from 43.60 to 171.90 μs·cm−1 and 162.10 to 318.00 μs·cm−1, with an average of 78.10 μs·cm−1 and 233.21 μs·cm−1, respectively. It can be seen that the pH values and conductivity of the LQ watershed are higher than those of the DRJ watershed. For the ion characteristics of the two watersheds, the Piper diagram can be used to determine the factors affecting the hydrochemical type and reveal the weathering type of the water sample flowing through the rock area [54,55]. The hydrochemical Piper diagram (Figure 2) of the two river sections in this study shows that the content of (Cl + SO42−) is low and the content of (Ca2+ + Mg2+) is high, indicating that the anions in water mainly come from the carbonic acid weathering of carbonate rocks. The triangle plots of anions and cations show that HCO3 is the most dominant anion in DRJ and LQ watersheds, indicating that the two watersheds are mainly affected by carbonic acid weathering of carbonate rocks; Ca2+ is the most dominant cation in the two watersheds, indicating that calcite (CaCO3) weathering is strong in the study area. Therefore, it can be concluded that the hydrochemical type in the study area is HCO3-Ca. The concentrations of the two ions are closely related to the intensity of karstification, which also reflects that the river water is mainly affected by the weathering and dissolution of carbonate rocks.

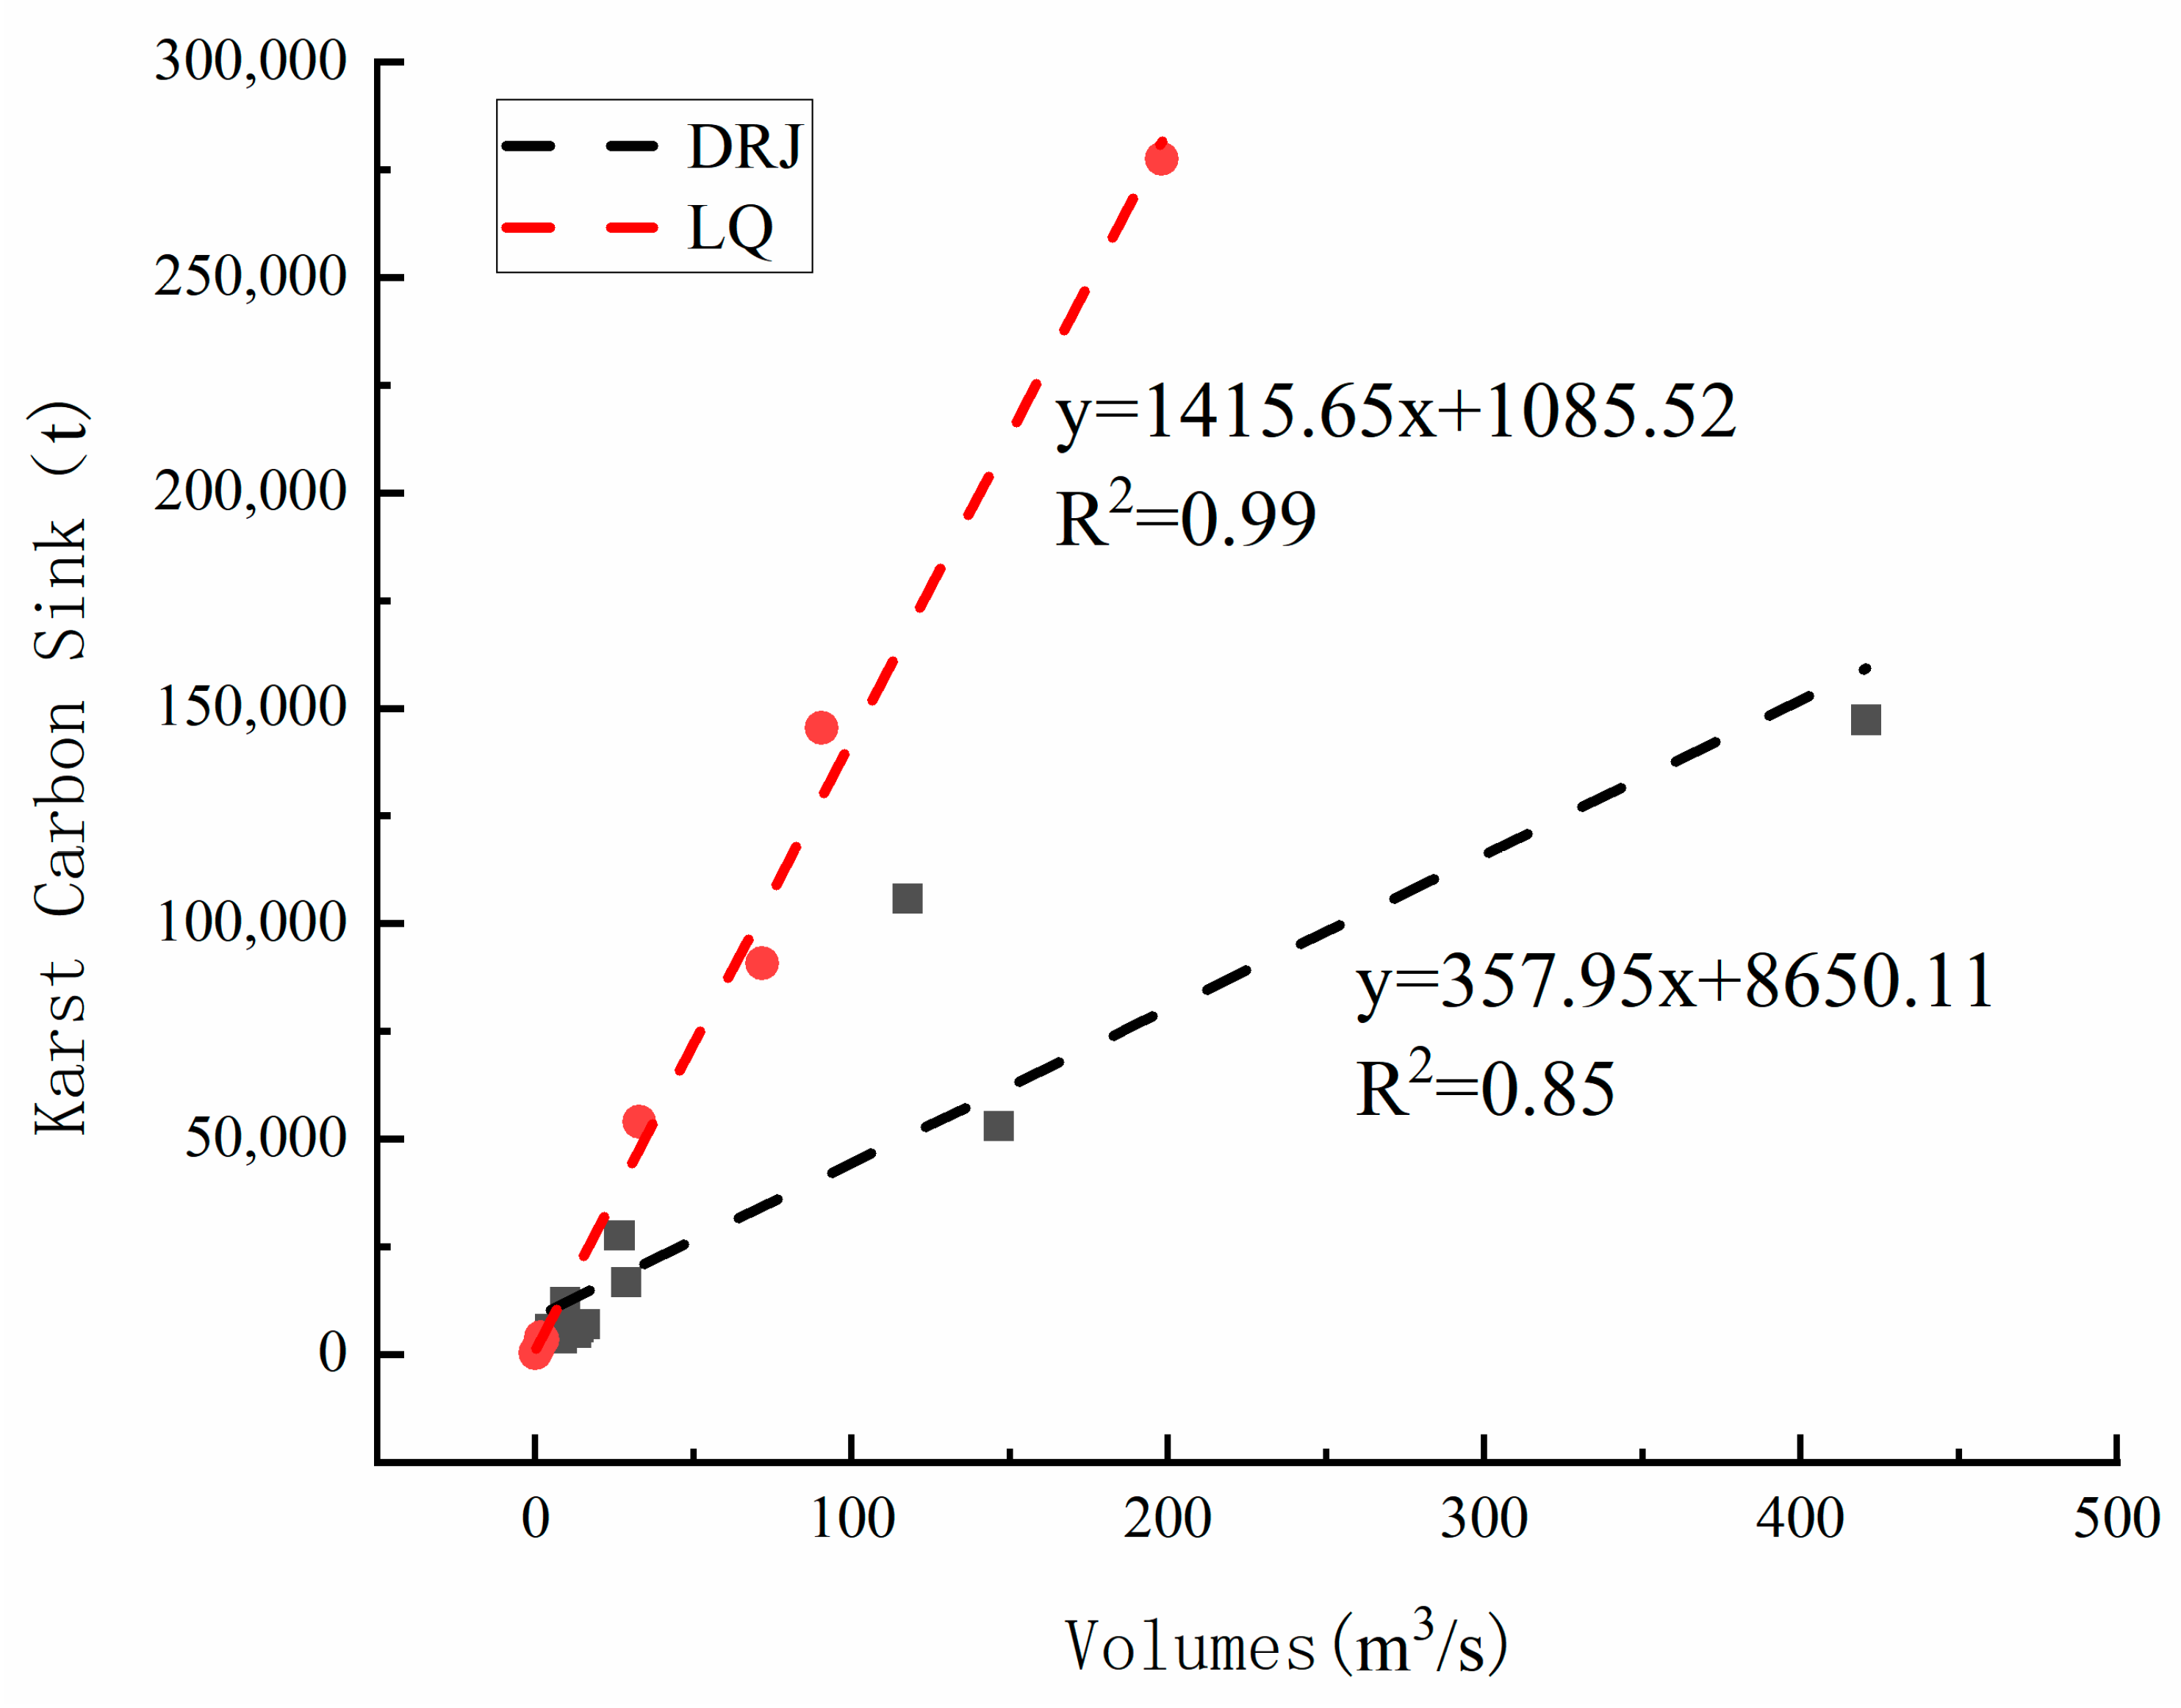
4.2. Characteristics of KCS in the Watersheds

The KCSF of DRJ and LQ watersheds was calculated using the hydrochemistry-runoff method proposed by Liu et al. [56]. If the HCO3 in DRJ and LQ river water comes from the natural weathering of carbonate rock, then half of the carbon in river water comes from atmospheric/soil CO2, and the other half comes from rock dissolution.
As shown in Table 2, the total KCSF in the DRJ watershed throughout the year is 238.40 × 10⁵ t·y−1, of which the KCSF in the rainy season is 218.47 × 10⁵ t and that in the dry season is 199.37 × 10⁴ t, accounting for 91.64% and 8.36% of the annual total KCSF, respectively. The total annual KCSF in LQ watershed is 353.44 × 10⁵ t·y−1, of which the KCSF in the rainy season is 350.75 × 10⁵ t and that in the dry season is 268.85 × 10³ t, accounting for 99.24% and 0.76% of the total annual KCSF, respectively. Obviously, the KCSF is higher in the LQ watershed than in the DRJ watershed, which is because the distribution area of carbonate rocks is much larger in the LQ watershed than in the DRJ watershed. In terms of seasonal changes, the KCSF in the DRJ watershed shows a pattern of spring > summer > autumn > winter, while that in the LQ watershed shows a pattern of summer > spring > winter > autumn. In general, both watersheds show a higher KCSF in rainy seasons than dry seasons.

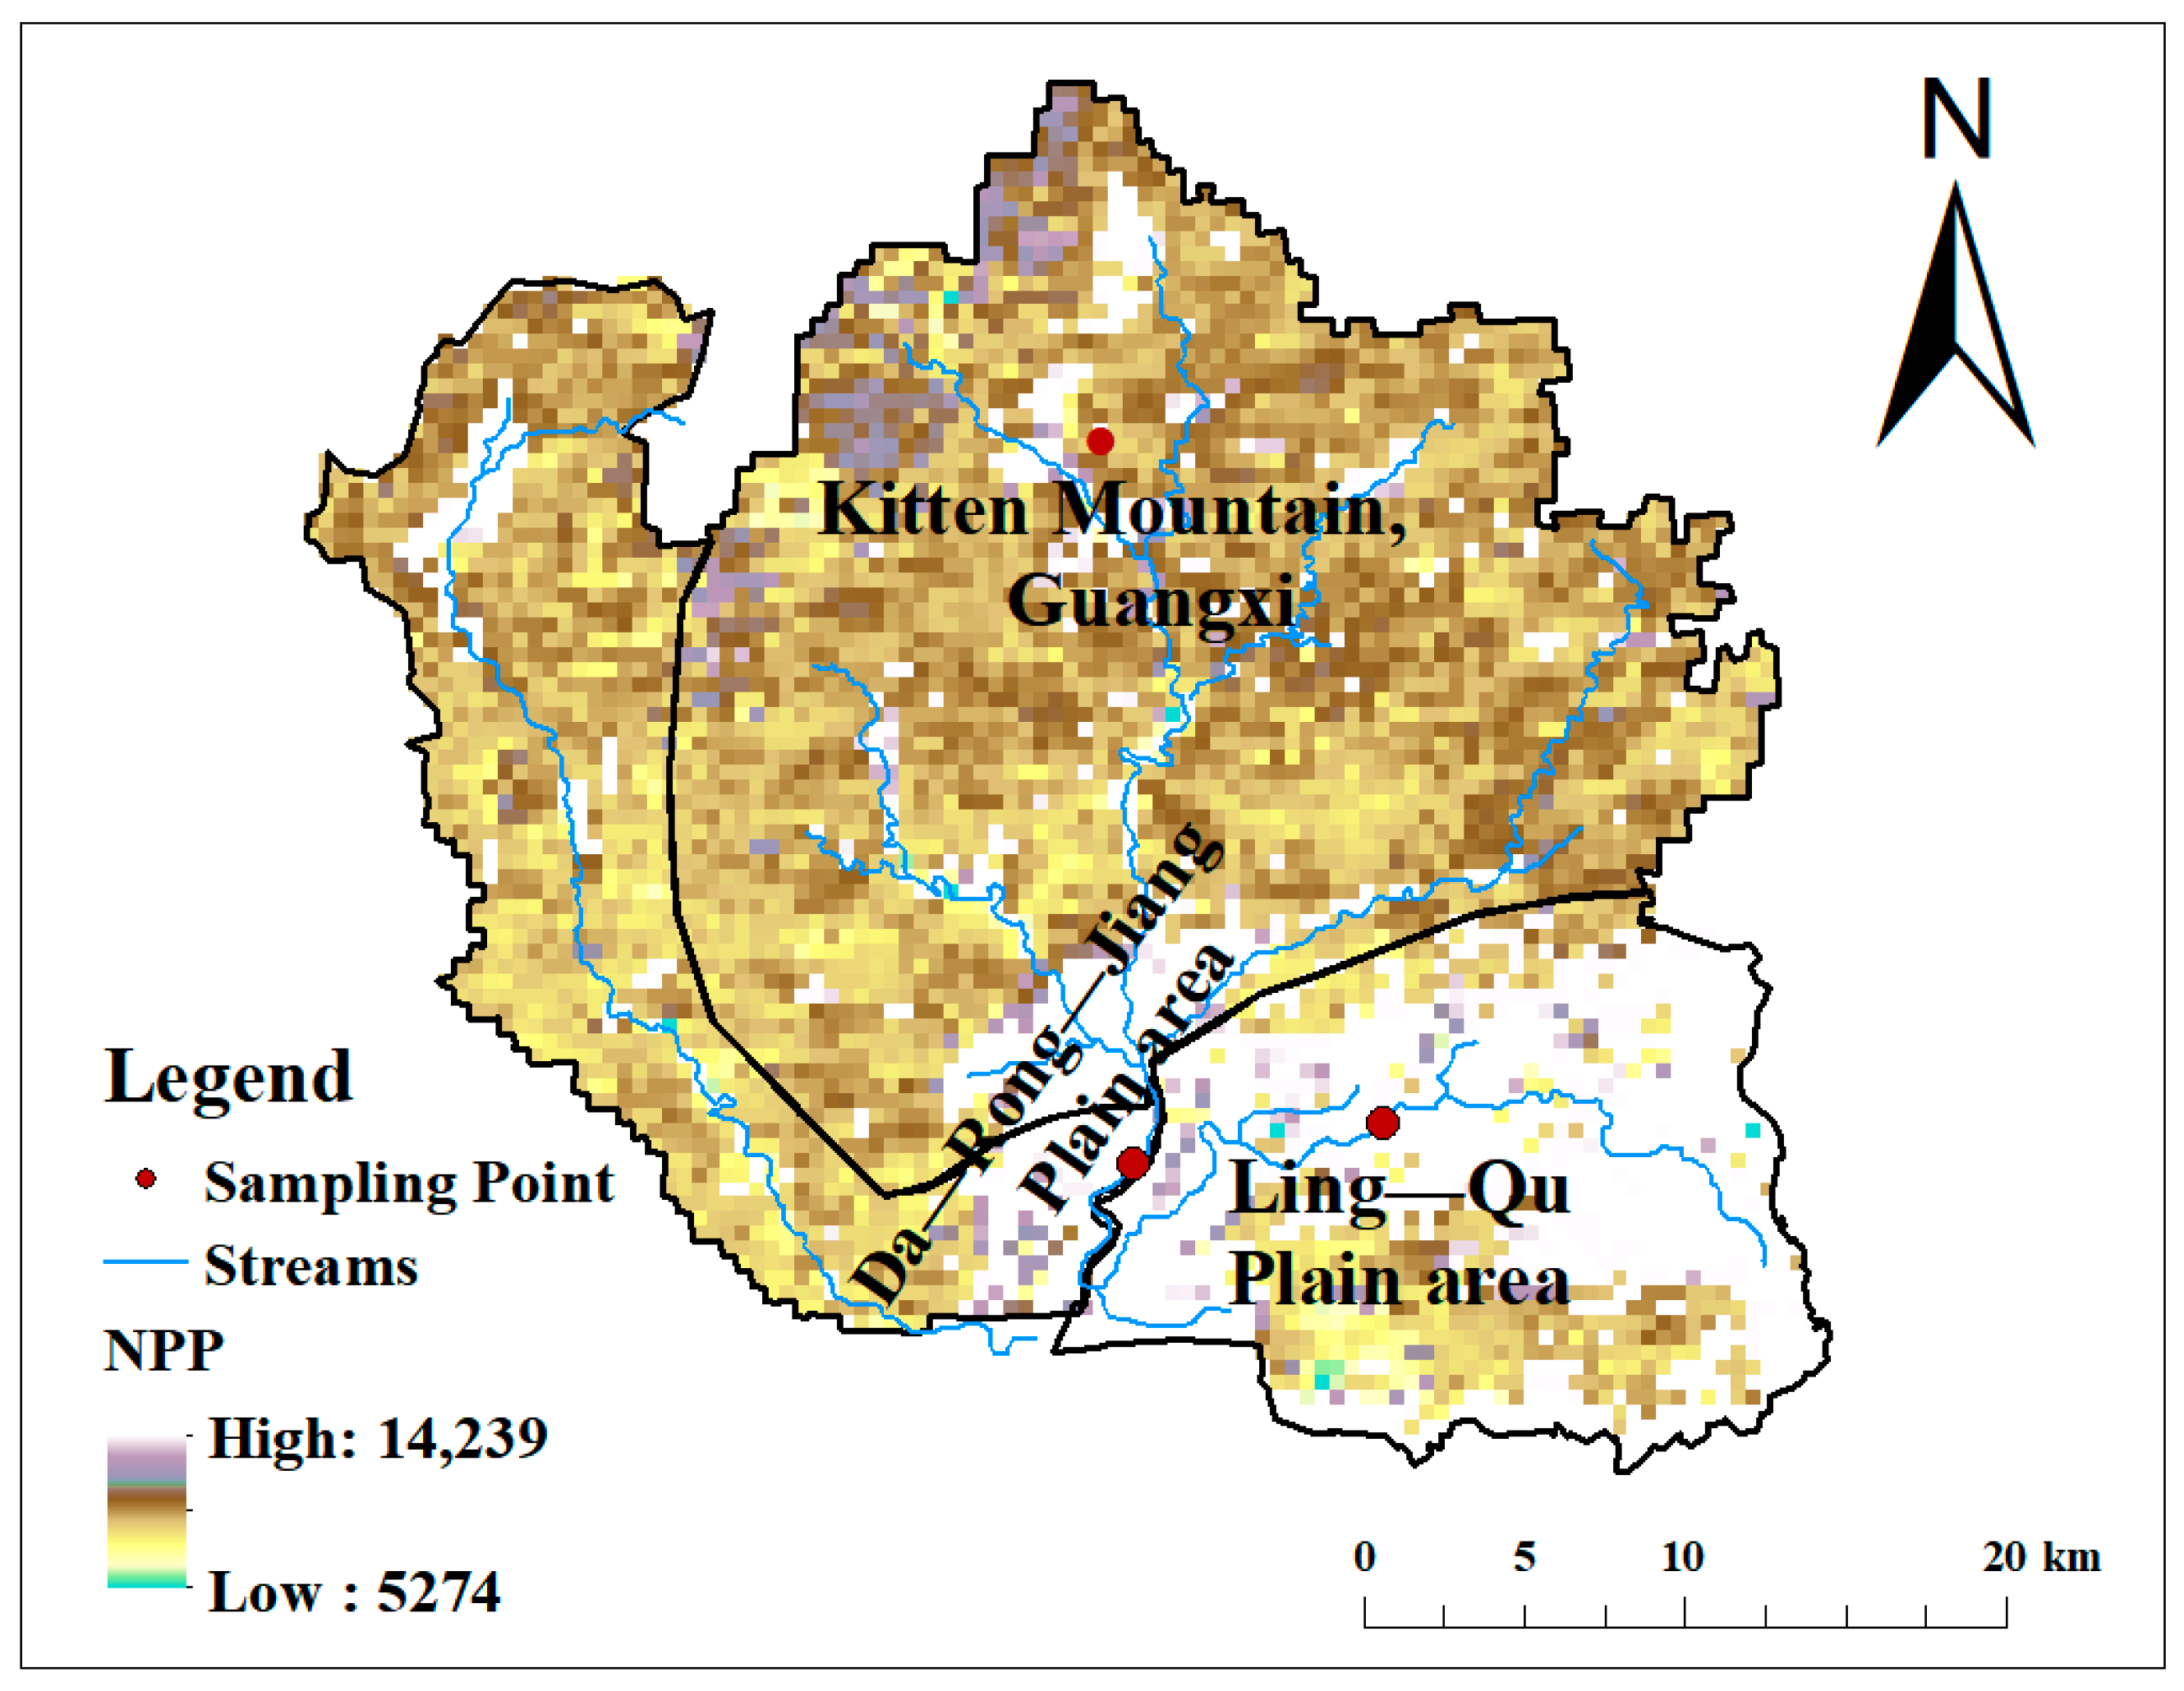
4.3. FVCSF in the Study Area

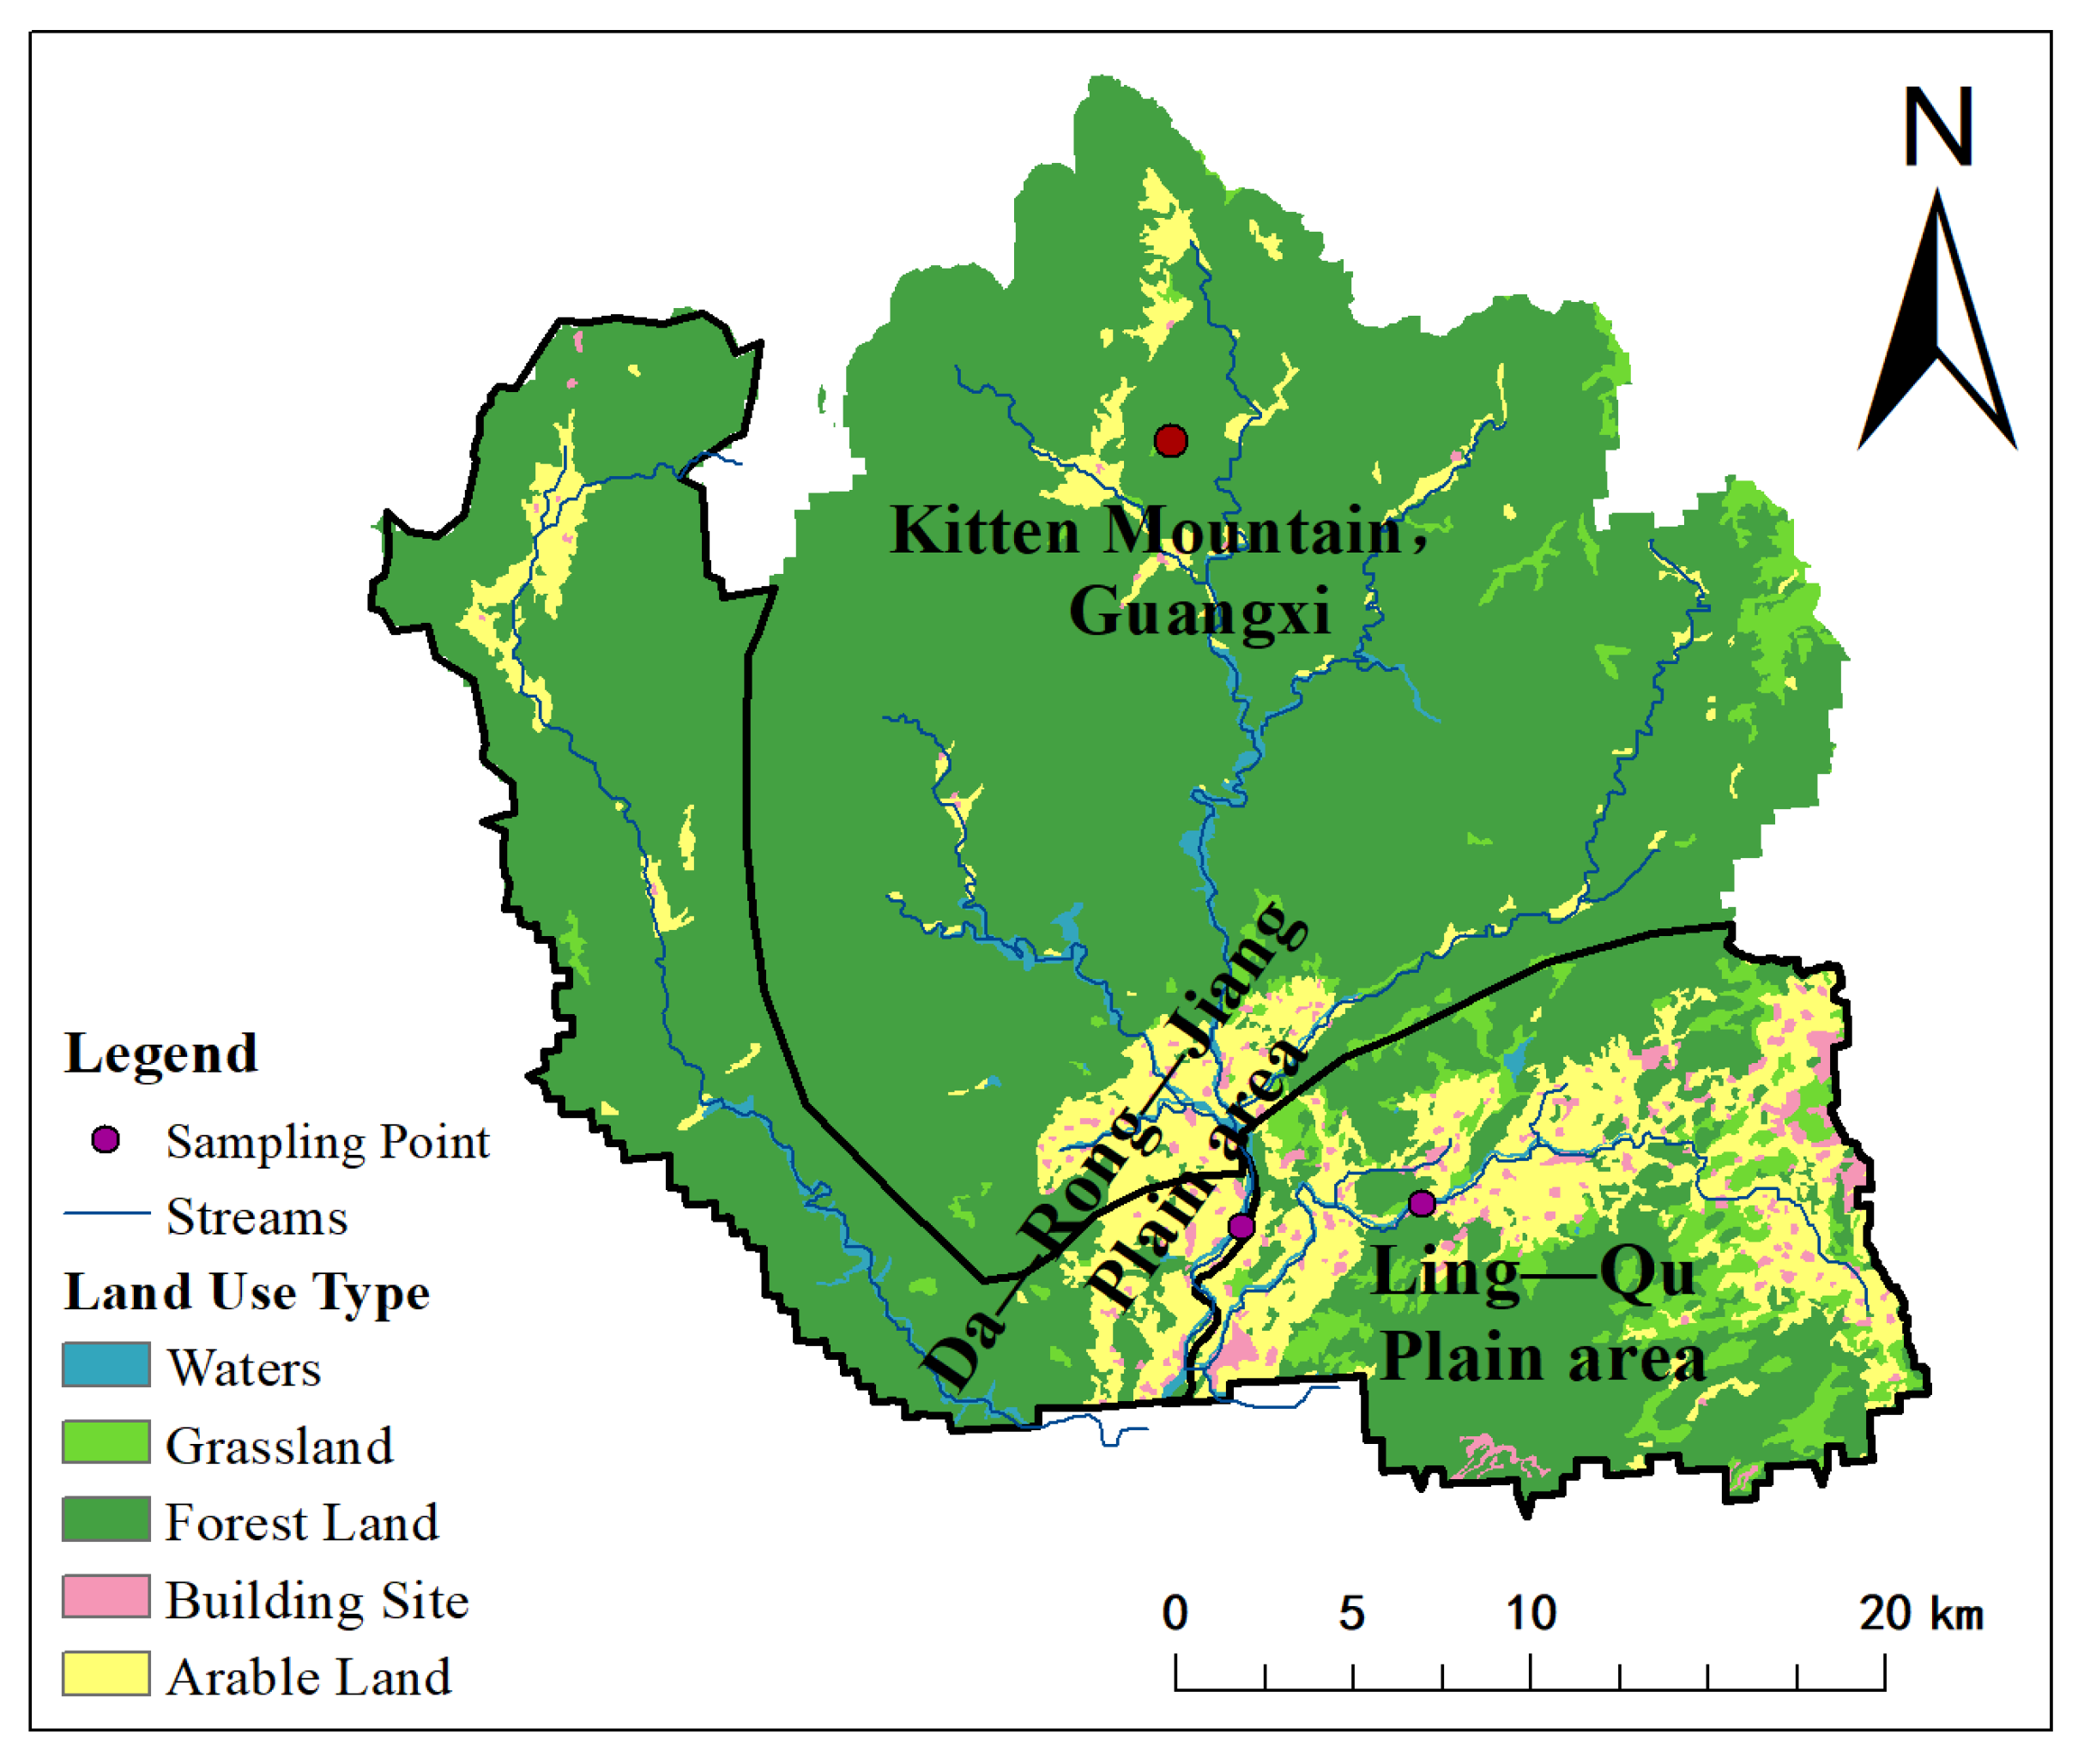
4.3.1. Status Quo of Land Use

Based on the actual conditions of DRJ and LQ watersheds, in combination with national standards and existing data, the land in the study area is divided into five types, i.e., cultivated land, forestland, grassland, water area, and urban, rural, industrial, and mining residential land, in accordance with the Chinese land resources classification system [57]. The map of land use types was obtained through the land reclassification and interpretation of the DRJ and LQ watersheds (Figure 3).
From the land use structure table (Table 3) and land use type map (Figure 3) of the DRJ and LQ watersheds, the most dominant land use types in both watersheds are forestland and cultivated land, accounting for 92.33% of the total area. Among them, the forestland occupies an absolutely dominant position, with an area of 923.88 km2, accounting for 80.69% of the total area, and the forestland is mainly distributed around Kitten Mountain on the upper reach of the watersheds. In addition, there are significant differences in human activities between the two watersheds. On both sides of the valley in the middle reaches of the DRJ River are mountain ranges, with only a small number of villages distributed and a sparse population. From about 8 km upstream of the intersection of DRJ and LQ, the terrain in the lower reaches becomes gentle and the population increases. The main stream of LQ flows through the urban areas of Xing’an County, Yanguan Town, and Rongjiang Town. The watershed has flat terrain with a large area of cultivated land, which covers an area of 133.22 km2, accounting for 11.64% of the total area, making it the second largest land use type in the study area. The next is grassland, covering an area of 53.25 km2, accounting for 4.65% of the total area. Due to the high intensity of resource development in surrounding communities, construction land is mainly distributed in the towns and villages around the study area. The area of urban and rural, industrial, and mining residential land is 17.66 km2, accounting for only 1.54% of the total area. The area occupied by water in the study area is relatively small, accounting for only 1.48%.

4.3.2. The FVCSF in Watersheds

Vegetation NPP represents the remaining part of the total organic matter accumulated by green plants through photosynthesis in unit time and unit area after deducting the consumption of autotrophic respiration. It is the total remaining amount of organic matter produced by plant photosynthesis and an important quantitative factor for regional ecological functions [58,59]. Remote sensing technology provides a new solution for obtaining large-scale vegetation data, and it can be used to estimate the biomass distribution of forest ecosystems in order to assess the carbon storage of large areas of forest ecosystems.
From Figure 4, it can be seen that the highest values of vegetation NPP in the DRJ and LQ watersheds are mainly distributed around Kitten Mountain on the upper reach of the basin, showing a decreasing trend in the middle and lower reaches. As the terrain in the middle and lower reaches gradually becomes gentler, there are villages scattered around, with more human activities, and the intensity of resource development is relatively high [60], leading to lower vegetation coverage. In addition, human activities, such as large-scale expansion of construction land, infrastructure construction, and agricultural cultivation, cause the destruction of vegetation growth. Under such strong human interference, the original vegetation is usually cleared off [61]. In addition, the dense buildings block sunlight and rainwater, making it impossible to provide sufficient light and water to support plant growth, resulting in a harsh environment for plants.
The FVCSF per unit area in the study area was calculated using the raster calculator in ArcGIS 10.8, as shown in Figure 5, and the highest FVCSF values in the study area are mainly distributed around Kitten Mountain in the upper reach and along the LQ watershed. This may be because the most elevated areas are mountainous forestland, and the strong weathering of rocks in the LQ watershed promotes the development of FVCS.
In addition, the zoning statistics in ArcGIS 10.8 were used for data statistics, as shown in Table 4. It is concluded that the annual FVCSF in DRJ and LQ watersheds is 680.78 × 10⁷ t·y−1 and 229.63 × 10⁷ t·y−1, respectively. Obviously, the FVCSF in the DRJ watershed is higher than that in the LQ watershed.

5. Discussion

5.1. Main Control Factors and Influence Factors of KCS in the Study Area

Water circulation in watersheds is usually considered the main control factor for KCSF [62]. Comparing the coefficients of variation of KCSF, [HCO3], and flow rate, it was found that the coefficients of KCSF and flow rate are generally close to each other. In addition, Figure 6 shows that the shape of the KCSF change curve is very similar to the shape of the flow rate curve. The change characteristics of the KCSF in DRJ and LQ watersheds are consistent with the flow change characteristics, showing a significant linear correlation (the determination coefficient R2 between KCSF and flow rate is close to 1); hence, the increase in flow rate caused by precipitation recharge has an important impact on the KCSF in DRJ and LQ watersheds.

5.1.1. The Effect of Rock Weathering

The chemical composition of river water generally comes from atmospheric input, water/rock interaction, and human activities [63,64,65]. The proportional distribution of cations in water samples in the study area can be used to distinguish the mineral composition of carbonate rocks (Figure 2). The data points are closer to the 100% side of the Ca2+ value, indicating the stronger weathering of calcite (CaCO3). In the anion proportion distribution diagram (Figure 2), the equivalent ratio of HCO3/SO42− is 1 and is close to the HCO3 side, indicating that carbonic acid plays an important role in carbonate rock weathering [66]. Therefore, it can be concluded that the main anions and cations HCO3 and Ca2+ in DRJ and LQ river water mainly come from rock weathering and are mainly affected by the dissolution of carbonate rocks by carbonic acid; hence, the HCO3 in the study area is mainly controlled by the lithology in the watersheds. Table 2 shows that the HCO3 concentration is higher in the LQ watershed than in the DRJ watershed in all seasons, and it can be concluded that the KCSF in the LQ watershed is higher than that in the DRJ watershed, indicating that the KCSF is affected by rock weathering. Definitely, compared with the seasonal changes in flow rate by an order of magnitude, the rate of seasonal changes in rock weathering is not significant, but it also has a certain impact on the development of KCS in the study area.

5.1.2. The Effect of Vegetation Coverage

Forest vegetation stimulates secondary precipitation in the forest area through transpiration, which significantly increases the precipitation in the forest area and can intercept and reduce heavy rainfall, effectively enhancing karstification and increasing KSCF [67]. In addition, CO2 + H2O is the driving force for plant photosynthesis and carbonate weathering and dissolution. Afforestation can not only increase the carbon sink of surface organisms but also increase underground KCSF. From shrubland to secondary forestland and to original forestland, the carbon sink produced by karstification can increase by 2–8 times [68]. KCS is largely affected by changes in land use and vegetation cover, which is because the carbon sink capacity of karst watersheds mainly depends on the water volume in the watershed and the CO2 source of dissolved rocks, and they are both closely related to vegetation cover. Most of the land surface is covered with soil, and the roots of vegetation can conserve water and increase the content of soil microorganisms. Thus, the decomposition of soil organic matter becomes faster, and the time of water-rock interaction becomes longer, causing the flow rate and [HCO3] to change to some degree, which in turn affects the KSCF [69].

5.2. Comparative Analysis of FVCS Differences in the Study Area

Comparing the KCSF and the FVCSF on the same order of magnitudes in the study area, it is found that the FVCSF of both DRJ and LQ watersheds is higher than their KCSF. However, when comparing the KCSF and FVCSF of the two watersheds, it can be found that the FVCSF is higher in the DRJ watershed than in the LQ watershed, which may be influenced by the vegetation coverage in the study area. By analyzing the influencing factors on the spatial distribution of vegetation carbon density in the karst area of Northwest Guangxi, it was found that the most important influencing factors on the spatial distribution of vegetation carbon density are land type, forest type, forest species, and vegetation type, which can be changed by anthropogenic activities (Zhang et al., 2013) [26]. In addition, it can also be seen from Figure 3 that the proportion of forest area in the DRJ watershed is higher than that in the LQ watershed. The KCSF is higher in the LQ watershed than in the DRJ watershed, which may be due to the larger proportion of carbonate rock in the LQ watershed since the carbonate rock area accounts for only 9% in the DRJ watershed.

5.3. Analysis of the Synergistic Effect between KCS and FVCS

As an important indicator of ecosystem function, NPP can not only reflect the growth status of vegetation but also be an important factor for judging the ecosystem sources and sinks of carbon and regulating ecological processes. The quantitative identification of its influence factors is of great significance for ecological restoration and regional sustainable development in karst areas [70]. By comparing the vegetation NPP map (Figure 4) and the FVCSF map (Figure 5) of DRJ and LQ watersheds, it can be found that the highest NPP values are mainly distributed around Kitten Mountain on the upper reach, while the highest FVCSF values are mainly distributed around Kitten Mountain in the upper reach and along the LQ watershed. That may be because the most elevated areas are mountainous forestland, and the strong weathering of rocks in the LQ watershed promotes the development of FVCS. Rock weathering has a certain influence on vegetation growth, and the karstification of carbonate rock promotes the growth of vegetation [71], which in turn affects the development of FVCS. In addition, plants can also promote carbonate rock weathering. Carbonic anhydrase and other organic matter secreted by plants can promote the weathering and dissolution of carbonate rocks, thus increasing the strength of KCS [72,73]. Therefore, it can be concluded that there is a certain synergistic effect between FVCS and KCS in the study area, and their synergistic effect is caused by rock weathering. In addition, the synergistic effect in the LQ watershed is more significant.

6. Conclusions

(1)
The hydrochemical characteristics of the watersheds show that the content of Ca2+ and Mg2+ in the DRJ and LQ watersheds is relatively high, indicating that the water is mainly affected by carbonate rock weathering. In addition, the data from the study area further showed that the KCSF in DRJ and LQ watersheds is 238.43 × 10⁵ t·y−1 and 353.44 × 10⁵ t·y−1, respectively. In terms of seasonal changes, the KCSF in DRJ and LQ watersheds shows the following pattern: spring > summer > autumn > winter, and summer > spring > winter > autumn, respectively. Overall, both watersheds exhibit a higher KCSF in the rainy season than in the dry season, and the KCSF change is mainly controlled by flow rate change.
(2)
The annual FVCSF in DRJ and LQ watersheds is 680.78 × 10⁷ t·y−1 and 229.63 × 10⁷ t·y−1, respectively. Comparing the FVCSF with the KCSF, it can be found that the FVCSF is higher than the KCSF in both watersheds. Comparing the two watersheds, it can be found that the FVCSF is higher in the DRJ watershed than in the LQ watershed, which is related to the vegetation coverage of the study area. However, the KCSF is higher in the LQ watershed than in the DRJ watershed, which may be due to the larger proportion of carbonate rocks in the LQ watershed.
(3)
It was found that rock weathering has a certain influence on the development of karst carbon sinks in the study area. In addition, the amount of carbon sequestered by forest vegetation is also affected by rock weathering, which may be related to the fact that the upstream area is mostly mountainous woodland, and the strong weathering of rocks in the Lingqu River Basin promotes the development of vegetation carbon sinks. Therefore, it can be inferred that there is a certain synergistic effect between FVCS and KCS in the study area, and such a synergistic effect is caused by rock weathering. In addition, the synergistic effect of FVCS and KCS is more significant in the LQ watershed.
(4)
The data show that there is a certain mutual promotion mechanism between the karst action of carbonate rocks and the growth of vegetation. The systematic measurement of karst carbon sinks and vegetation carbon sinks in the study area on a watershed basis and the clarification of their mechanisms and quantification of sequestration/sink enhancement processes based on the data from the observation of the karst carbon cycle and vegetation carbon cycle in the study area will help to provide a basis for the assessment of the potentials of carbon sinks in karst areas and the sensitivity of the response to global change under the background of the target of “two-carbon”. This will help to provide a basis for assessing the potential of carbon sinks in karst areas and the sensitivity of global change responses in the context of the “dual carbon” target.

Author Contributions

X.W. wrote the main manuscript text; S.Y., X.T. and X.Z. were responsible for the polishing of the article. All authors have read and agreed to the published version of the manuscript.

Funding

This study is jointly financed by the Natural Science Foundation of China GuangXi (2020GXNSFAA297266; GuikeAB21196050; GuikeAB22080046) and the National Natural Science Foundation of China (grant No. 42177075), Natural Resources Science and Technology Strategic Research Project (2023-ZL-23), and Survey and China Geological Survey (grant No. DD20221808 and No. DD20230547).

Data Availability Statement

The data comes from the author’s experimental results.

Acknowledgments

The authors gratefully acknowledge their funding for this research. At the same time, the authors are grateful to the anonymous reviewers and editors for their input and constructive comments.

Conflicts of Interest

The authors declare no conflicts of interest.

References

  1. Yang, H.; Ning, J.; Ma, Y.; Zhou, M.X.; Cao, J.H. Research progress on carbon cycle of karst vegetation in Southwest China. Guihaia 2022, 42, 903–913. [Google Scholar]
  2. Tang, X.; Zhao, X.; Bai, Y.; Tang, Z.; Wang, W.; Zhao, Y.; Wan, H.; Xie, Z.; Shi, X.; Wu, B.; et al. Carbon pools in China’s terrestrial ecosystems: New estimates based on an intensive field survey. Proc. Natl. Acad. Sci. USA 2018, 115, 4021–4026. [Google Scholar] [CrossRef] [PubMed]
  3. Wang, S.; Cui, Z.; Lin, J.J.; Xie, J.Y.; Su, K. The coupling relationship between urbanization and ecological resilience in the Pearl River Delta. J. Geogr. Sci. 2022, 32, 44–64. [Google Scholar] [CrossRef]
  4. Wang, C.; Zhang, Y.X. The realization path and policy system of the carbon neutral vision. Chin. J. Environ. Manag. 2020, 12, 58–64. [Google Scholar] [CrossRef] [PubMed]
  5. Bai, X.; Zhang, S.; Li, C.; Xiong, L.; Song, F.; Du, C.; Li, M.; Luo, Q.; Xue, Y.; Wang, S. A carbon-neutrality-capacity index for evaluating carbon sink contributions. Environ. Sci. Ecotechnol. 2023, 15, 100237. [Google Scholar] [CrossRef] [PubMed]
  6. Liu, Z.H. New progress and prospects in the study of rock-weathering-related carbon sinks. Chin. Sci. Bull. 2012, 57, 95–102. [Google Scholar] [CrossRef]
  7. White, A.F.; Buss, H.L. Natural Weathering Rates of Silicate Minerals. In Treatise on Geochemistry; The U.S. Geological Survey: Reston, VI, USA, 2013; pp. 115–155. [Google Scholar]
  8. China Future Research Society; China Society for Educational Development Strategies; College of Education, Peking University. Decision of the State Council on the Reform and Development of Basic Education. In Proceedings of the Fifth Forum of Chinese Scientists, Educators and Entrepreneurs; Standards Press of China: Beijing, China, 2006; pp. 151–159. [Google Scholar]
  9. Hou, N.; He, J.X.; Zhu, X.Q. Review of Research on Carbon Cycle of Terrestrial Ecosystems. Ecol. Econ. 2009, 10, 140–143. [Google Scholar]
  10. Wang, Q.F.; Liu, Y.H.; He, N.P.; Fang, H.J.; Fu, Y.L.; Yu, G.R. Demands and Key Scientific Issues in the Synthesis Research on Regional Terrestrial Ecosystem Carbon Budget in China. Prog. Geogr. 2012, 31, 78–87. [Google Scholar]
  11. Su, H.B.; Chen, X.J.; Wu, Y.L.; Xia, L.J.; Dai, F.Y.; Li, B.Z. Estimation of Vegetation Carbon Sinks in Jiangxi Province and Its Response to Climate Change. Acta Agric. Jiangxi 2023, 35, 127–135. [Google Scholar]
  12. Wei, Y.L.; Li, W.L.; Wang, L. The significance of karst carbon sink for carbon peak and carbon neutrality. China Min. Mag. 2022, 31, 212–214. [Google Scholar]
  13. Li, S.Q.; Gao, L.; Li, H.; Jiang, J.Y.; Huang, M.J.; Guo, M.; Zan, L.S. Study on spatial-temporal evolution and driving factors of forest vegetation carbon sequestration in state forest farms in Shaanxi Province. For. Econ. 2022, 44, 58–75. [Google Scholar]
  14. Zhang, L.; Wang, L.M.; Wang, R.B. Estimation of forest carbon storage and sequestration of shelterbelt in Upper And Middle Reaches of The Yangtze River. Resour. Environ. Yangtze Basin 2009, 18, 111–115. [Google Scholar]
  15. Zhang, Y.; Wu, L.L.; Su, F.; Yang, Z.G. Forest carbon sink research and carbon sink economy. Chin. J. Popul. Resour. Environ. 2010, 20, 288–291. [Google Scholar]
  16. Chen, W.H.; Cao, Z.J.; Wang, X.W. Game analysis of government supervision and forest farmers’ behavior in Forest Carbon Sequestration Reserve. Issues For. Econ. 2019, 39, 77–82. [Google Scholar]
  17. He, G.M.; Xu, B.; Wang, P.; Chen, S.Z. Analysis of forestry carbon sink trading development strategies under the background of the national unified carbon market. For. Econ. 2018, 40, 72–78. [Google Scholar]
  18. Huang, L.Y.; Dai, Y.W. The evolution of the frontiers of forestry finance research at home and abroad in the past 30 years: Based on the Visual Perspective of Knowledge Graph. Issues For. Econ. 2018, 38, 87–98+112. [Google Scholar]
  19. Li, X.X.; Pan, J.P. Comparative study on measurement methods of forest carbon sink. China For. Econ. 2020, 4, 96–97. [Google Scholar]
  20. Li, Y.W.; Bei, S.H. Thoughts on the development of carbon sequestration forestry in China. China For. Econ. 2020, 3, 42–45. [Google Scholar]
  21. Pan, R.; Shen, Y.Q.; Yang, H.; He, J.Y. Research of forest carbon sink demand in China. For. Econ. Issues 2020, 40, 14–20. [Google Scholar]
  22. Xiong, P. On the current situation development of forest carbon sink economy. China For. Econ. 2018, 2, 73–74. [Google Scholar]
  23. Brown, S.; Lugo, A.E. Biomass of Tropical Forests: A new estimate based on forest volumes. Science 1984, 223, 1290–1293. [Google Scholar] [CrossRef]
  24. Ketterings, Q.M.; Coe, R.; van Noordwijk, M.; Ambagau, Y.; Palm, C.A. Reducing uncertainty in the use of allometric biomass equations for predicting above-ground tree biomass in mixed secondary forests. For. Ecol. Manag. 2001, 146, 199–209. [Google Scholar] [CrossRef]
  25. Lan, X.; Du, H.; Song, T.Q.; Zeng, F.P.; Peng, W.X.; Liu, Y.X.; Fan, Z.L.; Zhang, J.Y. Carbon stock of major forest vegetation in Guangxi and its influencing factors. Ecol. Lett. 2019, 39, 2043–2053. [Google Scholar]
  26. Zhang, M.Y.; Wang, K.L.; Liu, H.Y.; Zhang, C.H.; Duan, Y.F. Vegetation carbon stock and density in Karst Area of Northwest Gui based on Remote Sensing Imagery. Chin. J. Ecol. Agric. 2013, 21, 1545–1553. [Google Scholar] [CrossRef]
  27. Huang, F.; Zhang, C.L.; Yang, H.; Cao, J.H.; Li, W.; Zhou, Y.C. Karst carbon cycle process at Watershed Scale: Karst process and carbon neutralization. Geol. Surv. China 2014, 1, 57–66. [Google Scholar]
  28. Yuan, D.X. Carbon cycle and global karst. Quat. Sci. 1993, 1, 1–6. [Google Scholar]
  29. Jiang, Z.C.; Zhang, C.; Luo, W.Q.; Xiao, Q.; Wu, Z.Y. Research progress and prospect of carbon sink in karst region of China. Carsologica Sin. 2022, 41, 345–355. [Google Scholar]
  30. Yuan, D.X. Progress in the Study on Karst Processes and Carbon Cycle. Adv. Earth Sci. 1999, 5, 425–432. [Google Scholar]
  31. Yuan, D.X. Carbon cycle and resource-environmental effects of the Earth system. Quat. Sci. 2001, 3, 223–232. [Google Scholar]
  32. Yuan, D.X.; Jiang, Z.C. Research progress of IGCP 379 Project “Karst Processes and the Carb on Cycles” in China. Hydrogeol. Eng. Geol. 2000, 1, 49–51. [Google Scholar]
  33. Wan, H.W.; Li, H.X.; Gao, J.X.; Sun, C.X.; Li, G.Y.; Gao, Y.H.; Li, Q. Study on the spatial pattern of carbon sequestration capacity enhancement potential of vegetation ecosystems in China. Ecol. Lett. 2022, 42, 8568–8580. [Google Scholar]
  34. Zhang, C. Carbonate rock dissolutio rates in different landuses and their carbon sink effect. Sci. Bull. 2011, 56, 2174–2180. [Google Scholar]
  35. Zhang, C.; Li, Y.H.; Wang, J.L.; Miao, Y.; Xiao, Q.; Guo, Y.L. Interface processes at Soil-Rock, Soil-Root Contacts and Subsoil Dissolution Rate in Shilin Geopark, Yunnan. Geol. Rev. 2020, 66, 1019–1030. [Google Scholar]
  36. Zhou, M.X.; Mo, B.Q.; Yang, H. Soil Karstification Intensity and Carbon Sink Effect of Plum Plantation in Karst Rocky Desertification Areas. Trans. Chin. Soc. Agric. Eng. 2020, 36, 116–123. [Google Scholar]
  37. Jiang, Z.C.; Jiang, X.Z.; Lei, M.T. Estimation of atmospheric CO2 sink of karst areas in China based on GIS and Limestone Tablet Loss Data. Carsologica Sin. 2000, 3, 16–21. [Google Scholar]
  38. Jiang, Z.C.; Yuan, D.X.; Cao, J.H.; Qin, X.Q.; He, S.Y.; Zhang, C. A study of carbon sink capacity of karst processes in China. Acta Geosci. Sin. 2012, 33, 129–134. [Google Scholar]
  39. Ni, J.; Luo, D.H.; Xia, J.; Zhang, Z.H.; Hu, G. Vegetation in karst terrain of southwestern China allocates more biomass to roots. Solid Earth 2015, 6, 799–810. [Google Scholar] [CrossRef]
  40. Wang, S.J.; Liu, Z.H.; Ni, J.; Yan, J.H.; Liu, X.M. A review of research progress and future prospective of carbon cycle in Karst Area of South China. Earth Environ. 2017, 45, 2–9. [Google Scholar]
  41. Hinggan County Local History Compilation Committee. Journal of Xing’an County (1991–2005); Wirecovered Books, Inc., 2013; pp. 93–99. [Google Scholar]
  42. Tang, Q.R. Xing’an County Water Conservancy Journal, County Journal. Guangxi People’s Publishing House: Nanning, China, 1999. [Google Scholar]
  43. Sun, P.A.; Yu, S.; Mo, F.Z.; He, S.Y.; Lu, J.F.; Yuan, Y.Q. Hydrochemical characteristics and influencing factors in different geological background: A case study in Darongjiang and Lingqu Basin, Guangxi, China. Environ. Sci. 2016, 37, 123–131. [Google Scholar]
  44. Liu, C.Y. Preliminary analysis of Minnan artificial afforestation technology and effects in Xing’an County, Guangxi. Agric. Technol. 2018, 38, 90–91. [Google Scholar]
  45. Xiao, Q.; Zhao, L.F.; Lu, L.M.; Sun, P.A.; Zhang, T.; Guo, Y.L. Spatial differences of soil physical and chemical properties in Darongjiang River Watershed. Carsologica Sin. 2021, 40, 815–824. [Google Scholar]
  46. Zhang, S.Y.; Xie, Q.; Huang, L.J.; Huang, Q.; Feng, X.Y.; Su, H.L. Niche analysis of main populations in Cyclobalanopsis glauca Community in Lingqu Basin of Guangxi, China. J. Guangxi Norm. Univ. 2021, 39, 162–173. [Google Scholar]
  47. Li, Z.J. Global Carbon Sink Estimates for Carbonate and Silicate Rock Weathering. Master’s Thesis, Guizhou Normal University, Guiyang, China, 2020. [Google Scholar]
  48. Li, B.; Yuan, D.X. Source-sink relationship between carbon cycle and atmospheric CO2 in karst areas—A case of karst areas in Guizhou (in English). China Karst. 1996, Z1, 47–55. [Google Scholar]
  49. Liu, M.Z.; Zhang, Y.X.; Chen, H.H. The studies on Carbon Cycle in Diaoshuihu Karst Regions of Jilin Province. Carsologica Sin. 1999, 2, 29–34. [Google Scholar]
  50. Liu, Z.H. Contribution of carbonate rock weathering to the atmospheric CO2 sink. Carsologica Sin. 2000, 4, 3–10. [Google Scholar]
  51. Liu, Z.H. Two important sinks of atmospheric CO2. Chin. Sci. Bull. 2000, 21, 2348–2351. [Google Scholar]
  52. Xu, S.Y.; Jiang, Z.C. Preliminary estimation of the Source-Sink relationship between Karstification and Atmospheric greenhouse gas CO2 in China. Chin. Sci. Bull. 1997, 9, 953–956. [Google Scholar]
  53. Chen, J.; Fan, W.; Li, D.; Liu, X.; Song, M. Driving factors of global carbon footprint pressure: Based on vegetation carbon sequestration. Appl. Energy 2020, 267, 114914. [Google Scholar] [CrossRef]
  54. Piper, A.M. A graphic procedure in the geochemical interpretation of water-analyses. Eos Trans. Am. Geophys. Union. 1944, 25, 914–928. [Google Scholar]
  55. Gibbs, R.J. Mechanisms controlling world water chemistry. Science 1970, 170, 1088–1090. [Google Scholar] [CrossRef]
  56. Liu, Z.; Dreybrodt, W.; Wang, H. A new direction in effective accounting for the atmospheric CO2 budget: Considering the combined action of carbonate dissolution, the global water cycle and photosynthetic uptake of DIC by aquatic organisms. Earth Sci. Rev. 2010, 99, 162–172. [Google Scholar] [CrossRef]
  57. Liu, J.Y.; Ning, J.; Kuang, W.H.; Xu, X.L.; Zhang, S.W.; Yan, C.Z.; Li, R.D.; Wu, S.X.; Hu, Y.F.; Du, G.M.; et al. Spatial and temporal patterns and new features of land use change in China, 2010–2015. J. Geogr. 2018, 73, 789–802. [Google Scholar]
  58. Field, C.B. Global net primary production: Combining ecology and remote sensing. Remote Sens. Environ. 1995, 51, 74–88. [Google Scholar] [CrossRef]
  59. Field, C.B.; Behrenfeld, M.J.; Randerson, J.T.; Falkowski, P.G. Primary production of the biosphere: Integrating terrestrial and oceanic components. Science 1998, 281, 237–240. [Google Scholar] [CrossRef] [PubMed]
  60. Yang, Y.D. Research on Sustainable Utilization of Water Resources in the Upper Reaches of the Lijiang River. Ph.D. Thesis, Central South University of Forestry and Technology, Changsha, China, 2005. [Google Scholar]
  61. Liu, S.L.; An, N.N.; Yin, Y.J.; Cheng, F.Y.; Dong, S.K. Relationship between Spatio-temporal Dynamics of Soil and Water Loss and NDVI of the Small Basins in the Middle Reaches of Lancang River based on SWAT Model. J. Soil Water Conserv. 2016, 30, 62–67. [Google Scholar]
  62. Zeng, C.; Liu, Z.H.; Zhao, M.; Yang, R. Hydrologically-driven variations in the karst-related carbon sink fluxes: Insights from high-resolution monitoring of three karst catchments in Southwest China. J. Hydrol. 2016, 533, 74–90. [Google Scholar] [CrossRef]
  63. Hindshaw, R.S.; Tipper, E.T.; Reynolds, B.C.; Lemarchand, E.; Bourdon, B. Hydrological control of stream water chemistry in a glacial catchment (Damma Glacier, Switzerland). Chem. Geol. 2011, 285, 215–230. [Google Scholar] [CrossRef]
  64. Ma, B.J.; Zhang, Q.F.; Li, S.Y. Characterization of water chemistry of transboundary rivers in China and its controlling factors. Quat. Stud. 2023, 43, 425–438. [Google Scholar]
  65. Abdullah, M.A.; Mohammed, Y.K.; Ahmed, A.A. Investigating the mineralogical and geochemical composition of fluvial sediments of Watari river system, Kano, Nigeria. Kuwait J. Sci. 2024, 51, 100151. [Google Scholar]
  66. Yan, Z.X.; Feng, M.Q. Hydrochemical characteristics and driving factors of surface water in the mining area of Changhe River Basin. Environ. Chem. 2022, 41, 632–642. [Google Scholar]
  67. Kang, Z.; Chen, J.; Yuan, D.; He, S.; Zhang, Q. Promotion function of forest vegetation on the water & carbon coupling cycle in karst critical zone: Insights from karst groundwater systems in South China. J. Hydrol. 2020, 125246. [Google Scholar]
  68. Zhang, M.; Yang, W.; Yang, M.; Yan, J. Guizhou Karst Carbon Sink and Sustainability—An Overview. Sustainability 2022, 14, 11518. [Google Scholar] [CrossRef]
  69. Yu, S.; Pu, J.B.; Liu, F.; Yang, H. Effect of vegetation on Carbon Sequestration in Karst Systems—A Critical Review. Earth Sci. Front. 2023, 30, 418–428. [Google Scholar]
  70. Dai, T.R.; Dai, X.A.; Lu, H.; He, T.; Li, W.L.; Li, C.; Huang, S.Q.; Huang, Y.Y.; Tong, C.B.; Qu, G.; et al. The impact of climate change and human activities on the change in the net primary productivity of vegetation-taking Sichuan Province as an example. Environ. Sci. Pollut. Res. Int. 2023, 31, 7514–7532. [Google Scholar] [CrossRef] [PubMed]
  71. Zhu, S.; Cao, J.H.; Yang, H.; Liang, J.H.; Lao, C.L. A review of the interaction mechanism and law between vegetation and rock geochemical background in Karst Areas. Rock Miner. Anal. 2023, 42, 59–71. [Google Scholar]
  72. Wang, C.; Li, W.; Shen, T.; Cheng, W.; Yan, Z.; Yu, L. Influence of soil bacteria and carbonic anhydrase on karstification intensity and regulatory factors in a typical karst area. Geoderma 2018, 313, 17–24. [Google Scholar] [CrossRef]
  73. Huang, Q.B. Study on Karst Carbon Sink Processes and Effects in Semi-Arid Karst Areas in Northern China. Ph.D. Thesis, China University of Geosciences, Wuhan, China, 2019. [Google Scholar]
Figure 1. Location map of the study area.
Water 16 01192 g001
Figure 2. Piper diagram of karst surface water in the study area.
Water 16 01192 g002
Figure 3. Land use types in DRJ and LQ watersheds.
Water 16 01192 g003
Figure 4. NPP of the DRJ and LQ watersheds.
Water 16 01192 g004
Figure 5. FVCSF in the DRJ and LQ watersheds.
Water 16 01192 g005
Figure 6. Linear relationship between flow rate and KCSF in DRJ and LQ watersheds.
Water 16 01192 g006
Table 1. Hydrochemical properties of DRJ and LQ watersheds.
Sampling PointParameterTemp./°CpHEC/μs·cm−1Cations and Anion in Water/mg·L−1
Ca2+K+Mg2+Na+ClSO42−HCO3NO3
DRJMax.25.768.14171.9026.090.982.412.963.9411.0779.298.16
Min.11.306.7943.605.520.540.700.382.965.4322.853.23
Avg.19.287.6878.1011.560.751.291.563.357.8140.205.43
CV0.260.050.500.510.200.400.610.090.230.460.26
LQMax.28.568.46318.0050.881.862.624.957.0020.89154.978.55
Min.10.327.57162.1027.810.981.340.543.6611.1779.965.42
Avg.20.298.09233.2139.201.342.052.565.1813.88116.217.16
CV0.310.030.210.200.200.200.600.230.180.180.12
Table 2. KCSF of DRJ and LQ watersheds.
TimeKCSF (t)HCO3 Concentration (mg/L)Flow Rate (m3/s)
DRJLQDRJLQDRJLQ
Spring115.36 × 105147.72 × 105153.74339.64290.70164.77
Average384.54 × 104492.40 × 10451.25113.2196.9054.92
Coefficient of variation0.500.710.410.280.530.69
Summer103.10 × 105203.03 × 10584.21319.29462.24231.80
Average343.68 × 104676.78 × 10428.07106.43154.0877.27
Coefficient of variation1.141.080.220.131.221.12
Autumn103.96 × 104571.51 × 10294.87366.0735.970.50
Average346.53 × 103190.50 × 10231.62122.0211.990.17
Coefficient of variation0.240.050.110.070.320.05
Winter95.41 × 104211.70 × 103149.65369.5122.382.11
Average318.04 × 103705.66 × 10249.88123.177.460.70
Coefficient of variation0.200.960.430.130.271.06
KCSFtotal (t·y−1)DRJ238.43 × 105LQ353.44 × 105
Table 3. Land use structure of DRJ and LQ watersheds.
TypeArea (km2)Percentage (%)
Cultivated land133.2211.64
Forest923.8880.69
Grassland53.254.65
Water16.941.48
Urban, rural, industrial, and mining residential lands17.661.54
Table 4. FVCSF in the DRJ and LQ watersheds.
ProjectUnit Area (g/m2)FVCSF (t·y−1)
DRJLQDRJLQ
Max.39,101.8950,852.388,205,613.046,134,352.98
Min.20,559.7319,103.604,314,503.442,304,478.68
Avg.18,542.1531,748.783,891,109.603,829,874.30
Sum324.41 × 105190.36 × 105680.78 × 107229.63 × 107
Disclaimer/Publisher’s Note: The statements, opinions and data contained in all publications are solely those of the individual author(s) and contributor(s) and not of MDPI and/or the editor(s). MDPI and/or the editor(s) disclaim responsibility for any injury to people or property resulting from any ideas, methods, instructions or products referred to in the content.

