Article

Wetland Creation and Reforestation of Legacy Surface Mines in the Central Appalachian Region (USA): A Potential Climate-Adaptation Approach for Pond-Breeding Amphibians?

1
Department of Forestry and Natural Resources, University of Kentucky, Lexington, KY 40546, USA
2
U.S. Geological Survey, Wetland and Aquatic Research Center, Davie, FL 33314, USA
3
Department of Biology, Indiana University of Pennsylvania, Indiana, PA 15705, USA
4
Appalachian Mountains Joint Venture, Blacksburg, VA 24060, USA
*
Author to whom correspondence should be addressed.
Water 2024, 16(9), 1202; https://doi.org/10.3390/w16091202
Submission received: 29 February 2024 / Revised: 26 March 2024 / Accepted: 27 March 2024 / Published: 23 April 2024
(This article belongs to the Special Issue Restoration of Wetlands for Climate Change Mitigation)

Abstract

:
Habitat restoration and creation within human-altered landscapes can buffer the impacts of climate change on wildlife. The Forestry Reclamation Approach (FRA) is a coal surface mine reclamation practice that enhances reforestation through soil decompaction and the planting of native trees. Recently, wetland creation has been coupled with FRA to increase habitat available for wildlife, including amphibians. Our objective was to evaluate the response of pond-breeding amphibians to the FRA by comparing species occupancy, richness, and abundance across two FRA age-classes (2–5-year and 8–11-year reclaimed forests), traditionally reclaimed sites that were left to naturally regenerate after mining, and in mature, unmined forests in the Monongahela National Forest (West Virginia, USA). We found that species richness and occupancy estimates did not differ across treatment types. Spotted Salamanders (Ambystoma maculatum) and Eastern Newts (Notophthalmus viridescens) had the greatest estimated abundances in wetlands in the older FRA treatment. Additionally, larger wetlands had greater abundances of Eastern Newts, Wood Frogs (Lithobates sylvaticus), and Green Frogs (L. clamitans) compared to smaller wetlands. Our results suggest that wetland creation and reforestation increases the number of breeding sites and promotes microhabitat and microclimate conditions that likely maximize the resilience of pond-breeding amphibians to anticipated climate changes in the study area.

1. Introduction

Habitat restoration and creation are commonly proposed adaptive management strategies to buffer the impacts of climate change on wildlife communities and populations [1]. These strategies maximize the resilience of communities and/or populations to environmental change through promoting habitat conditions that provide refugia for extant and future wildlife species [2,3]. Habitat restoration and creation are expensive activities that often require intensive management practices [4]. Unfortunately, resources to monitor wildlife response post-restoration are often limited. However, studies that examine wildlife responses to habitat restoration and creation can inform climate adaptation science and can provide important feedback to wildlife managers.
Amphibian populations have experienced significant declines in recent decades. As a result, amphibians are considered to be the most threatened class of vertebrates [5]. Most population declines are attributed to habitat loss and degradation exacerbated by the recent effects of climate change [5,6]. For pond-breeding amphibians, high rates of seasonally inundated wetland loss [7] and climate-driven changes to wetland hydroperiod pose significant limitations to reproductive success and population viability [8]. The creation of new wetlands could benefit pond-breeding amphibians by providing additional breeding sites across a landscape [9,10]. Furthermore, terrestrial habitat adjacent to wetlands is critical for the persistence of many pond-breeding species [11]. These terrestrial habitats provide microhabitats and microclimates suitable for activities during the non-breeding season such as foraging, overwintering, dispersing, and migrating [12]. As a result, the restoration of terrestrial habitat adjacent to created wetlands may be an important climate adaptation strategy for pond-breeding amphibians.
High elevation red spruce (Picea rubens) forest ecosystems in the Central Appalachians are inhabited by at least nine pond-breeding amphibian species [13], yet these forests are at risk due to resource extraction and climate change. Red spruce-dominated forests experienced range reductions from timber harvest in the late 1800s, followed by coal surface mining during the late 1900s [14]. In West Virginia (USA) alone, red spruce-dominated forests currently occupy approximately 10% of their historic range [14]. Additional range reductions are expected due to climate change, with an 85% reduction in red spruce-suitable habitat predicted for West Virginia by the year 2080 [15]. In addition to the direct impacts on forest composition and structure from climate change, changes in temperature and precipitation regimes will likely impact high elevation wetlands, given that their hydrology is highly dependent on snow melt and precipitation [16]. Consequently, the negative synergistic effects of habitat loss and climate change in these sensitive ecological areas is likely to decrease amphibian population size and distribution.
In response to the large-scale reduction of red spruce forest ecosystems in the Appalachians, land managers have implemented intensive forest restoration projects in degraded areas including reclamation efforts on legacy surface coal mines in the Central Appalachian region [17]. Specifically, the Forestry Reclamation Approach (FRA) has been used to restore red spruce-dominated forests on legacy minelands in the Monongahela National Forest (MNF), West Virginia. The FRA utilizes non-native vegetation removal, soil decompaction, woody debris loading, planting of native trees and shrubs, and creation of wetlands to restore ecosystem function to native forests [18,19,20]. By using best industry practices in forestry and restoration ecology, the FRA encourages the succession of native forests at faster rates compared to natural succession on sites reclaimed as grasslands [18] and therefore may establish forests more resilient to climate change. The FRA could also enhance habitat for pond-breeding amphibians by increasing breeding sites and microclimate and microhabitat refugia adjacent to breeding sites; however, amphibian communities and abundances on FRA sites and those in undisturbed forests have yet to be compared.
Herein, we assessed pond-breeding amphibian response to wetland creation and reforestation (via the FRA) on legacy surface mines in the MNF, West Virginia. Our first objective was to compare wetland attributes (e.g., size, canopy cover, water chemistry) across four forest treatments including younger FRA sites (i.e., those reclaimed 2–5 years ago); older FRA sites (i.e., those reclaimed 8–11 years ago); sites initially reclaimed as grasslands that were left to undergo natural forest succession; and unmined mature forests. Our second objective was to compare pond-breeding amphibian occupancy and species richness in wetlands across the four treatments. Finally, our third objective was to compare abundances of four commonly occurring amphibian species (Spotted Salamander (Ambystoma maculatum), Wood Frog (Lithobates sylvaticus), Green Frog (Lithobates clamitans), and Eastern Newt (Notophthalmus viridescens)) across the four treatment types. By examining wetland attributes, amphibian species occupancy, amphibian species richness, and species abundance across legacy surface mines, we aimed to assess the capacity of wetland creation and forest reclamation to improve habitat availability for pond-breeding amphibians. Given that climate change is expected to compound the effects of habitat loss for vulnerable amphibian populations in the Appalachians, active management techniques recommended by the FRA could dramatically improve prospects for declining species by establishing refugia within red spruce-dominated, montane forests.

2. Materials and Methods
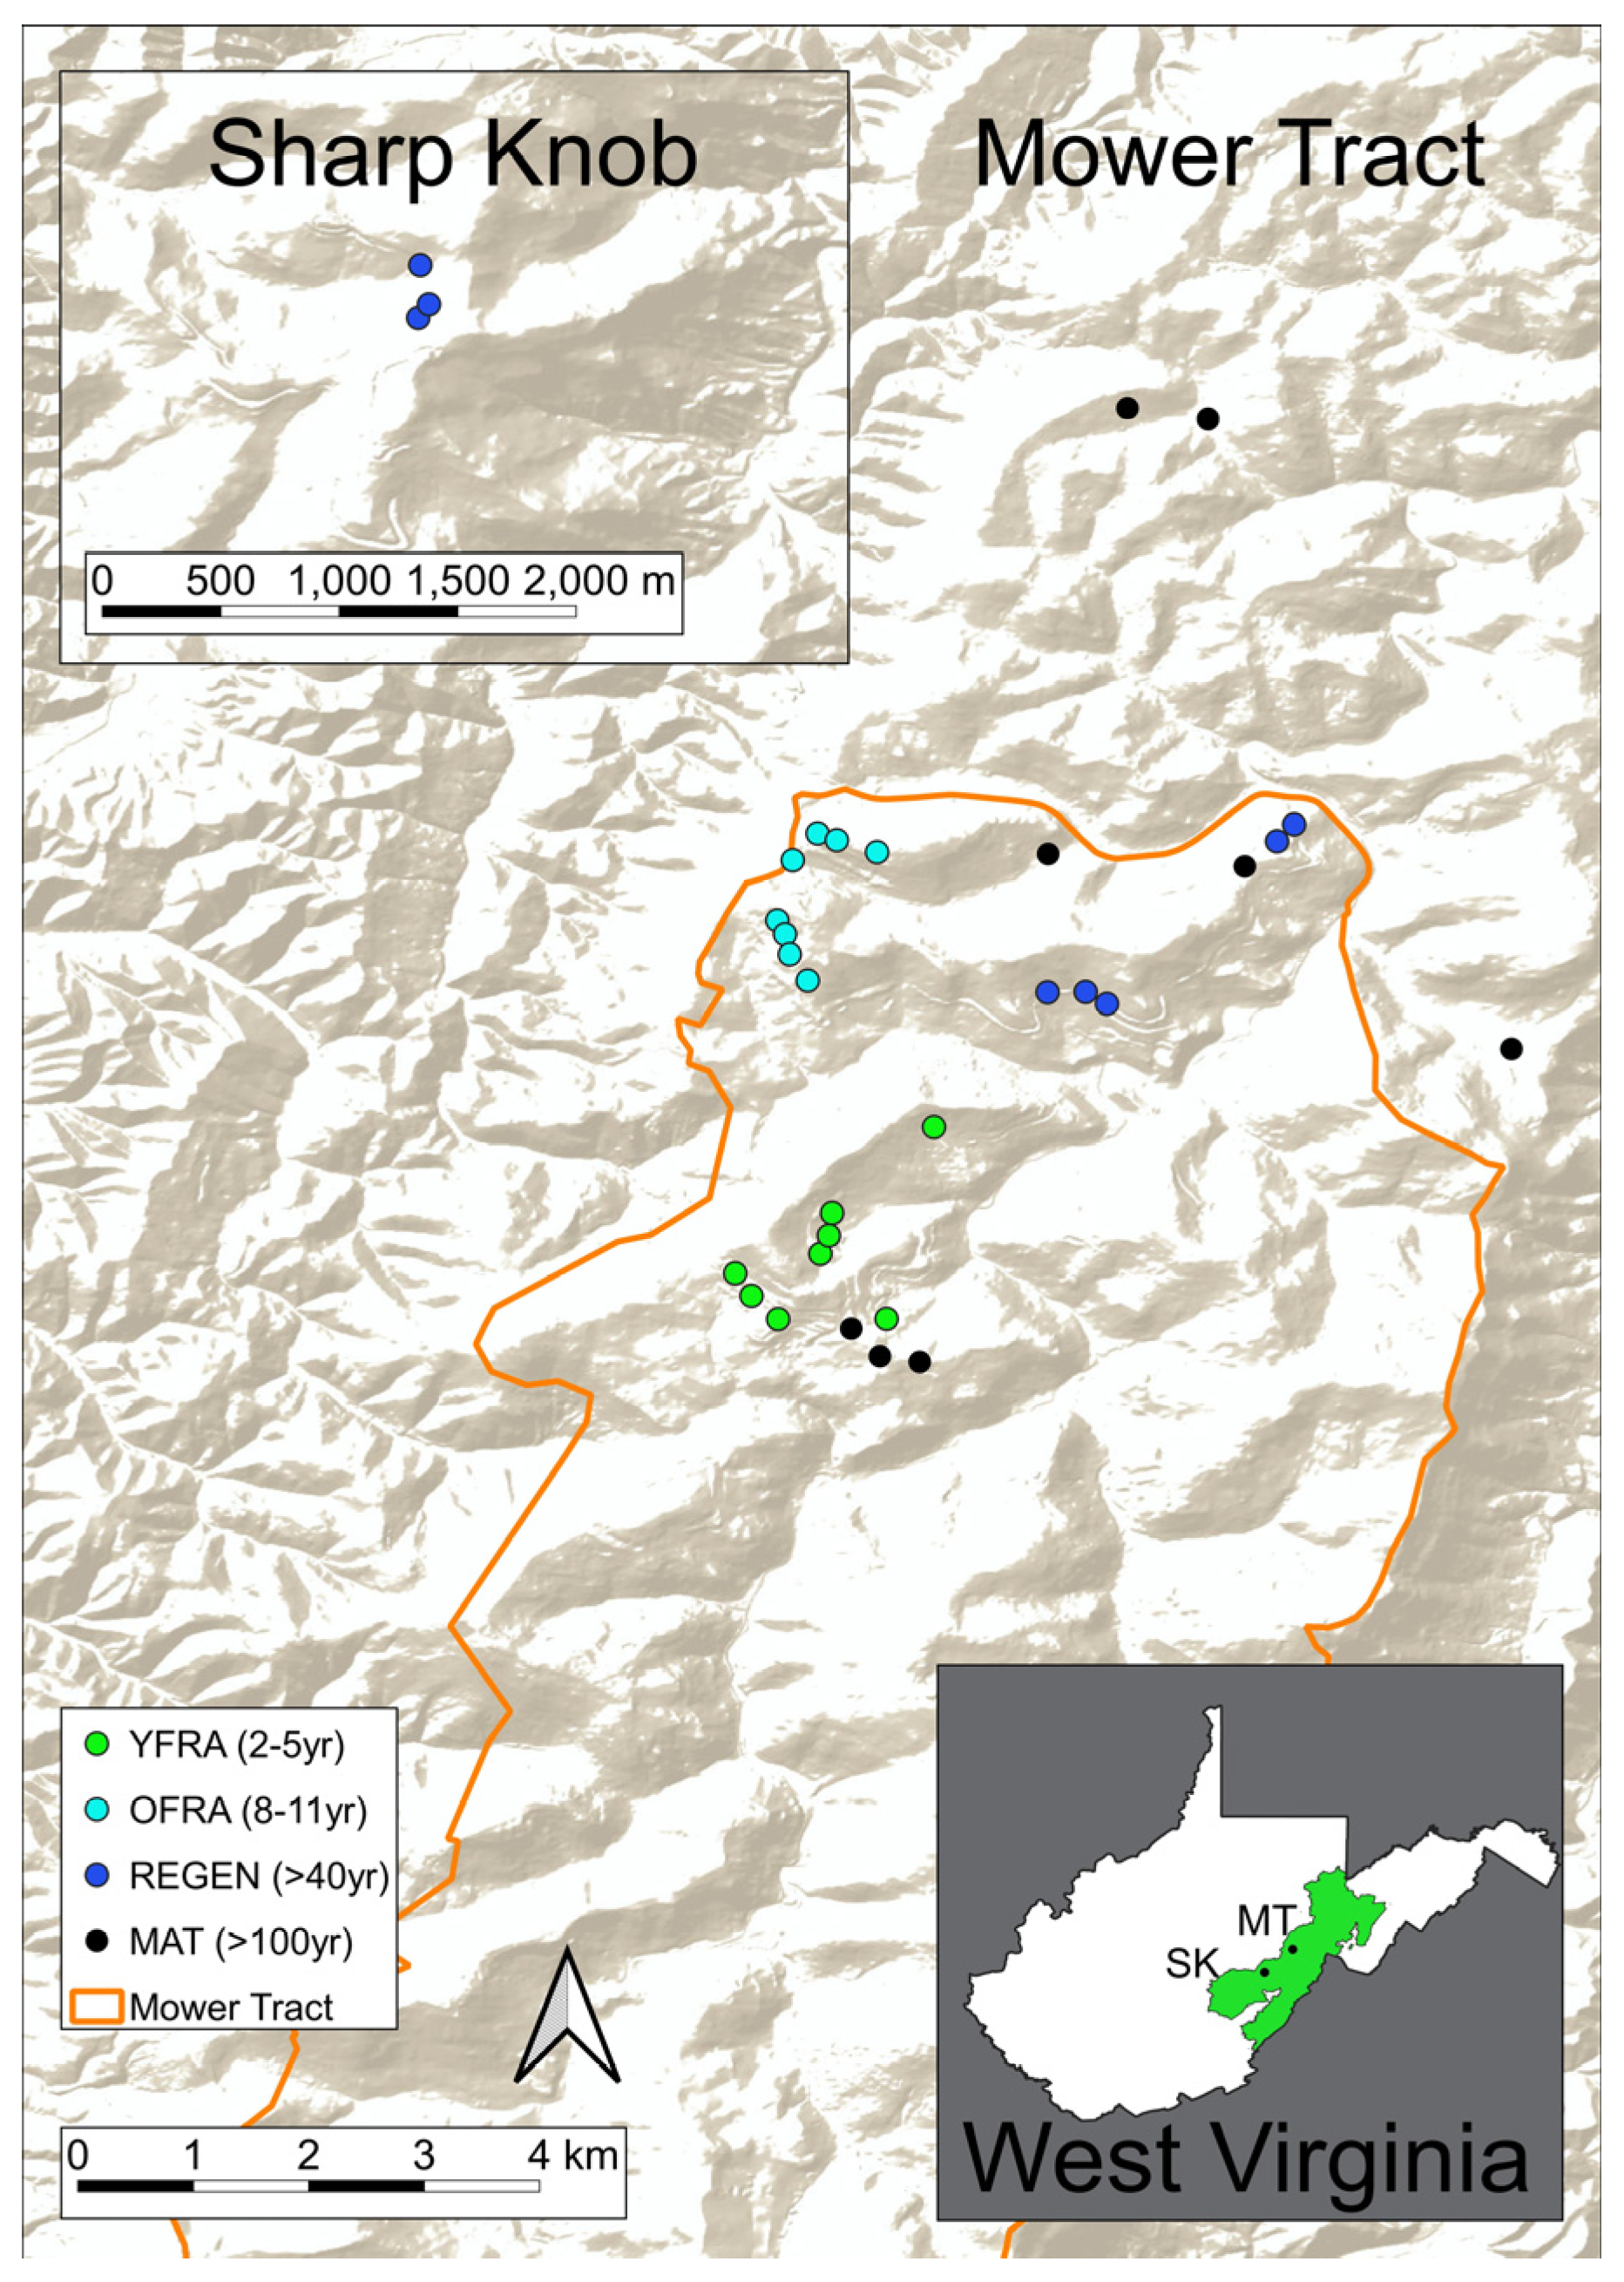
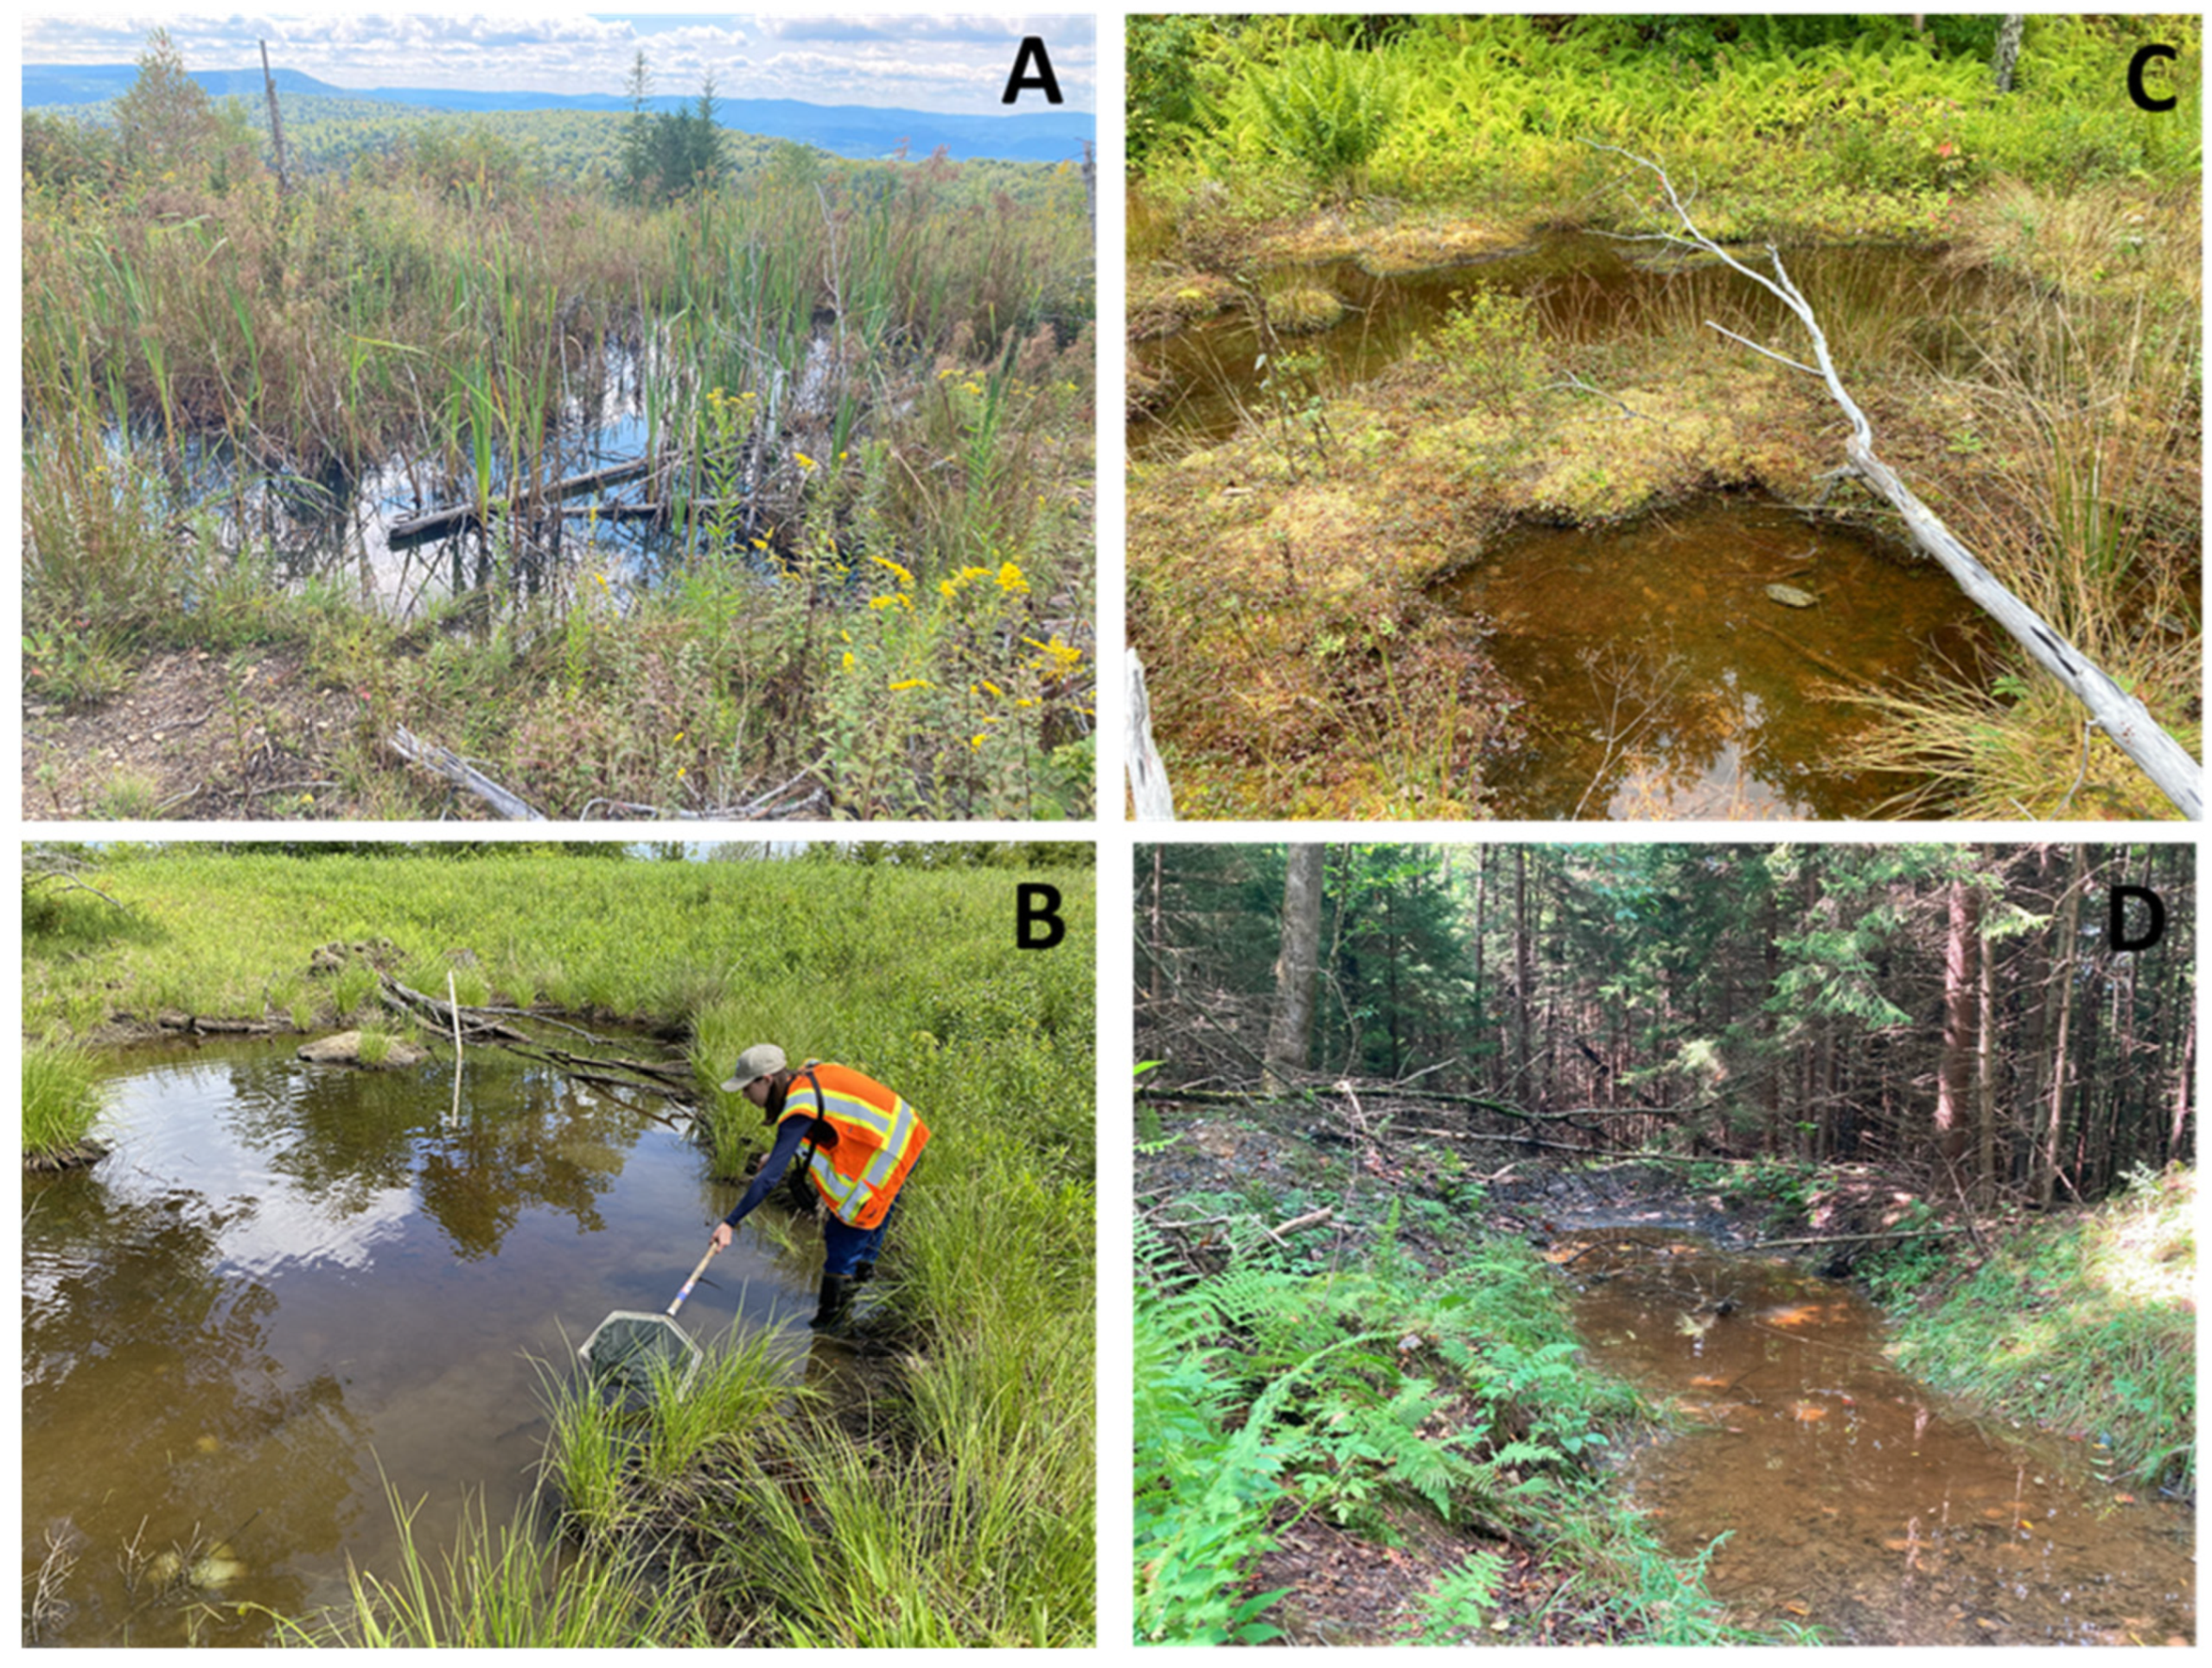
2.1. Study Sites

Study sites were located on legacy minelands at the Mower Tract (1478 m elevation; Randolph County) and Sharp Knob (1382 m elevation; Pocahontas County) in the MNF (Figure 1). Historically, our study area was characterized as red spruce–northern hardwood forest, with poor soils and a thick peat layer, and scattered, isolated wetlands [14]. The region is often immersed in cloud cover with a mean precipitation of 4140 mm/yr [14]. Our study sites experienced significant logging from the 1880s to the 1920s, followed by extensive surface coal mining in the 1970s and 1980s [14]. After mining, the land was recontoured and reclaimed as grassland via the planting of non-native species (i.e., tall fescue (Festuca arundinacea), sericea lespedeza (Lespedeza cuneata)). Native forests struggled to reestablish, leaving the landscape in a state of arrested succession [21]. Following grassland reclamation, the land was sold to the US Forest Service and incorporated as part of the MNF. Beginning in 2010, the US Forest Service partnered with Green Forests Work and the Appalachian Regional Reforestation Initiative to restore red spruce-northern hardwood forests using FRA on these legacy minelands. As part of the restoration plans, non-native species were removed, soils were decompacted using a deep ripping shank, coarse woody debris was loaded into the project areas, and over 800,000 native trees and shrubs were planted. In addition, approximately 800 shallow (<0.5 m), seasonal wetlands were created. See Lambert et al. [13] for more information on the project area.

2.2. Treatment Types

To examine amphibian response to restoration and wetland creation, we identified 32 wetlands located on or near legacy surface mines at the Mower Tract (n = 29) and Sharp Knob (n = 3) (Figure 1). We chose wetlands that often dry during late summer or fall (i.e., seasonally inundated wetlands), as these wetlands are generally devoid of many amphibian predators, particularly fish, and are considered a preferred breeding habitat for most pond-breeding amphibian species.
We selected wetlands within four treatment categories: younger FRA (YFRA) sites (2–5 years post-reclamation), older FRA (OFRA) sites (8–11 years post-reclamation), naturally regenerated (REGEN) sites (>40 years since mining) that were originally reclaimed as grasslands that were left to undergo natural forest succession, and unmined, mature (MAT) sites (Figure 2). YFRA sites were replanted with a mix of red spruce and native hardwoods between 2017 and 2020. Planted trees averaged < 1 m in height during data collection in 2022. Herbaceous species, including swamp milkweed (Asclepias incarnata) and boneset (Eupatorium perfoliatum), were planted around the constructed wetlands. OFRA sites were replanted with red spruce, aspen (Populus spp.), serviceberry (Amelanchier arborea), and black cherry (Prunus serotina) from 2011–2014. At the time of surveying in 2022, most of these planted seedlings were between 2–4 m high. We considered both YFRA and OFRA to be young successional forest as herbaceous plant cover was extensive both around the wetlands and within the surrounding uplands. All wetlands in FRA treatments were constructed during the site preparation (i.e., soil decompaction) and were created using a mid-sized excavator to create a depression in areas with clay or wet soils. Small berms surrounded created wetlands to promote inundation, and downed trees, other woody debris, and large rocks were placed in wetlands as habitat features. Woody debris was loaded in the terrestrial areas around wetlands. Naturally regenerated sites (REGEN) were mined prior to the Surface Mining Control and Reclamation Act of 1977 (SMCRA) and initially reclaimed as grasslands. These sites were located on coal mine benches between steep highwalls on flat, narrow strips of land with native forest adjacent to mined areas. The compacted soils at REGEN sites limited the growth of native trees, resulting in extensive herbaceous ground cover [19]. Non-native conifers (e.g., Norway spruce (Picea abies)) were planted at a few of the sites after initial grassland reclamation, resulting in partial or complete canopy closure over wetlands. Finally, MAT sites were wetlands within mature, second growth red spruce-northern hardwood forest that were not impacted by coal surface mining. Red spruce, yellow birch (Betula alleghaniensis), red maple (Acer rubrum), and beech (Fagus grandifolia) were the dominant tree species at the MAT sites.

2.3. Wetland Attributes

Prior to amphibian sampling, we collected several physical measurements at each wetland to examine how wetland dimensions, water chemistry, and canopy cover varied across treatment types. We measured wetland length and width at the widest points of the basin, and surface area (length × width). Canopy cover was estimated in the middle of June 2022 using a spherical crown densiometer (Forestry Suppliers, Jackson, MS, USA), calculated as the average of four measurements taken facing each cardinal direction while standing in the approximate center of the wetland. We collected a 100 mL water sample from each wetland on three occasions (~once per week) during the field season. Water samples were kept on ice in the field, and frozen until they were transported to the University of Kentucky Department of Forestry and Natural Resources Hydrology lab. All water samples were analyzed for turbidity (FTU), conductivity (μS cm−1), pH (H+), Total Organic Carbon (TOC (mg/L)), Cl (mg/L), SO4 (mg/L), NO3-N (mg/L), NH4-N (mg/L), Ca+2 (mg/L), Mg+2 (mg/L), K+ (mg/L), Na+ (mg/L), Mn (mg/L), Fe (mg/L), Al (mg/L), and NO2-N (mg/L). Water quality sampling, preservation, and analytic protocols were performed in accordance with standard methods [22].

2.4. Amphibian Surveys

We conducted dip net surveys for amphibians from 8 to 30 June 2022. Sweeps were performed according to the protocol of Denton and Richter [23], in which each sweep encompassed approximately 5 m of the wetland perimeter. To standardize the procedure, each wetland was measured to calculate the perimeter, which was then divided by 5. A 40 × 23 cm D-frame dip net was dragged across the bottom of the wetland for about one meter per sweep. The contents of the net were transferred into sorting bins, and all amphibian specimens were counted, identified to species, and returned to the wetland at the approximate location of capture. We could identify most individuals to species using adult or larval characteristics; however, members of the gray treefrog complex (i.e., Gray Treefrog (Hyla versicolor) and Cope’s Gray treefrog (H. chrysoscelis)) are identical in appearance and must be identified via genetics, cytology, or trill rate. Nocturnal audio recordings (unpublished data) confirmed that H. versicolor is the only member of the gray treefrog complex at our study sites. Each site was surveyed four times throughout the season (~once a week).

2.5. Data Analysis

2.5.1. Wetland Attributes

We performed an analysis of variance (ANOVA) in R (version 4.2.2; [24]) to examine differences among wetland attributes (i.e., wetland area, canopy cover, water chemistry) among our 4 treatment types (i.e., YFRA, OFRA, REGEN, MAT). Significance was assessed using an alpha level of 0.05. We performed a Tukey’s Honestly Significant Difference (HSD) test to further analyze significant differences detected by the ANOVA.

2.5.2. Multi-Species Occupancy Models

To examine the effect of treatment type and wetland area on amphibian occupancy and species richness, we used a Bayesian multi-species occupancy model [25,26]. This model generates mean occupancy across all species, occupancy estimates (Ψ) and detection probability (p) on a species-specific level, and species richness estimates (SpR) for each individual site and treatment type. The multi-species occupancy modeling approach combines single species estimates with the average parameter estimate for the entire community. This approach reduces bias and improves the precision of parameter estimates for species with few detections by borrowing information from species with more detections [27]. However, borrowing information is only appropriate for species that share ecological, functional, or behavioral relatedness [27]. We included all detected species in the same model because of their shared preference for using seasonally inundated wetlands as breeding habitat.
Detection/non-detection data were formatted into a matrix (i,j,k), where species i was detected at site j on sampling occasion k. Occupancy probability (Ψij) represented the probability of species i occurring at site j, modeled as a function of covariate parameters on α. Detection probability, pijk, represented the probability of detecting species i at site j on sampling occasion k, modeled as a function of covariate parameters on β. We modelled multi-species occupancy with the following equation:
logit(Ψij) = ui + α1i(YFRA)j + α2i(OFRA)j + α3i(REGEN)j + α4i(zArea)j
Detection probability was modeled on the following equation:
logit(ρijk) = vi + β1i(Date)j
Parameters α1i, α2i, α3i, were the effect of treatment types (YFRA, OFRA, and REGEN, respectively), with “MAT” serving as the reference category. Parameter α4i, was the effect of the continuous covariate area (i.e., wetland area), standardized to have a mean of zero. The parameter β1i was the effect of date on amphibian detection probability. We excluded canopy cover from our model as canopy cover was highly correlated with treatment type (see Section 3.1). We estimated species richness (SpR) for each study site by summing indicator variables for occupancy for each amphibian species at each site for each model iteration and generating a posterior predictive distribution for species richness in each treatment.
We used Markov chain Monte Carlo sampling within a Bayesian modelling framework [28]. Priors were uninformative and uniformly distributed with a minimum of −3 and a maximum of 3 (i.e., U(−3, 3) for α, β, and community-level parameters), and U(0, 5) for all standard deviation (σ) parameters. Three parallel chains were run, and convergence was assessed with the Gelman–Rubin statistic; all models were below 1.02, indicating model convergence [29]. Each chain was run for 200,000 iterations with a burn-in of 20,000 samples thinning rate of 3 (i.e., retained every 3rd sample). Thus, model output resulted in 60,000 samples and we summarized the posterior distribution, from which we calculated the mean, standard deviation, and 95% credible intervals (CI). We considered parameter estimates with credible intervals that did not contain zero as biologically meaningful variables informing occupancy and detection probability. We executed this model in Program R Version 4.2.2 [24] with package R2WinBUGS [30], which exports data into WinBUGS Version 1.4 [31].

2.5.3. N-Mixture (Abundance) Models

We used N-mixture models [32] to examine the effects of site-specific covariates (i.e., treatment type and wetland area) and the sampling covariate, date, on species-specific abundance. For this analysis, we estimated abundance of the four most commonly detected species, including Spotted Salamander, Wood Frog, Green Frog, and Eastern Newt. Using count data from our four replicate surveys (cij), we modeled counts as independent outcomes of binomial sampling with index Ni and detection probability pj. Site-specific abundances (λ) were modeled with a Poisson distribution, and heterogeneity in abundance among populations due to site covariates (xi) were modeled using a Poisson-regression formulation of local mean abundances as:
Nii ~ Poi(λi)
log(λi) = β1 + β2 (YFRA)i + β3 (OFRA)i + β4 (REGEN)i + β5 (zArea)i
We examined heterogeneity in detection (pi) due to sampling covariates (xij) as:
cij|Ni ~ bin (Ni, pij)
logit(pjj) = α1 + α2 (Date)j
Parameters β1, β2, β3, β4, and β5 were effect of treatment types (YFRA, OFRA, and REGEN, and zArea, respectively), with “MAT” serving as the reference category. The parameter α2 was the effect of date on amphibian detection probability.
Similar to the multi-species occupancy model, all models used uninformative priors. Specifically, β1, β2, β3, β4, and β5 ~ N(0, 102), α1 and α2 ~ N(0, 102). We used Markov chain Monte Carlo sampling, and three parallel chains were run for each species model; convergence was assessed with the Gelman–Rubin statistic to ensure all models were below 1.02 [29]. Each chain was run for 200,000 iterations with a burn-in of 100,000 samples, and thinning rate of 3. Thus, model output was 60,000 samples and we summarized the posterior distribution, from which we calculated the mean, standard deviation, and 95% CI. We executed this model in Program R Version 4.2.2 [24] with package R2WinBUGS [30], which exports data into WinBUGS version 1.4 [31].

3. Results

3.1. Wetland Attributes

Among the wetland attributes we measured, we found only three significant differences across treatment types (Table 1). Canopy cover percentages were different between the treatment types (F3,28 = 5.67, p = 0.004), with REGEN and MAT sites having significantly more canopy cover than the YFRA sites. The pH of the water was different among treatment types (F3,28 = 6.71, p = 0.001), with YFRA wetlands and OFRA wetlands having higher pH values than REGEN sites. We also found that TOC differed across treatment types (F3,28 = 3.76, p = 0.02), with OFRA sites having higher TOC than REGEN sites. Differences in aluminum concentrations between treatments were marginally significant (F3,28 = 2.87, p = 0.06). Wetland area did not differ between treatment types (F3,28 = 0.44, p = 0.73) and water chemistry variables that are often found to be elevated in surface waters on previously mined lands (i.e., conductivity (μS cm−1)) were not different across treatment types (Table 1).

3.2. Dipnet Surveys

We detected nine amphibian species during dipnet surveys, with 693 captures in YFRA, 651 captures in OFRA, 700 captures in REGEN, and 781 captures in MAT sites. The most commonly captured species was the Wood Frog (n = 1313 captures), followed by the Spotted Salamander (n = 368), Green Frog (n = 309), American Toad (Anaxyrus americanus; n = 296), Spring Peeper (Pseudacris crucifer; n = 224), Eastern Newt (n = 179), Gray Treefrog (n = 116), Four-toed Salamander (Hemidactylium scutatum; n = 19), and Pickerel Frog (L. palustris; n = 1). Most species were detected in all treatment types (Spotted Salamander, Four-toed Salamander, Green Frog, Wood Frog, Eastern Newt, and Spring Peeper); however American Toads were only detected in YFRA sites, Gray Treefrogs were detected in all treatment types except MAT, and the one Pickerel Frog was detected in OFRA. Overall, we documented eight species in created wetlands within the YFRA treatment, eight species in OFRA treatments, seven species in the REGEN treatment, and seven species in MAT treatment. We detected no federally protected amphibians or those considered a conservation priority by the state of West Virginia.

3.3. Occupancy and Species Richness

The mean amphibian occupancy for each treatment type with ΨYFRA = 0.50 (CI = 0.14, 0.86), ΨOFRA = 0.60 (CI = 0.22, 0.91), ΨREGEN = 0.45 (CI = 0.12, 0.83), and ΨMAT = 0.45 (CI = 0.15, 0.79)). The posterior distribution for wetland area (0.54 (CI = −0.07, 2.73)) indicated a mostly positive relationship, suggesting mean amphibian occupancy increased as wetland size increased. Mean amphibian detection was p = 0.49 (CI = 0.20, 0.78), and was not influenced by date (β1 = 0.15 (CI = −0.13, 0.44)).
We found few effects of treatment type or wetland area on species-specific occupancy (Table 2), yet occupancy estimates varied among species (Table 3). For example, Spotted Salamanders had high occupancy estimates at all treatment types (ΨYFRA = 0.79 (CI = 0.49, 0.96), ΨOFRA = 0.93 (CI = 0.78, 0.99), ΨREGEN = 0.821 (CI = 0.56, 0.97), and ΨMAT = 0.79 (CI = 0.39, 0.98)). The occupancy of Eastern Newts was also relatively high across treatments (ΨYFRA = 0.65 (CI = 0.32, 0.92), ΨOFRA = 0.87 (CI = 0.66, 0.98), ΨREGEN = 0.72 (CI = 0.43, 0.94), and ΨMAT = 0.62 (CI = 0.19, 0.95), whereas Wood Frogs occupancy estimates were relatively lower overall among treatments (ΨYFRA = 0.42 (CI = 0.15, 0.72), ΨOFRA = 0.47 (CI = 0.19, 0.76), ΨREGEN = 0.51 (CI = 0.23, 0.81), and ΨMAT = 0.37 (CI = 0.06, 0.80). Green Frog occupancy estimates had wide confidence intervals at all treatment types with ΨYFRA = 0.50 (CI = 0.19, 0.82), ΨOFRA = 0.61 (CI = 0.29, 0.89), ΨREGEN = 0.56 (CI = 0.28, 0.86), and ΨMAT = 0.47 (CI = 0.10, 0.89) and exhibited positive relationship to wetland area (α4 = 0.97 (CI = 0.20, 2.34)). For most species, date did not influence detection probability (Table 2). Mean species richness was similar across treatment type with SpRYFRA = 4.21 (CI = 3.13, 5.88), SpROFRA = 5.11 (CI = 4.00, 6.63), SpRREGEN = 4.37 (CI = 3.50, 5.75), and SpRMAT = 3.82 (CI = 2.88, 5.25).

3.4. Abundance

Treatment type and wetland area had varying influence on amphibian abundance (Figure 3 and Figure 4). The estimated abundance of Wood Frogs was positively associated with MAT (β1 = 3.80, (CI = 3.62, 3.90)) and wetland area (β5 = 0.32 (CI = 0.25, 0.38)) and negatively associated with YFRA (β2 = −2.66 (CI = −3.13, −2.23)) and OFRA (β3 = −0.84 (CI = −1.06, −0.63)). REGEN (β4 = −0.10 (CI = −0.28. 0.08)) did not influence Wood Frog abundance. Wood Frog mean per-individual detection was p = 0.44 (95% CI = 0.42, 0.47), and detection was primarily negatively influenced by date (α2 = −0.08 (95% CI = −0.22, 0.05). Abundance of Green Frogs was positively associated with MAT (β1 = 1.46 (CI = 99, 1.88)) and wetland area (β5 = 1.08 (CI = 0.94, 1.24)), and negatively associated with YFRA (β2 = −1.77 (CI = −2.7, −0.93)) and OFRA (β3 = −0.67 (CI = −1.3, −0.04)). The estimated abundance of Green Frogs was not affected by REGEN (β3 = 0.37 (CI = −0.10, 0.86)). The mean per-individual detection probability for Green Frogs was p = 0.28 (95% CI = 0.19, 0.36), and detection was primarily positively influenced by date (α2 = 0.35 (95% CI = −0.03, 0.73). The estimated abundance of Spotted Salamanders was positively associated with MAT (β1 = 2.41 (CI = 2.06, 2.77)) and OFRA (β3 = 0.63 (CI = 0.27, 0.99)), and negatively associated with YFRA (β2 = −0.43 (CI = −0.88, −0.001)) and REGEN (β3 = −0.43 (CI = −0.88, 0.00)). Mean per-individual detection probability for Spotted Salamanders was p = 0.24 (95% CI = 0.18, 0.30), and detection was marginally influenced by date (α2 = 0.14 (95% CI = −0.04, 0.34). The abundance of Eastern Newts was positively associated with MAT (β1 = 1.35 (CI = 0.65, 2.16)), OFRA (β3 = 1.12 (CI = 0.53, 1.75)) and wetland area (β5 = 0.63 (CI = 0.45, 0.81)). YFRA (β2 = −0.04 (CI = −0.79, 0.71)) and REGEN (β3 = −0.28 (CI = −0.98, 0.44)) did not influence Eastern Newt abundance. Mean per-individual detection probability for Eastern Newts was p = 0.18 (95% CI = 0.10, 0.30), and detection generally increased as date increased (α2 = 0.27 (95% CI = −0.03, 0.58).

4. Discussion

The reforestation of surface mines and wetland creation provides habitat for multiple pond-breeding amphibian species in our study area. Few differences in wetland attributes were identified between created wetlands at sites restored via the FRA compared to wetlands on naturally regenerating mine lands (REGEN) and in mature, unmined forests (MAT). Amphibian species occupancy and richness also did not differ across treatment types; however, for amphibian abundance, treatment and wetland area effects varied by species. Estimated abundances for most species exhibited a positive association with MAT sites and wetland area, and a negative association with YFRA (except Eastern Newts). However Spotted Salamander and Eastern Newt abundances had positive associations with OFRA sites and were most abundant in these treatment types. Overall, our results indicate that the FRA coupled with wetland creation present a plausible climate adaptation strategy for pond-breeding amphibians.
In general, the wetland attribute analyses showed similar physical conditions and water chemistry between constructed wetlands and naturally occurring wetlands in our study area. We found significant differences in canopy cover between treatments, with YFRA sites having the least canopy due to being replanted 2–5 years prior to this study. Only two water chemistry variables were different across treatments (i.e., TOC, pH), and these values were within a normal range for created and natural wetlands in our study area [13]. The lower mean pH in REGEN and MAT sites is likely due to the deposition of acidic conifer needles from planted Norway spruce in REGEN sites or red spruce in MAT sites [33], and from decades of acid deposition that have lowered soil and water pHs across the Monongahela National Forest [34]. The slightly higher pH at FRA sites could also be attributed to the nature of some of the freshly plowed spoils exposing unweathered rock that can leach ions when exposed to water; this has been shown to exhibit circumneutral pH levels [35]. We found that OFRA sites had significantly higher levels of TOC than REGEN sites. This result was unexpected as REGEN sites have higher percentages of canopy cover and elevated TOC levels are often the result of decaying plant matter [36]. Site preparation techniques may explain these differences in TOC, as logs were placed in created wetlands during the restoration process, and wetland edges were planted with native wetland shrubs and plants. The logs originated from downed non-native conifers in the project area. While logs were used in both YFRA and OFRA sites, logs in the YFRA were relatively green when sampled whereas those in the OFRA showed considerable decomposition which likely contributed to the elevated TOC. Across FRA treatments, we found marginally significant differences in mean concentrations of Al, an element which is toxic to amphibians at low pH values [37,38]. However, mean Al concentrations did not exceed the Lithobates mean chronic value (>10,684 µg/L) [39] and Al is insoluble in water with pH values > 5.5 [40], which is lower than the pH values found at our sites. Finally, we noted that conductivity did not differ across treatments. Conductivity is often elevated in aquatic systems on previously mined lands [41], and elevated conductivity is correlated with reductions in stream-inhabiting amphibian occupancy and abundance [42]. Our study wetlands had mean conductivity levels substantially lower than wetlands on reclaimed minelands in Kansas (USA) [43], and we found that conductivity levels were well below the U.S. Environmental Protection Agency conductivity benchmark of 300 μS cm−1 for aquatic life in the Central Appalachian region [44].
We found that pond-breeding amphibian species occupancy and richness did not differ among treatment types. Although relatively few studies have been conducted on pond-breeding amphibian occupancy and richness in post-mining landscapes, our results generally support previous findings. For example, Stiles et al. [45] found that pond-breeding amphibian communities inhabiting a reclaimed surface mine in Indiana (USA) had over 15,000 individuals belonging to 14 species; the diversity and abundance they attributed to the presence of a variety of wetland types and terrestrial habitat that allowed successful colonization and reproductive success. Pond-breeding amphibian community composition and species occupancy was also found to be comparable among wetlands regardless of mining history in Kansas (USA) [43]. Finally, a previous investigation examined pond-breeding amphibian occupancy across four wetland age classes (2, 4, 6, 8 years post-construction) in our study area and found that high mean occupancy rates for Spotted Salamanders (i.e., ~0.7 across all age classes) and occupancy rates for Green Frogs in 4-year-old wetlands were ~1.00 [13]. Overall, the lack of influence by treatment type indicates that constructed wetlands on FRA sites supported similar communities to wetlands on naturally regenerating mine lands (REGEN) and wetlands in mature forests (MAT) in our study area. Collectively, these studies and our own indicate restoration creates habitat for amphibians, which might increase resiliency to climate change through increased habitat availability.
Despite similarities in occupancy and community composition, we found that pond-breeding amphibian abundances varied across treatment types. Estimated abundances of all four focal species were positively associated with MAT sites, which was expected as MAT sites did not experience past mining activities. In addition, estimated abundance of Wood Frogs and Green Frogs were reduced at YFRA and OFRA sites compared to MAT sites, whereas estimated abundances of Spotted Salamanders and Eastern Newts were greatest in OFRA sites. Several mechanisms may explain the variability in abundances. First, older wetlands allow more time for species colonization, which could lead to increased abundances in older wetlands [46]. We found estimated abundances of most species were negatively associated with YFRA and positively associated with MAT treatment. However, if wetland age was an important factor determining abundance, we would have expected to find an effect of REGEN as wetlands within this treatment were on mined lands dating to the pre-SMCRA (i.e., pre-1977) era. Furthermore, Eastern Newts and Spotted Salamanders exhibited greatest estimated abundances in OFRA treatment, with wetland ages ranging from 8–11 yrs. Thus, a second explanation may relate to predation by Spotted Salamander larvae and Eastern Newts on tadpoles. Spotted Salamander larvae prey on a wide variety of anuran tadpoles [47], and Eastern Newts are known to limit Wood Frog reproductive success via consumption of Wood Frog eggs [48]. Both Spotted Salamanders and Eastern Newts were most abundant in OFRA treatments, and it is possible that these salamander species may lead to reductions in some anurans in this treatment type. Finally, we note that abundances of pond-breeding amphibians exhibit significant inter-annual variability [49], and therefore monitoring that extends beyond a single sampling season may be necessary to elucidate the drivers of abundance.
The covariate with the most consistent influence on species occupancy and abundance was wetland area. Wetland area had a positive effect on Green Frog occupancy and abundance and Wood Frog and Eastern Newt abundance. Previous studies have also highlighted the relationship between larger wetlands and increased occupancy rates and abundance [13,50,51]. Specifically, seasonal wetlands that range from 1000–10,000 m2 support the greatest number of species [51,52], because the larger wetland size leads to decreased inter-and intra-species competition and overall stress [53]. The wetlands at our study site ranged from 4.7 m2 to 233.2 m2, suggesting that creating larger seasonal wetlands during restoration activities may promote higher occupancy rates and greater amphibian abundances.
We acknowledge that several unmeasured environmental attributes may partially explain patterns of pond-breeding amphibian occupancy and abundances. For instance, wetland vegetation cover has been shown to negatively influence occupancy rates of Spotted Salamanders and Green Frogs, while positively influencing the abundance of Eastern Newts [13]. Wetland vegetation serves as important egg deposition locations and offers larvae cover from predators, but the decomposition of wetland plants can reduce oxygen levels in wetlands and/or produce phytochemicals that increase larval mortality and decrease growth rates (reviewed in [54]). Landscape and spatial configuration of created wetlands can also influence amphibian occupancy and abundance, as wetlands constructed close to existing habitat may lead to higher colonization rates whereas spatially isolated wetlands often have lower colonization rates [55]. Our reclamation activities occurred within national forest boundaries, and this likely aided colonization rates for amphibians. Nevertheless, reclamation techniques used at our study sites, such as woody debris loading and the creation of over 800 wetlands, likely provided terrestrial refugia, promoted habitat connectivity, and facilitated colonization of created wetlands.

5. Conclusions

Climate change poses a severe threat to red spruce ecosystems in the Central Appalachians, and a significant reduction in spruce-suitable conditions is predicted within the next several decades under even conservative climate change models [15]. Thus, time is limited for the reestablishment of spruce-dominated forests and associated plant and animal communities. In general, our results indicate that the FRA coupled with wetland creation restores habitat for pond-breeding amphibians within a relatively short timeframe (<10 yrs). The strong amphibian community response at our study sites was likely due to: (1) the high density of created, seasonal wetlands (>800) resulting in more breeding opportunities; and (2) site preparation techniques, including soil decompaction, woody debris loading, and tree planting, that (a) promote microhabitats and microclimate refugia for amphibians during the non-breeding season, and (b) facilitate movement (i.e., dispersal, migration) that leads to successful colonization of newly created wetlands. We acknowledge that the long-term persistence of amphibians in our study area may not be ensured if changes to temperature or precipitation cross species’ physiological thresholds. Nonetheless, our findings suggest that reforestation of surface mines along with wetland creation provides contemporary habitat (breeding sites, microhabitat, and microclimate conditions), which may maximize the resilience of pond-breeding amphibian populations to anticipated climate changes in the Central Appalachians.

Author Contributions

Conceptualization, C.D.B., J.J.C., J.L.L., T.F. and S.J.P.; data curation, L.S. and S.J.P.; formal analysis, L.S., J.C.G., R.N.D. and S.J.P.; funding acquisition, C.D.B., J.J.C., J.L.L., T.F. and S.J.P.; investigation, L.S., C.D.B., R.N.D., J.J.C., J.L.L., J.C.N. and S.J.P.; methodology, L.S., C.D.B., J.C.G., R.N.D., J.J.C., J.L.L., T.F., J.C.N. and S.J.P.; project administration, S.J.P.; writing—original draft, L.S. and S.J.P.; writing—review and editing, C.D.B., J.C.G., R.N.D., J.J.C., J.L.L., T.F. and J.C.N. All authors have read and agreed to the published version of the manuscript.

Funding

Funding for this project came from the Office of Surface Mining Reclamation and Enforcement Applied Science Grant Program (Grant#: S21AC10048), the McIntire Stennis Capacity Grant Program (#KY009040), and the Department of Forestry and Natural Resources at the University of Kentucky.

Data Availability Statement

Pending acceptance, amphibian presence/absence and count data, site and survey covariates, and R and WinBUGS code are available from Dryad Digital Repository (Sherman et al. https://doi.org/10.5061/dryad.866t1g1zf).

Acknowledgments

Anna Branduzzi, Victoria Burgess, Todd Kuntz, and Madoline Varias assisted with data collection and site selection. Millie Hamilton analyzed water samples. Traci DuBose provided a review of an earlier version of this manuscript. Any use of trade, firm, or product names is for descriptive purposes only and does not imply endorsement by the United States Government.

Conflicts of Interest

The authors declare no conflicts of interest.

References

  1. LeDee, O.E.; Handler, S.D.; Hoving, C.L.; Swanston, C.W.; Zuckerberg, B. Preparing wildlife for climate change: How far have we come? J. Wildl. Manag. 2021, 85, 7–16. [Google Scholar] [CrossRef]
  2. Mawdsley, J.R.; O’Malley, R.; Ojima, D.S. A review of climate-change adaptation strategies for wildlife management and biodiversity conservation. Conserv. Biol. 2009, 23, 1080–1089. [Google Scholar] [CrossRef] [PubMed]
  3. Handler, S.D.; Ledee, O.E.; Hoving, C.L.; Zuckerberg, B.; Swanston, C.W. A menu of climate change adaptation actions for terrestrial wildlife management. Wildl. Soc. Bull. 2002, 46, e1331. [Google Scholar] [CrossRef]
  4. Fischlin, A.; Midgley, G.F.; Price, J.; Leemans, R.; Gopal, B.; Turley, C.; Rounsevell, M.; Dube, P.; Tarazona, J.; Velichko, A. Ecosystems, their properties, goods and services. In Climate Change 2007: Impacts, Adaptation and Vulnerability; Parry, M.L., Canziani, O.F., Palutikof, J.P., van der Linden, P.J., Hanson, C.E., Eds.; Cambridge University Press: Cambridge, UK, 2007; pp. 211–272. [Google Scholar]
  5. Luedtke, J.A.; Chanson, J.; Neam, K.; Hobin, L.; Maciel, A.O.; Catenazzi, A.; Borzée, A.; Hamidy, A.; Aowphol, A.; Jean, A.; et al. Ongoing declines for the world’s amphibians in the face of emerging threats. Nature 2023, 622, 308–314. [Google Scholar] [CrossRef] [PubMed]
  6. Sodhi, N.S.; Bickford, D.; Diesmos, A.C.; Lee, T.M.; Koh, L.P.; Brook, B.W.; Sekercioglu, C.H.; Bradshaw, C.J. Measuring the meltdown: Drivers of global amphibian extinction and decline. PLoS ONE 2008, 3, e1636. [Google Scholar] [CrossRef]
  7. Calhoun, A.J.; Mushet, D.M.; Bell, K.P.; Boix, D.; Fitzsimons, J.A.; Isselin-Nondedeu, F. Temporary wetlands: Challenges and solutions to conserving a ‘disappearing’ ecosystem. Biol. Conserv. 2017, 211, 3–11. [Google Scholar] [CrossRef]
  8. Walls, S.C.; Barichivich, W.J.; Brown, M.E. Drought, deluge and declines: The impact of precipitation extremes on amphibians in a changing climate. Biology 2013, 2, 399–418. [Google Scholar] [CrossRef]
  9. Shoo, L.P.; Olson, D.H.; McMenamin, S.K.; Murray, K.A.; Van Sluys, M.; Donnelly, M.A.; Stratford, D.; Terhivuo, J.; Merino-Viteri, A.; Herbert, S.M. Engineering a future for amphibians under climate change. J. Appl. Ecol. 2011, 48, 487–492. [Google Scholar] [CrossRef]
  10. Miller, D.A.W.; Campbell Grant, E.H.; Muths, E.; Amburgey, S.M.; Adams, M.J.; Joseph, M.B.; Waddle, J.H.; Johnson, P.T.J.; Ryan, M.E.; Schmidt, B.R.; et al. Quantifying climate sensitivity and climate driven change in North American amphibian communities. Nat. Commun. 2018, 9, 3926. [Google Scholar] [CrossRef]
  11. Semlitsch, R.D.; Bodie, J.R. Biological criteria for buffer zones around wetlands and riparian habitats for amphibians and reptiles. Conserv. Biol. 2003, 17, 1219–1228. [Google Scholar] [CrossRef]
  12. Semlitsch, R.D. Principles for management of aquatic-breeding amphibians. J. Wildl. Manag. 2000, 64, 615–631. [Google Scholar] [CrossRef]
  13. Lambert, M.; Drayer, A.N.; Leuenberger, W.; Price, S.J.; Barton, C. Evaluation of created wetlands as amphibian habitat on a reforested surface mine. Ecol. Eng. 2021, 171, 106386. [Google Scholar] [CrossRef]
  14. Byers, E.A.; Vanderhorst, V.P.; Streets, B.P. Classification and conservation assessment of upland red spruce communities in West Virginia. In West Virginia Natural Heritage Program; WVDNR: Elkins, WV, USA, 2010. [Google Scholar]
  15. Beane, N.R.; Rentch, J.S. Using known occurrences to model suitable habitat for a rare forest type in West Virginia under select climate change scenarios. Ecol. Restor. 2015, 33, 178–189. [Google Scholar] [CrossRef]
  16. Burkett, V.; Kusler, J. Climate change: Potential impacts and interactions in wetlands of the United States 1. J. Am. Water Resour. Assoc. 2000, 36, 313–320. [Google Scholar] [CrossRef]
  17. Rhodes, B. Evaluating Restoration Outcomes: Red Spruce Reforestation in the West Virginia Highlands. Master’s Thesis, University of Kentucky, Lexington, KY, USA, 2022. [Google Scholar]
  18. Burger, J.; Zipper, C.; Angel, P.; Hall, N.; Skousen, J.; Barton, C.; Eggerud, S. Establishing Native Trees on Legacy Surface Mines, Forest Reclamation Advisory No. 11; US Department of Interior Office of Surface Mining: Washington, DC, USA, 2013.
  19. Branduzzi, A.M.; Barton, C.D.; Lovell, A. First-year survival of native wetland plants in created vernal pools on an Appalachian surface mine. Ecol. Restor. 2020, 38, 70–73. [Google Scholar] [CrossRef]
  20. Branduzzi, A.M.; Barton, C.D.; Baskin, C.C.; Davis, A.G. Evaluating the use of woody debris to enhance native plant establishment from seeds on legacy coal mines in West Virginia (USA). Nat. Plants 2022, 23, 273–287. [Google Scholar] [CrossRef]
  21. Groninger, J.; Skousen, J.; Angel, P.; Barton, C.; Burger, J.; Zipper, C. Chapter 8: Mine reclamation practices to enhance forest development through natural succession. In The Forestry Reclamation Approach: Guide to Successful Reforestation of Mined Lands; Adams, M., Ed.; Gen. Tech. Rep. NRS-169; Department of Agriculture, Forest Service, Northern Research Station: Newtown Square, PA, USA, 2007; pp. 8-1–8-7. [Google Scholar]
  22. Greenberg, A.E.; Clesceri, L.S.; Eaton, A.D. Standard Methods for the Examination of Water and Wastewater, 18th ed.; American Public Health Association: Washington, DC, USA, 1992. [Google Scholar]
  23. Denton, R.D.; Richter, S.C. Amphibian communities in natural and constructed ridge top wetlands with implications for wetland construction. J. Wildl. Manag. 2013, 77, 886–896. [Google Scholar] [CrossRef]
  24. R Core Team. R: A Language and Environment for Statistical Computing; R Foundation for Statistical Computing: Vienna, Austria, 2022; Available online: https://www.R-project.org/ (accessed on 13 April 2024).
  25. MacKenzie, D.I.; Nichols, J.D.; Royle, J.A.; Pollock, K.H.; Bailey, L.; Hines, J.E. Occupancy Estimation and Modeling: Inferring Patterns and Dynamics of Species Occurrence; Elsevier: Amsterdam, The Netherlands, 2017. [Google Scholar]
  26. Zipkin, E.F.; DeWan, A.; Royle, A.J. Impacts of forest fragmentation on species richness: A hierarchical approach to community modelling. J. Appl. Ecol. 2009, 46, 815–822. [Google Scholar] [CrossRef]
  27. Pacifici, K.; Zipkin, E.F.; Collazo, J.A.; Irizarry, J.I.; DeWan, A. Guidelines for a priori grouping of species in hierarchical community models. Ecol. Evol. 2014, 4, 877–888. [Google Scholar] [CrossRef] [PubMed]
  28. Link, W.A.; Cam, E.; Nichols, J.D.; Cooch, E.G. Of BUGS and birds: Markov chain Monte Carlo for hierarchical modeling in wildlife research. J. Wildl. Manag. 2002, 66, 277–291. [Google Scholar] [CrossRef]
  29. Gelman, A.; Rubin, D.B. Inference from iterative simulation using multiple sequences. Stat. Sci. 1992, 7, 457–472. [Google Scholar] [CrossRef]
  30. Sturtz, S.; Ligges, U.; Gelman, A. R2WinBUGS: A Package for Running WinBUGS from R. J. Stat. Soft. 2005, 12, 1–16. [Google Scholar] [CrossRef]
  31. Spiegelhalter, D.J.; Thomas, A.; Best, N.; Lunn, D. WinBUGS Version 1.4; MRC Biostatistics Unit: Cambridge, UK, 2003. [Google Scholar]
  32. Royle, J.A. N-mixture models for estimating population size from spatially replicated counts. Biometrics 2004, 60, 108–115. [Google Scholar] [CrossRef]
  33. Hughes, J. Freshwater Ecology and Conservation: Approaches and Techniques; Oxford University Press: Oxford, UK, 2018. [Google Scholar]
  34. Elias, P.E.; Burger, J.A.; Adams, M.B. Acid deposition effects on forest composition and growth on the Monongahela National Forest, West Virginia. For. Ecol. Manag. 2009, 258, 2175–2182. [Google Scholar] [CrossRef]
  35. Agouridis, C.T.; Angel, P.N.; Taylor, T.J.; Barton, C.D.; Warner, R.C.; Yu, X.; Wood, C. Water quality characteristics of discharge from reforested loose-dumped mine spoil in eastern Kentucky. J. Environ. Qual. 2012, 41, 454–468. [Google Scholar] [CrossRef]
  36. Ahn, C.; Jones, S. Assessing organic matter and organic carbon contents in soils of created mitigation wetlands in Virginia. Environ. Eng. Res. 2013, 18, 151–156. [Google Scholar] [CrossRef]
  37. Freda, J. The influence of acidic pond water on amphibians: A review. Water Air Soil Poll. 1986, 30, 439–450. [Google Scholar] [CrossRef]
  38. Freda, J. The effects of aluminum and other metals on amphibians. Environ. Pollut. 1991, 71, 305–328. [Google Scholar] [CrossRef]
  39. US EPA (U.S. Environmental Protection Agency) Final Aquatic Life Ambient Water Quality Criteria for Aluminum. 2018. Available online: https://www.epa.gov/sites/default/files/2018-12/documents/aluminum-final-national-recommended-awqc.pdf (accessed on 13 April 2024).
  40. Lindsay, W.L.; Walthall, P.M. The solubility of aluminum in soils. In The Environmental Chemistry of Aluminum; Sposito, G., Ed.; CRC Press: Boca Raton, FL, USA, 2020; pp. 333–361. [Google Scholar]
  41. Lindberg, T.T.; Bernhardt, E.S.; Bier, R.; Helton, A.M.; Merola, R.B.; Wengosh, A.; DiGiulio, R.T. Cumulative impacts of mountaintop mining on an Appalachian watershed. Proc. Natl. Acad. Sci. USA 2011, 108, 20929–20934. [Google Scholar] [CrossRef]
  42. Hutton, J.M.; Price, S.J.; Bonner, S.J.; Richter, S.C.; Barton, C.D. Occupancy and abundance of stream salamanders along a specific conductance gradient. Freshw. Sci. 2020, 39, 433–446. [Google Scholar] [CrossRef]
  43. Buckardt, E.M.; Rega-Brodsky, C.C.; George, A.D. Post-mined wetlands provide breeding habitat for amphibians. Wetlands 2023, 43, 75. [Google Scholar] [CrossRef]
  44. US EPA (U.S. Environmental Protection Agency). A Field-Based Aquatic Life Benchmark for Conductivity in Central Appalachian Streams; EPA/600/R-10/023F; National Center for Environmental Assessment, Office of Research and Development, U.S. Environmental Protection Agency: Washington, DC, USA, 2011.
  45. Stiles, R.M.; Swan, J.W.; Klemish, J.L.; Lannoo, M.J. Amphibian habitat creation on postindustrial landscapes: A case study in a reclaimed coal strip-mine area. Can. J. Zool. 2017, 95, 67–73. [Google Scholar] [CrossRef]
  46. Laan, R.; Verboom, B. Effects of pool size and isolation on amphibian communities. Biol. Conserv. 1990, 54, 251–262. [Google Scholar] [CrossRef]
  47. Resetarits, W.J., Jr.; Wilbur, H.M. Choice of oviposition site by Hyla chrysoscelis: Role of predators and competitors. Ecology 1989, 70, 220–228. [Google Scholar] [CrossRef]
  48. Kross, C.S.; Richter, S.C. Species interactions in constructed wetlands result in population sinks for wood frogs (Lithobates sylvaticus) while benefiting eastern newts (Notophthalmus viridescens). Wetlands 2016, 36, 385–393. [Google Scholar] [CrossRef]
  49. Marsh, D.M. Fluctuations in amphibian populations: A meta-analysis. Biol. Conserv. 2001, 101, 327–335. [Google Scholar] [CrossRef]
  50. Drayer, A.N.; Guzy, J.C.; Caro, R.; Price, S.J. Created wetlands managed for hydroperiod provide habitat for amphibians in Western Kentucky, USA. Wetl. Ecol. Manag. 2020, 28, 543–558. [Google Scholar] [CrossRef]
  51. Semlitsch, R.D.; Peterman, W.E.; Anderson, T.L.; Drake, D.L.; Ousterhout, B.H. Intermediate pond sizes contain the highest density, richness, and diversity of pond-breeding amphibians. PLoS ONE 2015, 10, e0123055. [Google Scholar] [CrossRef]
  52. Babbitt, K.J. The relative importance of wetland size and hydroperiod for amphibians in southern New Hampshire, USA. Wetl. Ecol. Manag. 2005, 13, 269–279. [Google Scholar] [CrossRef]
  53. Millikin, A.R.; Woodley, S.K.; Davis, D.R.; Anderson, J.T. Habitat characteristics in created vernal pools impact spotted salamander water-borne corticosterone levels. Wetlands 2019, 39, 803–814. [Google Scholar] [CrossRef]
  54. Burrow, A.; Maerz, J. How plants affect amphibian populations. Biol. Rev. 2022, 97, 1749–1767. [Google Scholar] [CrossRef]
  55. Sawatzky, M.E.; Martin, A.E.; Fahrig, L. Landscape context is more important than wetland buffers for farmland amphibians. Agric. Ecosyst. Environ. 2019, 269, 97–106. [Google Scholar] [CrossRef]
Figure 1. Locations of wetlands (n = 32) surveyed for amphibians in the Monongahela National Forest (West Virginia USA). Larger map shows sites located in the Mower Tract (MT; Randolph County) the inset map shows sites located at Sharp Knob (SK; Pocahontas County). Wetland attributes were collected and amphibian surveys were conducted in 32 sites, including eight sites recently restored using the Forestry Reclamation Approach (i.e., YFRA; 2–5 years old), eight older FRA (OFRA) sites (8–11 years old), eight wetlands in naturally regenerated (REGEN) minelands (>40 years old), and eight natural wetlands in unmined, mature (MAT) forest sites.
Water 16 01202 g001
Figure 2. Examples of treatment types and wetlands in the Monongahela National Forest (West Virginia, USA). Wetland attributes and amphibian data were collected at (A) 2–5 year old sites restored via the Forestry Reclamation Approach; (B) 8–11 year old sites restored via the Forestry Reclamation Approach; (C) wetlands in naturally regenerated (REGEN) minelands (>40 years old); and (D) wetlands in unmined, mature (MAT) forests.
Water 16 01202 g002
Figure 3. Estimated mean abundance (bars) of (A) Wood Frogs (Lithobates sylvaticus), (B) Spotted Salamanders (Ambystoma maculatum), (C) Green Frogs (Lithobates clamitans), and (D) Eastern Newts (Notophthalmus viridescens) in wetlands across four treatment types in the Monongahela National Forest (West Virginia USA). Amphibian count data were collected at 2–5-year old sites restored via the Forestry Reclamation Approach (YFRA), 8–11-year old sites restored via the Forestry Reclamation Approach (OFRA), wetlands in naturally regenerated (REGEN) minelands (>40 years old), and wetlands in unmined, mature (MAT) forests. Error bars indicate 95% credible intervals.
Water 16 01202 g003
Figure 4. Effects of wetland area (m2) on estimated mean abundance (solid lines) of (A) Green Frogs (Lithobates clamitans) and (B) Eastern Newts (Notophthalmus viridescens) in created wetlands on sites restored via the Forestry Reclamation Approach, wetlands in naturally regenerated minelands (>40 years old), and wetlands in unmined, mature forests and natural wetlands in the Monongahela National Forest (West Virginia USA). Dashed lines indicate 95% credible intervals.
Water 16 01202 g004
Table 1. ANOVA p-values, F-statistics, and average values of all site attributes and chemistry data collected in recently created wetlands on sites restored 2–5 years ago via the Forestry Reclamation Approach (YFRA), created wetlands in sites restored 8–11 years ago via the Forestry Reclamation Approach (OFRA), wetlands in naturally regenerated (REGEN) minelands (>40 years old), and wetlands in unmined, mature (MAT) forests. Superscript letters (i.e., a, b) represent the Tukey’s Honestly Significant Difference groupings.
Variablep-ValueF-StatYFRAOFRAREGENMAT
Wetland Area (m2)0.7290.43657.99 a71.63 a81.66 a49.66 a
Canopy Cover (%)0.0045.670 b10.45 ab53.68 a54.75 a
Conductivity (μS cm−1)0.3161.2344.4 a52.09 a23.24 a33.39 a
pH (H+)0.0016.716.74 a6.78 a5.77 b6.15 ab
NO3-N (mg L−1)0.40710.002 a0 a0 a0 a
Turbidity (FTU)0.3281.28.57 a4.02 a6.35 a2.88 a
TOC (mg L−1)0.0223.763.75 ab4.31 a2.73 b3.19 ab
Ca (mg L−1)0.470.874.77 a6.78 a1.78 a5.14 a
Mg (mg L−1)0.1312.043.04 a2.78 a1.03 a0.49 a
Fe (mg L−1)0.3971.021.74 a3.9 a7.81 a1.74 a
NO2-N (mg L−1)0.1791.760.29 a0.2 a0.42 a0.39 a
Al (mg L−1)0.0542.870.15 a0.1 a0.68 a0.3 a
Na (mg L−1)0.5050.80.75 a0.56 a0.55 a0.83 a
Mn (mg L−1)0.2611.4100.31 a1.02 a0.99 a0.13 a
K (mg L−1)0.1172.151.39 a1.39 a0.76 a0.67 a
Cl (mg L−1)0.1721.7900.67 a0.7 a0.71 a1.04 a
NH4-N (mg L−1)0.5690.6850.02 a0.01 a0.1 a0.01 a
SO4 (mg L−1)0.1881.714.77 a2.23 a2.74 a2.42 a
Table 2. Mean parameter estimates (α) and 95% credible intervals for occupancy of nine pond-breeding amphibian species. Amphibians were sampled in recently created wetlands on sites restored via the Forestry Reclamation Approach (2–5-year old (YFRA) and 8–11-year (OFRA), wetlands in naturally regenerated (REGEN) minelands (>40 years old), and wetlands in unmined, mature (MAT) forests. Bold values indicate treatment types or covariates influencing amphibian occupancy and detection (i.e., 95% CIs that do not contain zero).
SpeciesYFRAOFRAREGENMATWetland AreaDate
Anaxyrus americanus0.90 (−0.76, 2.73)0.24 (−2.12, 1.90)−0.24 (−2.30, 1.35)−3.38 (−6.48, −0.25)−0.01 (−1.68, 0.87)0.15 (−0.14, 0.44)
Ambystoma maculatum−0.42 (−2.34, 1.21)1.05 (−0.53, 2.71)−0.17 (−1.89, 1.33)1.68 (−1.15, 4.83)0.63 (−0.18, 1.78)0.19 (0.01, 0.58)
Hemidactylium scutatum0.15 (−2.05, 2.32)0.61 (−1.62, 2.50)0.25 (−1.46, 2.23)1.62 (−2.29, 5.93)0.52 (−0.51, 1.76)0.22 (−0.40, 0.67)
Hyla versicolor0.93 (−0.62, 2.66)1.09 (−0.34, 2.64)−0.26 (−2.09, 1.18)−1.42 (−4.29, 1.55)0.51 (−0.24, 1.40)0.12 (−0.12, 0.53)
Lithobates clamitans−0.09 (−1.79, 1.40)0.41 (−1.28, 1.87)0.24 (−1.14, 1.80)−0.13 (−2.8, 2.69)0.97 (0.20, 2.34)0.08 (−0.35, 0.42)
Lithobates palustris0.02 (−2.32, 2.15)0.81 (−1.18, 2.58)−0.11 (−2.22, 1.74)−1.05 (−6.28, 5.72)0.53 (−0.80, 2.01)0.18 (−0.33, 0.78)
Lithobates sylvaticus0.08 (−1.46, 1.53)0.30 (−1.37, 1.69)0.46 (−0.88, 2.10)−0.66 (−3.28, 1.99)0.34 (−0.37, 1.00)0.07 (−0.42, 0.44)
Notophthalmus viridescens−0.14 (−1.89, 1.40)1.29 (−0.20, 2.82)0.20 (−1.23, 1.79)0.63 (−2.08, 3.65)0.73 (−0.02, 1.94)0.2 (−0.13, 0.59)
Pseudacris crucifer0.49 (−1.15, 2.30)0.60 (−1.07, 2.08)−0.22 (−2.06, 1.24)−1.90 (−4.80, 0.97)0.63 (−0.07, 1.53)0.15 (−0.28, 0.59)
Table 3. Mean estimated occupancy (Ψ) and 95% credible intervals of nine amphibian species across four treatment types. Amphibians were sampled in recently created wetlands on sites restored via the Forestry Reclamation Approach (2–5-year old (YFRA) and 8–11-year (OFRA)), in wetlands in naturally regenerated (REGEN) minelands (>40 years old), and in wetlands within unmined, mature (MAT) forests.
SpeciesΨYFRAΨOFRAΨREGENΨMAT
Anaxyrus americanus0.12 (0.02, 0.36)0.08 (0.01, 0.25)0.05 (0.003, 0.18)0.06 (0.003, 0.25)
Ambystoma maculatum0.79 (0.49, 0.96)0.93 (0.79, 0.99)0.82 (0.55, 0.97)0.79 (0.39, 0.98)
Hemidactylium scutatum0.79 (0.29, 0.99)0.85 (0.36, 0.99)0.83 (0.41, 0.99)0.74 (0.18, 0.99)
Hyla versicolor0.44 (0.15, 0.79)0.48 (0.18, 0.82)0.22 (0.04, 0.55)0.24 (0.03, 0.70)
Lithobates clamitans0.50 (0.19, 0.82)0.61 (0.29, 0.89)0.58 (0.28, 0.86)0.47 (0.10, 0.89)
Lithobates palustris0.38 (0.01, 0.99)0.46 (0.02, 0.99)0.37 (0.01, 0.99)0.36 (0.004, 0.99)
Lithobates sylvaticus0.42 (0.15, 0.72)0.47 (0.19, 0.76)0.51 (0.23, 0.81)0.37 (0.06, 0.80)
Notophthalmus viridescens0.65 (0.32, 0.92)0.87 (0.66, 0.98)0.72 (0.43, 0.94)0.62 (0.19, 0.95)
Pseudacris crucifer0.26 (0.05, 0.63)0.28 (0.07, 0.58)0.16 (0.02, 0.41)0.18 (0.02, 0.57)
Disclaimer/Publisher’s Note: The statements, opinions and data contained in all publications are solely those of the individual author(s) and contributor(s) and not of MDPI and/or the editor(s). MDPI and/or the editor(s) disclaim responsibility for any injury to people or property resulting from any ideas, methods, instructions or products referred to in the content.

