
The Hydrogeochemistry of and Earthquake-Related Chemical Variations in the Springs along the Eastern Kunlun Fault Zone, China
 ,
,
Abstract
:1. Introduction
2. Geological Setting


3. Sampling and Methods
4. Results
5. Discussion
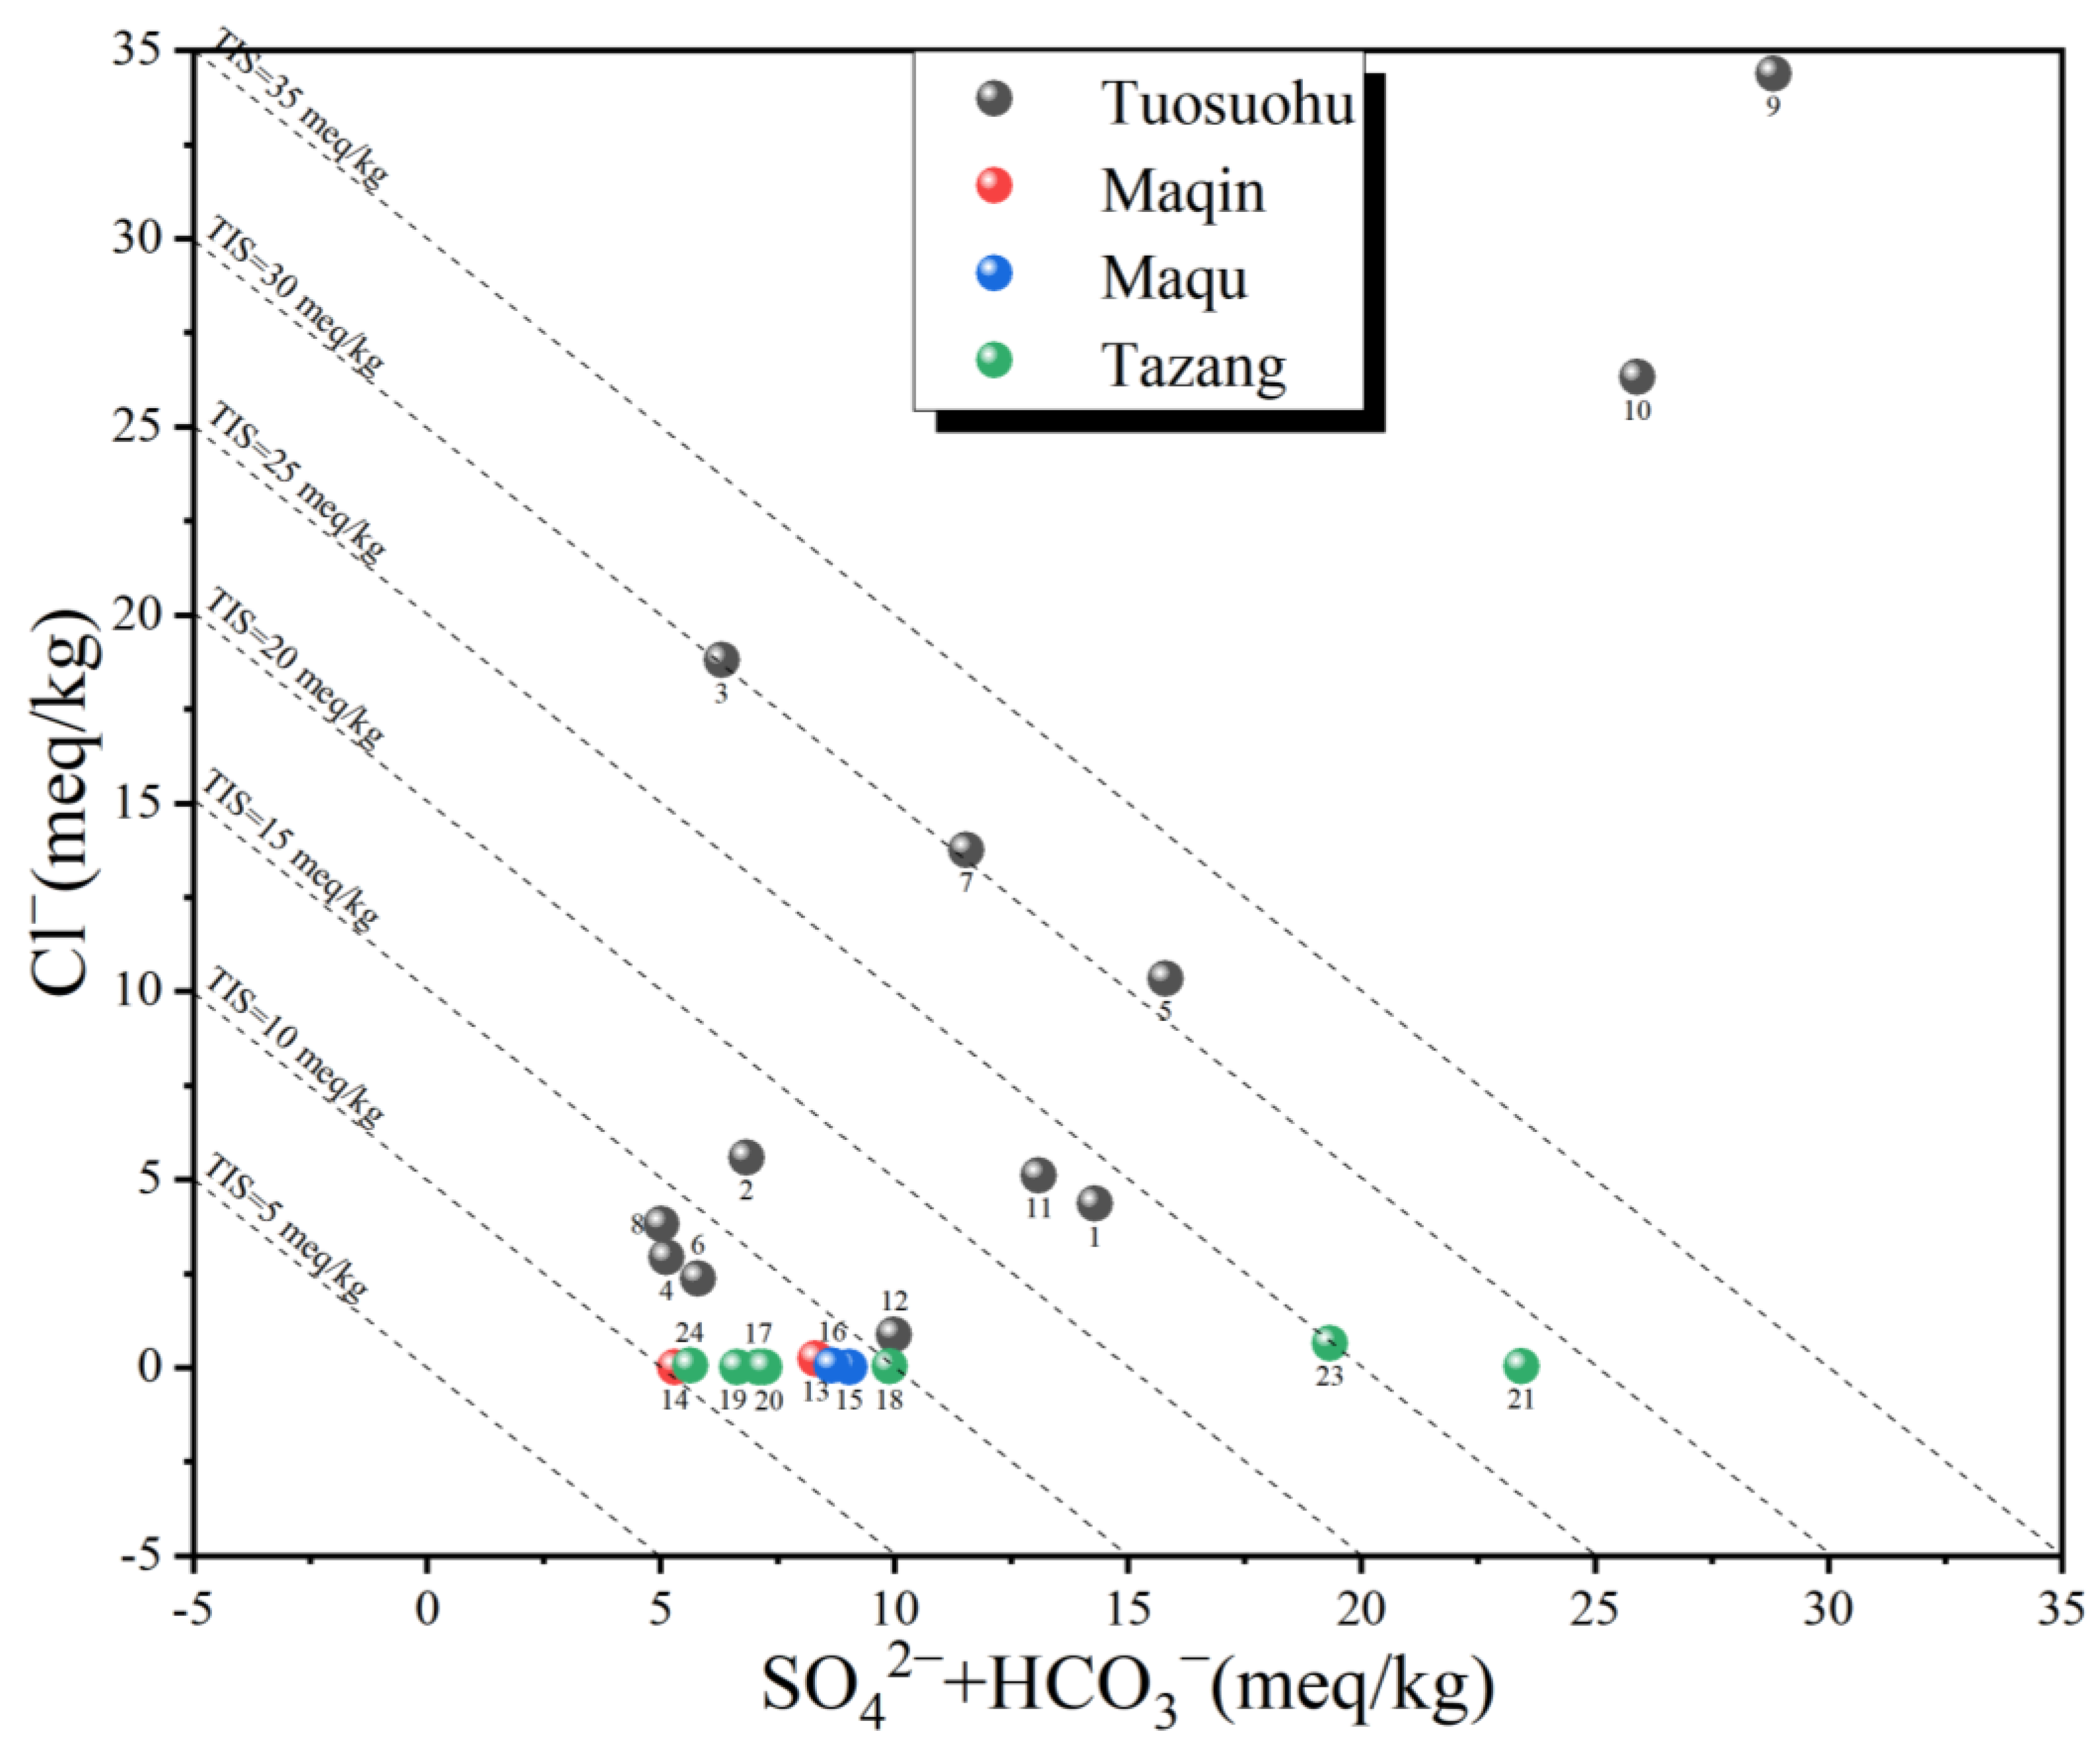
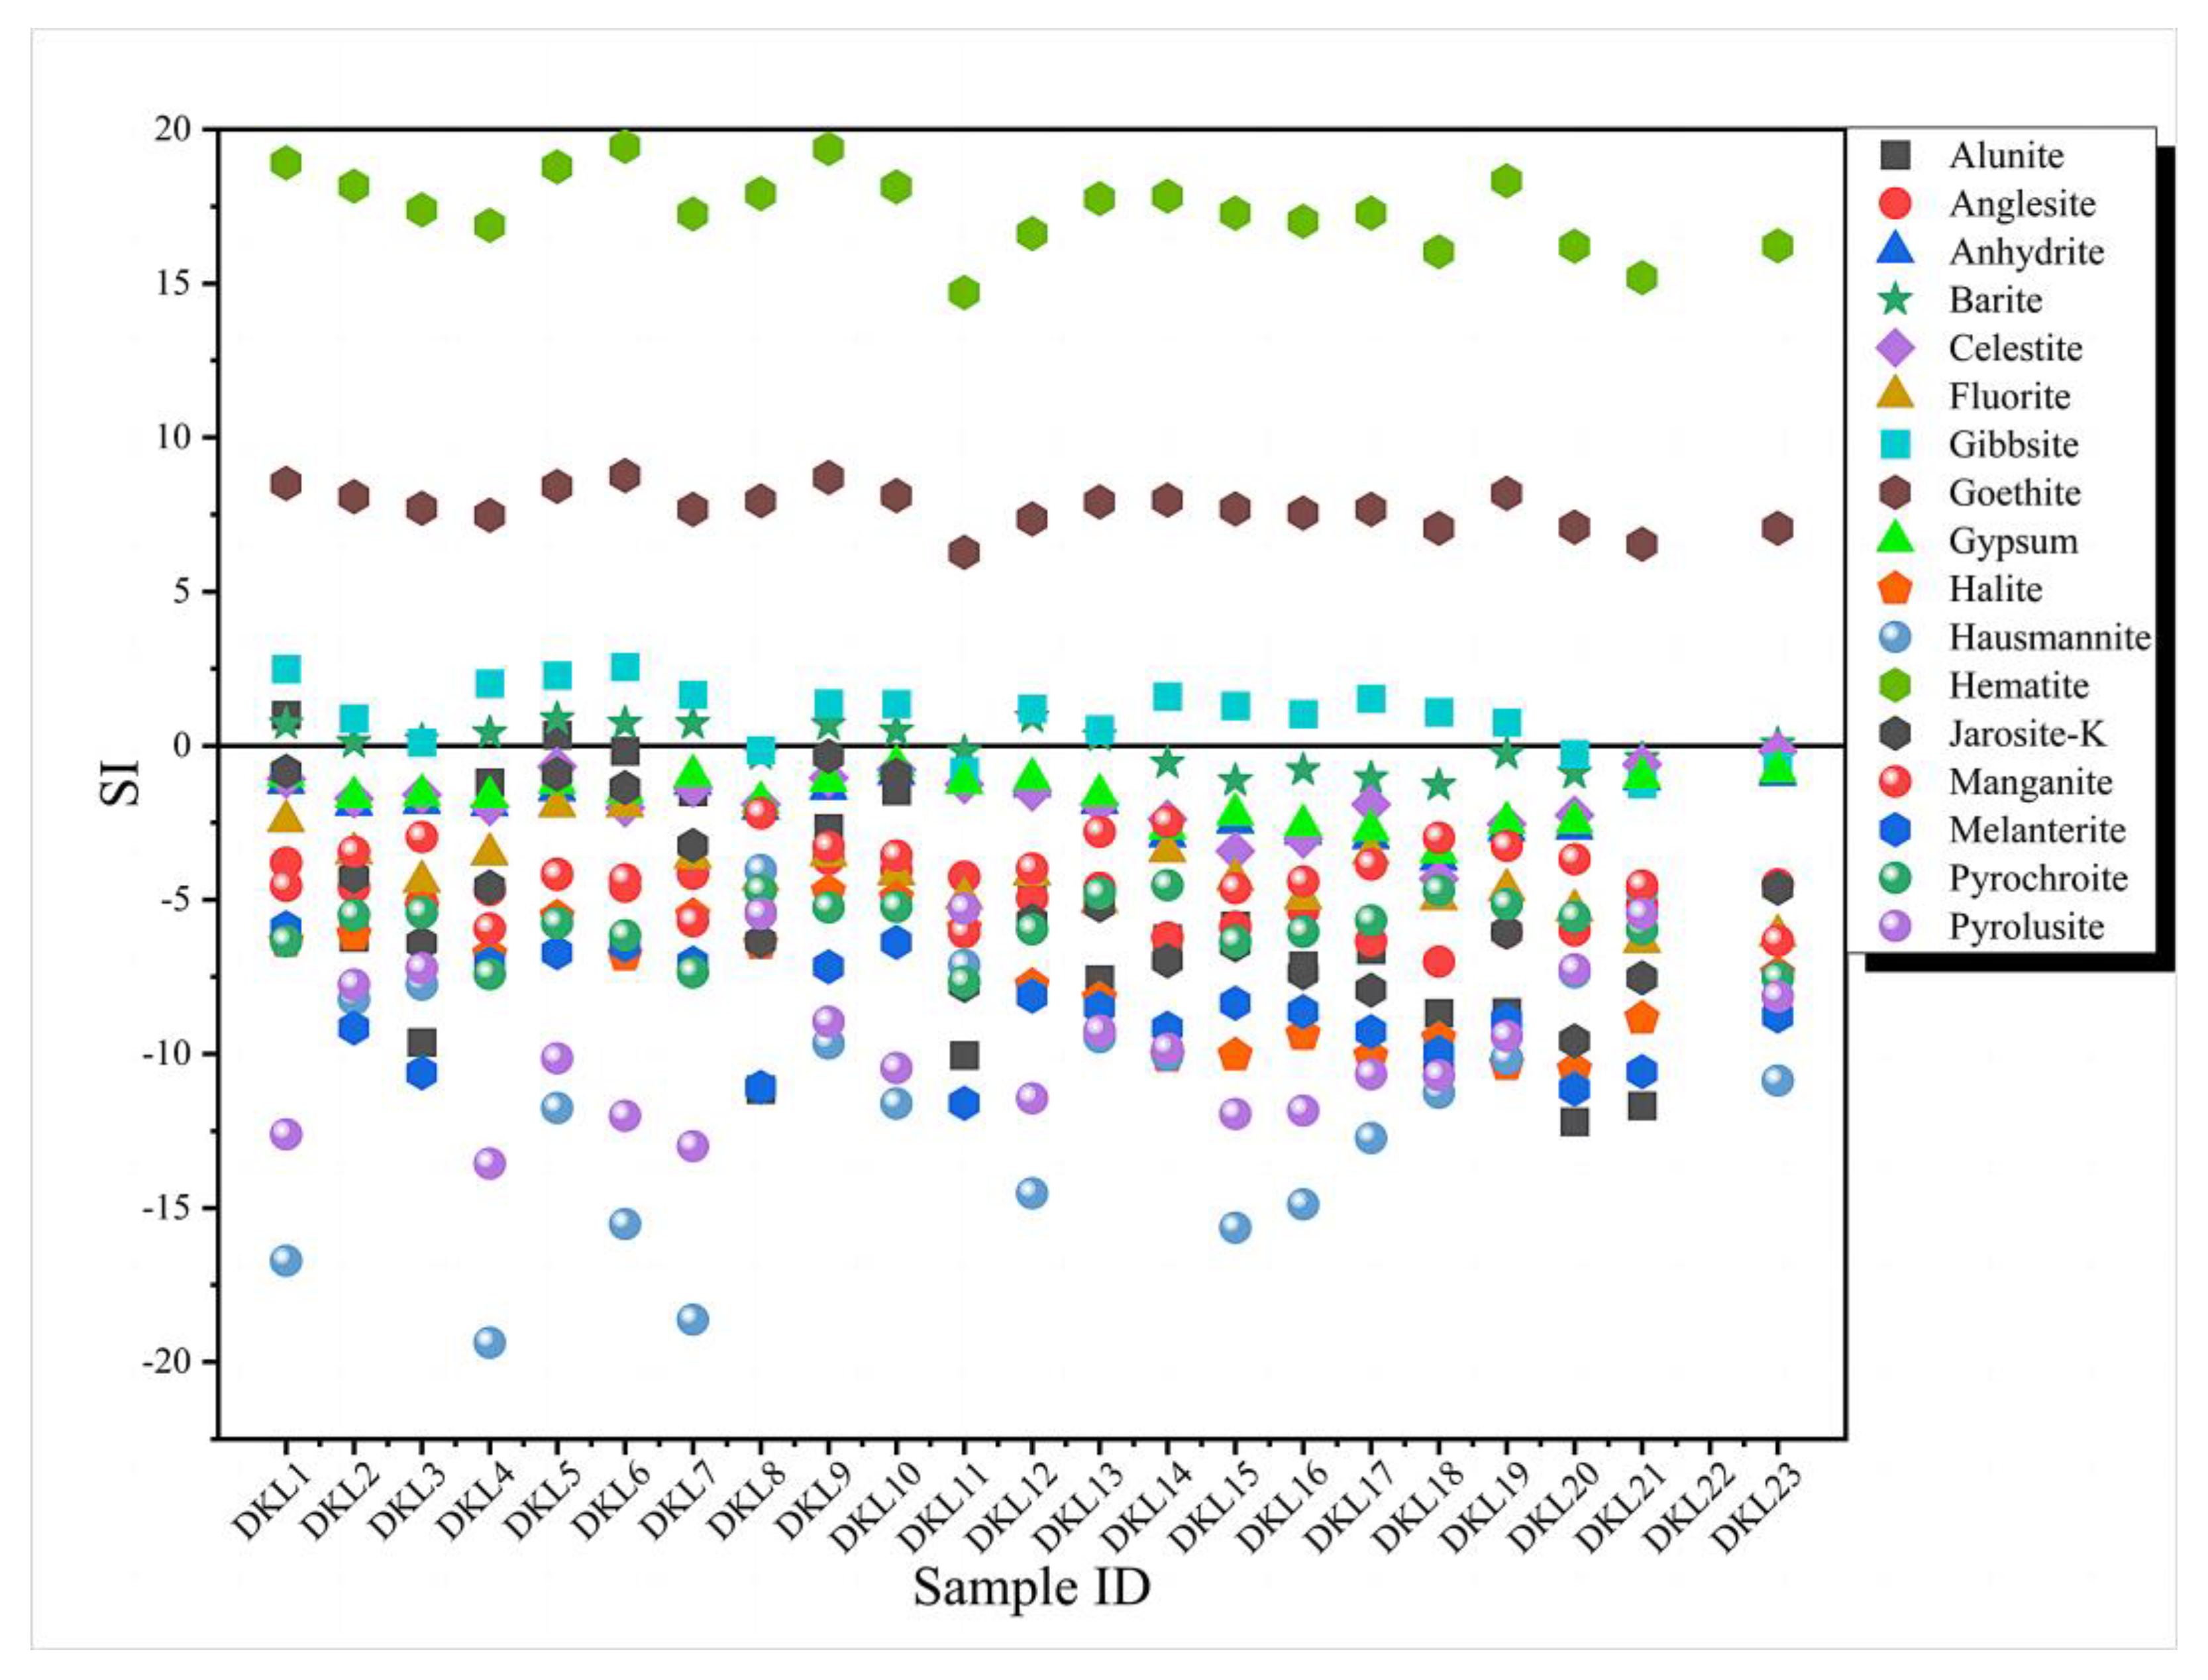
5.1. Major Elements
5.2. Trace Elements
5.3. Water Origin and δD, δ18O
5.4. Sr Isotope
5.5. Reservoir Temperature and Circulation Depth
5.6. Temporal Variation Characteristics of Springs and Response to Earthquakes
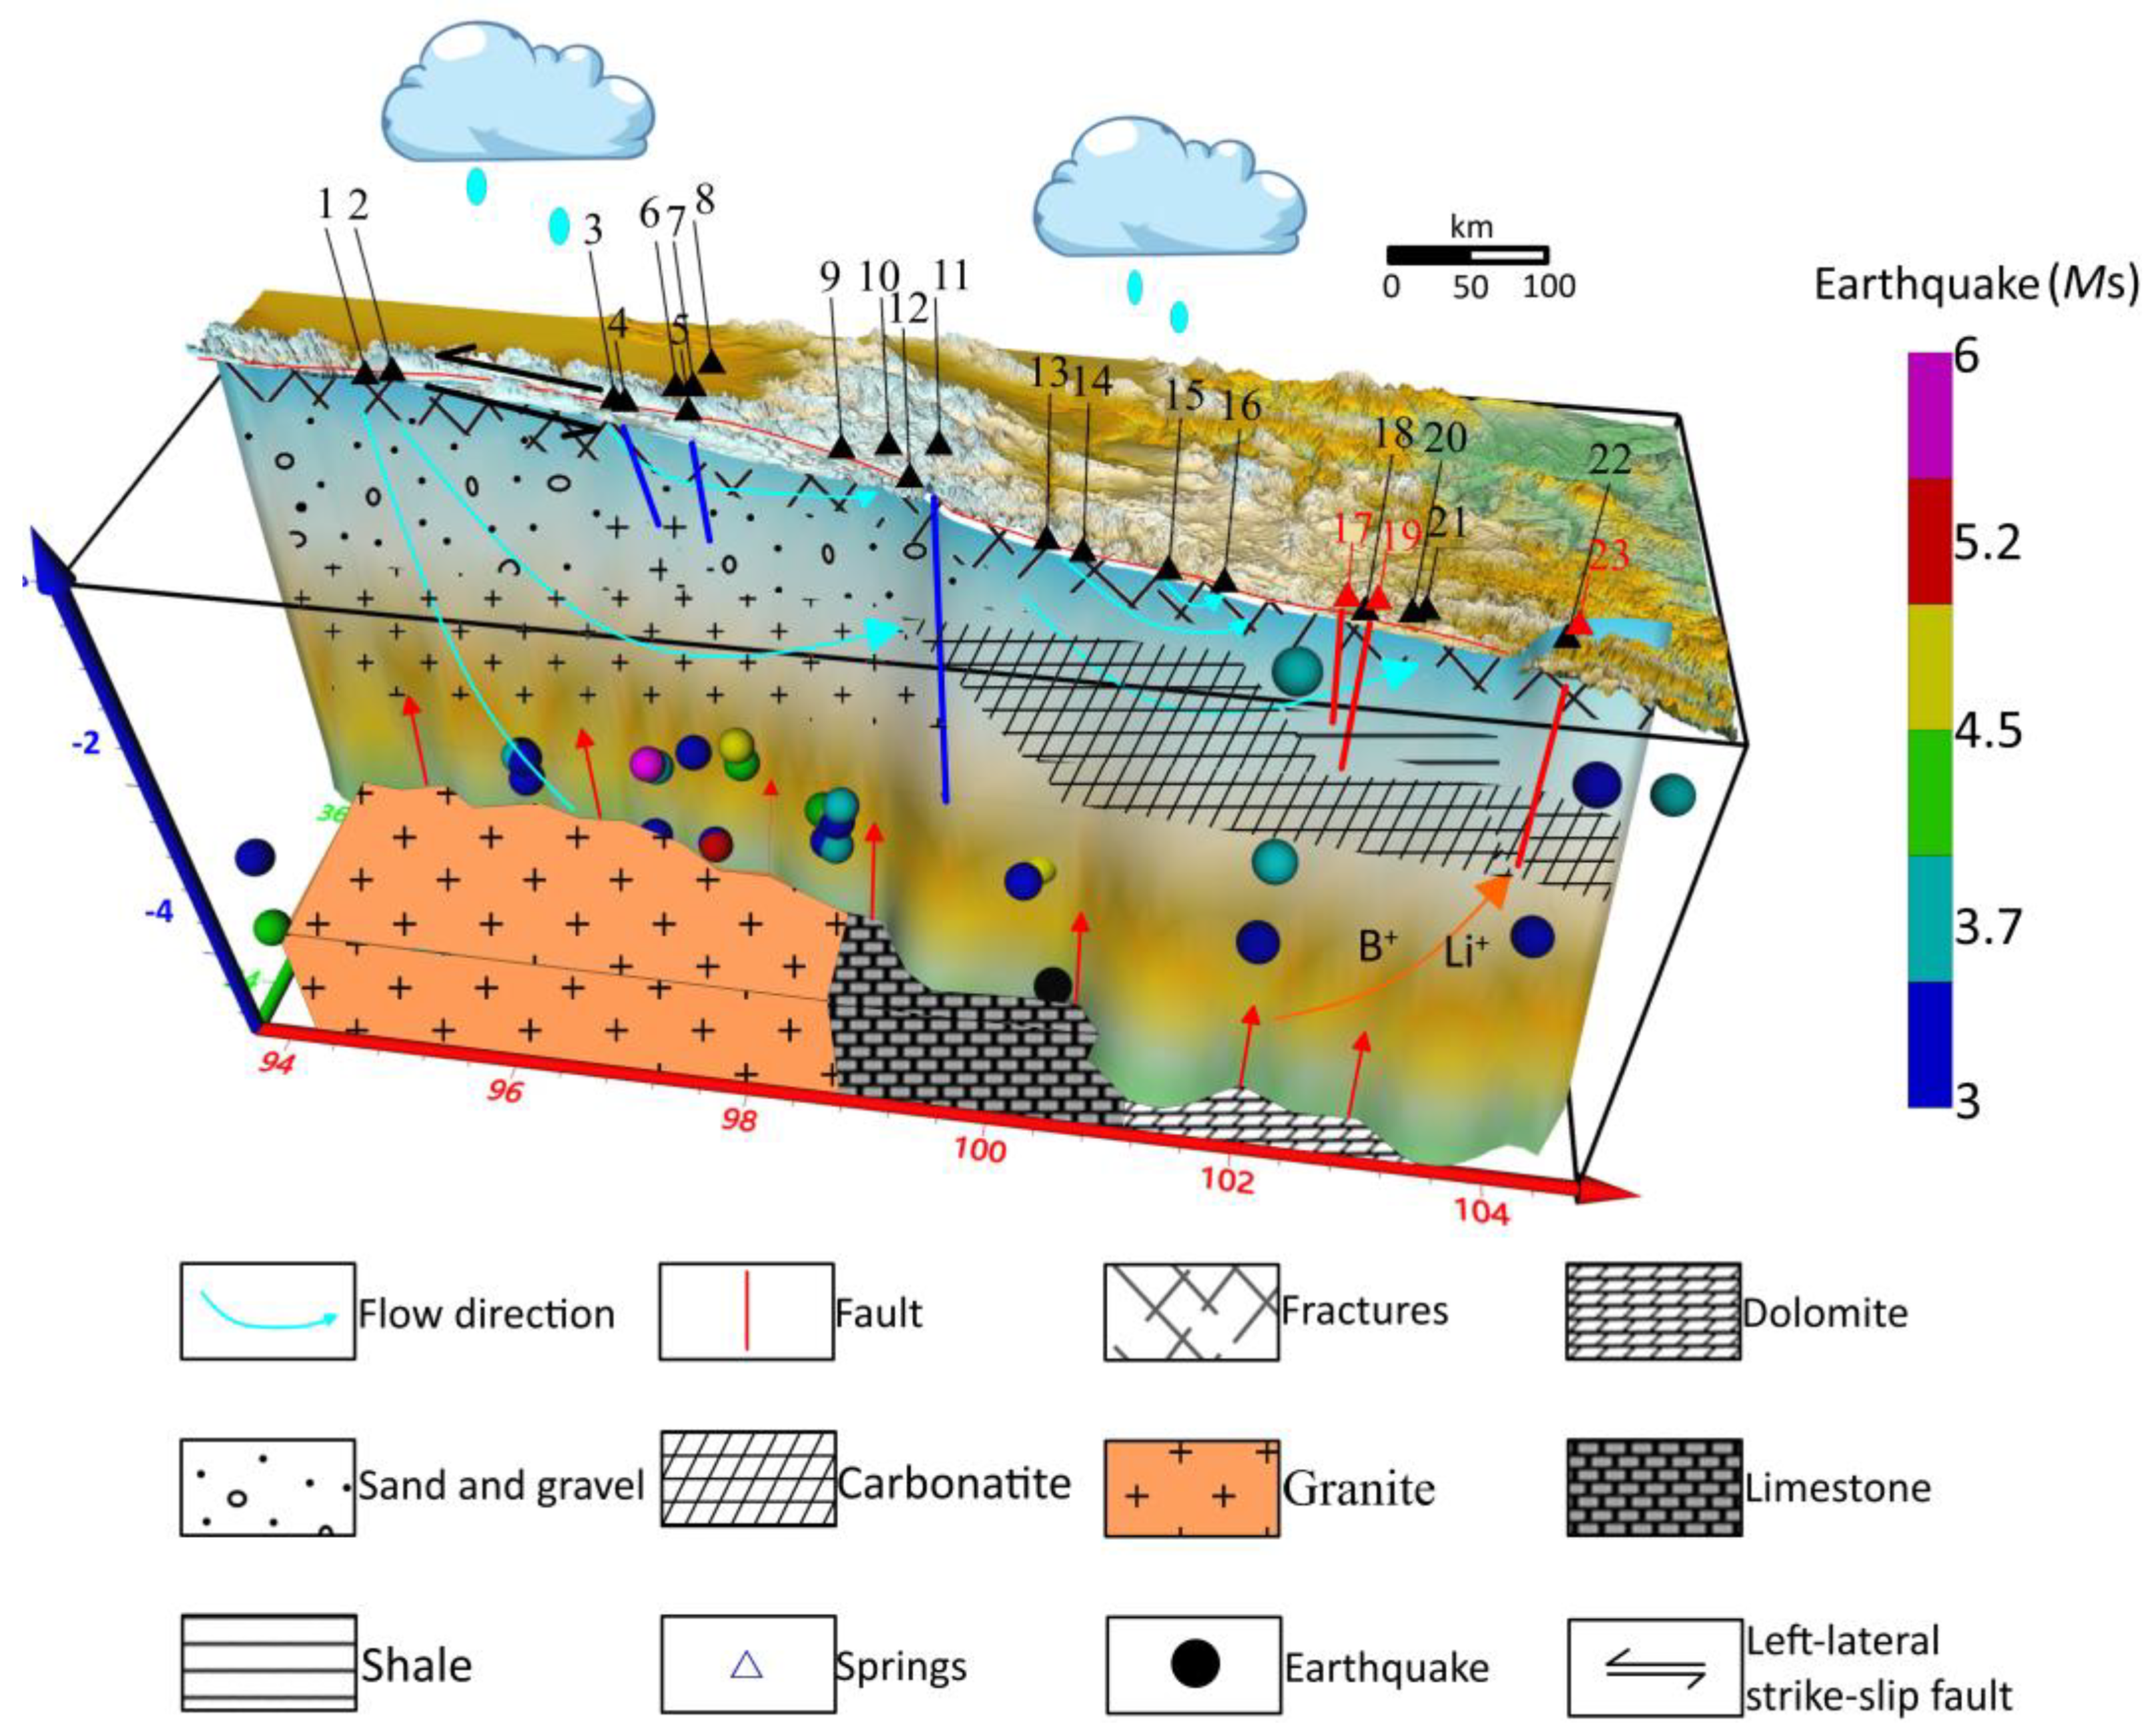
5.7. The Hydrogeochemical Circulation Model of Springs in the Mid-Eastern Part of the EKF
6. Conclusions
- The springs’ water chemistry indicates their primary origin is atmospheric precipitation, with significant evaporative effects observed.
- The isotopic analysis revealed a decreasing concentration of hydrogen and oxygen isotopes from west to east, suggesting variations in evaporation and water–rock interactions across the fault zone.
- The study identified 11 distinct water chemistry types, reflecting the diverse lithology of the region.
- The reservoir temperatures of the springs, ranging from 39.64 °C to 120.83 °C, along with their varied circulation depths (1.29 to 3.83 km), underscore the complex interaction between geothermal activity and groundwater movement in the EKF.
- Notably, the hydrogeochemical changes observed before and after seismic events such as the Gande and Maerkang earthquakes suggest the potential to use groundwater chemistry as an indicator for earthquake prediction.
Supplementary Materials
Author Contributions
Funding
Data Availability Statement
Conflicts of Interest
References
- Chiodini, G.; Cardellini, C.; Di Luccio, F.; Selva, J.; Frondini, F.; Caliro, S.; Rosiello, A.; Beddini, G.; Ventura, G. Correlation between tectonic CO2 Earth degassing and seismicity is revealed by a 10-year record in the Apennines, Italy. Sci. Adv. 2020, 6, eabc2938. [Google Scholar] [CrossRef]
- Tanikawa, W.; Sakaguchi, M.; Tadai, O.; Hirose, T. Influence of fault slip rate on shear-induced permeability. J. Geophys. Res. Solid Earth 2010, 115, 18. [Google Scholar] [CrossRef]
- Zhou, H.L.; Zhou, X.C.; Su, H.J.; Li, Y.; Liu, F.L.; Ouyang, S.P.; Yan, Y.C.; Bai, R.L. Hydrochemical Characteristics of Earthquake-Related Thermal Springs along the Weixi-Qiaohou Fault, Southeast Tibet Plateau. Water 2022, 14, 132. [Google Scholar] [CrossRef]
- Scott, B.E.; Newell, D.L.; Jessup, M.J.; Grambling, T.A.; Shaw, C.A. Structural Controls on Crustal Fluid Circulation and Hot Spring Geochemistry above a Flat-Slab Subduction Zone, Peru. Geochem. Geophys. Geosyst. 2020, 21, e2020GC008919. [Google Scholar] [CrossRef]
- Tian, J.; Pang, Z.H.; Liao, D.W.; Zhou, X.C. Fluid geochemistry and its implications on the role of deep faults in the genesis of high temperature systems in the eastern edge of the Qinghai Tibet Plateau. Appl. Geochem. 2021, 131, 105036. [Google Scholar] [CrossRef]
- Lowell, R.P. A fault-driven circulation model for the Lost City Hydrothermal Field. Geophys. Res. Lett. 2017, 44, 2703–2709. [Google Scholar] [CrossRef]
- Liu, B.; Yan, G.; Ma, Y.; Scheuermann, A. Measurement of In-Situ Flow Rate in Borehole by Heat Pulse Flowmeter: Field-Case Study and Reflection. Geosciences 2023, 13, 146. [Google Scholar] [CrossRef]
- Bo, Y.; Liu, C.L.; Zhao, Y.J.; Wang, L.C. Chemical and isotopic characteristics and origin of spring waters in the Lanping-Simao Basin, Yunnan, Southwestern China. Chem. Der Erde-Geochem. 2015, 75, 287–300. [Google Scholar] [CrossRef]
- Zhou, X.C.; Yan, Y.C.; Fang, W.Y.; Wang, W.L.; Shi, H.Y.; Li, P.F. Short-Term Seismic Precursor Anomalies of Hydrogen Concentration in Luojishan Hot Spring Bubbling Gas, Eastern Tibetan Plateau. Front. Earth Sci. 2021, 8, 586279. [Google Scholar] [CrossRef]
- Zhou, X.C.; Liu, L.; Chen, Z.; Cui, Y.J.; Du, J.G. Gas geochemistry of the hot spring in the Litang fault zone, Southeast Tibetan Plateau. Appl. Geochem. 2017, 79, 17–26. [Google Scholar] [CrossRef]
- Skelton, A.; Andren, M.; Kristmannsdottir, H.; Stockmann, G.; Morth, C.M.; Sveinbjornsdottir, A.; Jonsson, S.; Sturkell, E.; Gudorunardottir, H.R.; Hjartarson, H.; et al. Changes in groundwater chemistry before two consecutive earthquakes in Iceland. Nat. Geosci. 2014, 7, 752–756. [Google Scholar] [CrossRef]
- Gori, F.; Barberio, M.D. Hydrogeochemical changes before and during the 2019 Benevento seismic swarm in central-southern Italy. J. Hydrol. 2022, 604, 127250. [Google Scholar] [CrossRef]
- Perez, N.M.; Hernandez, P.A.; Igarashi, G.; Trujillo, I.; Nakai, S.; Sumino, H.; Wakita, H. Searching and detecting earthquake geochemical precursors in CO2-rich groundwaters from Galicia, Spain. Geochem. J. 2008, 42, 75–83. [Google Scholar] [CrossRef]
- Barbieri, M.; Franchini, S.; Barberio, M.D.; Billi, A.; Boschetti, T.; Giansante, L.; Gori, F.; Jonsson, S.; Petitta, M.; Skelton, A.; et al. Changes in groundwater trace element concentrations before seismic and volcanic activities in Iceland during 2010–2018. Sci. Total Environ. 2021, 793, 148635. [Google Scholar] [CrossRef] [PubMed]
- Shan, B.; Xiong, X.; Wang, R.; Zheng, Y.; Yadav, R.B.S. Stress evolution and seismic hazard on the Maqin-Maqu segment of East Kunlun Fault zone from co-, post- and interseismic stress changes. Geophys. J. Int. 2015, 200, 244–253. [Google Scholar] [CrossRef]
- Zhu, L.; Ji, L.; Liu, C. Interseismic slip rate and locking along the Maqin–Maqu Segment of the East Kunlun Fault, Northern Tibetan Plateau, based on Sentinel-1 images. J. Asian Earth Sci. 2021, 211, 104703. [Google Scholar] [CrossRef]
- Zhang, J.L.; Ren, J.W.; Chen, C.Y.; Fu, J.D.; Yang, P.X.; Xiong, R.W.; Hu, C.Z. The Late Pleistocene activity of the eastern part of east Kunlun fault zone and its tectonic significance. Sci. China-Earth Sci. 2014, 57, 439–453. [Google Scholar] [CrossRef]
- Ma, Y.S.; ShI, W.; Zhang, Y.Q.; Yang, N.; Zhang, C.S.; Zhang, H.P. Characteristics of the activity of the Maqu segment of the East Kunlun active fault belt and its eastward extension. Geol. Bull. China 2005, 24, 30–35. (In Chinese) [Google Scholar]
- Luo, Z.B.; Zhou, X.C.; He, M.; Liang, J.L.; Li, J.C.; Dong, J.Y.; Tian, J.; Yan, Y.C.; Li, Y.; Liu, F.L.; et al. Earthquakes evoked by lower crustal flow: Evidence from hot spring geochemistry in Lijiang-Xiaojinhe fault. J. Hydrol. 2023, 619, 129334. [Google Scholar] [CrossRef]
- Yan, Y.C.; Zhou, X.C.; Liao, L.X.; Tian, J.; Li, Y.; Shi, Z.M.; Liu, F.L.; Ouyang, S.P. Hydrogeochemical Characteristic of Geothermal Water and Precursory Anomalies along the Xianshuihe Fault Zone, Southwestern China. Water 2022, 14, 550. [Google Scholar] [CrossRef]
- Seismologic Bureau of Qinghai Province, the Institute of Crustal Dynamics of China Earthquake. Eastern Kunlun Active Fault Zone; Seismological Press: Beijing, China, 1999. (In Chinese) [Google Scholar]
- Guo, J.; Lin, A.; Sun, G.; Zheng, J. Surface Ruptures Associated with the 1937 M 7.5 Tuosuo Lake and the 1963 M 7.0 Alake Lake Earthquakes and the Paleoseismicity along the Tuosuo Lake Segment of the Kunlun Fault, Northern Tibet. Bull. Seismol. Soc. Am. 2007, 97, 474–496. [Google Scholar] [CrossRef]
- Jerome, V.D.W.; Paul, T.; Frederick, J.R.; Anne-Sophie, M.; Bertrand, M.; Yves, G.; Robert, C.F.; Marc, W.C.; Zhao, G.G.; Xu, Z. Uniform psotglacial slip-rate along the central 600 km of the Kunlun Fault (Tibet), from 26Al, 10Be, and 14C dating of riser offsets, and climatic origin of the regional morphology. Geophys. J. Int. 2002, 148, 356–388. [Google Scholar]
- Li, C.; He, Q.; Zhao, G. Holocene slip rate along the eastern segment of the Kunlun fault. Seismol. Geol. 2004, 26, 676–687. [Google Scholar]
- Liu, G.X. Eastern Kunlun Active Fault Zone and Its Seismic Activity. Earth Res. China 1996, 12, 119–126. [Google Scholar]
- Li, C.-f.; He, Q.-l.; Zhao, G.-g. Paleo-earthquake studies on the eastern section of the Kunlun fault. Acta Seismol. Sin. 2005, 18, 64–71. [Google Scholar] [CrossRef]
- Li, C.X. The Long-Trem Faulting Behavior of the Eastern Segment (Maqin-Maqu) of the East Kunlun Faults Since Ther Late Quaternary. Ph.D. Thesis, Institute of Geology of China Earthquake Administration, Beijing, China, 2009. [Google Scholar]
- Lin, A.M.; Guo, J.M. Nonuniform Slip Rate and Millennial Recurrence Interval of Large Earthquakes along the Eastern Segment of the Kunlun Fault, Northern Tibet. Bull. Seismol. Soc. Am. 2008, 98, 2866–2878. [Google Scholar] [CrossRef]
- Jia, Y.N.; Zhang, Y.Z.; Huang, C.C.; Wang, N.L.; Qiu, H.J.; Wang, H.Y.; Xiao, Q.L.; Chen, D.; Lin, X.; Zhu, Y.; et al. Late Pleistocene-Holocene aeolian loess-paleosol sections in the Yellow River source area on the northeast Tibetan Plateau: Chronostratigraphy, sediment provenance, and implications for paleoclimate reconstruction. Catena 2022, 208, 105777. [Google Scholar] [CrossRef]
- Wang, W.; Sun, M.; Che, Y.; Yao, X.; Zhang, M.; Niu, S. Micrometeorological Analysis and Glacier Ablation Simulation in East Kunlun. Water 2023, 15, 3517. [Google Scholar] [CrossRef]
- Liu, X.Q.; Dong, H.L.; Yang, X.D.; Herzschuh, U.; Zhang, E.L.; Stuut, J.B.W.; Wang, Y.B. Late Holocene forcing of the Asian winter and summer monsoon as evidenced by proxy records from the northern Qinghai-Tibetan Plateau. Earth Planet. Sci. Lett. 2009, 280, 276–284. [Google Scholar] [CrossRef]
- The Second Regional Geological Survey Team of Qinghai Province, The Institute of Crustal Dynamics of China Earthquake. Report on Regional Geological Survey of the People’s Republic of China, Guoluo Tibetan Autonomous Prefecture and Youyun Community Assemblage with Scale 1:200,000, Geological Part; The Second Regional Geological Survey Team of Qinghai Province, The Institute of Crustal Dynamics of China Earthquake: Qinghai, China, 1986; pp. 210–221. (In Chinese) [Google Scholar]
- Jing, G.Z.; Wang, X.Y.; Zhang, Z.Q.; He, J.J.; Zhang, L.B.; Wang, F.L.; Liu, Y.; Shi, W.J.; Tan, J. Middle-LateTriassic regional-scale magmatic-hydrothermal metallogenic system in the eastern segment of the East Kunlun. Bull. Geol. Sci. Technol. 2023, 42, 89–111. [Google Scholar] [CrossRef]
- Zhang, J.; Yu, M.; Wang, H.; Li, B.; Feng, C.; Dick, J.M.; Li, J.; Kong, H.; Zhao, Z. Geodynamic Setting and Cu-Ni Potential of Late Permian Xiwanggou Mafic-Ultramafic Rocks, East Kunlun Orogenic Belt, NW China. Front. Earth Sci. 2021, 9, 666967. [Google Scholar] [CrossRef]
- Tang, X.; Liu, S.; Zhang, D.; Wang, G.; Luo, Y.; Hu, S.; Xu, Q.; Billi, A. Geothermal Accumulation Constrained by the Tectonic Transformation in the Gonghe Basin, Northeastern Tibetan Plateau. Lithosphere 2022, 2022, 3936881. [Google Scholar] [CrossRef]
- Liu, Z.W.; Zhao, W.J.; Wu, Z.H.; Shi, D.N.; Song, Y.; Deng, S.G. East Kunlun Orogeny’s uplift uncovered by deep reflection seismic data in indepth iv. Chin. J. Geophys. 2016, 59, 3211–3222. [Google Scholar] [CrossRef]
- Tozer, B.; Sandwell, D.T.; Smith, W.H.F.; Olson, C.; Beale, J.R.; Wessel, P. Global Bathymetry and Topography at 15 Arc Sec: SRTM15+. Earth Space Sci. 2019, 6, 1847–1864. [Google Scholar] [CrossRef]
- Qu, C.Y. Builing to the active tectonic database of china. Seismol. Geol. 2008, 30, 298–304. [Google Scholar] [CrossRef]
- Woith, H.; Wang, R.J.; Maiwald, U.; Pekdeger, A.; Zschau, J. On the origin of geochemical anomalies in groundwaters induced by the Adana 1998 earthquake. Chem. Geol. 2013, 339, 177–186. [Google Scholar] [CrossRef]
- Chen, Z.; Zhou, X.; Du, J.; Xie, C.; Liu, L.; Li, Y.; Yi, L.; Liu, H.; Cui, Y. Hydrochemical characteristics of hot spring waters in the Kangding district related to the Lushan MS = 7.0 earthquake in Sichuan, China. Nat. Hazards Earth Syst. Sci. 2015, 15, 1149–1156. [Google Scholar] [CrossRef]
- Zhou, R.; Zhou, X.C.; Li, Y.; He, M.; Li, J.C.; Dong, J.N.; Tian, J.; Li, K.Y.; Yan, Y.C.; Ouyang, S.P.; et al. Hydrogeochemical and Isotopic Characteristics of the Hot Springs in the Litang Fault Zone, Southeast Qinghai-Tibet Plateau. Water 2022, 14, 1496. [Google Scholar] [CrossRef]
- Shand, P.; Darbyshire, D.P.F.; Love, A.J.; Edmunds, W.M. Sr isotopes in natural waters: Applications to source characterisation and water–rock interaction in contrasting landscapes. Appl. Geochem. 2009, 24, 574–586. [Google Scholar] [CrossRef]
- Shakeri, A.; Ghoreyshinia, S.; Mehrabi, B.; Delavari, M. Rare earth elements geochemistry in springs from Taftan geothermal area SE Iran. J. Volcanol. Geotherm. Res. 2015, 304, 49–61. [Google Scholar] [CrossRef]
- Giggenbach, W.F. Geothermal solute equilibria. Derivation of Na-K-Mg-Ca geoindicators. Geochim. Cosmochim. Acta 1988, 52, 2749–2765. [Google Scholar] [CrossRef]
- Liu, J.H.; Zhang, S.Q.; Zhang, P.F.; Peng, Y. On the Lithogeochemical Features of the Upper Triassic Sequence Strata in West Sichuan. Sichuan J. Geol. 2005, 25, 198–201. (In Chinese) [Google Scholar]
- Liu, T.J. Geologic Features, Provenance Nature and Tectonic Signigicance of Hongshuichuan Formation Located in the Southern Slope of the East Kunlun Orogenic Belt (Eastern Part). Master’s Thesis, Chang’an University, Xi’an, China, 2015. [Google Scholar]
- Yang, J.S.; Shi, R.D.; Wu, C.L.; Wang, X.B.; Robinson, P.T. Dur’ngoi Ophiolite in East Kunlun, Northeast Tibetan Plateau: Evidence for Paleo-Tethyan Suture in Northwest China. J. Earth Sci. 2009, 20, 303–331. [Google Scholar] [CrossRef]
- Cai, C.F.; Franks, S.G.; Aagaard, P. Origin and migration of brines from Paleozoic strata in Central Tarim, China: Constraints from 87Sr/86Sr, dD, d18O and water chemistry. Appl. Geochem. 2001, 16, 1269–1284. [Google Scholar] [CrossRef]
- Wang, J.L.; Zhou, X.C.; He, M.; Li, J.C.; Dong, J.Y.; Tian, J.; Yan, Y.C.; Li, Y.; Liu, K.Y.; Li, Y. Hydrogeochemical origin and circulation of spring waters along the Karakorum fault, Western Tibetan Plateau: Implications for interaction between hydrosphere and lithosphere. Front. Earth Sci. 2022, 10, 1021550. [Google Scholar] [CrossRef]
- Wang, C.G.; Zheng, M.P.; Zhang, X.F.; Wu, Q.; Liu, X.F.; Ren, J.H.; Chen, S.S. Geothermal-type Lithium Resources in Southern Xizang, China. Acta Geol. Sin.-Engl. Ed. 2021, 95, 860–872. [Google Scholar] [CrossRef]
- Barberio, M.D.; Gori, F.; Barbieri, M.; Billi, A.; Caracausi, A.; De Luca, G.; Franchini, S.; Petitta, M.; Doglioni, C. New observations in Central Italy of groundwater responses to the worldwide seismicity. Sci. Rep. 2020, 10, 17850. [Google Scholar] [CrossRef]
- Phuong, N.K.; Harijoko, A.; Itoi, R.; Unoki, Y. Water geochemistry and soil gas survey at Ungaran geothermal field, central Java, Indonesia. J. Volcanol. Geotherm. Res. 2012, 229, 23–33. [Google Scholar] [CrossRef]
- Liu, W.P.; Cui, H.Q.; Liu, W.P.; Chen, X.X.; Li, Z.H. An analysis of the evolution trend and influencing factors of the groundwater flow field in the Sanjiang Plain. Hydrogeol. Eng. Geol. 2021, 48, 10–17. [Google Scholar] [CrossRef]
- Düşünür-Doğan, D.; Üner, S. Numerical simulation of groundwater flow and temperature distribution in Aegean Coast of Turkey. J. Earth Syst. Sci. 2019, 128, 1–12. [Google Scholar] [CrossRef]
- Podlesak, D.W.; Torregrossa, A.M.; Ehleringer, J.R.; Dearing, M.D.; Passey, B.H.; Cerling, T.E. Turnover of oxygen and hydrogen isotopes in the body water, CO2, hair, and enamel of a small mammal. Geochim. Cosmochim. Acta 2008, 72, 19–35. [Google Scholar] [CrossRef]
- Li, Q.Y.; Wu, J.L.; Shen, B.B.; Zeng, H.; Li, Y.H. Water Chemistry and Stable Isotopes of Different Water Types in Tajikistan. Environ. Process. Int. J. 2018, 5, S127–S137. [Google Scholar] [CrossRef]
- Pang, Z.H.; Kong, Y.L.; Li, J.; Tian, J. An isotopic geoindicator in the hydrological cycle. In Proceedings of the 15th Water–rock Interaction International Symposium (WRI), Evora, Portugal, 16–21 October 2016; pp. 534–537. [Google Scholar]
- Giggenbach, W.F. Isotopic shifts in waters from geothermal and volcanic systems along convergent plate boundaries and their origin. Earth Planet Sci. Lett. 1992, 113, 495–510. [Google Scholar] [CrossRef]
- Ma, Z.; Yu, J.; Su, Y.; Xie, J.; Jia, X.; Hu, Y. δ18O shifts of geothermal waters in the central of Weihe Basin, NW China. Environ. Earth Sci. 2009, 59, 995–1008. [Google Scholar] [CrossRef]
- Claesson, L.; Skelton, A.; Graham, C.; Morth, C.M. The timescale and mechanisms of fault sealing and water–rock interaction after an earthquake. Geofluids 2007, 7, 427–440. [Google Scholar] [CrossRef]
- Craig, H. Isotopic Variations in Meteoric Waters. Science 1961, 133, 1702–1703. [Google Scholar] [CrossRef] [PubMed]
- Ren, W.; Yao, T.; Yang, X.; Joswiak, D.R. Implications of variations in δ18O and δD in precipitation at Madoi in the eastern Tibetan Plateau. Quat. Int. 2013, 313–314, 56–61. [Google Scholar] [CrossRef]
- Seyfried, W.E.; Chen, X.; Chan, L.H. Trace element mobility and lithium isotope exchange during hydrothermal alteration of seafloor weathered basalt: An experimental study at 350 degrees C, 500 bars. Geochim. Cosmochim. Acta 1998, 62, 949–960. [Google Scholar] [CrossRef]
- Arnorsson, S. Chemical-equilibria in icelandic geothermal systems—Implications for chemical geothermometry investigations. Geothermics. 1983, 12, 119–128. [Google Scholar] [CrossRef]
- Fournier, R.O.; Rowe, J.J. The deposition of silica in hot springs. Bull. Volcanol. 1966, 29, 585–587. [Google Scholar] [CrossRef]
- Li, W.Y.; Zhang, J.; Tang, X.C.; Tian, J.; Wang, Y.C.; Guo, Q. The deep geothermal structure of high-temperature hydrothermal activity region in western Sichuan Plateau: A geophysical study. Chin. J. Geophys.-Chin. Ed. 2018, 61, 2926–2936. [Google Scholar] [CrossRef]
- Pang, Y.; Zou, K.; Guo, X.; Chen, Y.; Zhao, J.; Zhou, F.; Zhu, J.; Duan, L.; Yang, G. Geothermal regime and implications for basin resource exploration in the Qaidam Basin, northern Tibetan Plateau. J. Asian Earth Sci. 2022, 239, 105400. [Google Scholar] [CrossRef]
- Zhang, L.; Guo, L.; Zhou, X.; Yang, Y.; Shi, D.; Liu, Y. Temporal variations in stable isotopes and synchronous earthquake-related changes in hot springs. J. Hydrol. 2021, 599, 126–316. [Google Scholar] [CrossRef]
- Andren, M.; Stockmann, G.; Skelton, A.; Sturkell, E.; Morth, C.M.; Gudrunardottir, H.R.; Keller, N.S.; Odling, N.; Dahren, B.; Broman, C.; et al. Coupling between mineral reactions, chemical changes in groundwater, and earthquakes in Iceland. J. Geophys. Res. Solid Earth 2016, 121, 2315–2337. [Google Scholar] [CrossRef]
- Skelton, A.; Liljedahl-Claesson, L.; Wasteby, N.; Andren, M.; Stockmann, G.; Sturkell, E.; Morth, C.M.; Stefansson, A.; Tollefsen, E.; Siegmund, H.; et al. Hydrochemical Changes Before and After Earthquakes Based on Long-Term Measurements of Multiple Parameters at Two Sites in Northern IcelandA Review. J. Geophys. Res.-Solid Earth 2019, 124, 2702–2720. [Google Scholar] [CrossRef]
- Toutain, J.P.; Munoz, M.; Poitrasson, F.; Lienard, A.C. Springwater chloride ion anomaly prior to a ML = 5.2 Pyrenean earthquake. Earth Planet. Sci. Lett. 1997, 149, 113–119. [Google Scholar] [CrossRef]
- Zhao, D.Y.; Zhou, X.C.; Zhang, Y.X.; He, M.; Tian, J.; Shen, J.F.; Li, Y.; Qiu, G.L.; Du, F.; Zhang, X.M.; et al. Hydrogeochemical Study of Hot Springs along the Tingri-Nyima Rift: Relationship between Fluids and Earthquakes. Water 2023, 15, 1634. [Google Scholar] [CrossRef]
- Reddy, D.V.; Nagabhushanam, P.; Sukhija, B.S. Earthquake (M 5.1) induced hydrogeochemical and δ18O changes: Validation of aquifer breaching-mixing model in Koyna, India. Geophys. J. Int. 2011, 184, 359–370. [Google Scholar] [CrossRef]
- Giuseppe, E.; Massimo, C.; Fedora, Q. Seismogeochemical algorithms for earthquake prediction: An overview. Ann. Geophys. 1997, 40, 1483–1492. [Google Scholar]
- Martinelli, G.; Tamburello, G. Geological and Geophysical Factors Constraining the Occurrence of Earthquake Precursors in Geofluids: A Review and Reinterpretation. Front. Earth Sci. 2020, 8, 9. [Google Scholar] [CrossRef]
- Pang, Z.H.; Luo, J.; Cheng, Y.Z.; Duan, Z.F.; Tian, J.; Kong, Y.L.; Li, Y.M.; Hu, S.B.; Wang, J.Y. Evaluation of geological conditions for the development of deep geothermal energy in China. Earth Sci. Front. 2020, 27, 134–151. (In Chinese) [Google Scholar] [CrossRef]


| No. | T/°C | Longitude/° | Latitude/° | pH | Conductivity /µS·cm−1 | TDS /g·L−1 | Na+ /mg·L−1 | K+ /mg·L−1 | Mg2+ /mg·L−1 | Ca2+ /mg·L−1 | Cl− /mg·L−1 | NO3− /mg·L−1 | SO42− /mg·L−1 | CO32− /mg·L−1 | HCO3− /mg·L−1 | Si /mg·L−1 | 87Sr/86Sr | δD/‰ | δ18O/‰ | Hydrochemical Type |
|---|---|---|---|---|---|---|---|---|---|---|---|---|---|---|---|---|---|---|---|---|
| EKF 1 | 2.2 | 95.10 | 35.67 | 7.9 | 1538 | 1.21 | 104.4 | 2.7 | 115.2 | 104.3 | 154.2 | 14.3 | 492.1 | 25.2 | 194.4 | 2.17 | 0.710500 | −82 | −12.3 | Mg-SO4-HCO3 |
| EKF 2 | 22.2 | 95.28 | 35.74 | 8.2 | 1205 | 0.82 | 145.2 | 4.6 | 56.2 | 50.9 | 197.9 | 6.8 | 155.4 | 32.0 | 172.9 | 0.46 | 0.710500 | −68.4 | −9.1 | Na-Mg-HCO3-Cl |
| EKF 3 | 20.0 | 97.01 | 35.62 | 8.6 | 2298 | 1.52 | 331.5 | 6.3 | 92.8 | 68.0 | 666.3 | 0.0 | 186.0 | 54.4 | 116.9 | 0.84 | 0.711000 | −67.2 | −6.9 | Na-Cl |
| EKF 4 | 6.2 | 97.09 | 35.60 | 7.6 | 721 | 0.51 | 53.6 | 2.6 | 20.2 | 82.0 | 103.9 | 5.5 | 70.4 | 0.0 | 176.4 | 2.86 | 0.711334 | −85.8 | −10.8 | Ca-Na-HCO3 |
| EKF 5 | 15.3 | 97.58 | 35.55 | 7.7 | 2114 | 1.68 | 304.5 | 11.6 | 66.1 | 130.0 | 366.6 | 9.3 | 240.3 | 36.7 | 519.5 | 9.67 | 0.708655 | −93.4 | −11.1 | Na-HCO3 |
| EKF 6 | 4.1 | 97.41 | 35.84 | 8.0 | 745 | 0.54 | 63.9 | 2.4 | 17.8 | 86.4 | 84.1 | 6.3 | 102.6 | 0.0 | 176.4 | 1.82 | 0.713388 | −80.4 | −10.2 | Ca-Na-HCO3 |
| EKF 7 | 7.0 | 97.53 | 35.86 | 7.8 | 2143 | 1.58 | 248.3 | 7.7 | 55.1 | 184.9 | 487.8 | 43.1 | 276.0 | 0.0 | 278.8 | 2.8 | 0.712260 | −72.7 | −11 | Na-Ca-Cl-HCO3 |
| EKF 8 | 25.9 | 97.59 | 36.17 | 8.6 | 915 | 0.64 | 108.2 | 5.6 | 39.0 | 49.0 | 135.1 | 5.9 | 96.8 | 51.7 | 144.6 | 4.75 | 0.711116 | −72.8 | −7.8 | Na-HCO3 |
| EKF 9 | 14.5 | 98.76 | 35.26 | 8.1 | 4577 | 3.75 | 673.1 | 14.6 | 303.8 | 76.4 | 1219.0 | 11.1 | 891.6 | 71.4 | 492.5 | 3.64 | 0.710054 | −67.6 | −7.7 | Na-Mg-Cl |
| EKF 10 | 9.3 | 99.08 | 35.34 | 7.8 | 3690 | 3.10 | 521.8 | 13.5 | 172.3 | 195.9 | 932.8 | 22.6 | 901.7 | 0.0 | 342.4 | 3.65 | 0.713214 | −91.8 | −12.7 | Na-Cl-SO4 |
| EKF 11 | 60.4 | 99.43 | 35.40 | 7.8 | 1624 | 1.21 | 309.6 | 20.9 | 4.8 | 57.5 | 181.1 | 11.0 | 456.3 | 0.0 | 172.9 | 34.60 | 0.712407 | −98 | −10.8 | Na-SO4 |
| EKF 12 | 4.5 | 99.29 | 34.99 | 8.1 | 866 | 0.78 | 18.3 | 2.1 | 44.1 | 145.4 | 31.1 | 5.4 | 207.5 | 54.5 | 273.0 | 2.73 | 0.708718 | −88.2 | −12.1 | Ca-Mg-HCO3 |
| EKF 13 | 10.0 | 100.31 | 34.44 | 8.1 | 695 | 0.61 | 24.8 | 1.7 | 37.7 | 100.7 | 8.7 | 1.1 | 74.6 | 38.2 | 325.1 | 2.93 | 0.715374 | −82.1 | −10.9 | Ca-Mg-HCO3 |
| EKF 14 | 4.5 | 100.56 | 34.36 | 8.2 | 350 | 0.34 | 5.5 | 1.6 | 13.6 | 65.7 | 0.5 | 4.8 | 6.6 | 0.0 | 240.1 | 3.96 | 0.712455 | −87 | −10.8 | Ca-HCO3 |
| EKF 15 | 6.5 | 101.13 | 34.24 | 7.9 | 464 | 0.52 | 7.4 | 1.2 | 20.2 | 100.9 | 0.4 | 2.4 | 14.3 | 0.0 | 369.2 | 4.03 | 0.718426 | −79.7 | −10.5 | Ca-HCO3 |
| EKF 16 | 6.5 | 101.49 | 34.18 | 7.8 | 470 | 0.57 | 6.5 | 1.5 | 9.8 | 124.3 | 2.2 | 8.6 | 5.2 | 0.0 | 408.1 | 5.85 | 0.707998 | −87 | −11.5 | Ca-HCO3 |
| EKF 17 | 9.0 | 102.27 | 34.02 | 8.0 | 460 | 0.47 | 5.2 | 0.8 | 19.9 | 95.5 | 0.5 | 4.0 | 4.8 | 0.0 | 335.8 | 3.13 | 0.708728 | −96.6 | −12.4 | Ca-HCO3 |
| EKF 18 | 4.5 | 102.39 | 34.02 | 7.9 | 509 | 0.55 | 9.4 | 1.3 | 26.8 | 100.9 | 1.1 | 0.0 | 0.9 | 0.0 | 412.8 | 4.34 | 0.715199 | −106.2 | −13.7 | Ca-HCO3 |
| EKF 19 | 12.0 | 102.46 | 34.02 | 8.0 | 446 | 0.40 | 3.5 | 0.8 | 21.4 | 76.3 | 0.4 | 0.6 | 10.0 | 18.7 | 272.4 | 4.19 | 0.708887 | −104.7 | −13.7 | Ca-Mg-HCO3 |
| EKF 20 | 28.0 | 102.68 | 34.04 | 8.0 | 441 | 0.43 | 4.0 | 1.4 | 17.0 | 86.7 | 0.3 | 0.7 | 10.0 | 19.5 | 293.5 | 6.40 | 0.711761 | −99.6 | −13 | Ca-HCO3 |
| EKF 21 | 49.0 | 102.78 | 34.20 | 7.6 | 1201 | 1.38 | 44.6 | 7.0 | 66.5 | 226.4 | 1.5 | 0.4 | 229.7 | 0.0 | 799.8 | 14.52 | 0.708718 | −107.3 | −14.4 | Ca-Mg-HCO3 |
| EKF 22 | - | 103.63 | 33.93 | 8.2 | 392 | 0.33 | 4.2 | 1.3 | 25.8 | 53.8 | 1.8 | 4.3 | 8.2 | 0.0 | 232.6 | - | - | - | - | - |
| EKF 23 | 44.2 | 103.69 | 33.95 | 7.3 | 1366 | 1.29 | 77.9 | 5.3 | 66.8 | 184.8 | 22.9 | 0.0 | 451.4 | 0.0 | 477.3 | 10.40 | 0.707827 | −84.2 | −12.6 | Ca-Mg-HCO3 |
| No. | Ag /µg·L−1 | Al /µg·L−1 | Ba /µg·L−1 | Be /µg·L−1 | Cd /µg·L−1 | Co /µg·L−1 | Cr /µg·L−1 | Cu /µg·L−1 | Fe /µg·L−1 | Li /µg·L−1 | Mn /µg·L−1 | B /µg·L−1 |
|---|---|---|---|---|---|---|---|---|---|---|---|---|
| EKF1 | 0.06 | 144 | 34.1 | 0.084 | 0.03 | 0.391 | 4.47 | 2.67 | 338 | 22.3 | 10.9 | 139 |
| EKF2 | 0.002 | 75.7 | 42.8 | 0.068 | 0.021 | 0.388 | 3.65 | 3.56 | 190 | 66.6 | 20.3 | 1990 |
| EKF3 | 0.018 | 25.3 | 53.6 | 0.109 | 0.012 | 0.359 | 3.68 | 6.66 | 78.7 | 84.4 | 4.23 | 534 |
| EKF4 | 0.003 | 38.4 | 68.9 | 0.052 | 0.008 | 0.135 | 1.85 | 2.38 | 79.5 | 17.7 | 2.97 | 137 |
| EKF5 | 0.134 | 276 | 168 | 0.128 | 0.025 | 0.641 | 3.79 | 7.45 | 384 | 192 | 121 | 1032 |
| EKF6 | <0.002 | 221 | 91.6 | 0.031 | 0.019 | 0.27 | 3.68 | 4.09 | 467 | 11.3 | 11.4 | 118 |
| EKF7 | 0.007 | 29.4 | 71.9 | 0.024 | 0.025 | 0.425 | 6.2 | 5.87 | 61.4 | 21.8 | 1.93 | 363 |
| EKF8 | 0.003 | 28.3 | 27.5 | 0.059 | 0.011 | 0.161 | 3.78 | 2.3 | 214 | 40.2 | 14.8 | 360 |
| EKF9 | 0.018 | 83.1 | 61.6 | 0.087 | 0.12 | 0.904 | 10.6 | 111 | 509 | 187 | 80.7 | 1190 |
| EKF10 | 0.015 | 20.5 | 27.2 | 0.097 | 0.019 | 0.55 | 8.02 | 9.27 | 172 | 106 | 339 | 702 |
| EKF11 | 0.014 | 21.8 | 27.8 | 0.267 | 0.015 | 0.094 | 3.74 | 4.99 | 23.1 | 1168 | 1.49 | 1768 |
| EKF12 | 0.003 | 14.6 | 96.8 | 3.62 | 0.014 | 0.3 | 1.04 | 17.5 | 14 | 1145 | 9.67 | 2029 |
| EKF13 | <0.002 | 6.47 | 66 | 1.54 | <0.002 | 0.295 | 0.867 | 21.1 | 62 | 1324 | 117 | 1483 |
| EKF14 | 0.003 | 42.3 | 50.5 | 23.7 | 0.029 | 0.353 | 1.48 | 23.5 | 51 | 795 | 137 | 4.17 |
| EKF15 | <0.002 | 13.1 | 8.32 | 0.131 | 0.018 | 0.057 | 0.442 | 13.7 | 45 | 232 | 9.79 | 215 |
| EKF16 | <0.002 | 5.71 | 51.3 | 0.929 | 0.033 | 0.142 | 0.532 | 15.8 | 45 | 1172 | 32 | 852 |
| EKF17 | 0.005 | 36.9 | 33.2 | 0.725 | 0.038 | 1.52 | 0.635 | 18.9 | 39 | 200 | 32.4 | 8.73 |
| EKF18 | 0.004 | 6.09 | 85.5 | 1.18 | 0.066 | 0.223 | 0.716 | 15.4 | 12 | 573 | 488 | 70.7 |
| EKF19 | 0.003 | 10.9 | 107 | 6.22 | 0.041 | 0.231 | 1.22 | 18.8 | 137 | 1631 | 75.5 | 2385 |
| EKF20 | 0.002 | 6.08 | 53.2 | 0.886 | 0.008 | 0.412 | 3.57 | 19.7 | 27 | 2047 | 34.1 | 18,330 |
| EKF21 | 0.003 | 2.03 | 29.9 | 0.683 | 0.049 | 1.6 | 1.65 | 25.8 | 23 | 217 | 139 | 614 |
| EKF23 | 0.006 | 2.79 | 44.3 | 0.223 | 0.042 | 0.238 | 1.64 | 1.54 | 63.7 | 135 | 11.6 | 517 |
| No. | Mo /mg·L−1 | Ni /mg·L−1 | Pb /µg·L−1 | Sb /µg·L−1 | Sn /µg·L−1 | Sr /µg·L−1 | Th /µg·L−1 | Ti /µg·L−1 | Tl /µg·L−1 | U /µg·L−1 | V /µg·L−1 | Zn /µg·L−1 |
| EKF1 | 0.305 | 3.95 | 0.918 | 0.028 | 0.017 | 1394 | 0.051 | 3.96 | 0.005 | 4.66 | 5.76 | 4.2 |
| EKF2 | 1.52 | 3.42 | 0.61 | 0.353 | 0.086 | 896 | 0.014 | 3.01 | 0.016 | 3.95 | 6.82 | 6.28 |
| EKF3 | 3.02 | 3.83 | 0.445 | 0.26 | 0.093 | 1385 | 0.007 | 1.79 | 0.002 | 6.67 | 23.4 | 3.76 |
| EKF4 | 0.788 | 3.05 | 0.355 | 0.046 | 0.097 | 769 | 0.025 | 2.7 | <0.002 | 2.48 | 5.02 | 19.9 |
| EKF5 | 2.15 | 11 | 0.795 | 0.156 | 0.1 | 8461 | 0.044 | 9.48 | 0.016 | 8.36 | 14.8 | 12.9 |
| EKF6 | 2.21 | 4.44 | 0.438 | 0.081 | 0.149 | 478 | 0.085 | 18.2 | 0.003 | 22.3 | 5.35 | 4.34 |
| EKF7 | 4.72 | 6.49 | 0.678 | 0.135 | 0.087 | 1399 | 0.017 | 3.81 | 0.009 | 40.8 | 16.5 | 9.39 |
| EKF8 | 2.74 | 1.7 | 0.328 | 0.128 | 0.042 | 805 | 0.012 | 2.94 | 0.008 | 4.71 | 6.63 | 2.57 |
| EKF9 | 1.08 | 272 | 1.91 | 0.354 | 1.14 | 1856 | 0.024 | 4.55 | 0.02 | 6.7 | 39 | 322 |
| EKF10 | 1.18 | 7.26 | 0.522 | 0.135 | 0.057 | 2900 | 0.008 | 2.99 | 0.013 | 16 | 30.6 | 5.41 |
| EKF11 | 1.97 | 1.87 | 0.584 | 1.05 | 0.06 | 812 | 0.009 | 11.8 | 0.148 | 1.47 | 12.9 | 4.81 |
| EKF12 | 1.13 | 5.85 | 0.141 | 14.1 | 0.369 | 988 | <0.002 | 10.5 | 1.21 | 6.74 | 6.35 | 80.2 |
| EKF13 | 0.255 | 6.49 | 0.797 | 12.2 | 0.525 | 975 | <0.002 | 8.19 | 0.201 | 0.139 | 0.554 | 136 |
| EKF14 | 5.24 | 5.01 | 0.169 | 6.04 | 0.426 | 2396 | 0.003 | 9.58 | 0.271 | 0.259 | 1.04 | 83.9 |
| EKF15 | 1.74 | 1.31 | 0.131 | 0.861 | 0.425 | 127 | <0.002 | 6.02 | 0.01 | 0.529 | 0.402 | 50 |
| EKF16 | 15 | 4.28 | 1.06 | 2.53 | 0.588 | 881 | <0.002 | 11.4 | 0.525 | 0.078 | 0.605 | 62.9 |
| EKF17 | 1.66 | 33.2 | 0.15 | 19.7 | 0.356 | 12,534 | 0.002 | 4.87 | 0.053 | 0.386 | 0.288 | 106 |
| EKF18 | 0.168 | 4.08 | 0.147 | 0.241 | 0.495 | 254 | <0.002 | 12 | 0.03 | 0.159 | 0.725 | 79.7 |
| EKF19 | 0.538 | 4.68 | 0.16 | 4.84 | 0.536 | 1364 | 0.009 | 11.8 | 1.06 | 0.203 | 0.97 | 75.1 |
| EKF20 | 0.226 | 8.06 | 0.221 | 51.9 | 0.556 | 2754 | <0.002 | 6.29 | 0.01 | 0.139 | 1.98 | 74.2 |
| EKF21 | 1.04 | 23.5 | 0.117 | 0.464 | 0.434 | 9662 | <0.002 | 3.77 | 0.087 | 0.405 | 10.5 | 218 |
| EKF23 | 1.29 | 7.28 | 0.251 | 0.033 | 0.097 | 14,309 | 0.018 | 5.02 | 0.009 | 4.55 | 0.306 | 18 |
| Sample ID | T °C | SiO2 /mg·L−1 | Quartz (No Stream Loss) |
|---|---|---|---|
| EKF1 | 2.2 | 4.62 | – |
| EKF2 | 22.2 | 0.98 | – |
| EKF3 | 20 | 1.79 | – |
| EKF4 | 6.2 | 6.09 | – |
| EKF5 | 15.3 | 20.60 | – |
| EKF6 | 4.1 | 3.88 | – |
| EKF7 | 7 | 5.96 | – |
| EKF8 | 25.9 | 10.12 | 40 |
| EKF9 | 14.5 | 7.75 | – |
| EKF10 | 9.3 | 7.77 | – |
| EKF11 | 60.4 | 73.70 | 121 |
| EKF12 | 4.5 | 5.82 | – |
| EKF13 | 22.2 | 6.25 | – |
| EKF14 | 4.5 | 8.43 | – |
| EKF15 | 6.5 | 8.58 | – |
| EKF16 | 6.5 | 12.46 | – |
| EKF17 | 9 | 6.67 | – |
| EKF18 | 4.5 | 9.24 | – |
| EKF19 | 12 | 8.91 | – |
| EKF20 | 28 | 13.63 | 50 |
| EKF21 | 49 | 30.92 | 81 |
| EKF22 | 0 | – | – |
| EKF23 | 44.2 | 22.15 | 67 |
| No | Reservoir Temperature/°C | Air Temperature/°C | Circulation Depth/m |
|---|---|---|---|
| 8 | 40 | −3.7 | 1439 |
| 11 | 121 | −3.7 | 4053 |
| 20 | 50 | −3.7 | 1762 |
| 21 | 81 | −3.7 | 2762 |
| 23 | 67 | −3.7 | 2311 |
Disclaimer/Publisher’s Note: The statements, opinions and data contained in all publications are solely those of the individual author(s) and contributor(s) and not of MDPI and/or the editor(s). MDPI and/or the editor(s) disclaim responsibility for any injury to people or property resulting from any ideas, methods, instructions or products referred to in the content. |
© 2024 by the authors. Licensee MDPI, Basel, Switzerland. This article is an open access article distributed under the terms and conditions of the Creative Commons Attribution (CC BY) license (https://creativecommons.org/licenses/by/4.0/).
Share and Cite
Lu, C.; Zhou, X.; Jiang, J.; Li, J.; Li, J.; Wu, J.; Zhu, X.; Li, J.; Xing, G.; Cui, S. The Hydrogeochemistry of and Earthquake-Related Chemical Variations in the Springs along the Eastern Kunlun Fault Zone, China. Water 2024, 16, 1215. https://doi.org/10.3390/w16091215
Lu C, Zhou X, Jiang J, Li J, Li J, Wu J, Zhu X, Li J, Xing G, Cui S. The Hydrogeochemistry of and Earthquake-Related Chemical Variations in the Springs along the Eastern Kunlun Fault Zone, China. Water. 2024; 16(9):1215. https://doi.org/10.3390/w16091215
Chicago/Turabian StyleLu, Chao, Xiaocheng Zhou, Jiyi Jiang, Jingchao Li, Jing Li, Jing Wu, Xiaoyi Zhu, Jiang Li, Gaoyuan Xing, and Shihan Cui. 2024. "The Hydrogeochemistry of and Earthquake-Related Chemical Variations in the Springs along the Eastern Kunlun Fault Zone, China" Water 16, no. 9: 1215. https://doi.org/10.3390/w16091215