
Traceability of pH to the Mole

Centro de Química Estrutural, Department of Chemistry and Biochemistry, Faculty of Sciences of the University of Lisbon; C8- Campo Grande, Lisboa 1749-016, Portugal
*
Author to whom correspondence should be addressed.
Water 2015, 7(8), 4247-4255; https://doi.org/10.3390/w7084247
Submission received: 1 November 2014
/
Revised: 24 July 2015
/
Accepted: 27 July 2015
/
Published: 3 August 2015
Abstract
:Free acidity of aqueous solutions was initially defined in 1909 by Søren Peter Lauritz Sørensen as pH = −lgcH+ (c/mol·dm−3 or m/mol·kg−1 of the free hydrogen ions in solution, H+) soon (1910) was changed to pH = paH+ = −lgaH+, integrating the new concepts of activity, ai and activity coefficient γi, for the ionic species i under concern, H+ in this case; it is ai = −lg(miγi). Since individual ions do not exist alone in solution, primary pH values cannot be assigned solely by experimental measurements, requiring extra thermodynamic model assumptions for the activity coefficient, γH+, which has put pH in a unique situation of not being fully traceable to the International System of Units (SI). Also the concept of activity is often not felt to be as perceptible as that of concentration which may present difficulties, namely with the interpretation of data. pH measurements on unknown samples rely on calibration of the measuring setup with adequate reference pH buffers. In this work, the assignment of pH values to buffers closely matching the samples, e.g., seawater, is revisited. An approach is presented to assess the quantity pmH+ = −lgmH+ profiting from the fact that, contrary to single ion activity coefficients, mean activity coefficients, can be assessed based on experimentally assessed quantities alone, , thus ensuring traceability to the mole, the SI base unit for amount of substance. Compatibility between and mean activity coefficient calculated by means of Pitzer model equations, , validates the model for its intended use.
1. Introduction
Water, H2O, undergoes self-ionization giving origin to the hydronium ion, H3O+ (or H+ for simplicity of writing) and hydroxide ion, OH−, in equal concentrations of the order of 10−7 mol·dm−3, depending on temperature, T, pressure, p, and ionic strength, I; H+ confers free acidity to the system, commonly expressed in terms of pH = −lgaH+, where aH+ = mH+γH+ stands for activity of the indicated chemical species, H+, mH+ and γH+ being its molality and activity coefficient respectively. For simplicity of writing, when calculating logarithms, ai, and mi, are used instead of the mathematically correct forms ai/ and mi/, where the quantities with superscript “0” represent the standard state for the chemical species i under concern and equal the value 1 mol·kg−1. Since, in general terms, water is likely to come in contact with almost every other substance and materials, chemical reactions tend to take place in aqueous solutions, therefore affecting and being affected by H+ concentration, e.g., mH+/mol·kg−1, hence its activity, aH+. Activity, aH+, and concentration, mH+, of chemical species are equivalent quantities, i.e., the activity coefficient, γH+= 1 in the limiting condition of ideal dilute solutions, as it is the case of pure water [1]. Aqueous systems range from simple dilute solutions, e.g., distilled water, to complex mixtures of high ionic strength, e.g., seawater [2]. In the very dilute solutions, the concentration of chemical species, molecules or ions, is very small and the approximation γH+ = 1 may be acceptable for some intended uses. Solutions of high complexity, both in terms of species concentration and diversity, introduce interactions that reflect upon deviations from ideality, with activity coefficients becoming significantly different from 1.
Mean values for activity coefficients, can be measured for solutions where the concentrations of the respective ions, mH+ and mCl−, are known. Nevertheless owing to the inevitable presence of both anions and cations in solution, experimental assessment of the activity coefficients of individual ions, γ+ or γ− cannot be done. It can only be achieved through model approaches [3]. Experimentally assessed mean values, , or modeled mean, γ±, or single values γH+ or γCl− introduce uncertainty to pH values assigned to the reference buffer solutions subject to measurement. Particularly complex mixtures of high ionic strength, as is the case of seawater, I ≈ 0.7 mol·kg−1, present major deviations from ideality as well as problems of chemical interferences, e.g., due to the presence of sulphate.
Under these various circumstances, covering a wide range of concentrations and matrices, calibration of the measuring setup requires calibration standards of compositions similar to those of the sample solutions. Nevertheless, the common situation is that commercial pH meters come with two or three pH reference buffer solutions (pH (S) = 4,7 and 10) from the list of NIST (ex-NBS) buffers, I ≤ 0.1 mol·kg−1 [4], which are used by the great majority of practitioners who are not fully aware of this potential source of uncertainty. This may eventually bring the result to an unacceptably low level of quality, not fit for its intended purpose. The use of other more appropriate pH buffer solutions, when available, is advisable and is becoming more common practice among experts.
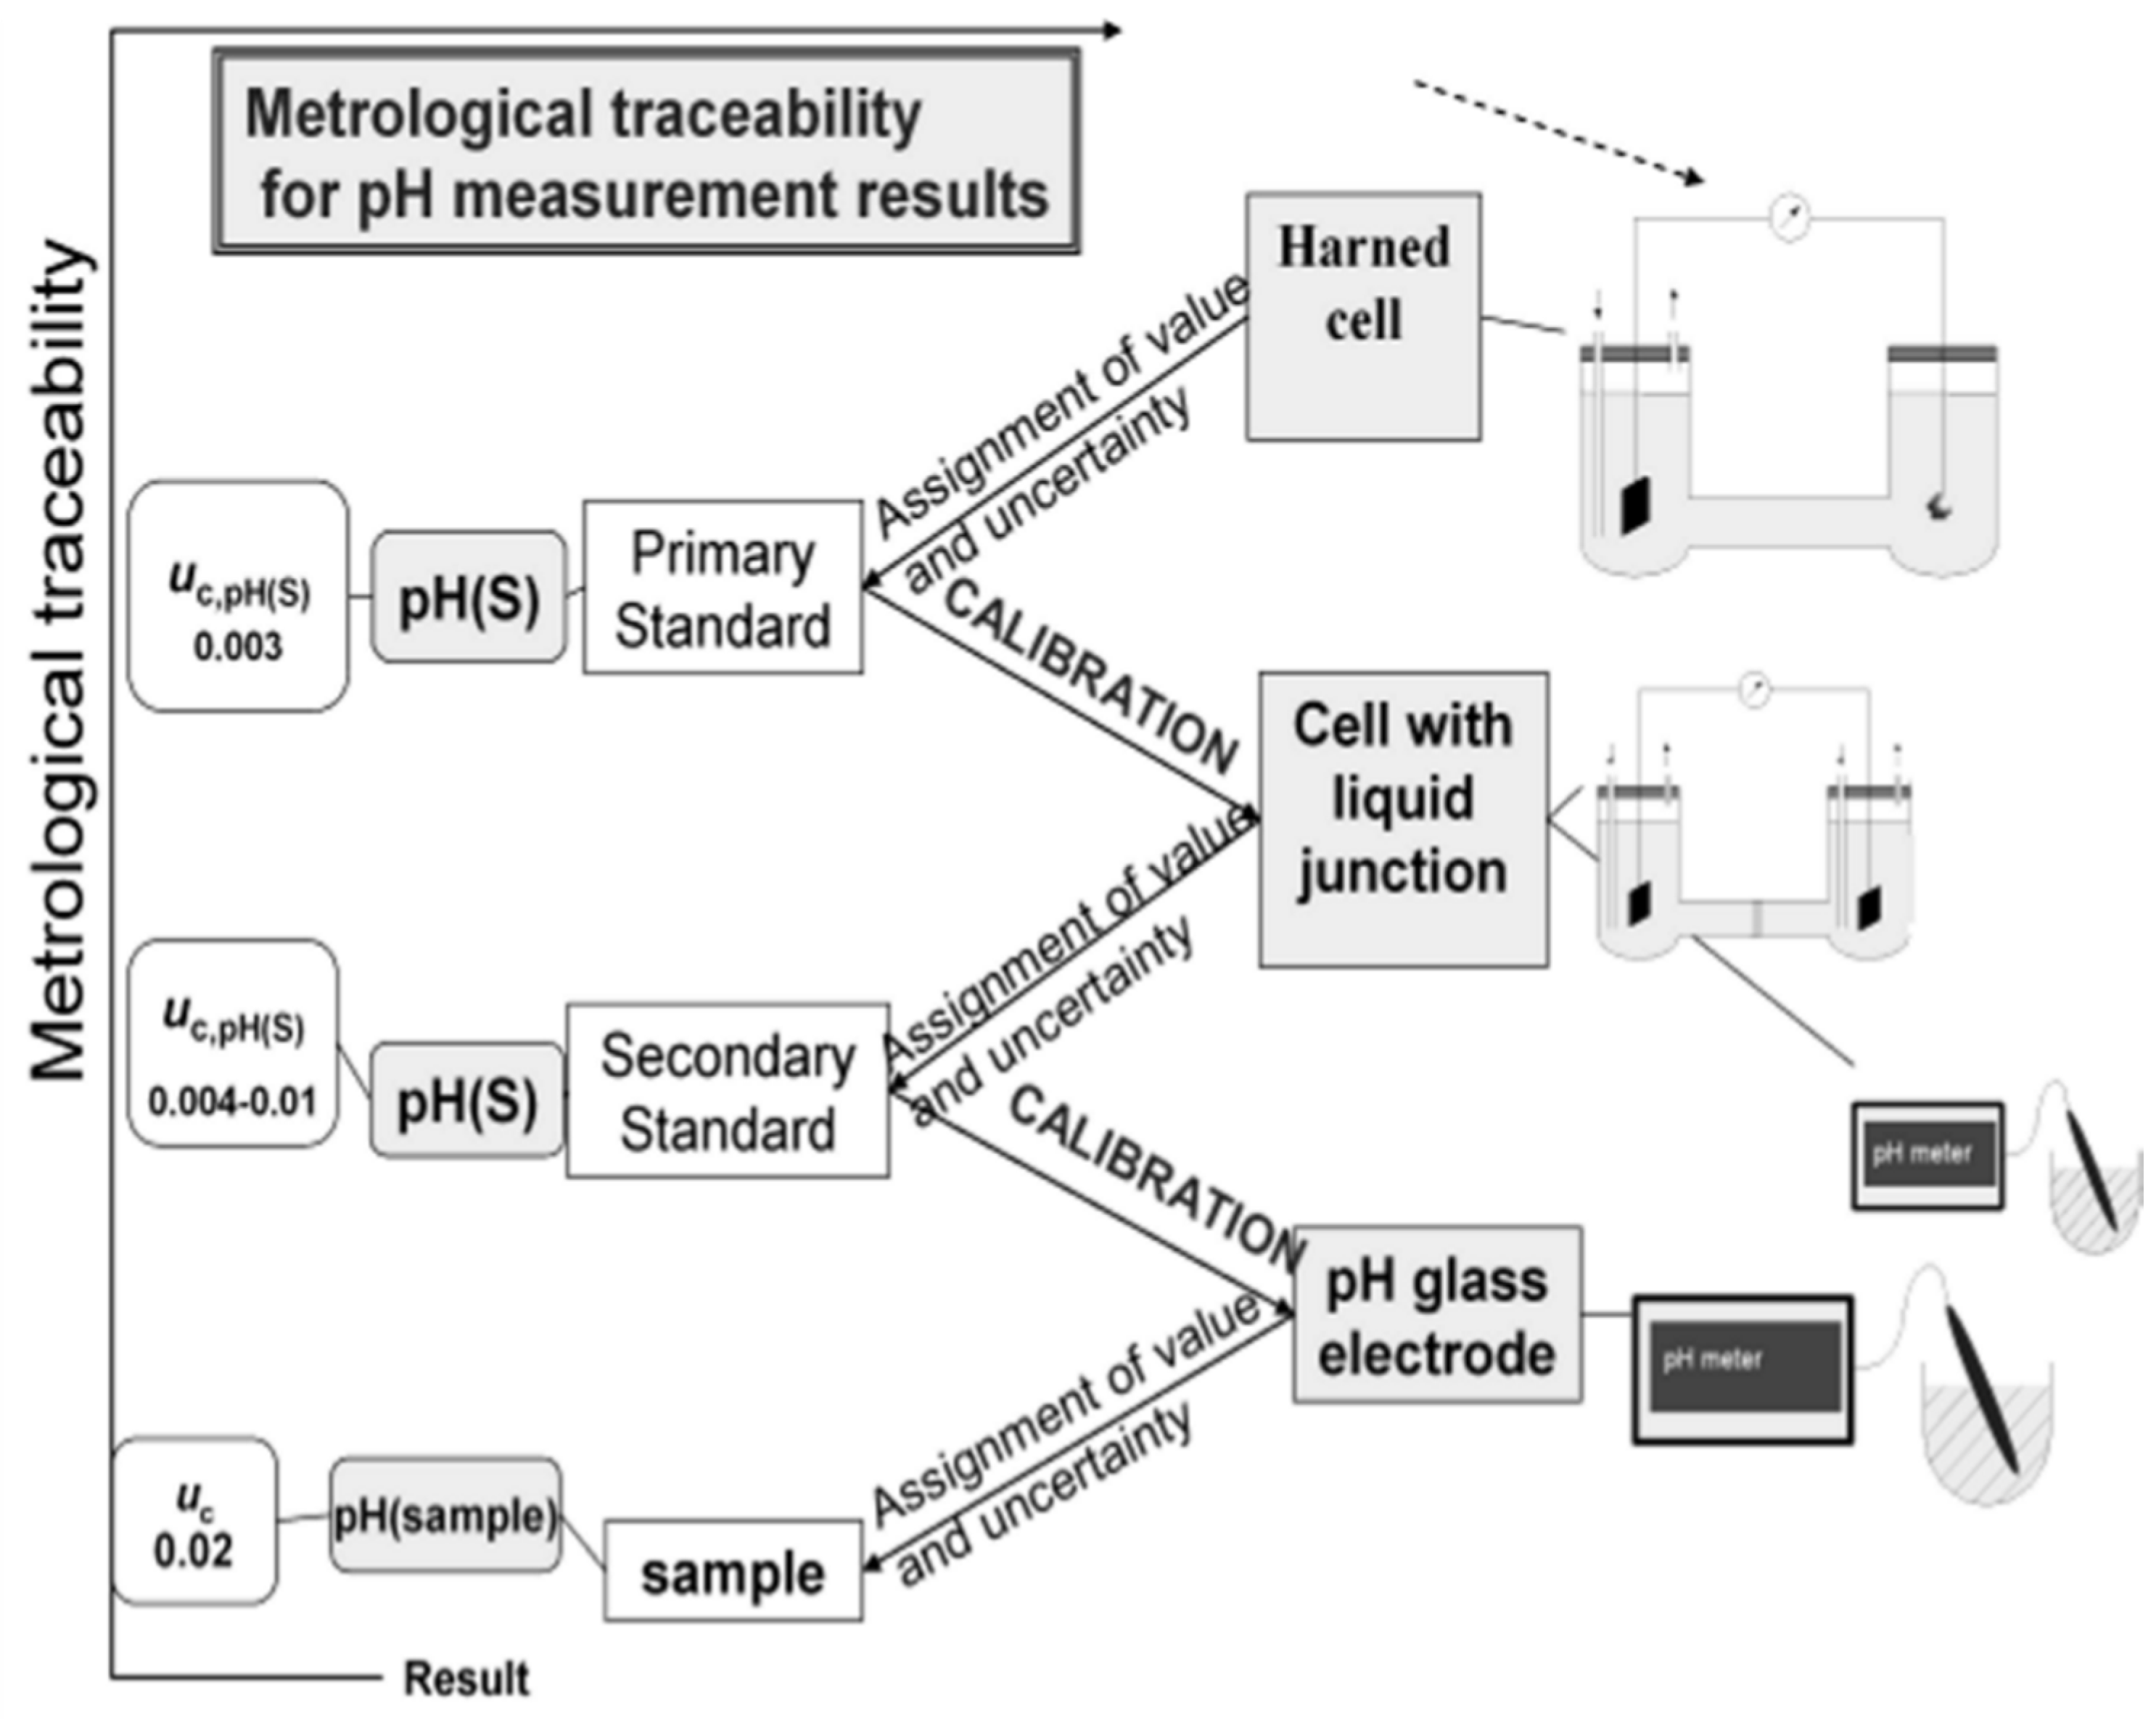
Although the conceptual definition of any chemical quantity is error free, its value obtained from a measurement, or calculated from a model equation, is affected by an uncertainty which is the result of added contributions from the various steps, propagating through the traceability chain [5]. Figure 1 schematically represents the unbroken chain that links the various levels of metrological quality for pH, below the Primary Level, with the corresponding uncertainty target values [6,7] for aqueous solutions up to an ionic strength of 0.1 mol·kg−1. Above this metrological level an additional source of uncertainty, 0.01, is introduced by the purely electrostatic Debye-Hückel model with the Bates-Guggenheim convention for the distance of closest approach of chloride ions, adopted for the assessment of the individual activity coefficient, γCl− [2].
Figure 1.
Metrological traceability scheme for pH. Uc denotes the expanded measurement uncertainty (coverage factor k = 2; the value of the measurand lies with a probability of approximately 95% within the interval of values) assigned to the pH values obtained for aqueous solutions up to an ionic strength of 0.1 mol·kg−1 [7].

For higher ionic strength aqueous solutions, e.g., seawater, I ≈ 0.7 mol·kg−1, a more elaborate model, as it is the Pitzer model, accounting for electrostatic and specific interactions [8], is bound to match reality more closely.
In this work, aiming at addressing seawater, a strategy is presented for the adoption of experimentally assessed mean activity coefficients, . Primary potentiometric measurements were performed in a series of acidic aqueous solutions of known concentration, consistently approaching a seawater matrix, ASW, for the assessment of experimental values of the acidity function, p(aH+γCl−) and mean activity coefficients, . This allows evaluation of pmH+, with the corresponding uncertainty, without extra-thermodynamic assumptions, thus establishing full traceability to the mole. Mean activity coefficients can also be calculated, , upon taking into account a value of mH+ derived from the literature value for the acidity constant of the hydrogen sulphate ion, Ka (HSO4−) [9]. Compatibility with mean activity coefficients calculated from the semi empirical Pitzer model equations , validates the use of the model [10], also available for single ion activity coefficients.
2. Method
Primary pH = paH+ values, are conventionally assigned [2] to primary standard pH buffer solutions (S) of ionic strength, I ≤ 0.1 mol·kg−1, through a primary method, pH (S). This includes measurement of Harned cell (H+ sensitive hydrogen gas electrode and Cl− sensitive silver, silver chloride electrode, without transference) potentials, E, calculations with the Nernst equation (Equation (1)) and adoption of extra-thermodynamic assumptions concerning models of electrolyte solutions, for the assignment of mean or single activity coefficients:
where E0 is the standard cell potential, assessed from measurement in 0.01 mol·kg−1 HCl, R is the gas constant, T is the absolute temperature and F is the Faraday constant.
This equation can be rearranged to give the acidity function, p(aH+γCl−), (Equation (2)):
solely expressed in terms of experimentally available quantities:
−lg(𝑎H+𝛾Cl−) = p(𝑎H+𝛾Cl−)
pH (S) values can be calculated from the acidity function by adoption of a conventional value to the activity coefficient of the chloride ion, γCl−.
H (S) = p𝑎H+ = − lg(𝑎H+𝛾Cl−) +lg𝛾Cl−
By adopting the purely electrostatic Debye-Hückel model with the Bates–Guggenheim convention for the chloride ion, γCl−, valid to ionic strengths, I, below 0.1 mol·kg−1, and assuming the value 0.01 in pH for the respective uncertainty, pH becomes traceable to the internationally accepted SI [2]. Above this value, the model is no longer valid and the use of the Pitzer model [8] has been debated.
The experimental procedure is, nevertheless, the basis for the assessment of the mean activity coefficient, , for solutions of known mCl− and mH+, independent of model assumptions:
Since it is:
the standard uncertainty of the acidity function, u[p(aH+γCl−)], can be calculated [11] by Equation (10).
where pH2 is the partial pressure of hydrogen in the cell and ∆E is the bias potential of the Ag/AgCl electrodes.
p(𝑚H+) = − lg𝑚H+ = p(𝑎H+𝛾Cl−) + 2lg𝛾± = p𝑚H (S)
The uncertainty of p mH (S) is assessed through Equations (11)–(13).
where
Through the application of this methodology to proper selected standard pH buffer solutions (S), for which chloride concentration, mCl−, and valid γ± values have been assessed, it is possible to obtain pmH(S). Making the reference buffers further available for the calibration of measuring devices, allows evaluation of pmH+ values for unknown aqueous samples, based on experimental values, hence fully traceable to the mole. This is of particular relevance for speciation studies, in environmental sciences and toxicological studies.
The two quantities, paH+ and pmH+, are related through the activity coefficient of the single hydrogen ion, γH+.
pH = p𝑎H+ = p𝑚H+ − lg𝛾H+
Activity coefficients, γ±, γH+ and γCl− can also be calculated by means of Pitzer electrolyte solutions model equations [8,12,13,14], thus enabling assessment of the consistency between experimental and model approaches.
Assessed by either potentiometry with the glass combination pH electrode, or by other recommended instrumental method for evaluation of hydrogen ion signal, measured pH or pmH+ values will always be affected by an uncertainty equal or bigger than the one respectively associated to the reference pH (S), or pmH(S) values assigned to the calibrating solutions, S.
In the particular case of seawater, the methodology can be applied to, e.g., a Tris-TrisHCl reference buffer prepared in a matrix of artificial seawater, ASW [15,16] which is becoming widely adopted by the oceanographic community. UV-Vis spectrophotometry, with m-cresol purple indicator, has gained support as an alternative to potentiometry with pH electrodes [17].
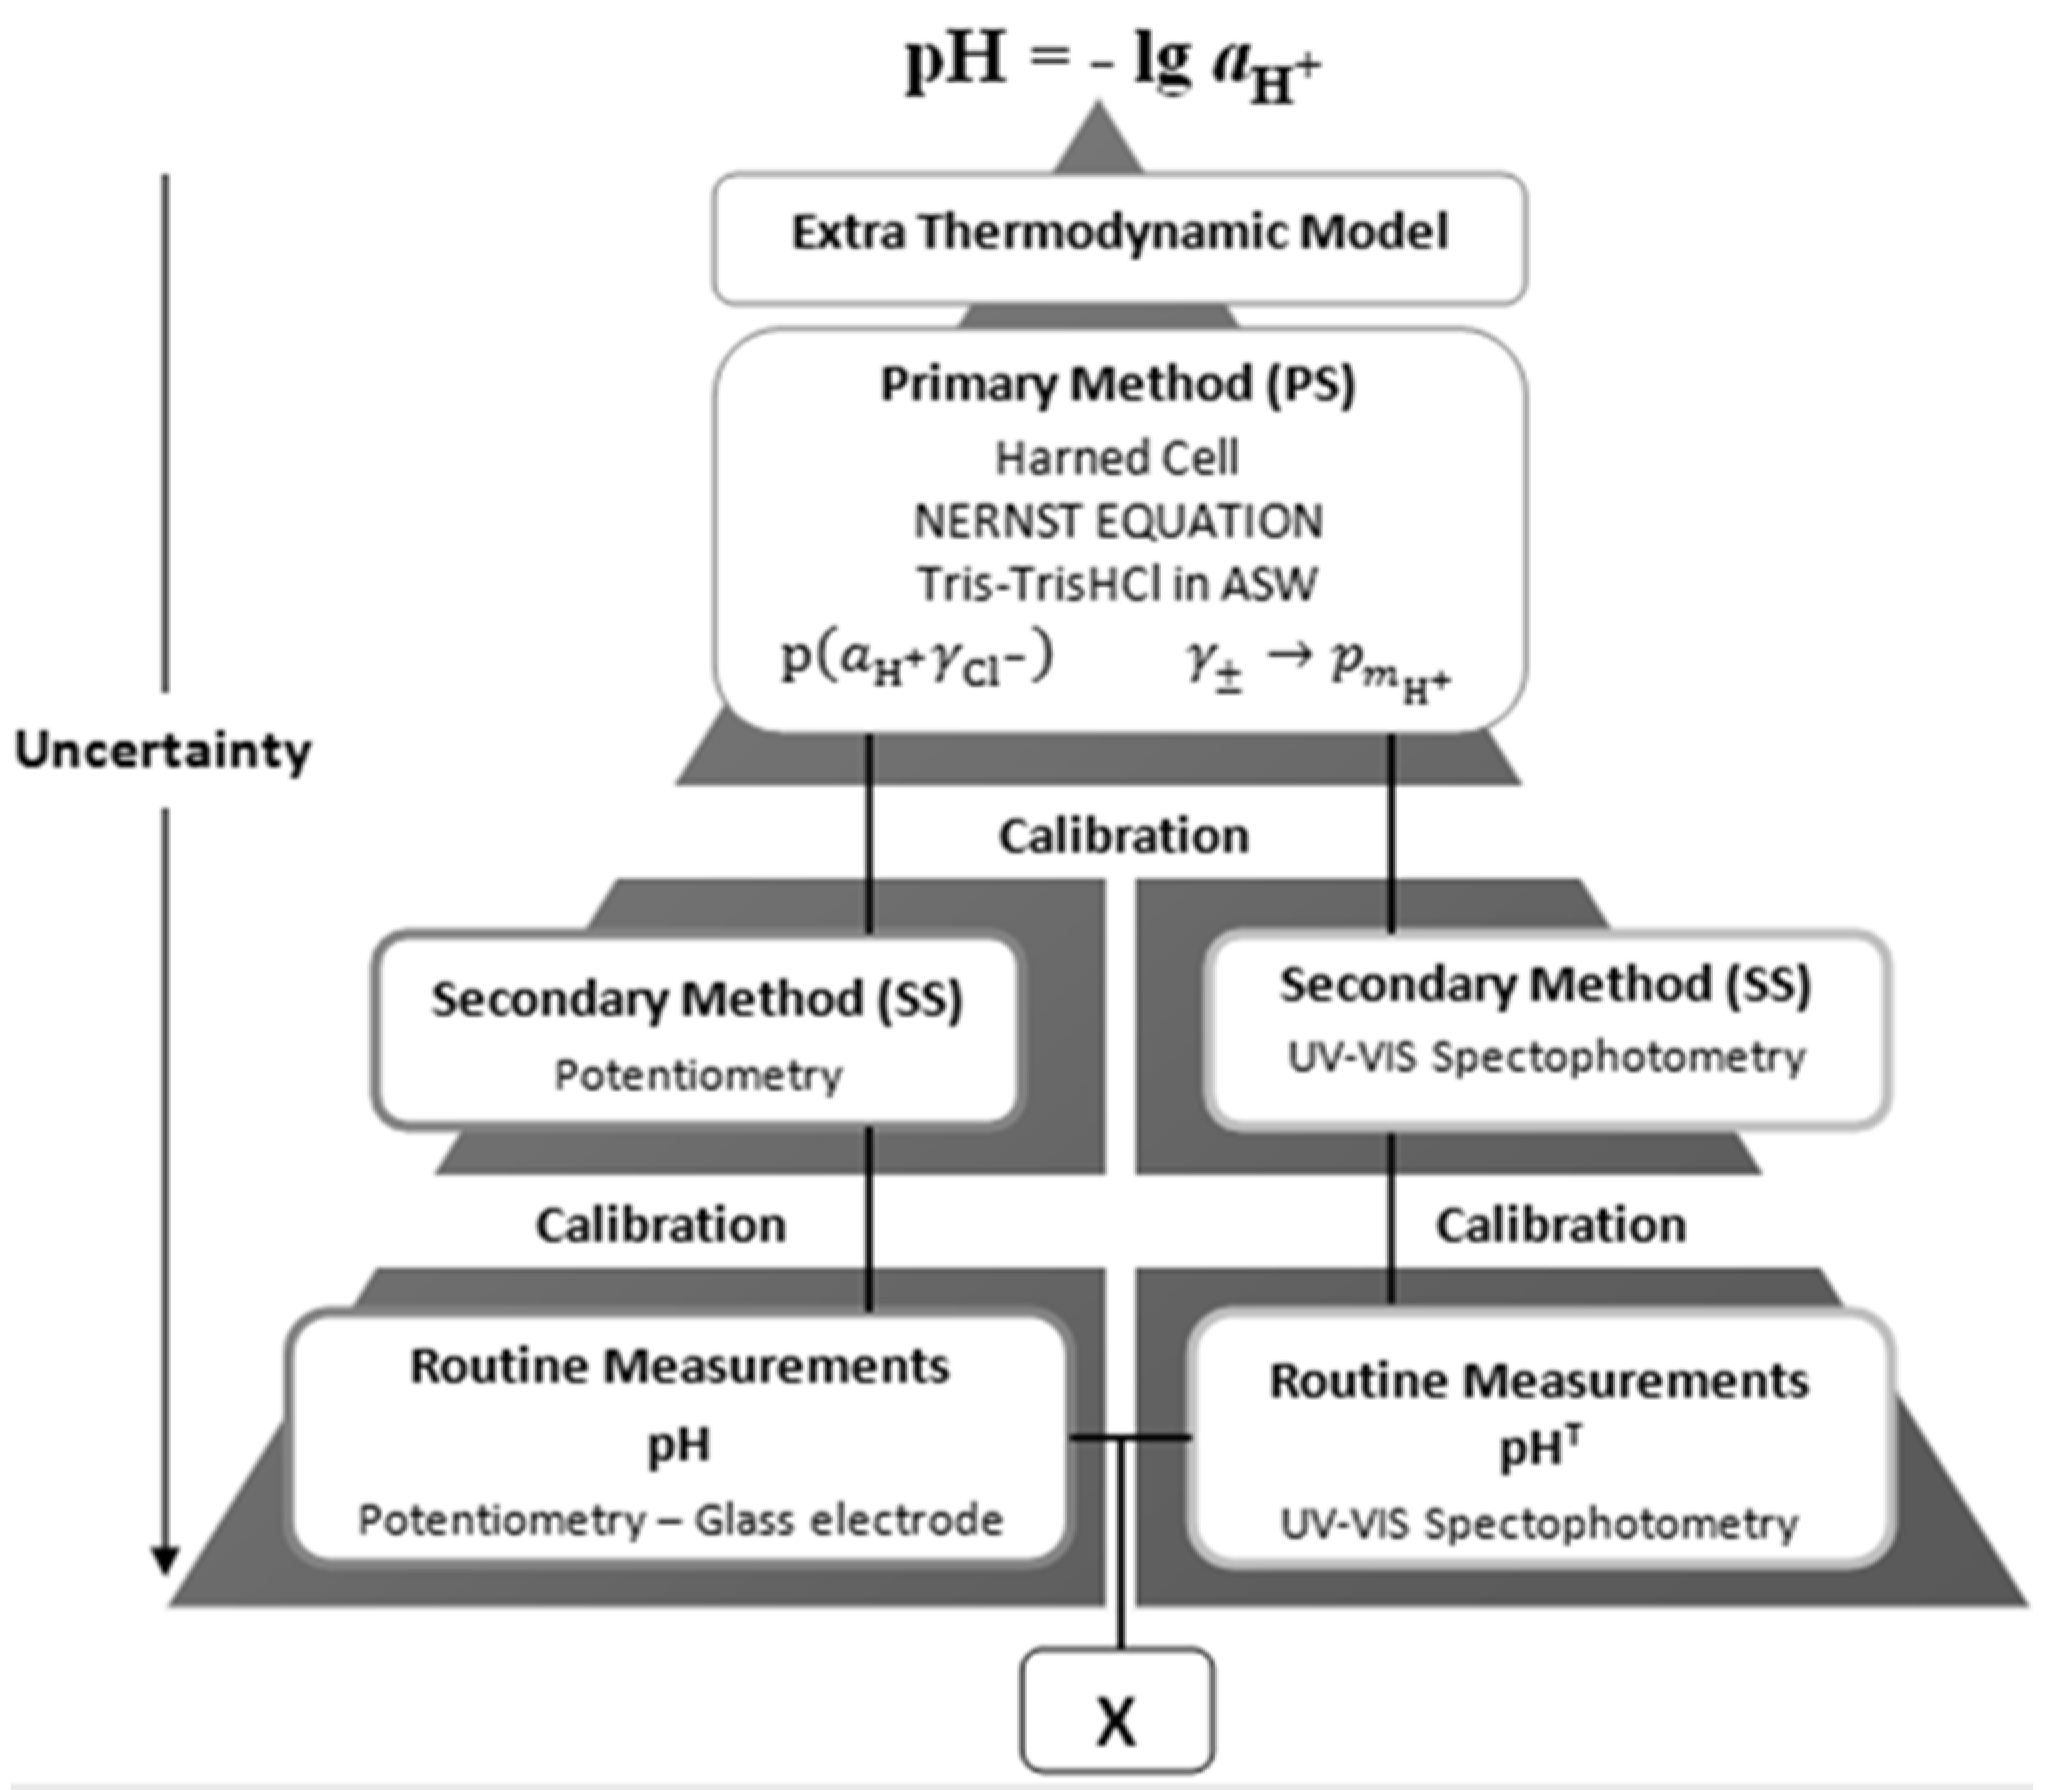
Traceability of results to common references is a key issue for ensuring their comparability and enabling interpretation in terms of the physical-chemical meaning of the quantities, pH or pmH+, hence on the properties of the aquatic systems under study. This is illustrated by a double traceability chain, represented schematically by Figure 2, which enables assessment of compatibility of measured results [18].
Figure 2.
Schematic representation of a double traceability chain, showing traceability of two different types of analytical signals pertaining to hydrogen ion, H+, to common references of pH or pmH+, and higher up to the conceptually defined pH value.
Figure 2.
Schematic representation of a double traceability chain, showing traceability of two different types of analytical signals pertaining to hydrogen ion, H+, to common references of pH or pmH+, and higher up to the conceptually defined pH value.

3. Results and Discussion
Harned cell potentials were measured in acidic saline solutions approaching seawater composition, 0.01 mol·kg−1 HCl + (NaCl + KCl + Na2SO4 + CaCl2 + MgCl2), at I = 0.67 mol·kg−1 [19]. All measurements were performed at 25 °C [10].
Solid reagents were of the highest purity grade (≥99.99%). Hydrochloric acid stock solutions were prepared from Merck Suprapur® 30% HCl solution and were reassessed by titration against tris(hydroxymethyl) methylamine (Sigma-Aldrich ≥99.8% purity, supplied by Química, S.L., Sintra, Portugal) according to reference procedures [20]. All solutions were prepared using high purity Millipore® Milli-Q Advantage water, with resistivity higher than 18.2 MΩ·cm.
Recommended procedures have been followed [2] ensuring experimentally assessed values of acidity function, p(aH+γCl−), mean activity coefficients, , hence also p(mH+). Mean activity coefficients calculated from experimental data, , for sulphate-free solutions were co-opted for solutions of the same ionic strength where sodium sulphate substituted an equivalent amount of sodium chloride. Mean activity coefficients can also be calculated, , upon taking into account a value of mH+ based on the literature value for the acidity constant of the hydrogen sulphate ion, Ka (HSO4−).
Mean activity coefficients have also been calculated by means of Pitzer model equations, at 25 °C.
Assessment of compatibility between , and , for approximately 95% confidence level, supports consistency of the Pitzer model for the different involved interactions [10].
The standard uncertainties for were obtained for three different background solutions of different complexity approaching seawater composition, Table 1, respectively:
- Solution A—0.01 mol·kg−1 HCl + NaCl
- Solution B—0.01 mol·kg−1 HCl + (NaCl + KCl + CaCl2 + MgCl2)
- Solution C—0.01 mol·kg−1 HCl + (NaCl + KCl + Na2SO4 + CaCl2 + MgCl2)
The value of for solution B has been imported into solution C, which allowed calculation of the corresponding mH+. In parallel, as an alternative procedure for this later, Ka = 1.2 × 10⁻² [8], was used to calculate mH+, which on its turn led to .
Values obtained for the uncertainty components of pmH(S), (Equation (12)), for HCl in saline background, are also presented in Table 1. These values lead to estimation of the combined uncertainty u(pmH+).

Table 1.
Acidity function p(aH+γCl−) and pmH+ values with their respective uncertainty, u, budgets assessed in different background solutions: A, B and C.
| Solution | γ± | u(γ±) | u(2lgγ±) | p(aH+γCl−) | u(paH+γCl−) | pmH+ | u(pmH+) |
|---|---|---|---|---|---|---|---|
| A * | 0.7440 | 0.0085 | 0.010 | 2.2939 | 0.0038 | 2.037 | 0.011 |
| B * | 0.7284 | 0.020 | 0.024 | 2.2919 | 0.0038 | 2.017 | 0.024 |
| C * | 0.7284 | 0.020 | 0.024 | 2.2628 | 0.0038 | 1.988 | 0.024 |
| C ** | 0.7249 | 0.046 | 0.056 | 2.2628 | 0.0038 | 1.983 | 0.056 |
Notes: * γ± = ; ** γ± = .
The considerably higher uncertainty value u(2lgγ±) for the sulphate containing solution (C**) is due to the high impact of the acidity constant, Ka(HSO4−), on the calculation of the uncertainty of .
The contribution of the uncertainty introduced by γ± to pmH+ has been calculated for the two values of mean activity coefficient, and , and for the possible scenario of an order of magnitude lower uncertainty level, C′, Table 2.
Table 2.
Uncertainty introduced by γ± to the calculation of pmH+ for acidic solutions in seawater background, function of its uncertainty level.
| Solution | γ± | uγ± | u(2lgγ±) | u(pmH+) | UpmH+ (Expanded, k = 2) |
|---|---|---|---|---|---|
| CExp | 0.7284 | 0.020 | 0.024 | 0.024 | 0.048 |
| C′Exp | 0.7284 | 0.0020 | 0.0024 | 0.0024 | 0.0048 |
| CCalc | 0.7249 | 0.046 | 0.056 | 0.056 | 0.12 |
| C′Calc | 0.7249 | 0.0046 | 0.0056 | 0.0056 | 0.012 |
| CPtz | 0.76998 | 0.00518 | 0.0058 | 0.0058 | 0.012 |
The major influence on the estimation of u(pmH+) comes from the uncertainty of the mean activity coefficient, uγ±. As shown, its effect, u(2lgγ±), can be lowered upon improvement of the quality of the raw data .
4. Conclusions
A series of acidic aqueous solutions in single and complex chloride media of known concentration, consistently approaching a seawater matrix, ASW, were prepared and subject to primary potentiometric measurements for the assessment of experimental values of the acidity function, p(aH+γCl−) and mean activity coefficients, .
Assessment of the mean activity coefficient, γ±, for reference pH buffer standards, S, allows further calculation of their respective concentrations, mH+, hence −lgmH+ = pmH+ = pmH(S).
Compatibility of experimental values, , and model assessed, , enables adoption of either approach with equivalent quality.
Adding to the uncertainty of the acidity function, (paH+γCl−) the major uncertainty component largely contributing to the combined uncertainty of pmH+, u(pmH+), comes from (γ±).
Application of the developed methodology to adequately chosen reference buffer solutions, S, leads to assignment of pmH(S) values with their respective uncertainties. This enables calibration of measuring devices in terms of pmH+, thus ensuring fully traceable sample pmH+values.
Acknowledgments
This work was financially supported by the EMRP- ENV 05 OCEAN and the associated REG2. The EMRP is jointly funded by the EMRP participating countries within EURAMET and the European Union. The authors wish to acknowledge the Portuguese funding institution Fundação para a Ciência e a Tecnologia-FCT, for supporting their research, namely through project PEst-OE/QUI/UI0612/2013.
Author Contribution
Maria Filomena Camões conceived the research program and supervised the work of Bárbara Anes; both authors had active roles in the calculations, critical analysis and elaboration of the conclusions.
Conflicts of Interest
The authors declare no conflict of interest.
References
- Bates, R.G. Determination of pH, Theory and practice, 2nd ed.; Wiley: New York, NY, USA, 1973. [Google Scholar]
- Buck, R.P.; Rondinini, S.; Covington, A.K.; Baucke, F.G.K.; Brett, C.M.A.; Camoes, M.F.; Milton, M.J.T.; Mussini, T.; Naumann, R.; Pratt, K.W.; et al. Measurement of pH. Definition, standards, and procedures (IUPAC Recommendations 2002). Pure Appl. Chem. 2002, 74, 2169–2200. [Google Scholar]
- Bates, R.G. pH Measurements in the Marine Environment. Pure Appl. Chem. 1982, 4, 229–232. [Google Scholar] [CrossRef]
- Covington, A.K.; Bates, R.G.; Durst, R.A. Definition of pH scales, standard reference values, measurement of pH and related terminology (Recommendations 1984). Pure Appl. Chem. 1985, 57, 531–542. [Google Scholar] [CrossRef]
- Camões, M.; Filomena, G.F.C.; Bettencourt da Silva, R.J.N. Traceability of analytical measurements. In Improving Traceability in Food Processing and Distribution; ISBN 1-85573-959-3. Woodhead Publishing Limited: Cambridge, UK, 2006. [Google Scholar]
- De Bièvre, P.; Dybkær, R.; Fajgelj, A.; Hibbert, D.B. Metrological traceability of measurement results in chemistry: Concepts and implementation (IUPAC Technical Report). Pure Appl. Chem. 2011, 83, 1873–1935. [Google Scholar] [CrossRef]
- Spitzer, P.; Seitz, S. Metrological Traceability Chain for pH Measurement Results. J. Metrol. Soc. India 2010, 25, 191–196. [Google Scholar] [CrossRef]
- Pitzer, K.S. Thermodynamics of electrolytes. I. Theoretical basis and general equations. J. Phys. Chem. 1973, 77, 268–277. [Google Scholar]
- Christian, G.D. Analytical Chemistry,, 6th ed.; John Wiley and Sons, Inc.: Hoboken, NJ, USA, 2004. [Google Scholar]
- Anes, B.; Bettencourt da Silva, R.J.N.; Martins, H.F.P.; Oliveira, C.S.; Camões, M. Filomena Compatibility of activity coefficients estimated experimentally and by Pitzer equations. ACQUAL 2015, in press. [Google Scholar]
- Lito, M.J.G.H.M.; Camões, M.F.; Viçoso, C.M. Improving the quality of potentiometric pH measurements. Accredit. Qual. Assur. 2007, 12, 447–445. [Google Scholar]
- Pitzer, K.S.; Mayorga, G. Thermodynamics of electrolytes. II. Activity and osmotic coefficients for strong electrolytes with one or both ions univalent. J. Phys. Chem. 1973, 77, 2300–2308. [Google Scholar]
- Pitzer, K.S.; Mayorga, G. Thermodynamics of electrolytes. III. Activity and osmotic coefficients for 2–2 electrolytes. J. Solut. Chem. 1974, 3, 539–546. [Google Scholar]
- Pitzer, K.S. Activity Coefficients in Electrolyte Solutions; CRC Press: Boston, MA, USA, 1979. [Google Scholar]
- DelValls, T.A.; Dickson, A.G. The pH of buffers based on 2-amino-2-hydroxymethyl-1,3 propanediol (“tris”) in synthetic sea water. Deep Sea Res. I 1998, 44, 1541–1554. [Google Scholar] [CrossRef]
- Nemzer, B.V.; Dickson, A.G. The stability and reproducibility of Tris buffers in synthetic seawater. Mar. Chem. 2005, 96, 237–242. [Google Scholar] [CrossRef]
- Carter, B.R.; Radich, J.A.; Doyle, H.L.; Dickson, A.G. An automated system for spectrophotometric seawater pH measurements. Limnol. Oceanogr. Methods 2013, 11, 16–27. [Google Scholar] [CrossRef]
- Camões, M.F.; Spitzer, P. Traceability of pH Measurements. In Proceedings of the 225th ECS Meeting, ECS Transactions (ECST), Glasgow, Scotland, 26–31 July 2014.
- Stoica, D.; Ben-Achour, M.; Spitzer, P.; Fisicaro, P.; Vaslin-Reimann, S. Mesure du pH de l’eau de mer: Un défi d’actualité. Rev. Fr. Métrol. 2014, 2, 23–30. (In French) [Google Scholar]
- Brown, R.; Milton, M.; Brewer, P.; Wielgosz, R. High Accuracy Titrimetry with Application to HCl; NPL Report COAM 5; ISSN 1474-6684; National Physical Laboratory: Teddington, UK, 2001. [Google Scholar]
© 2015 by the authors; licensee MDPI, Basel, Switzerland. This article is an open access article distributed under the terms and conditions of the Creative Commons Attribution license (http://creativecommons.org/licenses/by/4.0/).
Share and Cite
MDPI and ACS Style
Camões, M.F.; Anes, B. Traceability of pH to the Mole. Water 2015, 7, 4247-4255. https://doi.org/10.3390/w7084247
AMA Style
Camões MF, Anes B. Traceability of pH to the Mole. Water. 2015; 7(8):4247-4255. https://doi.org/10.3390/w7084247
Chicago/Turabian StyleCamões, Maria Filomena, and Bárbara Anes. 2015. "Traceability of pH to the Mole" Water 7, no. 8: 4247-4255. https://doi.org/10.3390/w7084247