Abstract
We monitored the water quality and hydrological conditions of a horizontal subsurface constructed wetland (HSSF-CW) in Beijing, China, for two years. We simulated the area-based constant and the temperature coefficient with the first-order kinetic model. We examined the relationships between the nitrogen (N) removal rate, N load, seasonal variations in the N removal rate, and environmental factors—such as the area-based constant, temperature, and dissolved oxygen (DO). The effluent ammonia (NH4+-N) and nitrate (NO3−-N) concentrations were significantly lower than the influent concentrations (p < 0.01, n = 38). The NO3−-N load was significantly correlated with the removal rate (R2 = 0.96, p < 0.01), but the NH4+-N load was not correlated with the removal rate (R2 = 0.02, p > 0.01). The area-based constants of NO3−-N and NH4+-N at 20 °C were 27 ± 26 (mean ± SD) and 14 ± 10 m∙year−1, respectively. The temperature coefficients for NO3−-N and NH4+-N were estimated at 1.004 and 0.960, respectively. The area-based constants for NO3−-N and NH4+-N were not correlated with temperature (p > 0.01). The NO3−-N area-based constant was correlated with the corresponding load (R2 = 0.96, p < 0.01). The NH4+-N area rate was correlated with DO (R2 = 0.69, p < 0.01), suggesting that the factors that influenced the N removal rate in this wetland met Liebig’s law of the minimum.
1. Introduction
The rapid economic development witnessed in recent years in China has led to vast increases in the production of human sewage and other waste effluents, most of which are rich in nitrogen (N) compounds. Nitrogen not only affects the water quality, but also contributes to water eutrophication [1], especially in lakes and rivers [2]. Therefore, N removal from wastewater has become a topic of growing concern, both in China and worldwide [3,4]. Wetlands play an increasingly important role in removing N from aquatic systems via various processes, and can achieve total nitrogen (TN) removals of between 40% and 55% [5]. The two most common forms of N in wetlands are organic and inorganic. Organic N is made up of a variety of compounds, including amino acids, urea and uric acid, and purines and pyrimidines. Inorganic forms of N in wetlands include ammonia (NH4+-N), nitrite (NO2−-N), nitrate (NO3−-N), nitrous oxide (N2O), dissolved elemental N, or dinitrogen gas (N2) [6].
Constructed wetlands (CWs) are rapidly becoming a viable method for wastewater treatment worldwide [7], because of their similarity to natural wetlands and the fact that they cost less to construct, implement, and maintain than other types of treatments [8,9]. Constructed wetlands can be used to prevent water eutrophication [10]. For example, it was reported that, over a period of seven consecutive years, CWs were able to maintain a higher removal rate of N than traditional N removal processes [11]. The HSSF-CWs have a purification function, in that the sewage water flows to the outlet end in a horizontal direction and transverses the sand medium and plant roots in turn. In HSSF-CWs, N removal is achieved by a combination of physical, chemical, and biological processes, which are affected by a range of factors, such as pH, dissolved oxygen (DO), and temperature [12]. Mathematical models can be used to simulate N removal and the relationships between various parameters and the N removal rates in constructed wetlands to reflect the removal mechanisms in wetlands. This information can then be used to provide decision support and the scientific basis for improving ecosystem service functions of wetlands [13]. Previous studies suggested that the first-order kinetics model could describe N removal in wetland ecosystems [14,15]. However, recent studies that have used the first-order kinetics model for N removal have mainly focused on the application of the area-based constant and volume-based rate constant in HSSF-CWs, and, to date, applications of the area-based constant to HSSF-CWs and assessments of the influence of water pollution loads, temperature, and DO on the area-based constant have been largely neglected [16].
Using as its basis the wetland water balance principle, in which the potential water transfer mechanism inputs and outputs, including runoff, groundwater recharge, and lateral inflow or drainage processes, are balanced, the aim of this study was to examine the removal and seasonal variations of two N forms, namely NO3−-N and NH4+-N, in an HSSF-CW [17,18]. The first-order kinetic model, a commonly used hydrological model, has been frequently used to predict, for example, variations in water chemistry, sudden changes in influent organic loads, NO3−-N removal, and pharmaceuticals removal [19,20,21,22]. We also used the first-order kinetic model to estimate the area-based constant and temperature coefficient of N removal in this study. Further, to improve the accuracy and consistency of the model parameters, we also examined the relationships between the area-based constant and factors that influenced it, such as temperature, pollution load, and DO.
2. Materials and Methods
2.1. Study Site Description
Our study was carried out in a HSSF-CW in the Beijing Wildlife Rescue and Rehabilitation Center, Beijing, China (Latitude: 40°6′14.40′′ N, Longitude: 116°42′35.71′′ E) (Figure 1). The annual average temperature at the study site is 11.5 °C. The average temperatures in January and July are 4.9 and 25.7 °C, respectively, and the minimum temperature in July 2012 and 2013 was 19.1 °C. The average annual rainfall is 625 mm from 2012 to 2013. The wetland consists of three treatment cells (Table 1), and its purpose is to improve the water quality of the artificial lake in the site. The main pollution source of the water is the waste water from the bird life in the lake. Gravel is the principal media; there are two layers, one 20 cm deep that comprises gravels with a diameter of between 15 and 30 mm and the other 50 cm deep comprised of finer gravels with diameters of between 5 and 15 mm from bottom to top. The average water depths in the three treatment cells are 0.3, 0.1, and 0.1 m. Plants in the upper media, planted at a density of two plants per square metre, show vigorous growth. The plant species are mainly Lythrum salicaria, Iris tectorum, and Scirpus validus, with densities of 30, 50, and 60 stem/m2, respectively. Birds, such as Ardea alba, Anas platyrhynchos, and Anatidae, are frequently observed at the lake.
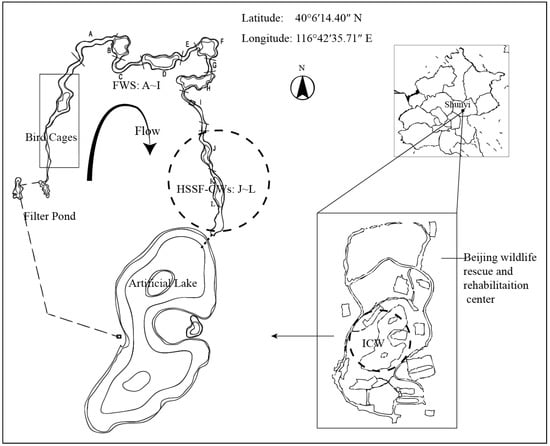
Figure 1.
Diagram showing the location of the constructed wetland.

Table 1.
Configurations of the different treatment cells of the HSSF-CW.
2.2. The Water Quality and Hydrology Monitoring
The HSSF-CW was operated with continuous flow from April 2012 to November 2013. The water quality was monitored once a month from April to November in 2012 and 2013. Between December 2012 and March 2013 the low temperatures and frozen water prevented sampling. The sampling points were located in the inflow, middle, and outflow of each cell. Flow-weighted composite water samples were collected from the inlet and outlet of each wetland cell using water samplers. Samples were collected from each point in triplicate. The water samples were collected in 500-mL plastic bottles and stored at 4 °C until analysis. The flow was recorded by a flow meter (SonTek, YSI, Yellow Springs, OH, USA), while meteorological variables, such as rainfall and evaporation, were recorded hourly by a portable weather station (WeatherHawk, CampSci, Logan, Utah, USA). The concentrations of NH4+-N, TN, and NO3−-N were determined using the standard methods for the examination of water and wastewater [23] with a water quality analyzer (SmartChem 200 Chemical Analyzer, West Co., Rome, Italy). A portable water quality probe (EXO, YSI, Yellow Springs, OH, USA) was used to measure DO, temperature, and other In Situ variables.
2.3. Data Analysis and Modeling
Equation (1) represents the wetland water dynamic equilibrium model of the HSSF-CW:
where Qin and Qout are the daily volumetric water inflow and outflow rates (m3∙day−1), respectively, Qc is the catchment runoff rate (m3·day−1), P is the daily precipitation rate (mm·day−1), ET is the daily evapotranspiration rate (mm·day−1), I is the daily infiltration rate (mm·day−1), dV/dt is the net change in volume (m3·day−1), and A is the total area of the wetland (m2).
2.4. The First-Order Kinetic Model of N Removal Applied to the HSSF-CW
The areal removal rate constant and the temperature coefficient were calculated from the monitoring data and the following first-order model [14]:
where Cin and Cout are the influent and effluent concentrations, respectively, in mg∙L−1, C* is the background concentration (mg∙L−1, 0 mg/L), q is the hydraulic loading rate (m∙day−1), t is the temperature, and K(t) is the area-based constant of a first-order removal rate on temperature (m∙year−1). Equation (3) was used to calculate q (m∙year−1):
where Q is total water inflow rate (m3∙day−1).
The effect of temperature on the areal removal rate constant was modelled using the following equation:
The selected variables in this study included concentrations of NH4+-N and NO3−-N, DO, and temperature. The means of actual measured values are presented. Data fitting was carried out with Origin 8.5 and statistical analyses were performed using SPSS version 18.0. Statistically significant differences were determined at the α = 0.01 significance level.
3. Results
3.1. Water Balance
The daily volumetric water inflow and outflow rates of the HSSF-CW were 33 ± 19 and 33 ± 19 m3∙day−1, respectively (Table 2). On the whole, there were no significant differences between the average inflow and outflow rates (p > 0.01, n = 42), which indicates that rainfall had little influence on the HSSF-CW throughout the experimental period. Water was mainly supplied via injection. The large standard deviations in the daily volumetric water inflow and outflow rates indicate that there were considerable changes in the water volume in the HSSF-CW each month.
Table 2.
Flow variations in the HSSF-CW in each treatment cell.
Water injection to the HSSF-CW began in April. As time progressed, the inflow gradually increased. Drainage began in October and the flow decreased with drainage, so the annual flow showed an initial increase and then decreased (Figure 2). The maximum rainfall in the experimental period occurred in July 2012, when 337 mm was recorded; the minimum rainfall (0.5 mm) occurred in November 2013. The outflow was higher than the inflow in July because of the more intensive rainfall in this month.
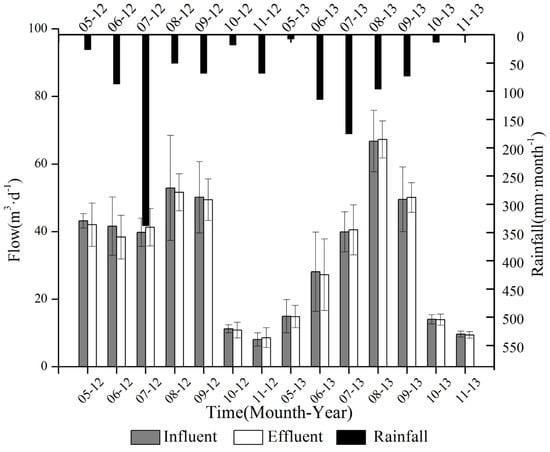
Figure 2.
Average water fluxes, including the influent, effluent, and rainfall, in the HSSF-CW in different months.
3.2. Influent and Effluent Nitrogen Concentrations
The average annual NO3−-N concentration was 3.40 ± 3.44 mg∙L−1, while the annual average NH4+-N concentration was 0.36 ± 0.35 mg∙L−1 (Table 3). Over the monitoring period, the NO3−-N concentrations were higher than the NH4+-N concentrations. The standard deviations of the concentrations of the two N species were very large, which indicates that the concentrations of the two N species changed considerably in different months. When compared to the influent concentrations, we found that the concentrations of NO3−-N and NH4+-N in the effluent had decreased significantly (p < 0.01, n = 38), and were, on average, 1.22 ± 0.92 and 0.27 ± 0.27 mg∙L−1, respectively. The lower concentrations at the outflow of the treatment cell indicate that N was removed from the HSSF-CW in the two years of monitoring. Further, the concentrations of these two N species met Class III of the Surface Water Standards in China. The water standards mainly apply to the centralized drinking water and industrial and agricultural water, and were based on the human health reference values [24].
Table 3.
Average influent and effluent nitrogen concentrations in the HSSF-CW.
There were seasonal variations in the N concentrations of the inflow and outflow of the HSSF-CW (Table 4). The inflow concentrations of NH4+-N (0.60 ± 0.33 mg∙L−1) and NO3−-N (4.52 ± 3.94 mg∙L−1) were highest in spring and summer respectively, while the NO3−-N (0.21 ± 0.20 mg∙L−1) inflow concentration was lowest in spring.
Table 4.
Average influent and effluent nitrogen concentrations in the HSSF-CW in different months.
3.3. Nitrogen Loading and Removal Rate
There is a generally a good relationship between the inflow and outflow concentrations and loadings of TN and NH4+-N in this research. Also, N removal efficiency in constructed wetlands generally falls within a certain range, regardless of whether the N load is large or small [25]. In this study, we found that the NO3−-N pollution load and removal rate were strongly correlated (R2 = 0.96, p < 0.01) (Figure 3), but that the NH4+-N pollution load and removal rate were not correlated (R2 = 0.02, p > 0.01) (Figure 4).
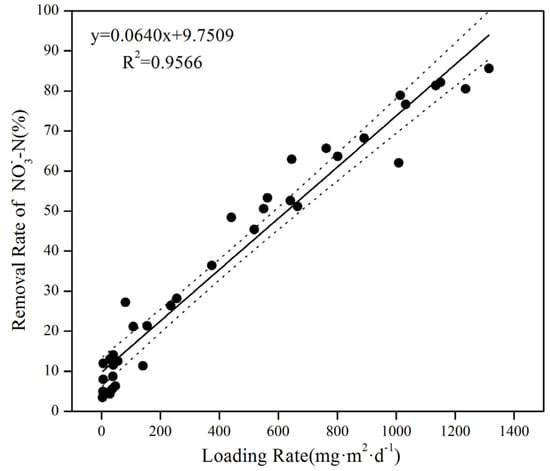
Figure 3.
Relationship between the areal loading and removal efficiency for NO3−-N (the dotted line indicates the 99% confidence limit).
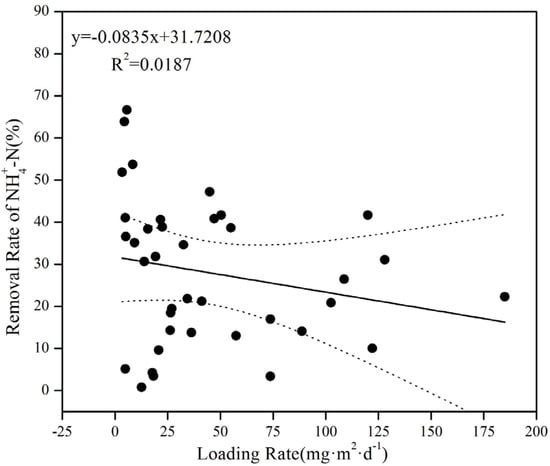
Figure 4.
Relationship between the areal loading and removal efficiency for NH4+-N (the dotted line indicates the 99% confidence limit).
During the study period, the NO3−-N removal rate was higher than that of NH4+-N, and was vulnerable to seasonal changes. The highest NO3−-N and NH4+-N removal rates of 44.7% and 37.4% occurred in summer and autumn, respectively, and are consistent with the higher NO3−-N loads in summer and autumn. The NH4+-N removal rate was lowest in summer (19.1%) because of the higher rainfall in summer. An increase in hydraulic loading rates resulted in a decrease in the NH4+-N removal rate (Table 5).
Table 5.
Areal loading and removal efficiency of the HSSF-CW.
3.4. Estimation of the Area-Based Constants and the Temperature Coefficients
Using Equation (1) and the measured values of Cin and Cout, we calculated area-based constants (K) for NO3−-N and NH4+-N of 27 ± 26 and 16 ± 12 m∙year−1 (Table 6), respectively. The corrected values of K for a temperature of 20 °C, obtained from Equation (4), were 27 ± 26 and 14 ± 10 m∙year−1 for NO3−-N and NH4+-N, respectively. When corrected to 20 °C, the K(20) values of both NO3−-N and NH4+-N were slightly lower, indicating that the influence of temperature on N removal was minimal. The K(20) of NO3−-N and NH4+-N were lower and slightly higher, respectively, than those reported by Kadlec and Wallace [6], but were slightly higher than the values obtained by Dzakpasu et al. [26]. The temperature coefficient (θ) values estimated for NO3−-N and NH4+-N were 1.004 and 0.960, respectively, and were lower than those reported by Kadlec and Wallace [6], but were very similar to those reported by Dzakpasu et al. [26].
Table 6.
The areal rate constants and temperature coefficients of the HSSF-CW.
The temperature of the inflow to the HSSF-CW ranged from 5 to 30 °C. Curves can be fitted using Equation (4), and are shown in Figure 5 and Figure 6. The figures suggest that, for both NO3−-N and NH4+-N (p > 0.01), the area-based constant and temperature were not correlated. At the same time, lower θ values demonstrate that temperature had little or no impact on either the area-based constant or the physical removal process. This contrasts with the conclusion of Huang et al. [27], who reported that the NH4+-N and total nitrogen removal rates were significantly influenced by temperature. Moreover, the findings suggest that temperature had a role in promoting the growth of wetland plants. Therefore, appropriate external thermal insulation measures need to be adopted to cover the surface of the wetland, to ensure improved growth of hardy plants all year round.
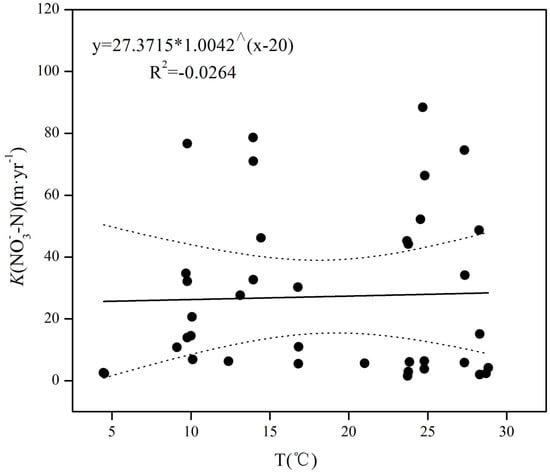
Figure 5.
Relationship between the temperature and areal rate constants for NO3−-N (the dotted line is the 99% confidence limit).
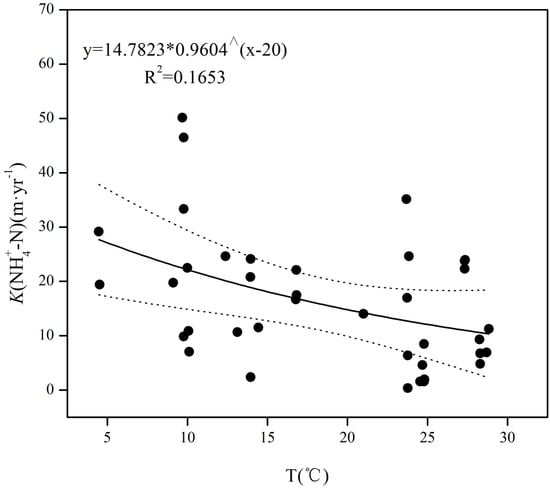
Figure 6.
Relationship between the temperature and areal rate constants for NH4+-N (the dotted line is the 99% confidence belt).
3.5. The Influence of N Loads and DO on the Area-Based Constant
There was a strong linear correlation (R2 = 0.96, p < 0.01) between the area-based constants and loads of NO3−-N (Figure 7). The area-based constants and loads of NH4+-N were not correlated (R2 = 0.037, p > 0.01) (Figure 8), possibly because the NH4+-N loads over the entire study period were lower. This also indicates that the area-based constant can accurately reflect the removal potential of different pollutants in wetland systems that are in receipt of high pollutant loads [28].
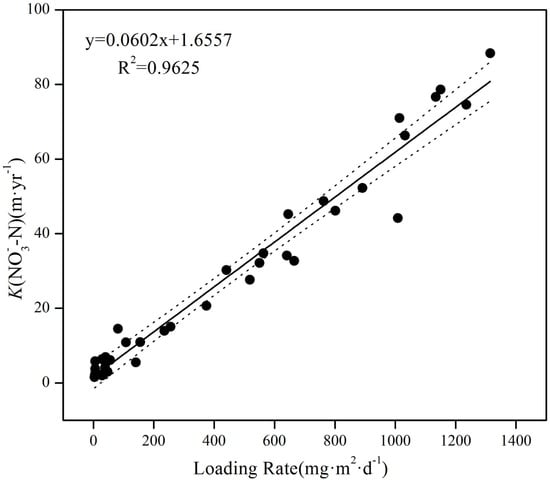
Figure 7.
Relationship between the areal loading and areal rate constants for NO3−-N (the dotted line is the 99% confidence limit).
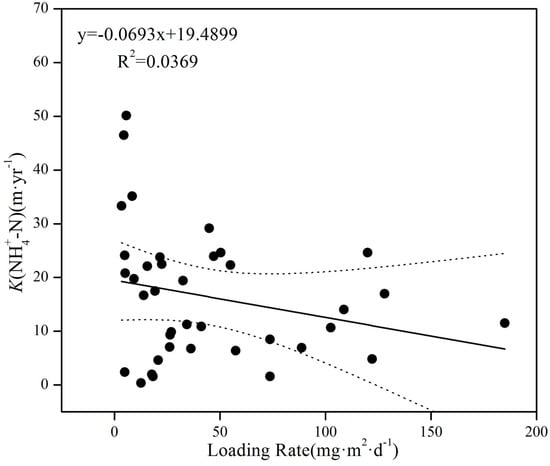
Figure 8.
Relationship between the areal loading and areal rate constants for NH4+-N (the dotted line is the 99% confidence limit).
As shown in Figure 9 and Figure 10, the inflow DO concentrations had a minimal influence on the NO3−-N area-based constants, and the inflow DO concentration and NH4+-N area-based constants were positively correlated (R2 = 0.69, p < 0.01). The lower NH4+-N removal rate may be the result of the lower DO concentrations; these lower DO concentrations lead to anaerobic conditions in wetlands, increase denitrification, and decrease nitrification. In addition, the low DO concentrations may be related to the lack of temperature effects. The lower DO levels would cause a decrease in biodegradation, which suggests that a significant portion of the N removal is driven by physical processes that are not influenced by temperature.
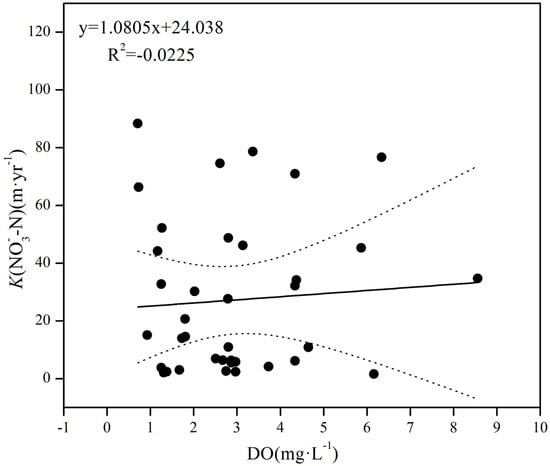
Figure 9.
Relationship between DO and areal rate constants for NO3−-N (the dotted line is the 99% confidence limit).
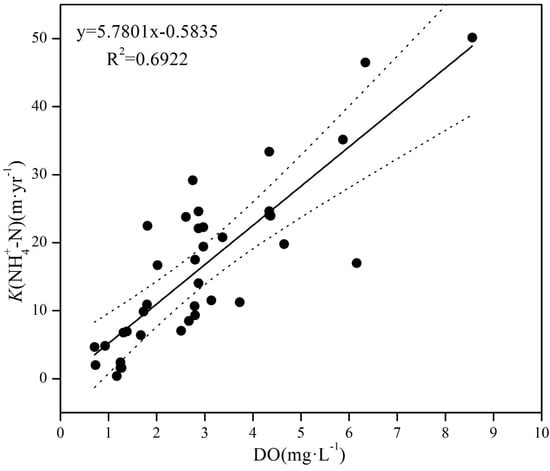
Figure 10.
Relationship between DO and areal rate constants for NH4+-N (the dotted line is the 99% confidence limit).
4. Discussion
In this study, we examined the wetland hydrology of the HSSF-CW over a period of two years using the wetland water balance principal. The results showed that water injection was the main source of water to the HSSF-CW. The flows into and out of the wetland varied on a monthly basis. In this study, we combined information about the wetland hydrology and N removal, and the results suggest that, when the rainfall is higher, the hydraulic retention time is lower, which would then influence the N removal rate. The water balance model adopted in this study only included hydrological data, and did not consider factors such as soil, topography, and land use [29]; this is a major limitation of the study.
There was obvious removal of both NO3−-N and NH4+-N in this HSSF-CW. The removal rates however varied on a seasonal basis, with higher NH4+-N inflow concentrations in spring, because the swimming birds that live in the open water connected to the HSSF-CW were more active in April and May than in other months. The inflow NO3−-N concentrations were higher in summer, reflecting the weaker denitrification caused by the abundant rainfall (Figure 2) and shorter hydraulic retention time in summer. The NO3−-N loads were strongly correlated with the removal rate (R2 = 0.96, p < 0.01), but the NH4+-N load and removal rate (R2 = 0.02, p > 0.01) were not correlated. This may reflect the higher and lower inflow loads of NO3−-N and NH4+-N, respectively. Under certain pollutant loads, increased pollutant concentrations are conducive to biofilm formation on the substrate surface, which not only provides good conditions for microbial growth but can also adsorb large quantities of organic matter, thereby contributing to pollutant removal [30].
We examined the relationship between the area-based constant and temperature, pollutant loads, and DO for both NO3−-N and NH4+-N, and also estimated the temperature coefficient θ. The area-based constant and the NO3−-N load were strongly correlated (R2 = 0.96, p < 0.01), but there was no correlation between temperature and DO. The area removal rate constant for NH4+-N was correlated with DO (R2 = 0.69, p < 0.01), but was not correlated with either the temperature or the NH4+-N load. The lower θ value estimated for the two N species illustrates that temperature had little or no impact on nitrification and denitrification.
While many factors influence the N removal efficiency in wetlands, the main controls are nitrification and denitrification [4]. Nitrification needs aerobic conditions and denitrification requires anaerobic conditions. Both processes are affected by the DO concentration, meaning that N removal in constructed wetlands is strongly influenced by the DO concentration. There are three main sources of oxygen in constructed wetlands, including release from plants, atmospheric reaeration, and oxygen transported by water, of which release from plants and atmospheric reaeration dominate [31]. Plants can also partly block the oxygen transfer process from water to the substrate [32], so that the low oxygen concentration in the substrate becomes the main limit on NH4+-N removal. In this study, the concentrations of DO in the HSSF-CW varied from 0.5 to 4.5 mg∙L−1, and the DO% was as high as 87%. These DO concentrations are much lower than the water-saturated dissolved oxygen concentration [33], indicating that the DO concentrations in this HSSF-CW were sufficiently low to satisfy the conditions for denitrification. The DO concentration did not limit NO3−-N removal in this HSSF-CW. The NH4+-N area-based constant and DO were correlated (R2 = 0.69, p < 0.01), suggesting that the low DO concentration became the limiting factor for NH4+-N removal. Nitrification of NH4+-N is slower than degradation of organics [34], and the conditions for nitrifying bacteria are more stringent than those for fungus that consume organic matter. The oxygen was first used to remove organic matter when the concentrations of organics were high; this was followed by nitrification until the organic concentrations dropped to a low level. The controls on the N removal rate in this wetland met Liebig’s law of the minimum, therefore, the main way to improve the pollutant removal in constructed wetlands is to regulate and control the dissolved oxygen content [35].
The flow regime and N migration and transformation processes in constructed wetlands involve many complex physical, chemical, and biological processes. The N removal models are more complicated than those for other conventional wastewater treatments [36]. Also, the background concentrations of pollutants in the same type of wetland will vary [37]. In this study, we considered only three controls on the area-based constants and did not consider the influence of background pollutant concentrations. These other factors will be explored in future studies.
5. Conclusions
The main water source of this HSSF-CW in the Beijing Wildlife Rescue and Rehabilitation Center was system injection and the main N forms were NH4+-N and NO3−-N. Over a period of two years, the effluent concentrations of both N forms were significantly lower than the influent concentrations (p < 0.01, n = 38). The NO3−-N load was significantly correlated with the removal rate and the NO3−-N removal rate varied seasonally. The inflow concentrations of NH4+-N and NO3−-N were highest in spring and summer, respectively, while the NO3−-N inflow concentration was lowest in spring. The area-based constant for NO3−-N was correlated with the pollution load (p < 0.01), but was not correlated with either temperature or the DO concentration (p > 0.01). The NH4+-N area-based constant was correlated with the DO concentration (p < 0.01) but was not correlated with either temperature or the pollutant load (p > 0.01). The controls on the N removal rate in this wetland meet Liebig’s law of the minimum.
Acknowledgments
This study was supported by the Fundamental Research Funds for the Central Non-Profit Research Institution of CAF “N Removal mechanisms of subsurface constructed wetland in Health wetland” (CAFYBB2014QA029) and “The Lecture and Study Program for Outstanding Scholars from Home and Abroad” (CAFYBB2011007).
Author Contributions
Lijuan Cui and Wei Li conceived and designed the experiments; Wei Li, Yaqiong Zhang and Kai Li performed the experiments; Yaqiong Zhang and Xinsheng Zhao analyzed the data; Manyin Zhang, Xu Pan and Wu Ma contributed materials and analysis tools. All authors contributed to interpretation and discussed results. Lijuan Cui, Wei Li, Yaqiong Zhang and Jiaming Wei wrote the manuscript with contributions of all authors.
Conflicts of Interest
The authors declare no conflict of interest.
References
- Conley, D.J.; Paerl, H.W.; Howarth, R.W.; Boesch, D.F.; Seitzinger, S.P.; Karl, E.; Karl, E.; Lancelot, C.; Gene, E.; Gene, E. Controlling eutrophication: Nitrogen and phosphorus. Science 2009, 123, 1014–1015. [Google Scholar] [CrossRef]
- Bilgin, M.; Şimşek, İ.; Tulun, Ş. Treatment of domestic wastewater using a lab-scale activated sludge/vertical flow subsurface constructed wetlands by using Cyperus alternifolius. Ecol. Eng. 2014, 70, 362–365. [Google Scholar] [CrossRef]
- Xiong, J.; Guo, G.; Mahmood, Q.; Yue, M. Nitrogen removal from secondary effluent by using integrated constructed wetland system. Ecol. Eng. 2011, 37, 659–662. [Google Scholar] [CrossRef]
- Liu, X.; Niu, H.; Yan, H.; Ding, Z.; Lu, F.; Ma, X.; Yang, L.; Liu, Y. Research and application of high-efficiency eco-engineering rural sewage treatment system. Trans. Chin. Soc. Agric. Eng. 2013, 29, 184–191. [Google Scholar]
- Vymazal, J. Removal of nutrients in various types of constructed wetlands. Sci. Total Environ. 2007, 380, 48–65. [Google Scholar] [CrossRef]
- Kadlec, R.H.; Wallace, S. Treatment Wetlands; CRC Press: Boca Raton, FL, USA, 2008. [Google Scholar]
- Birch, G.F.; Matthai, C.; Fazeli, M.S.; Suh, J.Y. Efficiency of a constructed wetland in removing contaminants from stormwater. Wetlands 2004, 24, 459–466. [Google Scholar] [CrossRef]
- Bruch, I.; Fritsche, J.; Bänninger, D.; Alewell, U.; Sendelov, M.; Hürlimann, H.; Hasselbach, R.; Alewell, C. Improving the treatment efficiency of constructed wetlands with zeolite-containing filter sands. Bioresour. Technol. 2011, 102, 937–941. [Google Scholar] [CrossRef]
- Lee, S.; Maniquiz, M.C.; Kim, L.-H. Characteristics of contaminants in water and sediment of a constructed wetland treating piggery wastewater effluent. J. Environ. Sci. 2010, 22, 940–945. [Google Scholar] [CrossRef]
- Li, L.; Li, Y.; Biswas, D.K.; Nian, Y.; Jiang, G. Potential of constructed wetlands in treating the eutrophic water: Evidence from Taihu Lake of China. Bioresour. Technol. 2008, 99, 1656–1663. [Google Scholar] [CrossRef]
- Harada, J.; Inoue, T.; Kato, K.; Izumoto, H.; Zhang, X.; Sakuragi, H.; Wu, D.; Ietsugu, H.; Sugawara, Y. Long-term nitrogen compound removal trends of a hybrid subsurface constructed wetland treating milking parlor wastewater throughout its 7 years of operation. Water Sci. Technol. 2016, 73, 1018–1024. [Google Scholar] [CrossRef]
- Saeed, T.; Sun, G. A review on nitrogen and organics removal mechanisms in subsurface flow constructed wetlands: Dependency on environmental parameters, operating conditions and supporting media. J. Environ. Manag. 2012, 112, 429–448. [Google Scholar] [CrossRef]
- Wynn, T.M.; Liehr, S.K. Development of a constructed subsurface-flow wetland simulation model. Ecol. Eng. 2001, 16, 519–536. [Google Scholar] [CrossRef]
- Kadlec, R.H. The inadequacy of first-order treatment wetland models. Ecol. Eng. 2000, 15, 105–119. [Google Scholar] [CrossRef]
- Rousseau, D.P.L.; Vanrolleghem, P.A.; De Pauw, N. Model-based design of horizontal subsurface flow constructed treatment wetlands: A review. Water Res. 2004, 38, 1484–1493. [Google Scholar] [CrossRef]
- Marsili-Libelli, S.; Checchi, N. Identification of dynamic models for horizontal subsurface constructed wetlands. Ecol. Model. 2005, 187, 201–218. [Google Scholar] [CrossRef]
- Acreman, M.C.; Miller, F. Hydrological impact assessment of wetlands. In The Global Importance of Groundwater in the 21st Century; Ragone, S., de la Hera, A., Hernandez-Mora, N., Eds.; NGWA Press: Alicante, Spain, 2007; pp. 89–92. [Google Scholar]
- Szporak-Wasilewska, S.; Piniewski, M.; Kubrak, J.; Okruszko, T. What we can learn from a wetland water balance? Narew National Park case study. Ecohydrol. Hydrobiol. 2015, 15, 136–149. [Google Scholar] [CrossRef]
- Zhang, Y.; Lv, T.; Carvalho, P.N.; Zhang, L.; Arias, C.A.; Chen, Z.; Brix, H. Ibuprofen and iohexol removal in saturated constructed wetland mesocosms. Ecol. Eng. 2016, in press. Available online: http://www.sciencedirect.com/science/article/pii/S0925857416303123 (accessed on 4 November 2016). [Google Scholar]
- Darwiche-Criado, N.; Comín, F.A.; Masip, A.; García, M.; Eismann, S.G.; Sorando, R. Effects of wetland restoration on nitrate removal in an irrigated agricultural area: The role of in-stream and off-stream wetlands. Ecol. Eng. 2016, in press. Available online: http://www.sciencedirect.com/science/article/pii/S0925857416301653 (accessed on 4 November 2016). [Google Scholar]
- Rizzo, A.; Langergraber, G. Novel insights on the response of horizontal flow constructed wetlands to sudden changes of influent organic load: A modeling study. Ecol. Eng. 2016, 93, 242–249. [Google Scholar] [CrossRef]
- McCabe, A.J.; Arnold, W.A. Seasonal and spatial variabilities in the water chemistry of prairie pothole wetlands influence the photoproduction of reactive intermediates. Chemosphere 2016, 155, 640–647. [Google Scholar] [CrossRef]
- Rice, E.; Baird, R.; Eaton, A.; Clesceri, L. Standard Methods for the Examination of Water and Wastewater; American Public Health Association: Washington, DC, USA, 2012. [Google Scholar]
- Environmental Protection Administration of China. Environmental Quality Standards for Surface Water; GB3838-2002; China Environmental Science Press: Beijing, China, 2002.
- Kim, H.W. Evaluation of Hydrology in an Agricultural Watershed and Nitrogen Removal by Constructed Wetlands. Ph.D. Thesis, North Carolina State University, Raleigh, NC, USA, 2009. [Google Scholar]
- Dzakpasu, M.; Hofmann, O.; Scholz, M.; Harrington, R.; Jordan, S.N.; McCarthy, V. Nitrogen removal in an integrated constructed wetland treating domestic wastewater. J. Environ. Sci. Health A 2011, 46, 742–750. [Google Scholar] [CrossRef]
- Huang, J.; Cai, W.; Zhong, Q.; Wang, S. Influence of temperature on micro-environment, plant eco-physiology and nitrogen removal effect in subsurface flow constructed wetland. Ecol. Eng. 2013, 60, 242–248. [Google Scholar] [CrossRef]
- Öövel, M.; Tooming, A.; Mauring, T.; Mander, Ü. Schoolhouse wastewater purification in a LWA-filled hybrid constructed wetland in Estonia. Ecol. Eng. 2007, 29, 17–26. [Google Scholar] [CrossRef]
- Toscano, A.; Langergraber, G.; Consoli, S.; Cirelli, G.L. Modelling pollutant removal in a pilot-scale two-stage subsurface flow constructed wetlands. Ecol. Eng. 2009, 35, 281–289. [Google Scholar] [CrossRef]
- Faulwetter, J.L.; Gagnon, V.; Sundberg, C.; Chazarenc, F.; Burr, M.D.; Brisson, J.; Camper, A.K.; Stein, O.R. Microbial processes influencing performance of treatment wetlands: A review. Ecol. Eng. 2009, 35, 987–1004. [Google Scholar] [CrossRef]
- Zhang, D.; Wu, S.; Song, Y.; Liu, Q.-Q.; Pang, C.-L.; Dong, R.-J. Wastewater purification experiment study of a lab-scale tidal flow constructed wetland. J. China Agric. Univ. 2011, 16, 110–116. [Google Scholar]
- Wu, H.M.; Zhang, J.; Li, W.J.; Zhang, B. Relationship between oxygen release from plants in constructed wetland and oxygen demand for pollutant degradation. Chin. J. Environ. Eng. 2010, 4, 1973–1977. [Google Scholar]
- Zhang, C. Study on Calculation Method of Saturation Values of Dissolved Oxygen in Waters. Res. Environ. Sci. 1999, 12, 54–55. [Google Scholar]
- Sun, G.; Austin, D. Completely autotrophic nitrogen-removal over nitrite in lab-scale constructed wetlands: Evidence from a mass balance study. Chemosphere 2007, 68, 1120–1128. [Google Scholar] [CrossRef]
- Nivala, J.; Wallace, S.; Headley, T.; Kassa, K.; Brix, H.; van Afferden, M.; Müller, R. Oxygen transfer and consumption in subsurface flow treatment wetlands. Ecol. Eng. 2013, 61, 544–554. [Google Scholar] [CrossRef]
- Marsili-Libelli, S. Modelling and automation of water and wastewater treatment processes. Environ. Model. Softw. 2010, 25, 613–615. [Google Scholar] [CrossRef]
- Van de Moortel, A.M.; Rousseau, D.P.; Tack, F.M.; De Pauw, N. A comparative study of surface and subsurface flow constructed wetlands for treatment of combined sewer overflows: A greenhouse experiment. Ecol. Eng. 2009, 35, 175–183. [Google Scholar] [CrossRef]
© 2016 by the authors; licensee MDPI, Basel, Switzerland. This article is an open access article distributed under the terms and conditions of the Creative Commons Attribution (CC-BY) license (http://creativecommons.org/licenses/by/4.0/).