Article

Nitrate Pollution and Preliminary Source Identification of Surface Water in a Semi-Arid River Basin, Using Isotopic and Hydrochemical Approaches

1
College of Urban and Environmental Sciences, Northwest University, Xi’an 710127, China
2
State Key Laboratory of Soil Erosion and Dryland Farming on the Loess Plateau, Institute of Soil and Water Conservation, CAS & MWR, Yangling 712100, China
*
Author to whom correspondence should be addressed.
Water 2016, 8(8), 328; https://doi.org/10.3390/w8080328
Submission received: 13 May 2016 / Revised: 22 July 2016 / Accepted: 26 July 2016 / Published: 3 August 2016
(This article belongs to the Special Issue Tackling Complex Water Problems in China under Changing Environment)

Abstract

:
Nitrate contamination in rivers has raised widespread concern in the world, particularly in arid/semi-arid river basins lacking qualified water. Understanding the nitrate pollution levels and sources is critical to control the nitrogen input and promote a more sustainable water management in those basins. Water samples were collected from a typical semi-arid river basin, the Weihe River watershed, China, in October 2014. Hydrochemical assessment and nitrogen isotopic measurement were used to determine the level of nitrogen compounds and identify the sources of nitrate contamination. Approximately 32.4% of the water samples exceeded the World Health Organization (WHO) drinking water standard for NO3-N. Nitrate pollution in the main stream of the Weihe River was obviously much more serious than in the tributaries. The δ15N-NO3 of water samples ranged from +8.3‰ to +27.0‰. No significant effect of denitrification on the shift in nitrogen isotopic values in surface water was observed by high dissolved oxygen (DO) values and linear relationship diagram between NO3-N and δ15N-NO3, except in the Weihe River in Huayin County and Shitou River. Analyses of hydrochemistry and isotopic compositions indicate that domestic sewage and agricultural activities are the main sources of nitrate in the river.

1. Introduction

Due to the need for more food and energy, the applications of fertilizers, lands and fossil fuels are increasing, which will augment the nitrogen pollution in the environment [1,2]. Pollution of nitrate nitrogen (NO3-N) is a major problem in the Earth’s surface environments, especially in arid/semi-arid regions [3,4,5]. River systems are vital to terrestrial transformation and transportation of nutrients [4]. Most of the surface water pollution is accompanied by excessive chloride, sulfate, nitrate and other pollutants. Nitrate has been one of the dominant forms of increased N loading since the 1970s [6,7,8]. According to the Global Environment Monitoring System database, concentration of nitrate nitrogen (NO3-N) of the most rivers in populated regions is seven times higher than the healthy water quality standards of 10 mg/L suggested by the World Health Organization [9]. Since the 1980s, nitrogen fertilizer consumption in China has increased significantly [9]. High concentration of nitrate can result in many environmental and ecological problems, such as blooms of toxic algae, eutrophication of lakes and reservoirs and extinction of species in the river ecosystem [10,11]. In addition, long-term exposure to high nitrate drinking water may increase human health risks [12,13], which may lead to chronic poisoning linked to methemoglobinemia [14,15,16]. Even the existence of nitrite, another form of nitrogen, can cause cancer [1,17]. Therefore, the nitrogen pollution is a severe environmental problem that should be of high concern.
Nitrogen in surface waters has a variety of sources [18], including atmosphere deposition, dust in rainwater, industrial waste water, domestic sewage, urban garbage, nitrogen chemicals, fertilizers, livestock waste, plant humus, etc. [19]. The traditional method for identifying nitrate pollution sources in water bodies combines investigation of land use type of pollution area with analyses of concentrations of nitrogen compounds in water. However, it is difficult to identify the actual sources of nitrate pollution effectively using the traditional method, since the nitrogen compounds are affected by physical, chemical and biological processes simultaneously [3]. Analysis of nitrogen isotopic composition, i.e., δ15N in nitrate, can address the problems caused by traditional methods and provide a more direct, effective and accurate method to identify the sources of nitrate in water bodies [20,21]. The nitrogen isotope tracing technology has been widely used to identify the nitrate sources by discriminating values of δ15N-NO3 in different sources [22,23,24]. Nitrates from different nitrogen sources have different nitrogen isotopic compositions, which can be used to identify the sources of nitrate and trace the nitrogen cycling process. Previous studies have shown that the δ15N-NO3 sourced from chemical fertilizer is the same as δ15N in nitrogen in the atmosphere about 0.0‰ to +2.0‰. The δ15N-NO3 sourced from soil nitrification has the same nitrogen isotopic composition as soil organic nitrogen, which ranges from +2.0‰ to +8.0‰ and is invariant during oxidation and nitrification processes. Organic nitrogen is converted to NH4+ by oxidation and then generates NO3 with similar nitrogen isotope by nitrification. δ15N-NO3 in nitrogen from animal waste is generally high, within the range of +8.0‰ to +20.0‰ [25,26,27].
Since nitrate pollution has led to quality-induced water scarcity, it is essential to obtain a more complete understanding of nitrate pollution in semi-arid regions, where both the demands and costs for water and ecosystem restoration are high. The urbanization process in the Silk Road region results in a more fragile physical environment, even renewable water resources cannot meet the growing demands [28]. Water environment at the starting point of the Silk Road is a serious issue, which needs to be protected urgently. The Weihe River has a great effect on the construction of the “Silk Road Economic Belt”, which is the biggest tributary of the Yellow River, China. Meanwhile, it is crucial for the development and management of water resources in the Yellow River [29,30]. Natural factors and human activities lead to many environmental problems, e.g., the shortage of water resources, aggravation of water pollution and degradation of vegetation over the past 50 years [29]. Due to an annual sewage discharge yield of more than 9.0 × 10⁸ tons, the Weihe River is one of the largest contributors of sewage discharge flux into the Yellow River, leading to the main water pollution in the Yellow River [30]. A wide range of human activities has changed the original chemical composition of surface waters in the study area. A large amount of domestic sewage in cities along the Weihe River (point source pollution) flows back into irrigations, which exacerbates water pollution, especially the nitrogen pollution, and restricts economic development of the basin [31]. Furthermore, nitrate non-point source pollution is also widespread in the Weihe River basin [32]. However, the potential sources of nitrate in the semi-arid basins are not obvious and needs further study.
Accordingly, in this paper, hydrochemical assessment and stable isotopic measurement (δ15N) are used to (1) identify nitrate pollution level in surface waters; (2) evaluate the spatial variation of nitrate pollution; and (3) trace the main sources and transformations of nitrate. Understanding the nitrate pollution levels and pollution sources is of great importance to control the nitrogen input and could provide more sustainable water management methods for the semi-arid river basin area.

2. Materials and Methods

2.1. Study Area

The Weihe River, the largest tributary of the Yellow River, is located in a semi-arid area with a temperate continental monsoon climate. It originates from the Niaoshu Mountain in Gansu province and flows across Shaanxi province with stream length of 818 km and drainage area of 1.35 × 10⁵ km2 in the Yellow River basin. It runs into the Yellow River at Tongguan County. The mean elevation of the Weihe River is 3485 m above sea level, between 104°00′ E~110°20′ E and 33°50′ N~37°18′ N. Limestone is the dominant rock type in the study area. The southern tributaries originate from the Tsinling Mountains and northern tributaries originate from the Loess Plateau (Figure 1). The Loess Plateau in north of the Weihe River is covered by thick Eolian deposits. The Tsinling Mountains in the south of the Weihe River provide an east–west trending land barrier. The average annual precipitation in the river basin is 558–750 mm (increase from north to south). And approximately 60% of the total annual precipitation occurs from May to September. The average annual temperature is 13.3 °C, while the average annual evaporation varies from 800 mm to 1000 mm (increase from west to east) [29]. The drainage area and annual sediment load of the Weihe River account for 17.9% and 2.5% of the total amount of the Yellow River basin.
At present, the Weihe River is facing a predicament of water source shortage and poor water quality [31]. The upstream and lower stream of the Weihe River are divided by the Linjiacun. Water pollution in the region upstream from Linjiacun is less, while there are several middle- and large-sized cities in the lower region where the total agricultural area has reached about 10,000 km2 [31]. The upstream is not affected by human activities intensively as population in this area is relatively low. Below the Baoji gorge, there are many cities near the main stream including Baoji City, Xianyang City, Xi’an City, and Weinan City, some of which are industrial cities. This portion of the Weihe River is affected by human activities obviously. Furthermore, there are a large number of factories including cotton factories, cement factories and paper mills in the surrounding regions of the Weihe River [33].

2.2. Water Sampling Sites and Measurements

Water samples were collected in the main stream and tributaries of the Weihe River in October 2014. Natural and human factors were considered to deploy the sampling sites including hydrogeological conditions, the principle of water quality control, characterization and “Water Quality-Technical Regulation on the Design of Sampling Programmes” (HJ 495-2009) [34]. The positions of the sampling sites were identified by GPS (Trimble Juno 3B). The water sites of main stream, northern tributaries and southern tributaries of the Weihe River were designated as S1–S10, S11–S23, S23–S34, which are shown in Figure 1.
In situ water quality parameters including pH, electrical conductivity (EC), dissolved oxygen (DO) and oxidation-reduction potential (ORP) of the water samples were measured with a portable multi-parameter water quality analyzer (HACH HQ40d). Water samples were filtered by 0.45 μm acetate cellulose filter membranes and were stored at 4 °C. Concentrations of SO42−, Cl, NO3, NO2 and NH4+ were analyzed by Auto Discrete Analyzers (Clever Chem200, Hamburg, Germany). Concentrations of Ca2+, Mg2+, Na+ and K+ were determined using an inductively-coupled plasma optical emission spectrometer (ICP-OES, Optima 5300DV, Shelton, CT, USA). The HCO3 and CO32− contents were analyzed by acid-base titration. All chemical results were implemented when the charge balance error was within ±0.5.
The water samples with nitrate contents that were higher than the maximum contaminant level (MCL) of 45 mg/L were chosen for nitrogen isotopic analyses. The nitrate was separated by the anion exchange resin method proposed by Silva et al. [35]. The values of δ15N-NO3 were measured by a Finnigan MAT 253 mass spectrometer with an online Flash Elemental Analyzer (Thermo Fisher Scientific, Bremen, Germany). The values for δ15N-NO3 are defined as:
δ ( ) = ( R sample / R standard 1 )   ×   1000
where Rsample and Rstandard are the nitrogen isotopic ratios, i.e., 15N/14N ratio of water samples and N2 in the air, respectively. The 1δ analytical precision for δ15N-NO3 analysis was ±0.3.

3. Results and Discussion

3.1. Hydrochemistry

The hydrochemistry information of water samples are illustrated in Figure 2. The EC values ranged from 160.1 to 2081 μS/cm, with a mean value of 971.7 μS/cm. The lowest EC value was observed at the site of Fenghe River (S28). All water samples were relatively similar in pH, ranging from 7.2 to 8.6, with a mean value of 7.9, indicating a slight alkaline nature of water samples. The DO ranged from 1.2 to 12.9 mg/L, with a mean value of 9.4 mg/L. The lowest DO content was observed at the site of Shitou River (S24), which might indicate the transformation of nitrogen through denitrification. The values of DO of most samples were higher than 2.0 mg/L, except for the Weihe River in Huayin County (S9) and Shitou River (S24), suggesting that denitrification was not a pivotal transformation process of nitrogen in most area [11]. The ORP ranged from 25.4 to 138.5 mV, with a mean value of 79.9 mV. The Ca2+, Na+, K+, Mg2+, Cl, SO42−, HCO3 ranged from 21.6 to 159.2 mg/L, 3.7 to 280.8 mg/L, 1.5 to 16.1 mg/L, 3.5 to 71.1 mg/L, 2.2 to 270.3 mg/L, 19.9 to 439.5 mg/L, 48.6 to 413.3 mg/L, respectively. Concentrations of CO32− were all below detection limit. The mean values of Ca2+, Na+, K+, Mg2+, Cl, SO42− and HCO3 were 64.1 mg/L, 84.0 mg/L, 6.3 mg/L, 25.9 mg/L, 88.9 mg/L, 152.9 mg/L, and 228.1 mg/L, respectively. Especially, the highest concentrations of Na+, Mg2+, Cl and SO42− were observed at the site of Qinghe River (S20) with low nitrate concentration, indicating the combined effect of geological characteristics and human activities on the water quality [36]. Positive correlations were observed between EC and SO42− (r = 0.648, p < 0.01), between EC and Cl (r = 0.717, p < 0.01), between Cl and SO42− (r = 0.916, p < 0.01). In addition, positive correlations were also detected between Ca2+ and NO3 at the p < 0.01 level, between K+ and NO3, between Cl and NO3, and between EC and NO3 at p < 0.05 level. According to the observed correlation among EC, Cl and SO42−, Cl and SO42− can be regarded as describers of the hydrochemistry of surface waters, which shares a common origin that significantly contributed to the total content of dissolved salts [37].

3.2. Concentrations of NO2-N, NO3-N and NH4+-N

Concentrations of NO2-N, NO3-N, NH4+-N ranged from BDL (below the detection limit) to 0.015 mg/L, 1.3 to 35.7 mg/L, 0.008 to 8.0 mg/L, respectively (Table 1). The mean values of NO2-N, NO3-N, NH4+-N were 0.009 mg/L, 8.6 mg/L, 0.3 mg/L, and the median values were 0.001 mg/L, 7.4 mg/L and 0.05 mg/L, respectively. Concentrations of NH4+-N were generally low (below the MCL of 1.0 mg/L), except for Luowen River (S34), which was possibly associated with the sewage from paper mills near the river [33]. It also suggests that NH4+-N in the water sample at the site of Luowen River (S34) could not fully transform into NO3-N, due to a large amount of organic nitrogen and ammonium derived from sewage [38]. Concentrations of NO2-N in all water samples were below the WHO recommended level of 0.2 mg/L. The concentration of NO3-N exceeded the MCL (10 mg/L) accounted for 32.4%, which was much higher than the over standard rate of NH4+-N (2.9%) and NO2-N (0). Consequently, nitrate was a major water pollutant in the semi-arid river basin. It is critical to understand the dynamics of NO3-N through further analyses of spatial distribution and sources of nitrate.

3.3. Spatial Distribution of Nitrate and Its Controlling Factors

Referring to the WHO drinking water standard and Chinese drinking water standards enacted since 1986, four levels of nitrate concentration (level I of 0–10 mg/L for background level water, level II of 10–45 mg/L for water unpolluted but in a critical condition, level III of 45–90 mg/L for slight polluted water and level IV of the concentration above 90 mg/L for severely polluted water) were generated to evaluate nitrate pollution (Figure 3) [12]. About 8.8%, 58.8%, 29.4%, 3.0% of water samples were within level I, level II, level III and level IV, respectively. According to the spatial distribution of NO3 across the semi-arid river basin (Figure 3), nitrate contents in the main stream were obviously greater than those in the tributaries (Figure 3). In addition, nitrate contents of the rivers in mountain areas were lower than in other areas (Figure 3). The mean values of nitrate in the main stream of the Weihe River, northern tributaries and southern tributaries were 10.6 mg/L, 7.9 mg/L and 7.7 mg/L, respectively. Results indicate that the main stream of the river is polluted most seriously, due to the import of waters in tributaries. Approximately 70.0% of the water samples in the main stream were within level III and level IV. Waters in northern tributaries and southern tributaries were less polluted. About 1.7% of water samples were within level III and level IV, both in the northern tributaries and southern tributaries. In addition, southern tributaries near the Tsinling Mountains were slightly less polluted than northern tributaries. Furthermore, concentrations of nitrate in semi-arid regions are influenced by frequent and severe droughts and infrequent but vital floods [39]. The nitrate contents in the river increased gradually from the site of Weihe River in Fengxian County (S2). Around the site of Qianhe River (S12), the main stream flows across the urban area, where the highest content of nitrate and low NH4+ concentration existed. The rapid increase of nitrate content here suggests that there is a combination of various pollution sources of nitrate, which is also affected by nitrification processes [38]. The nitrate concentration decreased within the Weihe River in Wugong County (S4), due to the fact that the lower nitrate concentration level in the inflow tributaries (Heihe River, Hengshui River and Qishui River) dilutes the nitrate content in the main stream of the river. Nitrate content decreased slightly from the site of the Weihe River in Xi’an City (S5) to Weinan City (S7). In the sample of the Weihe River in Huaxian County (S8), nitrate content increased again. It was mainly sourced from agricultural activities and industrial wastewater. Pesticide and chemical fertilizer containing nitrate and ammonium nitrogen washed into streams by rainfall [40]. A high spatial variability of nitrate content occurred in some stream waters on the basis of catchment characteristics [41]. Results also indicate that nitrate contamination in the study area has distinct regional differences.
The above analyses suggest that nitrate pollution in the river basin might be mainly sourced from the use of chemical fertilizer and pesticide in the agricultural areas, domestic sewage and industrial wastewater discharge. Fertilizer is one of the main sources of nitrate pollution in the studied waters, which has a great impact on the water quality in the study area [3,42]. Furthermore, about 5%–10% of applied fertilizer can enter into groundwater [43]. The process of fertilizer application may lead to the cropland being the main contributor to nitrate pollution in groundwater [44,45]. In addition, it is common that polluted water including domestic sewage and industrial wastewater is discharged into the river without any treatment in the study area, which also causes the increase of nitrate content in the study area.

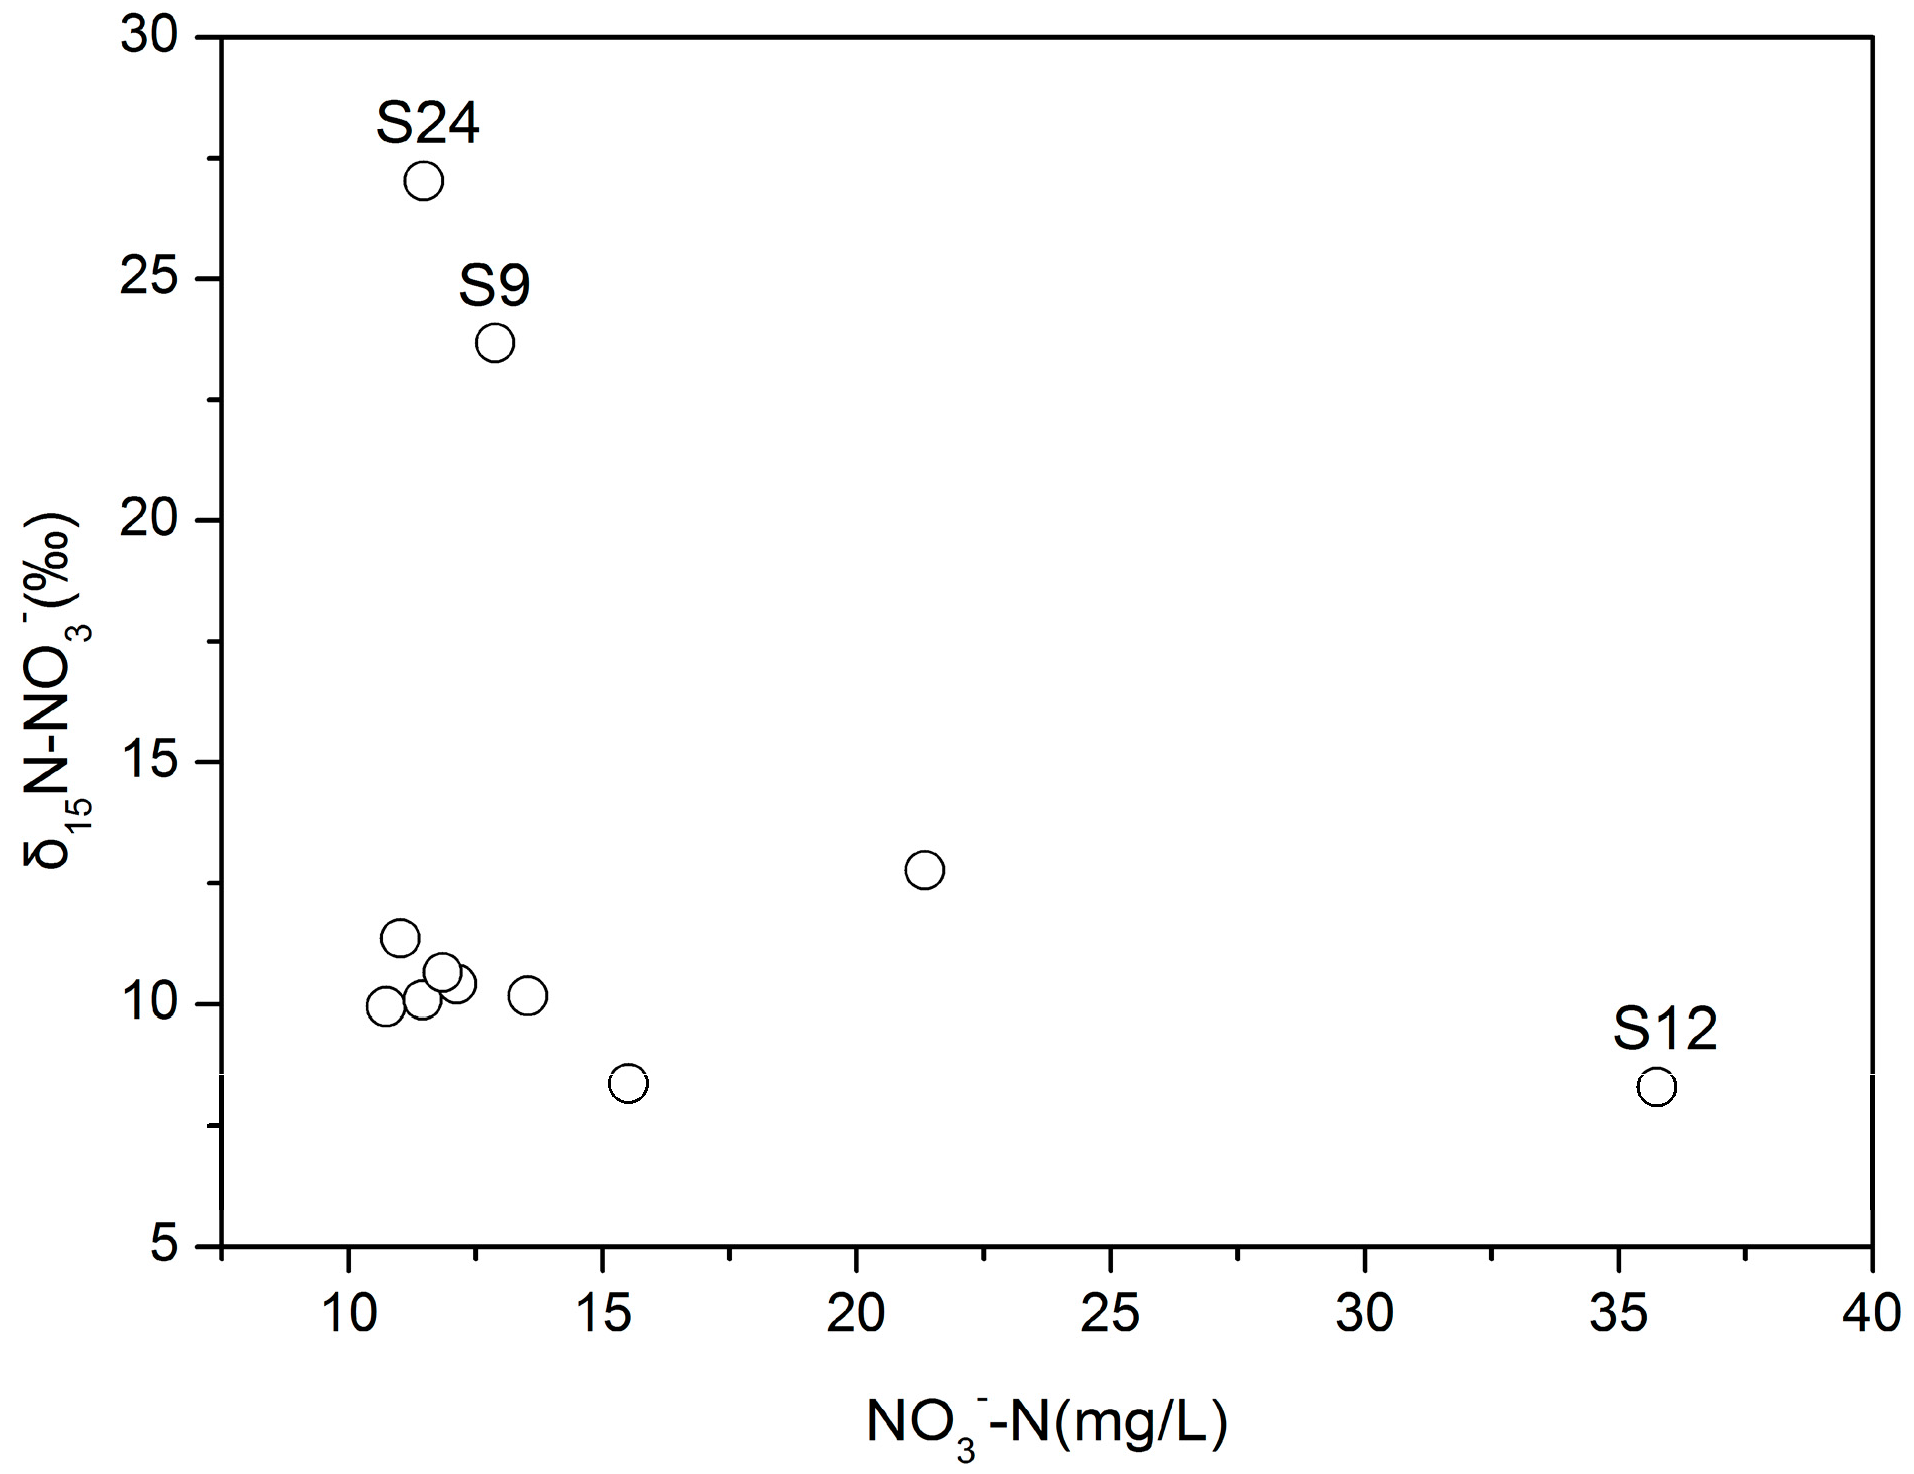
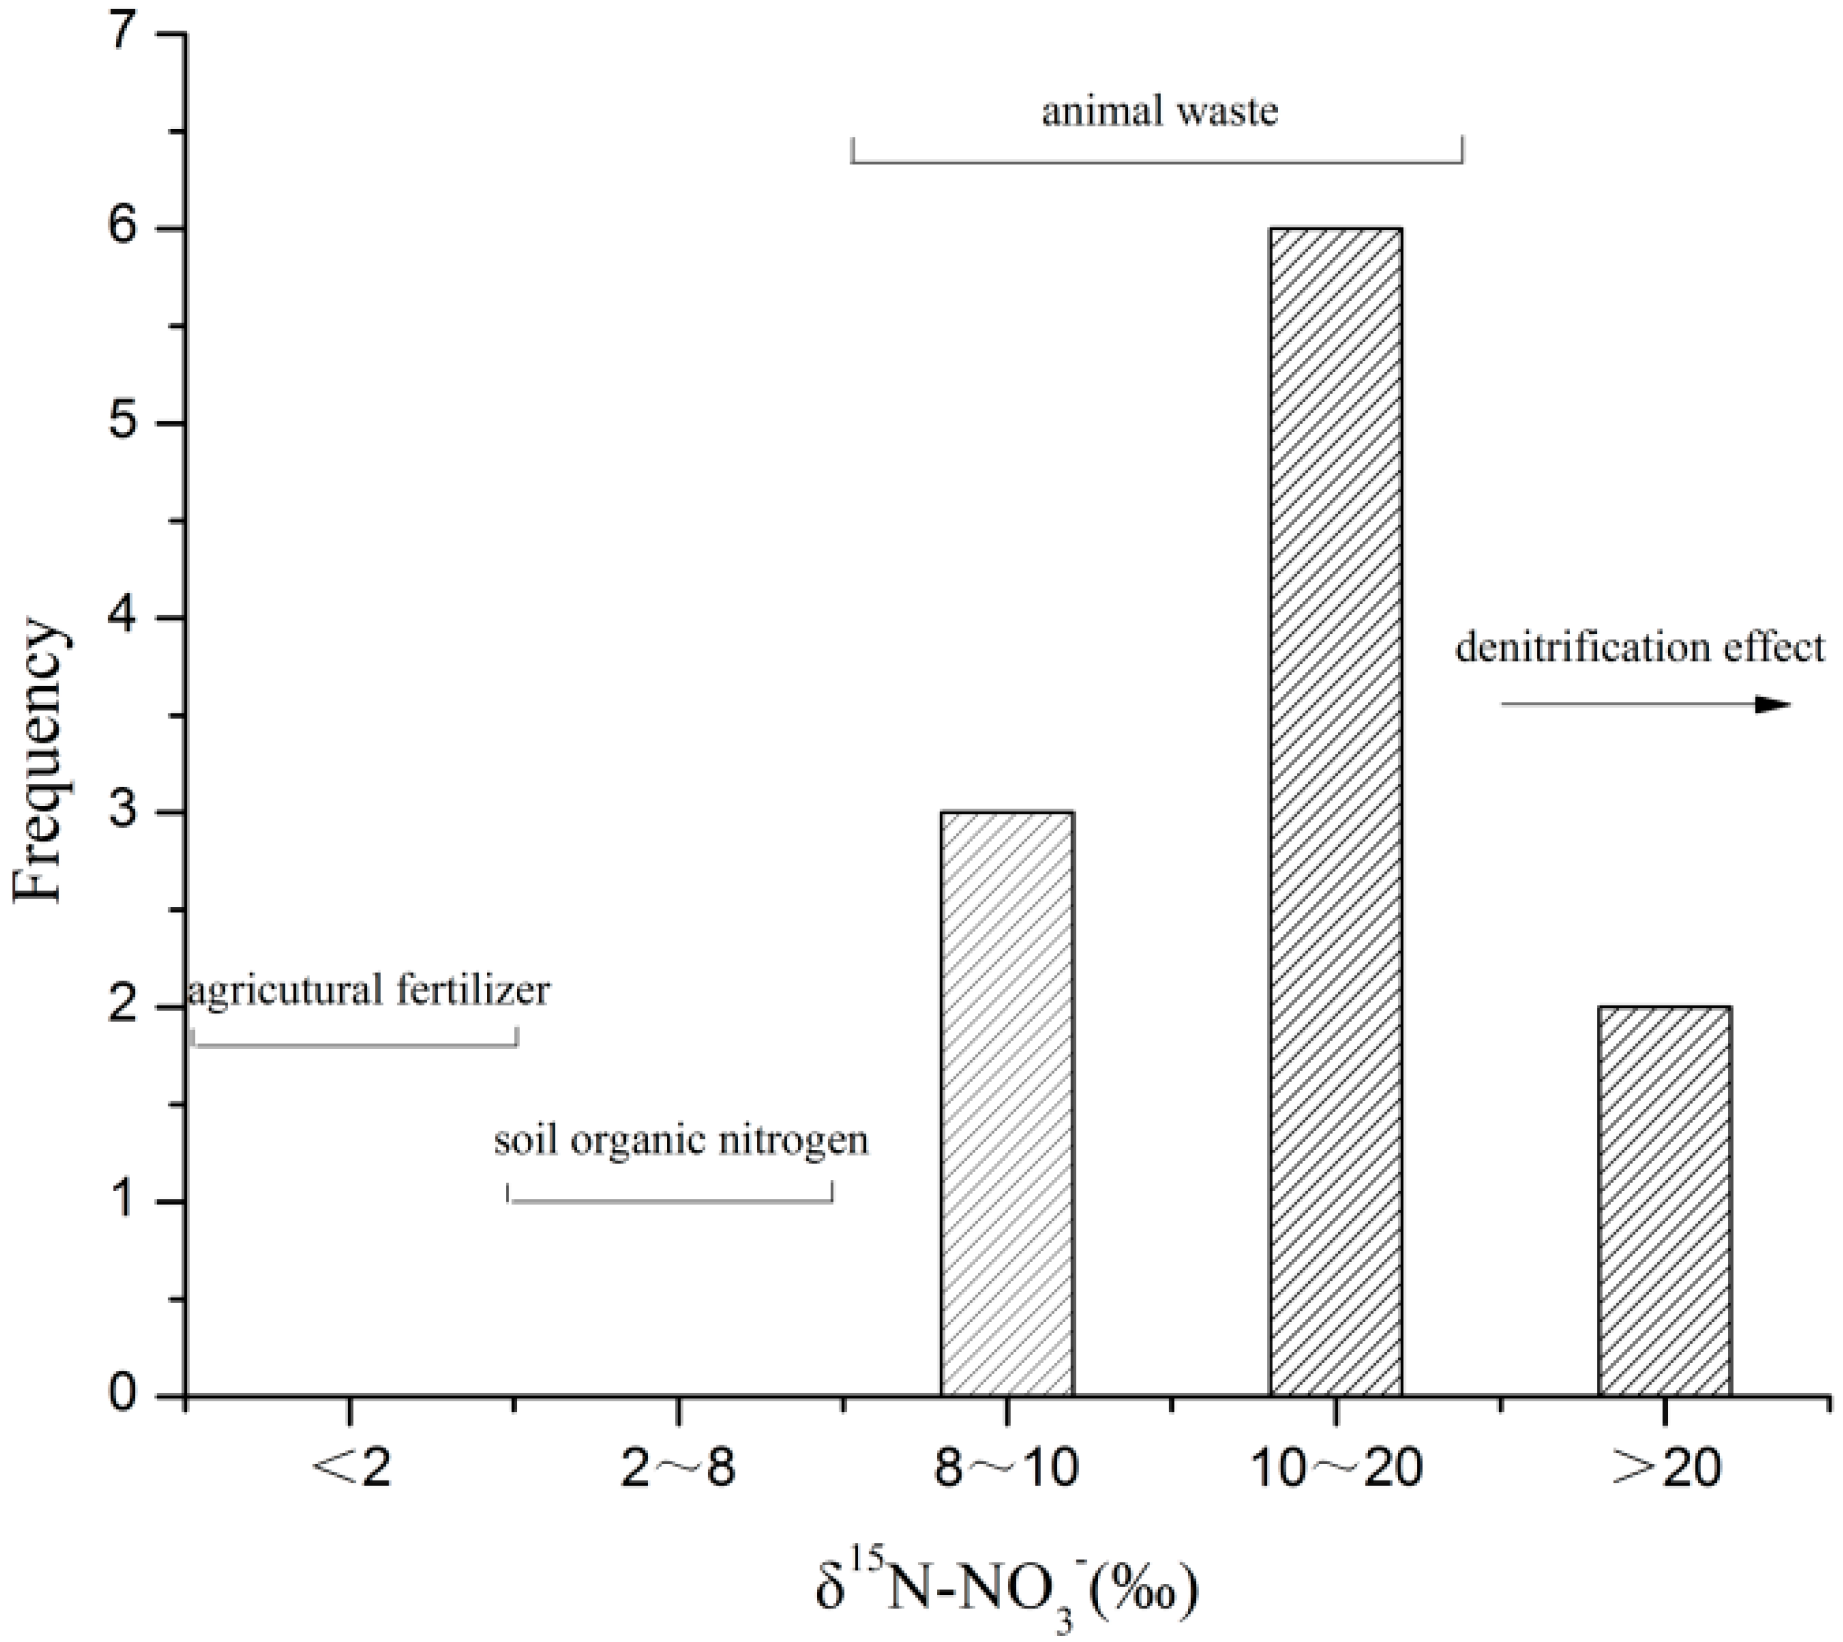
3.4. Sources and Transformations of Nitrate

As shown in Figure 4, the concentration of Cl increased with the concentration of Na+. The slope of the correlation was close to 0.81. Cl can be derived from chemical fertilizers, sewage and animal waste. The Cl concentration can provide significant information to identify the different input sources [2]. Results suggest that nitrate in the surface water might be also contributed from these sources of Cl. Correlation between SO42− with Ca2+ was not strong. Basically, the concentration of SO42− increased with the concentration of Ca2+, which suggested that the input of exogenous substance affected the concentration of SO42−. Ca2+ might originate from the fertilizer (Ca(H2PO4)2·H2O) [46], despite the dissolution of carbonate rocks may also contribute. The SO42− in the study area was mainly from agricultural fertilizers. Therefore, one of the main sources of nitrate in the basin was chemical fertilizers.
Generally, there are no apparent correlations between δ15N-NO3 versus NO3 in the basin (Figure 5), which indicates no simple mixing or only one single biological process is responsible for the shifting in the nitrogen isotopic composition of nitrate. In addition, the high DO values and the linear relationship diagram between NO3-N and δ15N-NO3 suggest that denitrification had no significant effect on the shift in nitrogen isotopic values in most surface waters in the basin, except in the water samples at the site of Weihe River in Huayin County (S9) and Shitou River (S24). The δ15N-NO3 of water samples S9, S24 were high with low concentrations of nitrate (Figure 5) and DO, which means denitrification might have occurred [38].
In the study, 32.4% of water samples with nitrate contents that were higher than the MCL of 45 mg/L were chosen for nitrogen isotopic analyses. The nitrogen isotopic compositions of NO3 ranged from +8.3‰ to +27.0‰, which were higher than those results in other rivers, such as in Jinghe River (+3.5‰–+10.3‰) [47], Chanhe River (+1.3‰–+9.2‰) and Laohe River (+2.9‰–+7.4‰) [33]. The mean value of δ15N-NO3 was +13.0‰ in the study area. The lowest value of δ15N-NO3 was +8.3‰ with high concentration of NO3 in Qianhe River (S12) (Figure 5), which might be influenced directly by sewage effluent [38]. Domestic sewage usually contains manure, which leads to high value of δ15N-NO3, because nitrogen fractionation has occurred in animal waste and the δ15N-NO3 is high in the residual ammonium nitrogen by nitration reaction [48]. About 81.8% of δ15N-NO3 values fell between +8.0‰ and +20.0‰, while 18.2% of δ15N-NO3 values were above +20.0‰ (Figure 6). Nitrogen isotope values of most samples were within +8‰–+13‰, which suggested that the pollution was mainly sourced from animal waste. The findings were similar to the results reported by Urresti et al. [49,50], which revealed the main origin of the dissolved NO3 was related to the use of ammonium fertilizers and manure. Meanwhile, Yue et al. [38] also found similar results that domestic sewage and agricultural activities were the two main sources of nitrate in surface waters. The values of δ15N-NO3 in the water samples at the site of Weihe River in Huayin County (S9) and Shitou River (S24) were up to +20‰ and nitrate concentrations were low with DO below 2 mg/L (Figure 5), which mean denitrification occurred [4,38]. Microbial denitrification can usually lead to significant change in nitrogen isotope fractionation, which results in the enrichment of heavy nitrogen isotope, i.e., 15N, in waters [38]. In addition, it is hard to accurately identify the two potential nitrogen sources and the extent of the impact of the biological process, which needs additional studies, due to the δ15N-NO3 value in atmosphere precipitation being close to that in soil organic nitrogen mineralization and biological processes in the basin is complicated [38,48]. Furthermore, the seasonal phenomena (floods, droughts, high industrial productivity periods, etc.) favor different biogeochemical processes, leading to dynamic variations in the inorganic nitrogen levels. Due to the large riverine input changing with the variation in concentrations and discharge rates, nitrate concentrations were greatly affected by riverine input over all seasons [51], which will be analyzed and assessed in further study.
In view of pollution extent of nitrate caused by intensive agricultural activities and domestic sewage in the semi-arid river basin, attempts should be made as follows: (1) ecological agricultural policy should be carried out to control the non-point source pollution of nitrate, appropriate amount of nitrogen fertilizers should be estimated; (2) the time and position of nitrogen fertilizers application should be strictly controlled, e.g., reducing fertilization frequency and adopting fertigation technology; (3) early winter cover crops should be used to improve the utilization ratio of nitrogen in crop rotation system [3]; (4) direct discharge of domestic sewage should be cut down in some seriously polluted regions, artificial rapid filtration can be used; and (5) chemical and biological processes should be used to reduce nitrate content if necessary.

4. Conclusions

This study evaluated the sources and variation of nitrate in the Weihe River basin, China. Approximately 32.4% of the water samples did not meet the WHO drinking water standard for nitrate. Results indicate that nitrate contamination of the study area has an apparent spatial pattern. Nitrate contents in the main stream were obviously greater than in the tributaries. In addition, nitrate contents in southern tributaries were slightly lower than in the northern tributaries because southern tributaries near the Tsinling Mountains were less polluted. Nitrate pollution in semi-arid regions was influenced by frequent and severe droughts and infrequent but vital floods. The highest content of nitrate in all surface water samples was observed in Qianhe River, which was related to the acceptance of the domestic sewage. Considering that there are a wide range of agricultural areas along the coast of the river and fertilizers containing nitrate and ammonium nitrogen are washed into streams by rainfall, nitrate is also sourced from agricultural activities. The δ15N-NO3 of water samples ranged from +8.3‰ to +27.0‰. δ15N-NO3 in two samples was up to +20‰, indicating that denitrification only occurred in the Weihe River in Huayin County and Shitou River. For the water samples with high nitrate concentrations (above 45 mg/L), domestic sewage is the main source of nitrate. The results of hydrochemistry and isotopic compositions suggest that domestic sewage and agricultural activities are the main sources of nitrate in the semi-arid basin. Additional studies are needed to accurately identify the nitrogen sources and transformations including biological processes. Nitrate pollution in the river basin shows the urgent needs for ecological agricultural policy and reduction of direct sewage discharge in semi-arid river basins.

Acknowledgments

This research was financially supported by the National Natural Science Foundation of China (Grant No. 51379175), the Specialized Research Fund for the Doctoral Program of Higher Education (Grant No. 20136101110001), the Postdoctoral Science Foundation of China (Grant No. 2015M572592), the Scientific Research Plan Projects of Shaanxi Education Department (Grant No. 15JK1762), the Hundred Talents Project of the Chinese Academy of Sciences (Grant No. A315021406), and the Program for Key Science and Technology Innovation Team in Shaanxi Province (Grant No. 2014KCT-27), and the Scientific Research Foundation of Northwest University (Grant No. 14NW01). We are very grateful to three anonymous reviewers and editors for their helpful comments and suggestions, which helped to improve the quality of the manuscript.

Author Contributions

Ying Xue carried out experiments and performed research. Jinxi Song assisted with preparation of the manuscript and supervised the research. Yan Zhang designed the experiments. Feihe Kong assisted with performing the experiments. Ming Wen and Guotao Zhang contributed to manuscript revision.

Conflicts of Interest

The authors declare no conflict of interest.

References

  1. Erisman, J.W.; Galloway, J.N.; Seitzinger, S.; Bleeker, A.; Dise, N.B.; Petrescu, A.R.; Leach, A.M.; de Vries, W. Consequences of human modification of the global nitrogen cycle. Philos. Trans. R. Soc. B Biol. Sci. 2013, 368, 91–97. [Google Scholar] [CrossRef] [PubMed]
  2. Lu, L.; Cheng, H.G.; Pu, X.; Liu, X.L.; Cheng, Q.D. Nitrate behaviors and source apportionment in an aquatic system from a watershed with intensive agricultural activities. Environ. Sci. Process. Impacts 2015, 17, 131–144. [Google Scholar] [CrossRef] [PubMed]
  3. Zhang, Y.; Li, F.D.; Zhang, Q.Y.; Li, J.; Liu, Q. Tracing nitrate pollution sources and transformation in surface- and ground-waters using environmental isotopes. Sci. Total Environ. 2014, 490, 213–222. [Google Scholar] [CrossRef] [PubMed]
  4. Li, S.L.; Liu, C.Q.; Li, J.; Liu, X.L.; Chetelat, B.; Wang, B.L.; Wang, F.S. Assessment of the sources of nitrate in the Changjiang River, China using a nitrogen and oxygen isotopic approach. Environ. Sci. Technol. 2010, 44, 1573–1578. [Google Scholar] [CrossRef] [PubMed]
  5. Cook, P.L.M.; Aldridge, K.T.; Lamontagne, S.; Brookes, J.D. Retention of nitrogen, phosphorus and silicon in a large semi-arid riverine lake system. Biogeochemistry 2009, 99, 49–63. [Google Scholar] [CrossRef]
  6. Dise, N.B.; Wright, R.F. Nitrogen leaching from European forests in relation to nitrogen deposition. For. Ecol. Manag. 1995, 71, 153–161. [Google Scholar] [CrossRef]
  7. Smith, V.H.; Tilman, G.D.; Nekola, J.C. Eutrophication: Impacts of excess nutrient inputs on freshwater, marine, and terrestrial ecosystems. Environ. Pollut. 1999, 100, 179–196. [Google Scholar] [CrossRef]
  8. Vitousek, P.M.; Aber, J.D.; Howarth, R.W.; Likens, G.E.; Matson, P.A.; Schindler, D.W.; Schlesinger, W.H.; Tilman, D.G. Human alteration of the global nitrogen cycle: Sources and consequences. Ecol. Appl. 1997, 7, 737–750. [Google Scholar] [CrossRef]
  9. He, B.; Kanae, S.; Oki, T.; Hirabayashi, Y.; Yamashiki, Y.; Takara, K. Assessment of global nitrogen pollution in rivers using an integrated biogeochemical modeling framework. Water Res. 2011, 45, 2573–2586. [Google Scholar] [CrossRef] [PubMed]
  10. Li, S.L.; Liu, C.Q.; Li, J.; Xue, Z.C.; Guan, J.; Lang, Y.C.; Ding, H.; Li, L.B. Evaluation of nitrate source in surface water of southwestern China based on stable isotopes. Environ. Earth. Sci. 2013, 68, 219–228. [Google Scholar] [CrossRef]
  11. Gautam, S.; Iqbal, M. Using stable isotopes of nitrogen to study its source and transformation in a heavily farmed watershed. Environ. Earth. Sci. 2010, 60, 11–20. [Google Scholar] [CrossRef]
  12. Li, J.; Li, F.D.; Liu, Q.; Suzuki, Y. Nitrate pollution and its transfer in surface water and groundwater in irrigated areas: A case study of the Piedmont of South Taihang Mountains, China. Environ. Sci. Process. Impacts 2014, 16, 2764–2773. [Google Scholar] [CrossRef] [PubMed]
  13. Carpenter, S.R.; Caraco, N.F.; Correll, D.L.; Howarth, R.W.; Sharpley, A.N.; Smith, V.H. Nonpoint pollution of surface waters with phosphorus and nitrogen. Ecol. Appl. 1998, 8, 559–568. [Google Scholar] [CrossRef]
  14. Liu, T.; Wang, F.; Michalski, G.; Xia, X.H.; Liu, S.D. Using 15N, 17O, and 18O to determine nitrate sources in the Yellow River, China. Environ. Sci. Technol. 2013, 47, 13412–13421. [Google Scholar] [CrossRef] [PubMed]
  15. Yang, L.; Song, X.; Zhang, Y.; Han, D.; Zhang, B.; Long, D. Characterizing interactions between surface water and groundwater in the Jialu River basin using major ion chemistry and stable isotopes. Hydrol. Earth Syst. Sci. Discuss. 2012, 9, 5955–5981. [Google Scholar] [CrossRef]
  16. Itoh, M.; Takemon, Y.; Makabe, A.; Yoshimizu, C.; Kohzu, A.; Ohte, N.; Tumurskh, D.; Tayasu, I.; Yoshida, N.; Nagata, T. Evaluation of wastewater nitrogen transformation in a natural wetland (Ulaanbaatar, Mongolia) using dual-isotope analysis of nitrate. Sci. Total Environ. 2011, 409, 1530–1538. [Google Scholar] [CrossRef] [PubMed]
  17. Huang, G.X.; Fallowfield, H.; Guan, H.D.; Liu, F. Remediation of nitrate-nitrogen contaminated groundwater by a heterotrophic-autotrophic denitrification approach in an aerobic environment. Water Air Soil Pollut. 2012, 223, 4029–4038. [Google Scholar] [CrossRef]
  18. Fogg, G.E.; Rolston, D.E.; Decker, D.L.; Louie, D.T.; Grismer, M.E. Spatial variation in nitrogen isotope values beneath nitrate contamination sources. Gound Water 1998, 36, 418–426. [Google Scholar] [CrossRef]
  19. Stevenson, F.J. Origin and distribution of nitrogen in soil. Agron. Monogr. 1982, 22, 1–42. [Google Scholar]
  20. Hübner, H. Isotope effects of nitrogen in the soil and biosphere. In Handbook of Environmental Isotope Geochemistry; Fritz, P., Fontes, J.C., Eds.; Elsevier: New York, NY, USA, 1986; pp. 361–425. [Google Scholar]
  21. Mayer, B.; Boyer, E.W.; Goodale, C.; Jaworski, N.A.; Van Breemen, N.; Howarth, R.W.; Seitzinger, S.; Billen, G.; Lajtha, K.; Nadelhoffer, K.; et al. Sources of nitrate in rivers draining sixteen watersheds in the northeastern U.S.: Isotopic constraints. Biogeochemistry 2002, 57, 171–197. [Google Scholar] [CrossRef]
  22. Macko, S. Pollution studies using stable isotopes. In Stable Isotopes in Ecology and Environmental Science; Lajtha, K., Michener, R.M., Eds.; Blackwell Sci.: Malden, MA, USA, 1994; pp. 45–62. [Google Scholar]
  23. Böhlke, J.K.; Denver, J.M. Combined use of groundwater dating, chemical, and isotopic analyses to resolve the history and fate of nitrate contamination in two agricultural watersheds, Atlantic coastal plain, Maryland. Water Resour. Res. 1995, 31, 2319–2339. [Google Scholar] [CrossRef]
  24. BryantMason, A.; Xu, Y.J.; Altabet, M. Isotopic signature of nitrate in river waters of the lower Mississippi and its distributary, the Atchafalaya. Hydrol. Process. 2013, 27, 2840–2850. [Google Scholar] [CrossRef]
  25. Heaton, T. Isotopic studies of nitrogen pollution in the hydrosphere and atmosphere: A review. Chem. Geol. Isot. Geosci. Sect. 1986, 59, 87–102. [Google Scholar] [CrossRef]
  26. Kendall, C. Tracing nitrogen sources and cycling in catchments. Isot. Tracers Catchment Hydrol. 1998, 1, 519–576. [Google Scholar]
  27. Liu, C.Q.; Li, S.L.; Lang, Y.C.; Xiao, H.Y. Using δ15N- and δ18O-values to identify nitrate sources in karst ground water, Guiyang, Southwest China. Environ. Sci. Technol. 2006, 40, 6928–6933. [Google Scholar] [CrossRef] [PubMed]
  28. Fang, C.L.; Xie, Y. Sustainable urban development in water-constrained Northwest China: A case study along the mid-section of Silk-Road—He-Xi corridor. J. Arid Environ. 2010, 74, 140–148. [Google Scholar] [CrossRef]
  29. Zuo, D.P.; Xu, Z.X.; Wu, W.; Zhao, J.; Zhao, F.F. Identification of streamflow response to climate change and human activities in the Wei River Basin, China. Water Resour. Manag. 2014, 28, 833–851. [Google Scholar] [CrossRef]
  30. Song, J.X.; Xu, Z.X.; Liu, C.M.; Li, H.E. Ecological and environmental instream flow requirements for the Wei River—The largest tributary of the Yellow River. Hydrol. Process. 2007, 21, 1066–1073. [Google Scholar] [CrossRef]
  31. Li, J.K.; Li, H.E.; Shen, B.; Li, Y.J. Effect of non-point source pollution on water quality of the Weihe River. Int. J. Sediment Res. 2011, 26, 50–61. [Google Scholar] [CrossRef]
  32. Liu, Q.; Li, F.D.; Guo, J.Q.; Wu, X.D.; Song, S.; Zhao, G.S. Source and variation of nitrogen along middle and down stream of Weihe River and its main tributaries. J. Water Resour. Water Eng. 2011, 22, 128–132. [Google Scholar]
  33. Xing, M.; Liu, W.G.; Hu, J. Using nitrate isotope to trace the nitrogen pollution in Chanhe and Laohe River. Environ. Sci. 2010, 10, 2305–2310. [Google Scholar]
  34. Water Quality-Technical Regulation on the Design of Sampling Programmes. HJ 495-2009.
  35. Silva, S.; Kendall, C.; Wilkison, D.; Ziegler, A.; Chang, C.; Avanzino, R. A new method for collection of nitrate from fresh water and the analysis of nitrogen and oxygen isotope ratios. J. Hydrol. 2000, 228, 22–36. [Google Scholar] [CrossRef]
  36. Wang, S.Q.; Tang, C.Y.; Song, X.F.; Yuan, R.Q.; Wang, Q.X.; Zhang, Y.H. Using major ions and delta 15N-NO3 to identify nitrate sources and fate in an alluvial aquifer of the baiyangdian lake watershed, north China plain. Environ. Sci. Process. Impacts 2013, 15, 1430–1443. [Google Scholar] [CrossRef] [PubMed]
  37. Di Lorenzo, T.; Brilli, M.; Del Tosto, D.; Galassi, D.M.P.; Petitta, M. Nitrate source and fate at the catchment scale of the Vibrata River and aquifer (central Italy): An analysis by integrating component approaches and nitrogen isotopes. Environ. Earth. Sci. 2012, 67, 2383–2398. [Google Scholar] [CrossRef]
  38. Yue, F.J.; Liu, X.L.; Li, J.; Zhu, Z.Z.; Wang, Z.L. Using nitrogen isotopic approach to identify nitrate sources in waters of Tianjin, China. Bull. Environ. Contam. Toxicol. 2010, 85, 562–567. [Google Scholar] [CrossRef] [PubMed]
  39. Jolly, I.D.; McEwan, K.L.; Holland, K.L. A review of groundwater-surface water interactions in arid/semi-arid wetlands and the consequences of salinity for wetland ecology. Ecohydrology 2008, 1, 43–58. [Google Scholar] [CrossRef]
  40. Yang, J.M.; Liu, J.H.; Yu, X.B.; Yang, W.B.; Zhou, M.P. Variation of nitrogen resource in groundwater and river water in Changchun Region. J. Soil Water Conserv. 2010, 24, 255–257. [Google Scholar]
  41. Tabayashi, Y.; Koba, K. Heterogeneous atmospheric nitrogen deposition effects upon the nitrate concentration of stream waters in a forested mountain area. Water Air Soil Pollut. 2011, 216, 105–115. [Google Scholar] [CrossRef]
  42. Koszelnik, P.; Gruca-Rokosz, R. Determination of nitrate isotopic signature in waters of different sources by analysing the nitrogen and oxygen isotopic ratio. Environ. Sci. Process. Impacts 2013, 15, 751–759. [Google Scholar] [CrossRef] [PubMed]
  43. Gu, B.J.; Ge, Y.; Chang, S.X.; Luo, W.D.; Chang, J. Nitrate in groundwater of China: Sources and driving forces. Glob. Environ. Chang. 2013, 23, 1112–1121. [Google Scholar] [CrossRef]
  44. Ju, X.T.; Xing, G.X.; Chen, X.P.; Zhang, S.L.; Zhang, L.J.; Liu, X.J.; Cui, Z.L.; Yin, B.; Christie, P.; Zhu, Z.L.; et al. Reducing environmental risk by improving N management in intensive Chinese agricultural systems. Proc. Natl. Acad. Sci. USA 2009, 106, 3041–3046. [Google Scholar] [CrossRef] [PubMed] [Green Version]
  45. Bakhsh, A.; Kanwar, R.S.; Baker, J.L. N-application methods and precipitation pattern effects on subsurface drainage nitrate losses and crop yields. Water Air Soil Pollut. 2010, 212, 65–76. [Google Scholar] [CrossRef]
  46. Jin, Z.F.; Pan, Z.Y.; Jin, M.T.; Li, F.L.; Wan, Y.; Gu, B. Determination of nitrate contamination sources using isotopic and chemical indicators in an agricultural region in China. Agric. Ecosyst. Environ. 2012, 155, 78–86. [Google Scholar] [CrossRef]
  47. Liu, W.G.; Xing, M. Isotopic indicators of carbon and nitrogen cycles in river catchments during soil erosion in the arid Loess Plateau of China. Chem. Geol. 2012, 296–297, 66–72. [Google Scholar] [CrossRef]
  48. Zhang, D.; Yang, W.; Zhao, J.L. Tracing nitrate sources of the Yellow River and its tributaries with nitrogen isotope. J. Ecol. Rural Environ. 2012, 28, 622–627. [Google Scholar]
  49. Urresti-Estala, B.; Vadillo-Pérez, I.; Jiménez-Gavilán, P.; Soler, A.; Sánchez-Garcia, D.; Carrasco-Cantos, F. Application of stable isotopes (δ34S-SO4, δ18O-SO4, δ15N-NO3, δ18O-NO3) to determine natural background and contamination sources in the Guadalhorce River Basin (southern Spain). Sci. Total Environ. 2015, 506–507, 46–57. [Google Scholar] [CrossRef] [PubMed]
  50. Urresti-Estala, B.; Jiménez-Gavilán, P.; Vadillo-Pérez, I.; Carrasco-Cantos, F. Assessment of hydrochemical trends in the highly anthropised Guadalhorce River Basin (southern Spain) in terms of compliance with the European groundwater directive for 2015. Environ. Sci. Pollut. Res. Int. 2016. [Google Scholar] [CrossRef] [PubMed]
  51. Yu, H.Y.; Yu, Z.M.; Song, X.X.; Cao, X.H.; Yuan, Y.Q.; Lu, G.Y. Seasonal variations in the nitrogen isotopic composition of dissolved nitrate in the Changjiang River estuary, China. Estuar. Coast. Shelf Sci. 2015, 155, 148–155. [Google Scholar] [CrossRef]
Figure 1. A schematic map showing the location of the study area and water sampling sites.
Water 08 00328 g001
Figure 2. Analyses of chemical parameters in the study area.
Water 08 00328 g002
Figure 3. Spatial distribution of nitrate in the rivers.
Water 08 00328 g003
Figure 4. Relationship between Na+ and Cl, SO42− and Ca2+ concentrations of surface waters.
Water 08 00328 g004
Figure 5. Relationship between NO3-N and δ15N-NO3 in surface waters.
Water 08 00328 g005
Figure 6. Histograms of δ15N-NO3 in surface waters of the Weihe River basin.
Water 08 00328 g006
Table 1. Statistics of three different forms of nitrogen of all the water samples.
Mean (mg/L)Maximum (mg/L)Minimum (mg/L)Median (mg/L)MCL 1 (mg/L)Exceeded Rate (%)
NO2-N0.0090.015BDL 20.010.20
NO3-N8.635.71.37.41032.4
NH4+-N0.38.00.0080.051.02.9
Note: 1 The maximum contaminant levels (MCL) drinking water standard suggested by the World Health Organization (WHO); 2 BDL stands for below detection limit of 0.0018 mg/L of NO2-N.

