Article

Stakeholder Engagement and Knowledge Co-Creation in Water Planning: Can Public Participation Increase Cost-Effectiveness?

1
Department of Agroecology, Aarhus University, Blichers Allé 20, DK-8830 Tjele, Denmark
2
Department of Food and Resource Economics, University of Copenhagen, Rolighedsvej 25, DK-1870 Frederiksberg C, Denmark
*
Author to whom correspondence should be addressed.
Water 2017, 9(3), 191; https://doi.org/10.3390/w9030191
Submission received: 4 January 2017 / Revised: 21 February 2017 / Accepted: 2 March 2017 / Published: 7 March 2017
(This article belongs to the Special Issue Water Economics and Policy)

Abstract

:
In 2014, a radical shift took place in Danish water planning. Following years of a top-down water planning approach, 23 regional water councils were established to co-create and provide input to Danish authorities on the development of River Basin Management Plans (RBMP). The water councils advised local authorities on the application of measures to improve the physical conditions in Danish streams within a given economic frame. The paper shows the difference the use of water councils (public participation) made by comparing the final water council proposal included in the 2015 RBMP to the RBMPs proposed by the central government (Nature Agency) in 2014. The study concludes that the measures proposed by the water councils will generally deliver better results than the proposed Nature Agency plans, which do not include the same level of participation. Specifically, the water councils with stakeholder involvement proposed a much longer network of streams (3800 km), yielding a better ecological outcome than the shorter stream network (1615 km) proposed by the Nature Agency for the same budget. Having a structured and fixed institutional frame around public participation (top-down meeting bottom-up) can produce cost-effective results, but the results show that cost-effectiveness was not the only deciding factor, and that local circumstances like the practicalities of implementing the measures were also considered when developing the Programmes of Measures. The findings suggest that the use of water councils in water planning has significant advantages, including the fact that the knowledge of local conditions helps to identify efficient solutions at lower costs, which can be useful for administrators, policy-makers, and other stakeholders implementing the Water Framework Directive in years to come.

1. Introduction

For centuries, watercourses have been impacted by human activity. Many of our streams and rivers have been straightened to increase agricultural drainage efficiency, water barriers have been erected, and other changes to the physical conditions of streams have resulted in negative effects on the ecological status of watercourses [1,2,3]. These human impacts constitute one of the reasons why the ecological status of more than half of European surface waters are regarded as being less than good [4]. This conflicts with the aim of the EU Water Framework Directive (WFD) of achieving good ecological status of all European water bodies by 2027 [5]. According to the second generation (2015–2021) of Danish River Basin Management Plans (RBMP), about 11,400 km (60.3%) of the 18,900 km of streams with targeted objectives are reported as having a less than good ecological status [6]. For this reason, large amounts of money are expected to be spent to improve the streams in the coming years.
The most widely accepted method for selecting the measures to achieve good ecological status is by Cost-Effectiveness Analysis (CEA), as prescribed by the WFD [7,8]. CEA has also been adopted into Danish legislation and national guidelines when developing Programmes of Measures (PoMs) for the RBMPs [9]. Both legislative issues and large amounts of money are therefore at stake, which is why water managers, politicians, policy-makers, and other stakeholders are keen to make the stream restoration measures and their implementation as cost-effective as possible.
Previous attempts to mitigate any negative effects on the ecological status of Danish streams have deployed a command-and-control and general regulatory approach [10], exemplified, for example, by the implementation of 2-m and 10-m riparian buffer strips along streams [11]. However, several Danish commissions and reports have lately recommended a policy shift from this general regulation towards spatially-targeted regional and local water management initiatives that have the active involvement and participation of relevant stakeholders in the water planning process [10,12,13,14,15,16]. This is in line with Article 14 of the WFD, which states: “The success of the WFD relies on close co-operation and coherent action at the community, member state and local levels, as well as on information, consultation and involvement of the public users” [17].
A recent review of WFD implementation [18] concluded that the link between participation and cost-effectiveness analysis is understudied in academia. This paper seeks to address this deficiency by assessing the cost-effectiveness of public participation through an in-depth national assessment of active involvement in WFD implementation. More specifically, this will be achieved by comparing participatory decisions made by local and regional stakeholders in Danish water councils with non-participatory proposal plans from the central government (the Nature Agency) in Denmark.
The article is organised into the following sections: Section 2 briefly compares studies on EU water planning and public participation to provide the background for this study. Section 3 presents the water council case study. Section 4 presents the materials and methods used, and Section 5 and Section 6 are the results and discussion of the study. Conclusions are presented in Section 7.

2. Public Participation and the Water Framework Directive

The introduction of the WFD in 2000 constituted a shift towards a more integrated approach to water planning [19,20,21,22]—opportunities for involving the public by using stakeholder engagement and participatory approaches in new governance structures represented a significant change in most European countries [23,24,25]. Since the implementation of the WFD, there has been a number of studies on WFD implementation (most recent: [18]). Most of the WFD implementation studies have concluded that the implementation and level of public participation have varied across the EU Member States [22,26,27], and that during the first RBMP period (2009–2015), the public was not actively involved in the WFD process and water planning in the investigated member states [22,28,29].
The issue of public participation and related benefits in EU water planning has been dealt with in a number of scientific publications (recent examples: [30,31,32]). Many of these studies discuss the social dimension and process of participation, and not the relationship between cost-effectiveness, public participation, and output, even though the benefits of public participation are mentioned in the scientific literature as well as in policy documents. For example, in the wider natural resource management literature, public participation and collaborative approaches have been suggested and described as delivering better planning and policy outcomes [33,34], increasing learning and the adaptability of social–ecological systems [35,36] and contributing to a better decision-making process [37,38,39]. The possible benefits that could be attributed to public participation in EU water planning are still debated within the scientific community [40,41]. Koontz and Newig [41] state that based on evidence, participation input in Germany may have very little impact on the shaping of RBMPs and PoMs. The relationship between public participation and different outputs and outcomes obviously needs to be better understood and evaluated, as consistently emphasized in research [37,42,43,44,45,46,47,48].

Danish Evaluations on Water Planning and Public Participation

Water planning studies on the implementation of the first generation of Danish RBMPs and public participation (2009–2015) [12,13,49,50,51,52,53,54] conclude that there has been a very low level of public participation in the Danish implementation of the first RBMPs, particularly as regards the active involvement of the public and local authorities. The first RBMPs were issued by central government level with a typical “top-down” regulatory approach, with stakeholder consultation and information supply.
In [49] and their cross-national study covering Denmark, France, and the Netherlands, the authors argue that economic concerns were the main reason why the Danish government tried to curtail stakeholder involvement. The government became aware that the interest groups had high ambitions associated with high costs, and thus the central government had an increasing fear of losing control over the costs associated with implementing the RBMP. Bourblanc et al. [50] argue in their cross-national study of Denmark, France, England, Wales, and the Netherlands that public participation in Denmark was limited and caused implementation problems due to discrepancy between the central policy formulation and the (local/municipality) policy implementation. Wright and Jacobsen [13] argue in their study of the Danish implementation of the WFD that the involvement of stakeholders and the wider public was strictly limited to what was required by the law. Nielsen et al. [51] argue that the centralised implementation process in Denmark inhibits the possibility of integrating local knowledge in the RBMPs, and thus misses feasible local solutions. Jager et al. [52] argue that participation has been curtailed in Denmark due to political shifts over the period. All of these studies illustrate that there are different conclusions and perceptions on why the level of active stakeholder involvement has been low. It is, however, safe to conclude that relevant stakeholders in Denmark were not involved in the first generation of RBMPs. Moreover, the limited involvement of relevant stakeholders was seen as a contributing factor to the postponement of the implementation, since many complaints and a reluctance toward implementing both restoration and agri-environmental measures emerged [11,15,55]. The perceived lack of active involvement of relevant stakeholders in the development of the first Danish RBMPs led to a change in the planning process of the second round of RBMPs (2015–2021), which is when water councils were first introduced in Denmark [56].

3. Case Study—Danish Water Councils

In 2013, the former Danish government, and more specifically the authority in Denmark responsible for implementing the WFD—the Nature Agency of the Ministry of Environment (hereafter referred to as the Nature Agency)—proposed a new water planning act [57]. The act involved the establishment of 23 new water councils, one for each of the 23 sub-River Basin Districts (RBDs) (see Figure 1 for a geographical overview of the 23 regional water councils). The water councils should have a maximum of 20 members to represent the different organisations: for example, agriculture, nature and environmental, fisheries, water quality, water suppliers and water utilities, industry, and recreational organisations (see Table A1, Appendix A for an overview of member organisations, their scale of operation, and their aims). The act prescribed that the involved organisations should have a specific reason to be involved or an otherwise related interest in the protection and/or use of Denmark’s streams. The organisations could then apply to the municipalities for membership of the councils. Appointed secretariat municipalities had to choose between the applicant organisations in order to ensure an equal distribution of members from both the “users” of streams (agricultural, industrial organisations, etc.) and the “protectors” of streams (environmental and nature NGOs, water quality organisations, etc.). A total of 109 different organisations participated in the Danish water councils, of which 61 organisations were local organisations comprising local watershed organisations, local anglers, farmers, and national agricultural and environmental organisations (Table A1, Appendix A).
The inclusion of local knowledge in the water council work was emphasised in the guidance document, which describes the water council act and the framework for the water councils´ tasks as follows: “The water councils will be strengthening local involvement in water planning. There will be a greater local presence and greater local ownership than under the previous legislation, and water councils will ensure less bureaucracy and greater local involvement in achieving good ecological status in all the targeted streams” (own translation, [58]).
The guidance document developed by the Nature Agency prescribed how the water councils should work; this included an overview of the timeframe and task allocation, a catalogue of 16 measures that could be used and how to use the Geographical Information System (GIS)-based report tool [58]. The framework was specified in terms of stakeholder roles (municipalities were given the role of facilitator and moderator) and task definition. In this fixed framework, there was flexibility for each individual water council to structure the process and self-organise parts of the water council process (how many meetings, when and how this should be organised and facilitated, etc.). A key difference between the different water councils was the extent to which they arranged sub-group water councils on smaller catchments. In addition, some water councils attended field trips to inspect and learn about the streams and the function of the measures; others prioritised differently.
In the start-up phase of the water councils, the secretariat municipalities organised and facilitated the process of involving the water council members (in most cases, in coordination and collaboration with the rest of the local municipalities in each RBD). The secretariat municipalities were responsible for selecting the members, while it was left to the water council members to create local working groups and to arrange excursions to relevant sites. The primary mission of the water councils was to provide guidelines and to counsel local municipalities on the preparation of proposals for the PoMs for Denmark’s second RBMPs. The main task was to identify measures to improve the physical condition of streams, together with technical advisors from the municipality. The water councils and municipalities had six months (7 April to 7 October 2014) to develop detailed PoMs for the watercourses in question. The proposed PoM was then forwarded to the Nature Agency as part of the preparations for the second round of RBMPs. In a recent publication, Boeuf et al. [59] revealed the existence of several exemption clauses in WFD implementation across member states, which if overused, could undermine the environmental goals of the EU WFD. The fact that many actors—also in a Danish context—potentially could have an interest in undermining the effectiveness of EU environmental policies is not going to be the core aspect in the water council case. Mainly because, the water council structure tried to prevent organizations from reducing the effectiveness as the money was allocated. The water councils were only given an advisory role in relation to the municipalities' role in drafting the PoMs, and because the water councils were given neither executive nor administrative powers and had no veto over the municipal decisions [58]. The local municipalities were responsible for drawing up the PoM, but were obliged to obtain input from the water councils to ensure inclusion of local knowledge.

3.1. The Use of Water Councils to Actively Involve the Public

As described previously, many attempts have been made in the different EU member states to involve the public. Public participation can be achieved in many ways and there is no “one size fits all” approach. What works in one member state might not work in another. Encouraging the active involvement of stakeholders in RBMPs has therefore been the subject of different interpretations, and as shown in the previous section, has yielded different results in the EU member states in the first generation (2009–2014) of RBMPs [27,52]. In addition, the interpretation of what constitutes active involvement activities has varied across EU member states and regions therein (e.g., Sweden, the Republic of Ireland, the Netherlands, France, and the German states of Schleswig-Holstein, Lower Saxony, and Thuringia), and different approaches have been used to involve the public, such as water councils, water boards, river basin district advisory councils, water advisory boards, and river basin committees [49,60,61,62,63]. Most of the active involvement groups in the member states typically have representatives from organizations such as agriculture, environmental NGOs, industry, municipalities, etc. Examples are the Swedish water councils which have broad representation of user stakeholders in local catchments [63]; the Basin Committees in France have representations of users and non-state actors, local government actors, and state government actors in equal share [52]; and the River Basin District Advisory Councils in the Republic of Ireland include representatives from interested parties who consider matters relating to the preparation of RBMPs [60]. Meanwhile, in other regions (e.g., Denmark, and to some degree England and Wales), the involvement of stakeholders has been limited to public consultations and information campaigns [13,32,49,51,64]. However, Article 14 prescribes three different public participation principles that should be followed when member states implement RBMPs: securing information, consultation, and the encouragement of active involvement of stakeholders. The Danish water councils were initiated as an attempt to fulfil the active involvement principle prescribed by Article 14. However, as shown in a recent study [65], the level of public participation in the water council process has been evaluated, and the study concluded that the water council process can be characterised as an expanded stakeholder consultation and not active involvement, due to the constraints described in the framework. The policy design and institutional arrangement of the water council included specific requirements for how and what the water councils were to deliver [65].

3.2. Framework for the Water Council Work

The Nature Agency outlined a framework for the tasks to be carried out by each water council (Figure 1 shows the geographical distribution of the efforts and the economic investment framework for 2015–2021). A number of requirements were prescribed in the framework: that a minimum of 1615 km of streams should be identified for improvement; that measures to achieve good ecological status should be proposed; that a minimum of 181 obstacles, dams, weirs, and other instream barriers that potentially block the migration of adult and juvenile fish species in streams were to be removed; and that a minimum of 39 ochre-removal basins were to be established. By prescribing these requirements, the Nature Agency sought to ensure that lowering the environmental objectives would not be an option, which potentially can happen when influential interest groups are involved. The 23 water councils and municipalities were given a total budget of DKK 695,700,000 (€93 million).
The economic investment framework set out for each water council was differentiated geographically relative to the conditions of the streams and the needs of each RBD. The differentiation was based on an estimation of how many km of restored streams would be needed to reach good ecological status by 2021 (the non-participatory decisions which are compared to the participatory water council decisions in this study). Subsequently, the Nature Agency estimated how much money each RBD should spend to ensure it reached good ecological status. As the measures were financed by the Danish state, the water council members were not given authority to decide who should receive payments, which could have made the negotiations more complicated. Instead, they were asked to focus solely on effective resource allocation. Thus, we can evaluate the impacts of the participatory decision-making process by which of the PoM measures they decided to use, and where they decided to improve streams.

4. Materials and Methods

The study was based on a national assessment of the effect of participation on cost-effectiveness in Denmark. We compared the recommendations of the water councils and municipalities (The PoMs proposed by the water councils) with the Nature Agency’s framework proposals (minimum requirements: km of streams to reach good ecological status, obstacles to be removed, and ochre-removal basins to be established). The aim of this paper was to evaluate the Danish WFD implementation against a normative framework of improved collaborative innovation. Collaborative innovation, by including different stakeholder values, perspectives, and knowledge, is necessary to achieve sustainable, lasting, and creative solutions [67,68], and this is needed if the WFD objectives of achieving good ecological status are to be achieved. By using this analytical comparable framework, we were able to assess the extent to which the participatory process with local stakeholder involvement in water councils would deliver a more efficient output than without stakeholder involvement (bottom-up vs. top-down water planning). The effectiveness in this study is concerned with the output from the process. Output evaluations are related to the coordination process, such as the plans, agreements, proposed measures, and other tangible items generated by the collective process. Output can be evaluated immediately after the participation process [43], and can give a picture of good implementation. However, any future evaluation of the “effectiveness” and the environmental outcome from the output can of course result in a different picture. This is why it is important to not only measure output but to also analyse the outcome. Outcome evaluations are related to the effects of outputs on environmental and social conditions. Because there is a time lag between the proposal of measures (which is our study) and implementation and again environmental effect, we were not able to judge or evaluate the environmental outcome of the proposed measures, but rely on the fact that the measures the water councils could choose between have been evaluated [69].
The study was a multi-case study including all 23 River Basin Districts in Denmark, making this—to our knowledge—the first comprehensive cost-effectiveness evaluation of the national implementation of a scheme involving national member state WFD public participation.
Data were collected in the form of documents and spreadsheets from the Nature Agency and the municipalities. We received data on the 23 submitted municipality/water council proposals of the PoMs as well as the 23 RBD draft RBMPs (2015–2021) (proposed Nature Agency requirements). The main data received and used for the analysis of the water council proposals were outputs (pdf and Excel formats) from the Nature Agency’s GIS system into which the municipalities had to report their water council proposals. The main data on the minimum requirements from the Nature Agency were in the form of different spreadsheets and consultation-response documents (pdf) published by the Nature Agency for each RBD (i.e., 23 different RBMPs). The water council data on stream restoration measures chosen in each PoM were grouped into geographic and economic data, and we generated a nationwide geographic database of all 16 measures chosen (numbers, km of effort, and costs) in each RBD to assess the RBMP output for 2014–2015. We then assessed the chosen measures and the related economic priorities, and finally compared this systematically with the Nature Agency’s requirements.

Cost-Effectiveness: The 16 Measures and Their Costs

The WFD requires EU member states to assess the cost-effectiveness of the measures that are implemented as part of the PoMs in the RBMPs (Article 11 in the WFD; [70]). The objective is to ensure that the member states decide on the most effective combination of measures for achieving the Directive’s objective of good ecological status. To achieve good ecological status, the water councils and municipalities were provided with a catalogue of 16 stream restoration measures, from which the water councils could choose the ones they deemed would be the most beneficial (Table 1). The key issue in CEA is to rank measures according to their cost-effectiveness (e.g., the cost per unit) [71]. In this water council case, it was assumed that the environmental gain would be the same for all measures, and so the analysis is in effect a least-cost analysis, e.g., the highest possible environmental gain for a given sum of money.
In the Danish catalogue of stream restoration measures, the estimated standard cost for each measure is specified. These costs are based on empirical data from the municipalities because the municipalities have many years of experience in implementing these 16 measures.
In the first round of the Danish RBMPs (2009–2014), the measure “reduced dredging and vegetation management in the water courses” (i.e., plant removal by either simple cutting of the macrophyte biomass using a scythe or a complete dredging of the plant biomass and accumulated sediments) [72,73] was defined as the principal measure. The authorities judged that this would improve the physical conditions of the streams. However, this measure was difficult to implement and was met with dissent by the Danish agricultural community. Further, the impact of this measure proved difficult to assess, as the extent of the flooding of the agricultural fields was uncertain, which led to uncertainty regarding how compensation should be allocated. In instances where farmers lost income, the compensation scheme was to be funded by the Rural Development Programme. Hence, compensation could not depend on the ex-post conditions of a particular year. Because of these uncertainties, the measure ended up being removed [16]. Therefore, when preparing the PoMs for the second RBMP (2015–2021), the Nature Agency created a list of measures that included a list of investment and maintenance costs based on the experiences of previous projects in the municipalities [69]. In some cases, the costs were difficult to estimate, as they not only varied depending upon the measure implemented, but also on the width of streams (varying between 0–2 m, 2–10 m, and over 10 m). All 16 measures were included, and each of the 98 municipalities was asked to provide feedback on the catalogue. Cost-efficiency was then calculated in terms of cost per kilometre of stream per year [74]. In the assessment of the efficiency of the measures, it was assumed—based on the environmental analysis—that they will all achieve the target of improved water quality in streams (improved fauna using the Danish Stream Fauna Index) [69].
Therefore, for all the measures it was assumed that they would adequately fulfil the overriding objective of achieving good ecological status [69]. We assumed that the target would be reached at the same time, but some measures might achieve this faster than others, because the effect of the measures is to some extent uncertain and it may take years before environmental evaluations become possible.
As noted in Annex III in the WFD directive, a judgement should be made about “the cost-effective combination of measures” including the estimation of the potential costs, as the resources used are limited. The next step was then to calculate the costs in order to rank the measures [75]. The cost estimation included:
  • The initial investment (e.g., buying land, excavations, etc.)
  • Compensation given to farmers for the areas affected
  • Running costs related to the maintenance of the streams, etc.
  • Administrative costs
When the annual costs of the investments were calculated, the planning horizon was set to 20 years, and the annual interest rate at 4%. The calculated cost was the cost per km of stream per year for a given width of the stream. No side effects (CO2, NH3, etc.) were included in the calculation. This calculation led to recommendations regarding the levels of total cost per km [75]. Here, the less expensive measures were found to be the planting of aquatic plants, reducing dredging and vegetation management in the water courses, planting of trees, replacing the stream base material, and laying out coarse material. The most expensive measures were found to be the re-meandering of streams, opening of piped watercourse sections, establishment of mini river valleys, and the establishment of ochre-removal basins.
Cost estimations and calculations of the above measures were not included in the framework that was distributed to the water councils, which only included the investment per km while excluding maintenance and administrative costs [76]. Thus, the councils were provided with a well-defined frame, stating the overall investment limit and a range of measures with pre-estimated values for investment per km. However, it is worth questioning whether the investment framework provided to the water councils described the actual costs when both the maintenance and administrative costs were excluded. Because the water councils were given only the investment per km and not the annual costs of the measures, this begs the question of who would cover the annual costs of maintenance and administration: the municipalities or the central government? This matter will be discussed further in the results and discussion section.

5. Results

In this section, we compare the 23 water councils and their proposed PoMs against the minimum requirements set out by the Nature Agency.

5.1. Water Council Output Evaluation

The overall economic budget ceiling for the improvement of the streams is approximately €93 million, or around €7 million per year over a 20-year period (at 4% interest) [58]. This is on level with the €7 million per year allocated to improve water quality in the first RBMP [77]. When comparing the requirements in the framework formulated by the Nature Agency with the actual water councils’ proposals for PoMs and the efforts suggested in the draft RBMPs (Table 2), we see that the water councils recommend more than double the number of km of improvement to the streams than they were required to do; the minimum requirement was 1615 km and their proposals total 3800 km. This means the proposed measures have had a higher than expected effect (i.e., more measures will result in in a greater reach of streams being improved, which will likely result in a proportional ecological improvement) compared with the minimum requirements set out by the Nature Agency). Several water councils also proposed the removal of a total of 41 more obstacles than required in the framework and propose three more ochre-removal basins to be established than the Nature Agency’s requirement. As the Water Council Index in Table 2 shows, the proposals were between 105% and 135% above the original target values set.
Table 2 shows that the participation of relevant stakeholders in the water council setup delivers an output that is higher than the minimum requirement. This shows that the use of bottom-up local knowledge to supplement the municipalities’ technical knowledge provides a significant advantage compared with a purely top-down river basin management plan, with the use of only expert-based knowledge from the central government level.
By comparing the submitted PoM proposals from the 23 water councils with the draft RBMPs (2015–2021) which were published for public consultation in the first half of 2015, almost all of the proposed water council measures are found in the RBMPs. Thus, the proposed PoMs by the water councils form the basis for the final draft RBMP, as prepared by the Nature Agency.
In a few cases, the Nature Agency found it necessary to adjust the submitted proposals from the water councils. This includes cases where a municipality indicated that the measures and efforts proposed by the water councils to a stream would not lead to the achievement of the goal for the whole watercourse. In these cases, the Nature Agency removed the suggested measure from the proposal or used efforts from earlier proposals that the municipalities had accepted. In other places, a longer reach of streams was included because the Nature Agency saw that certain municipalities had other projects that could be included as well. Therefore, in some cases, there are slight discrepancies between the water councils’ proposals as submitted to the PoM and the actions described in the PoM for the second round of RBMPs (2015–2021). When comparing the formulated framework of the Nature Agency with the proposed PoMs from the water councils and the municipalities (Table 2 and Figure 2), it is apparent that the economic investment frame has been largely fulfilled. As shown in Table 2, proposals totalling €3 million were submitted, which is more than the figure in the framework requirements. However, only in two RBDs was the framework figure vastly exceeded (Figure 2): in RBD 1.8 Ringkøbing Fjord by €1.7 million, and in RBD 1.10 Vadehavet by €1.5 million. This exceedance from the investment framework was due mainly to the technical difficulties associated with fitting ochre-removal basins into the correct stream widths in the GIS-based reporting tool, and because the GIS-based reporting tool had overestimated the cost of setting up the ochre-removal basins, so there was actually no exceedance of the investment framework.
The average cost per km stream was around €24,000 against a cost of €52,000 per km in the original proposal. The costs varied from €69,000 per km in some catchments (e.g., RBD 1.9 Horsens Fjord) to €14,000 in others (e.g., RBD 1.14 Storebælt). In the Kattegat catchment, the use of trees alongside streams increased the length of streams covered at the same cost. Furthermore, the investment framework for RBD 1.10 Ringkøbing Fjord was surpassed because the water council proposed 23 ochre-removal basins, two more than the 21 originally required.
If we look closer at how the economic investment framework was utilised (Table 2 and Figure 2), we can see that the water councils proposed efforts that will lead to the achievement of the objectives for a greater length of streams than the minimum required by the Nature Agency. The increase is over 100% in 17 RBD cases. Overall, the draft PoMs in the second RBMP (2015–2021) set out to improve the conditions of up to 3800 km of waterways, where the minimum required target was approximately 1600 km (an increase of 130%), and in six RBD cases, the increase in the length of streams achieving good ecological status is over 200%.
Regarding the removal of obstacles, 13 of the 23 water councils suggested the removal of more obstacles than the framework required (+23%) (Table 2 and Figure A1 in Appendix B), and three water councils proposed more ochre-removal basins than the framework required (Figure A1, Appendix B). The key explanation for this is that the Nature Agency based their plan of measures in a given catchment on certain standard assumptions regarding the length of stream required for a given measure to achieve good ecological status in a given stream [78]. However, in the water councils’ processes, the local knowledge was used to select the parts of the streams were measures were required to ensure fulfillment for the entire stream. There was also a move toward the use of less expensive stream restoration measures. These changes allowed the water councils to stretch their money to help more streams than in the original plan.
In summary, the results from the participation experiment with the water councils show that, within the given framework, the water councils and municipalities proposed more efforts than the original minimum requirement, resulting in the restoration of more than twice the length of streams than proposed in the initially announced framework. The increase in length, the number of obstacles to be removed, and the establishment of ochre-removal basins indicate cost-effective work on the part of the water councils, showing that participation mattered in this case.

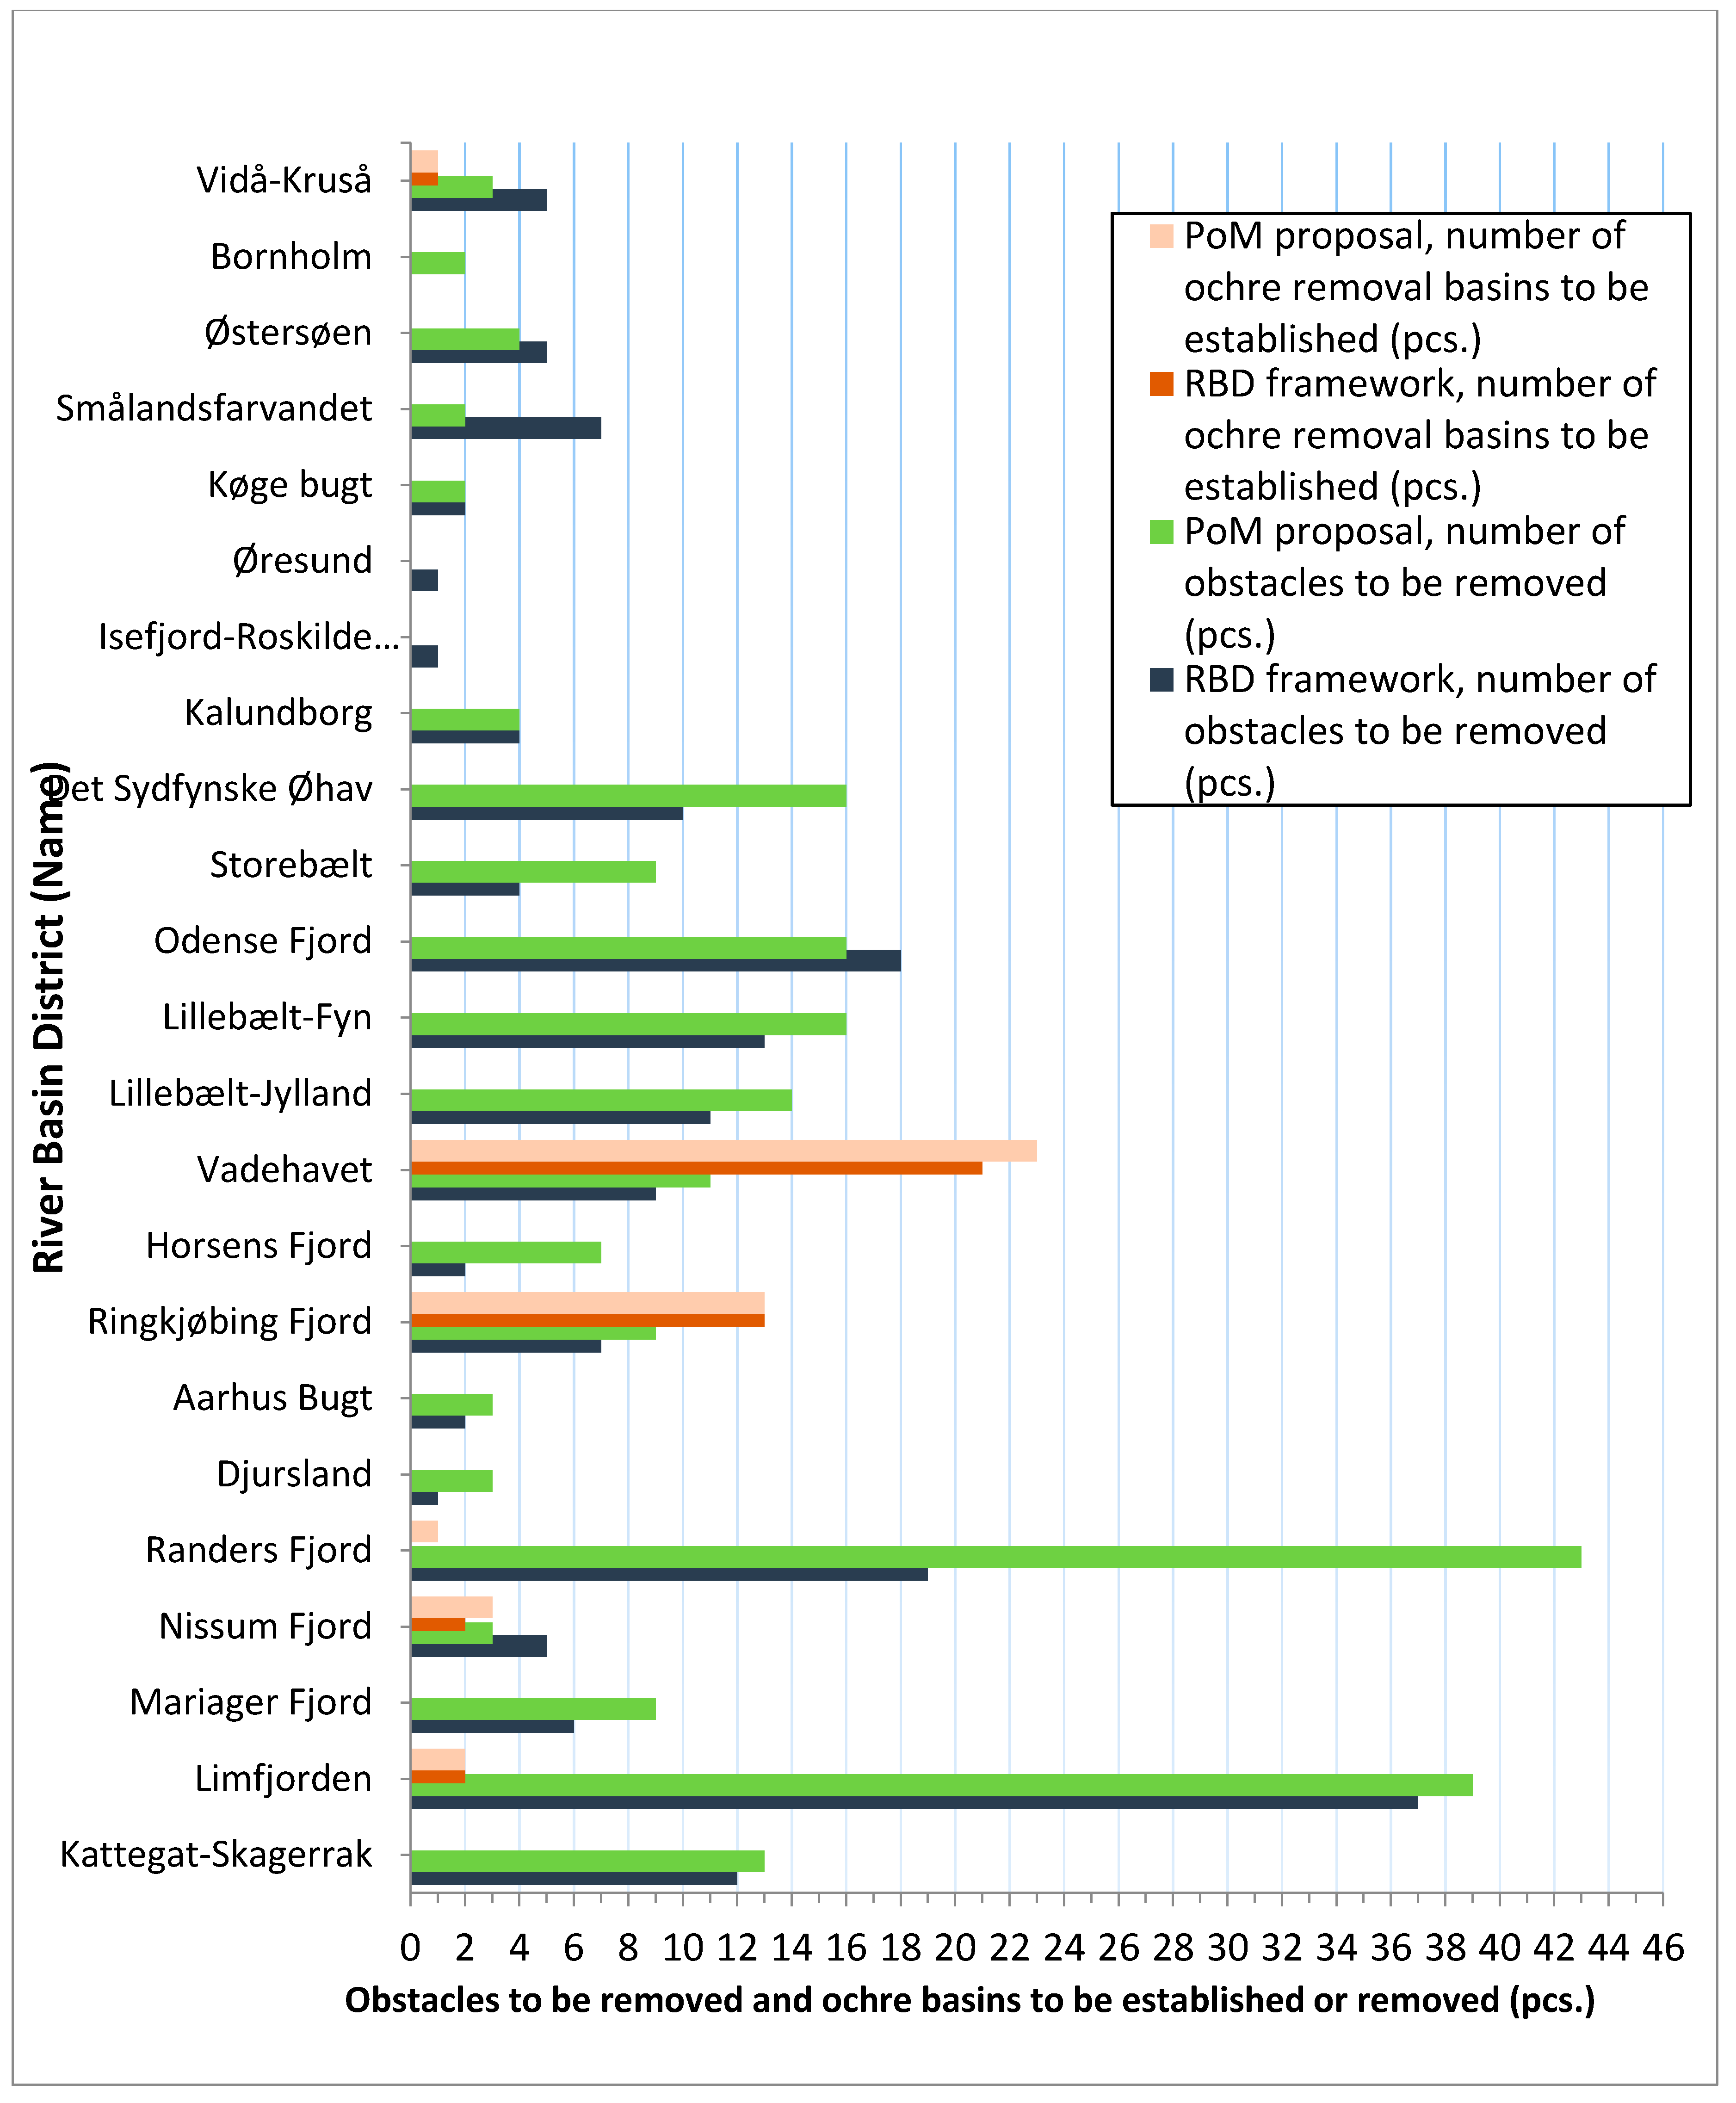
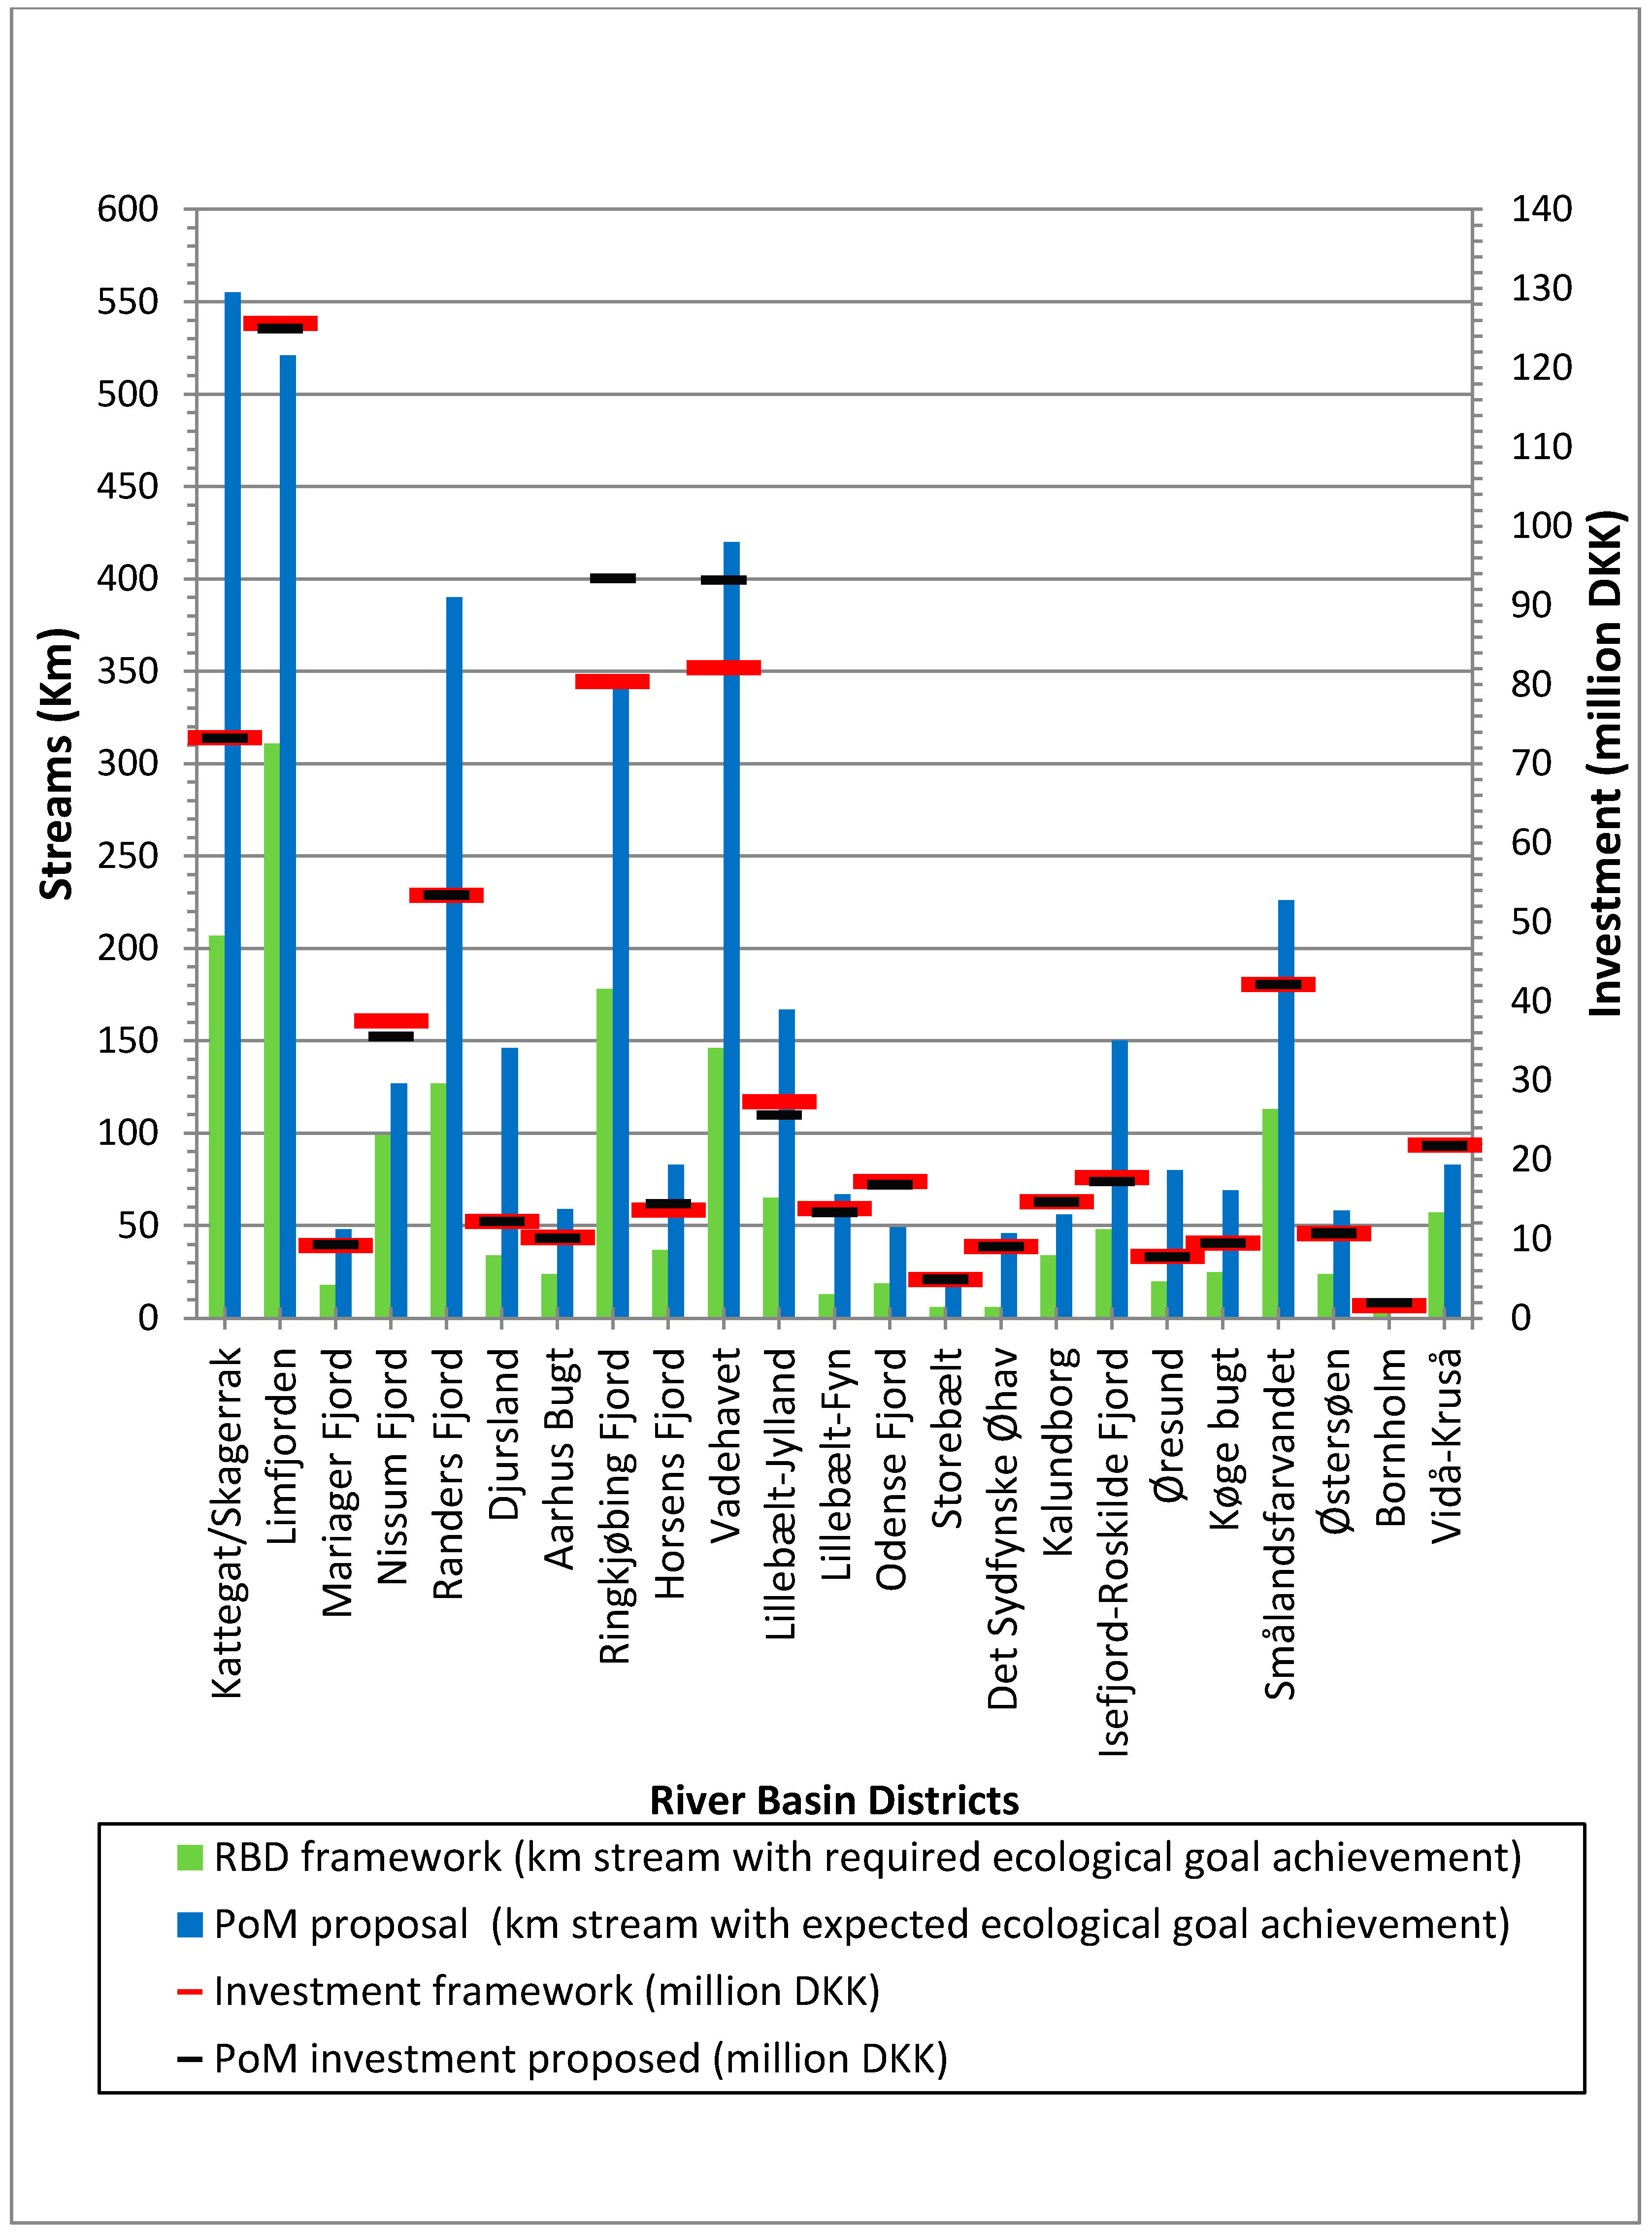
5.2. Measures Chosen: Outputs and Investments

When evaluating the measures that the 23 water councils proposed, we see that two measures—“laying out coarse material” and “tree planting along streams”—alone, or in combination, were used for 63.5% of the streams (1156 km out of a total of 1820 km) (Table A2, Appendix C). These two measures are minor restoration measures, and they are two of the least expensive.
Of the larger restoration measures that were selected, the “re-meandering of streams” was allocated to 194 km of streams, and “replacing the stream base material” was proposed for 312 km of streams, corresponding to 11% and 17% of the measures selected, respectively (Table A2, Appendix C).
Four measures (laying out coarse material, tree planting, re-meandering of streams, and replacing the stream base material) were used by all water councils and allocated in 90% of the cases, showing a low diversity in the measures proposed to achieve good ecological status and that only a small number of measures were chosen to ensure good ecological status.
It is difficult to determine the relative importance of economic and geographical considerations (or both) for the water councils’ decisions. However, since the water councils comprise local stakeholders, municipalities, and policymakers in most places, both economic and geographical considerations played a role when analysing the overall picture, and thus local knowledge and considerations did influence the measures that were chosen. Local knowledge therefore did feed into the planning process, given the difference made by the proposals of the water councils. In the water council proposals, there are many examples where the municipalities have listened and used the proposals from the water council members and used their local knowledge to change measures and locations of measures. This was the case in the water council of RBD Vidå-Kruså in southern Jutland, where the initial proposal by the Nature Agency did not contain measures and efforts in a stream close to a large weir. The reason from a technical and hydromorphological point of view was that it did not make sense to implement measures where there is a large weir preventing fish from swimming upstream. However, the local angling association and other local stakeholders wished to implement measures in this stream based on their knowledge of fish habitats in the stream. Another illustration of how local knowledge influenced the PoMs—and an example of how local knowledge can lead to a different proposal from that prepared by the experts (Nature Agency)—was in the RBD Aarhus Bugt water council. The local anglers proposed measures for a local stream, where they knew that the wild trout smolt population was disappearing because of a previously restored wetland. The proposal from the Nature Agency did not include this stream, but a united water council in Aarhus Bugt proposed that this area should be included in the PoM, and it was.

5.3. Cost-Effectiveness of Measures Chosen

The measure “laying out coarse material”, as described above, is the most frequently used measure, despite not being the cheapest but fourth-cheapest option per km (Table A2, Appendix C; Figure 3). Of the total investment of €95 million, it accounts for 29%, or 34.5% in combination with tree planting along streams (€20 and €24 million, respectively). In contrast, the measure “tree planting along streams” is the second most used in terms of km, but its relative cheapness means it accounts for only 4% of the total investment. The measure “re-meandering of streams” has the second-highest costs at €16 million (or 23% of the total investment), even though it is proposed for only 10% of the streams. This shows that cost-effectiveness was not the only deciding factor, but that local circumstances like farm practices and the practicalities of implementing the measures were also considered when developing the PoM.
Additionally, replacing the stream base material was proposed for 312 km, corresponding to 17% of the total length. Here, the associated investment is €5 million, which accounts for 7% of the total investment. Again, this is one of the cheaper options.
Table 3 and [74] show that the cheapest of the 16 measures in the catalogue are tree planting along streams, replacing the stream base material, and laying out coarse material—all independent of stream width. The administrative costs range from 1000 to 13,000 DKK per km annually, increasing the overall cost by an average of about 20% (6%–37%), depending on the exact measures and the stream widths. In general, measures such as opening piped watercourse sections, laying out coarse material, and the removal of obstacles to re-establish the free passage of fauna in streams have some of the largest administrative costs (between approximately 3000 and 10,000 DKK per km annually), which corresponds to an increase of 15%–30% in annual cost per km per year. Regarding maintenance costs, the popularly chosen measures—laying out coarse material and tree planting along streams—have low maintenance costs, but to this should be added administrative costs of up to 10,000 DKK per km annually. This leads to the question of who is going to administer this work and how these costs are going to be covered in the long run. As mentioned, the water councils were given only the investment per km and not the annual costs of the measures. In Table 3, we can see that there are some measures where the investment costs, the annual costs (excluding administration), and the administrative costs are all high—specifically for the re-meandering of streams and opening piped watercourse sections. However, these measures are not the ones most often proposed. The measures most frequently selected by the water councils do not suggest a bias when the prioritisation is based only on the investment.
We can conclude that the investment per km provided to the water councils did not include the full costs. Potentially, this can be a problem if the chosen measures have low investment costs combined with high maintenance or administrative costs that need to be covered locally. However, the analysis shows that the chosen measures do not have large maintenance costs, so the ranking of the measures either with or without maintenance does not make a significant difference in this case.
The use of sand traps and reduced dredging and vegetation management in the water courses are the only two measures that have estimated maintenance costs (3000–20,000 DKK per km annually). The administrative costs vary largely from measure to measure. The highest administrative costs are related to the opening of piped watercourses and the laying out of coarse material. However, the administrative costs for each of the measures have not yet been fully identified, so including them in the overall ranking of the measures could potentially give an erroneous result. We assume that the Nature Agency and the municipalities have an agreement as to who will cover the administrative costs for each measure.
Overall, the results of the water councils’ work show that the water councils and the municipalities have worked within the given framework and were more efficient than they were required to be.
The question remains as to whether the proposed measures will deliver the results they claim in the long run. The ecological effectiveness of all of the measures chosen depends on the physical conditions of the streams and the geographical variations found within them. For this reason, it can be difficult to evaluate the ecological effectiveness and outcomes of the chosen measures without looking at every stream where the measures are to be used. However, when a participatory process means that more measures are implemented and more obstacles are removed so that, for example, fish can swim upstream and spawn, then one can hypothesise that participatory decisions will lead to improved ecological conditions in some way.

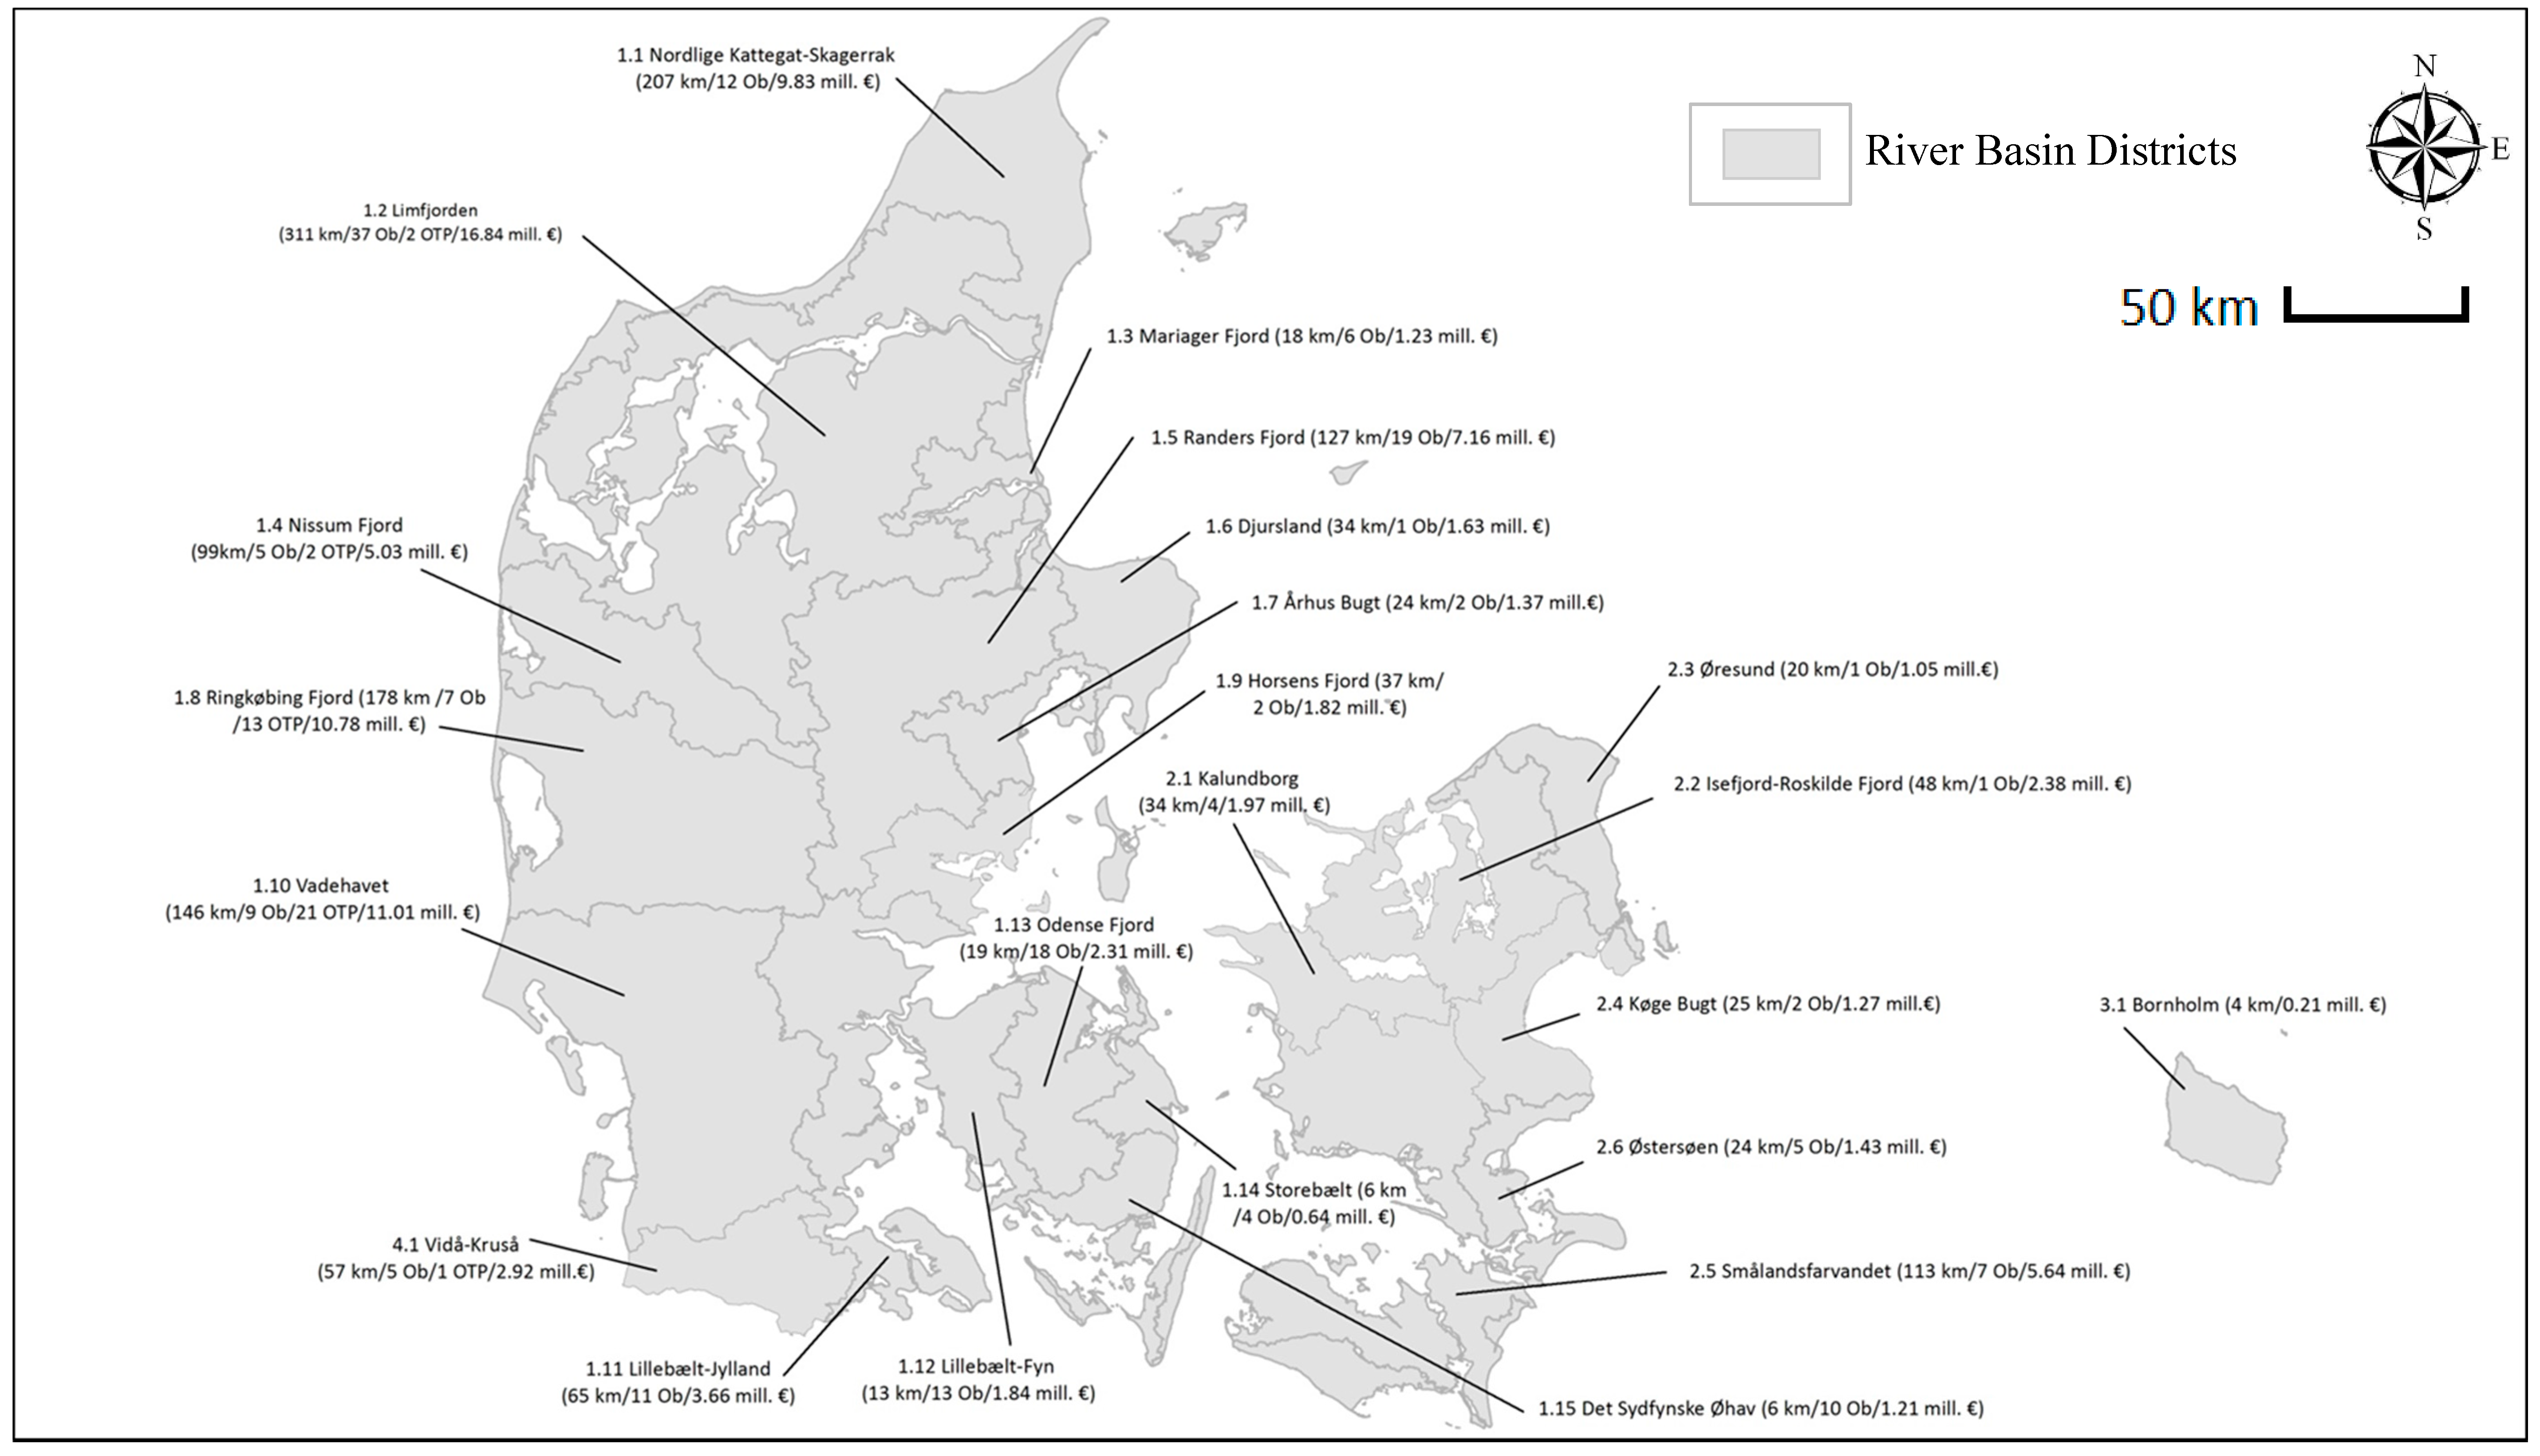
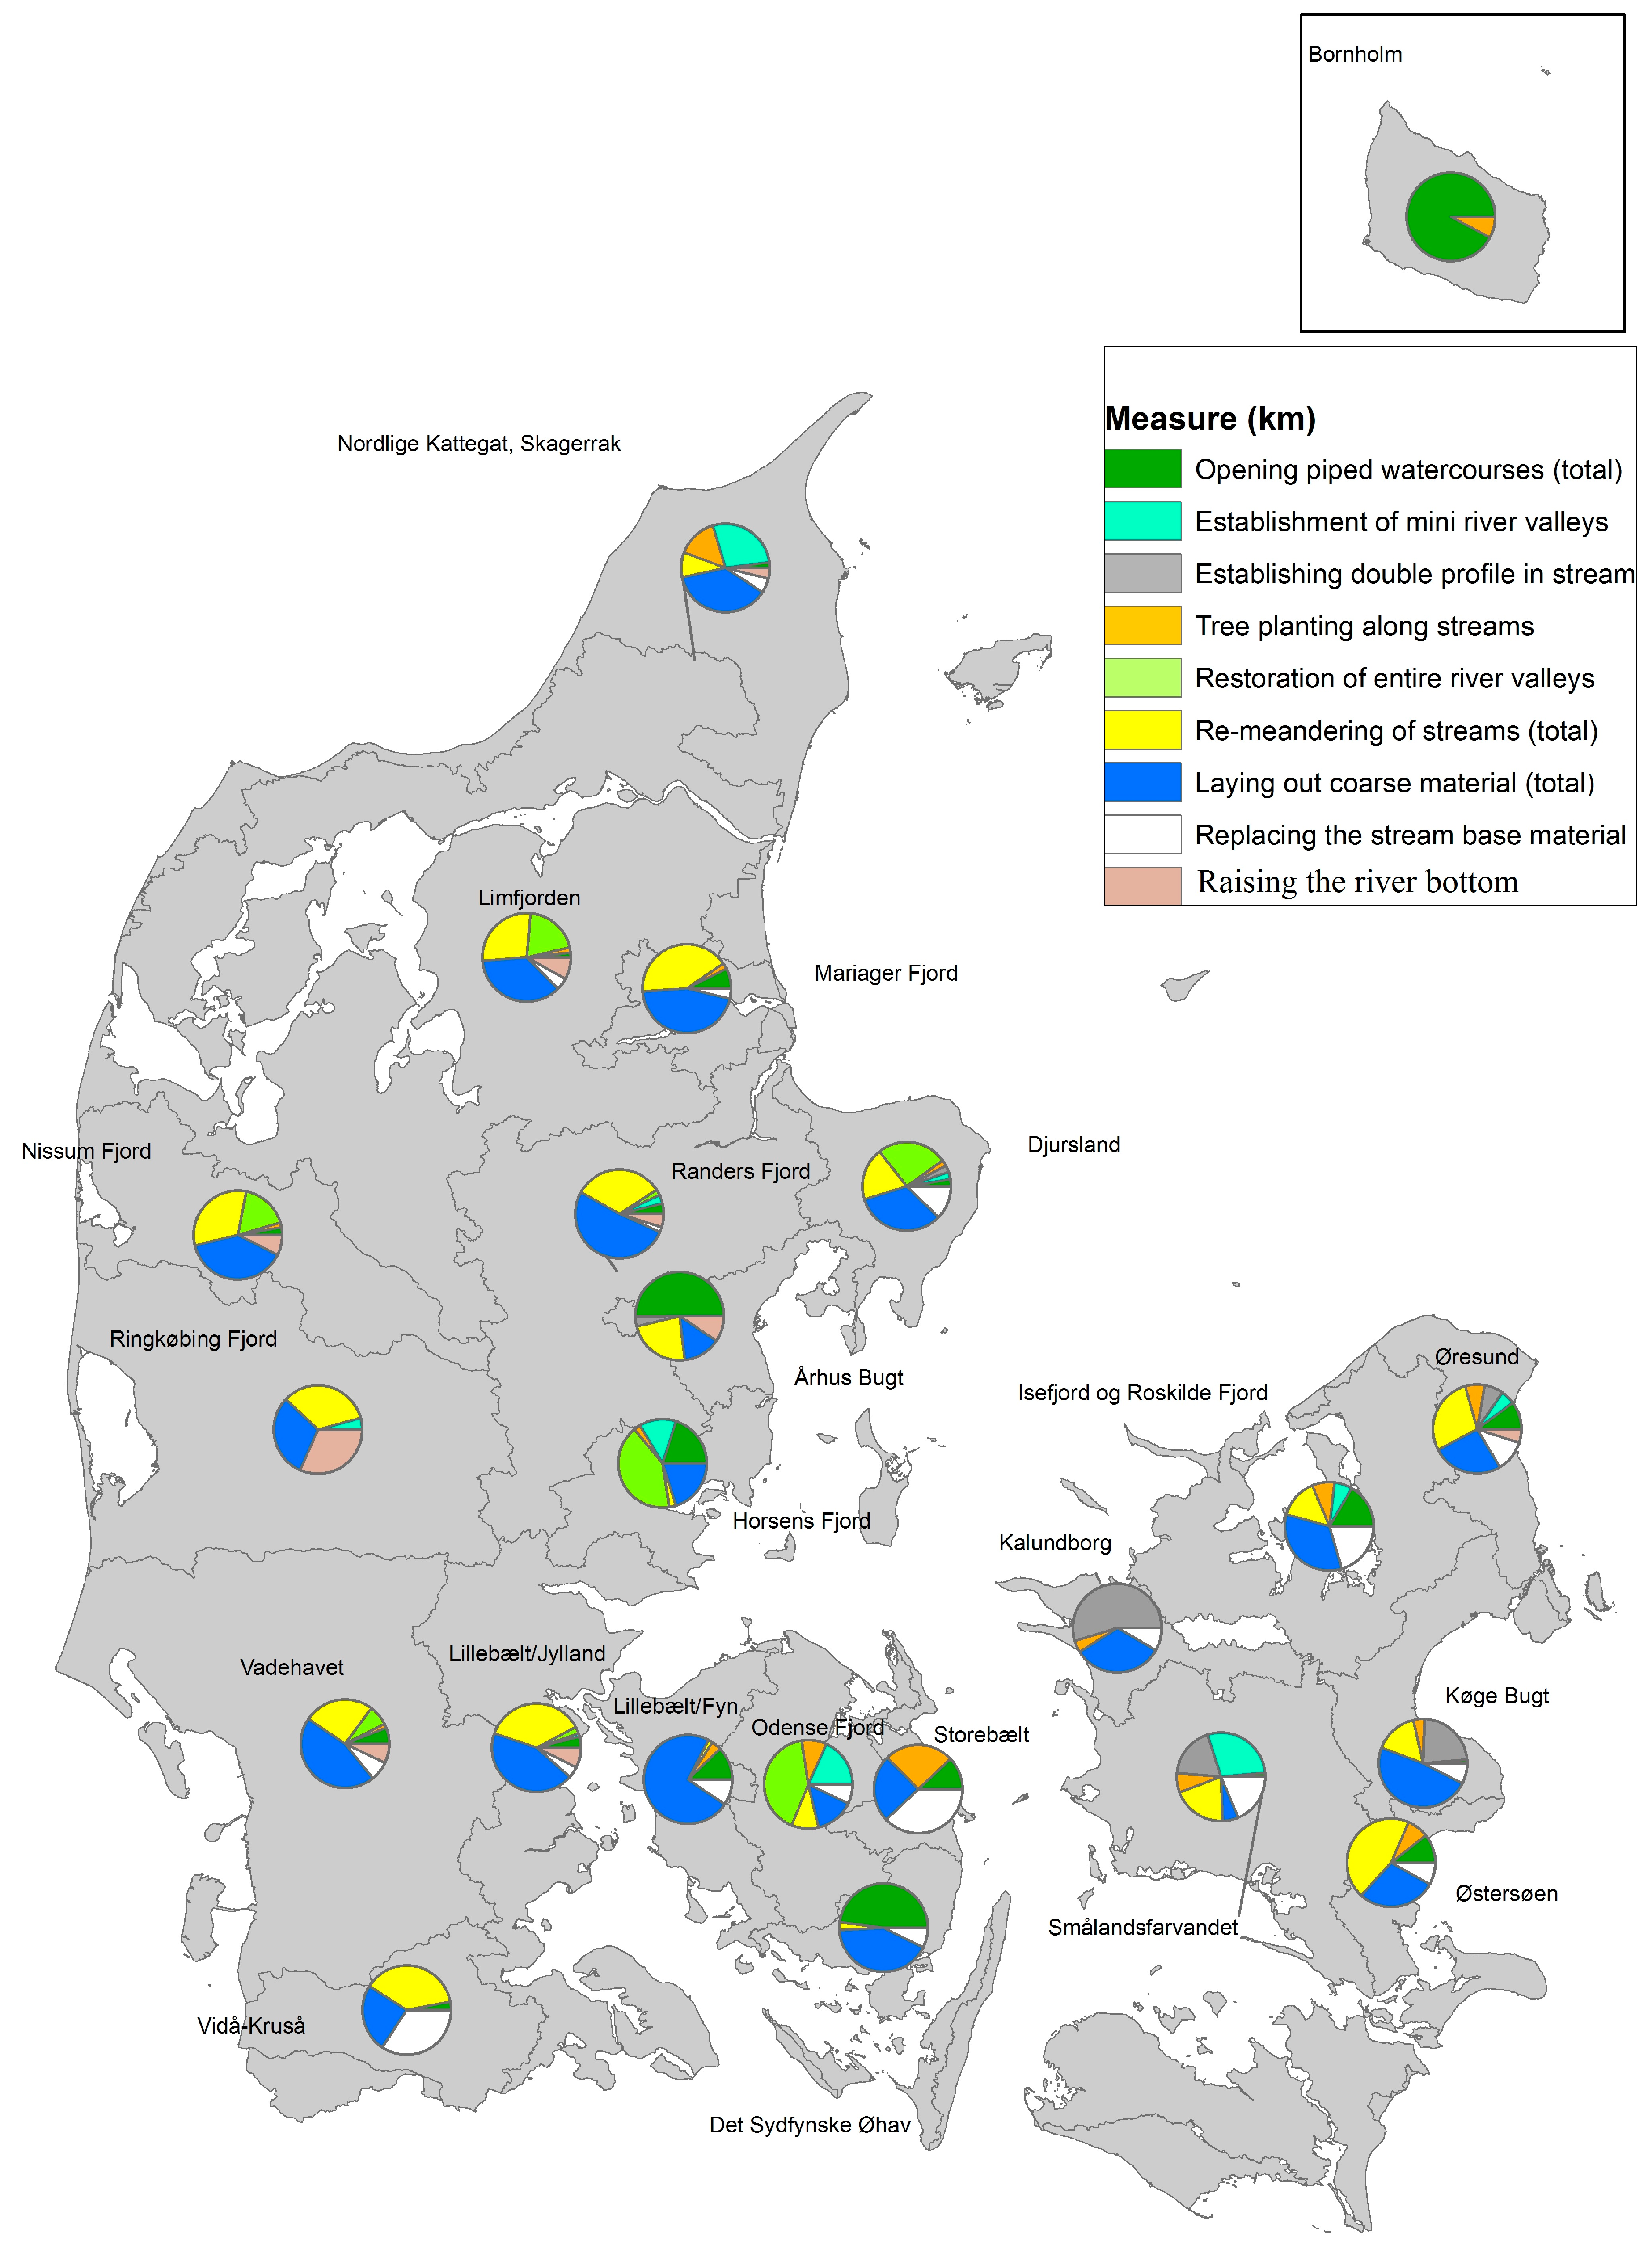
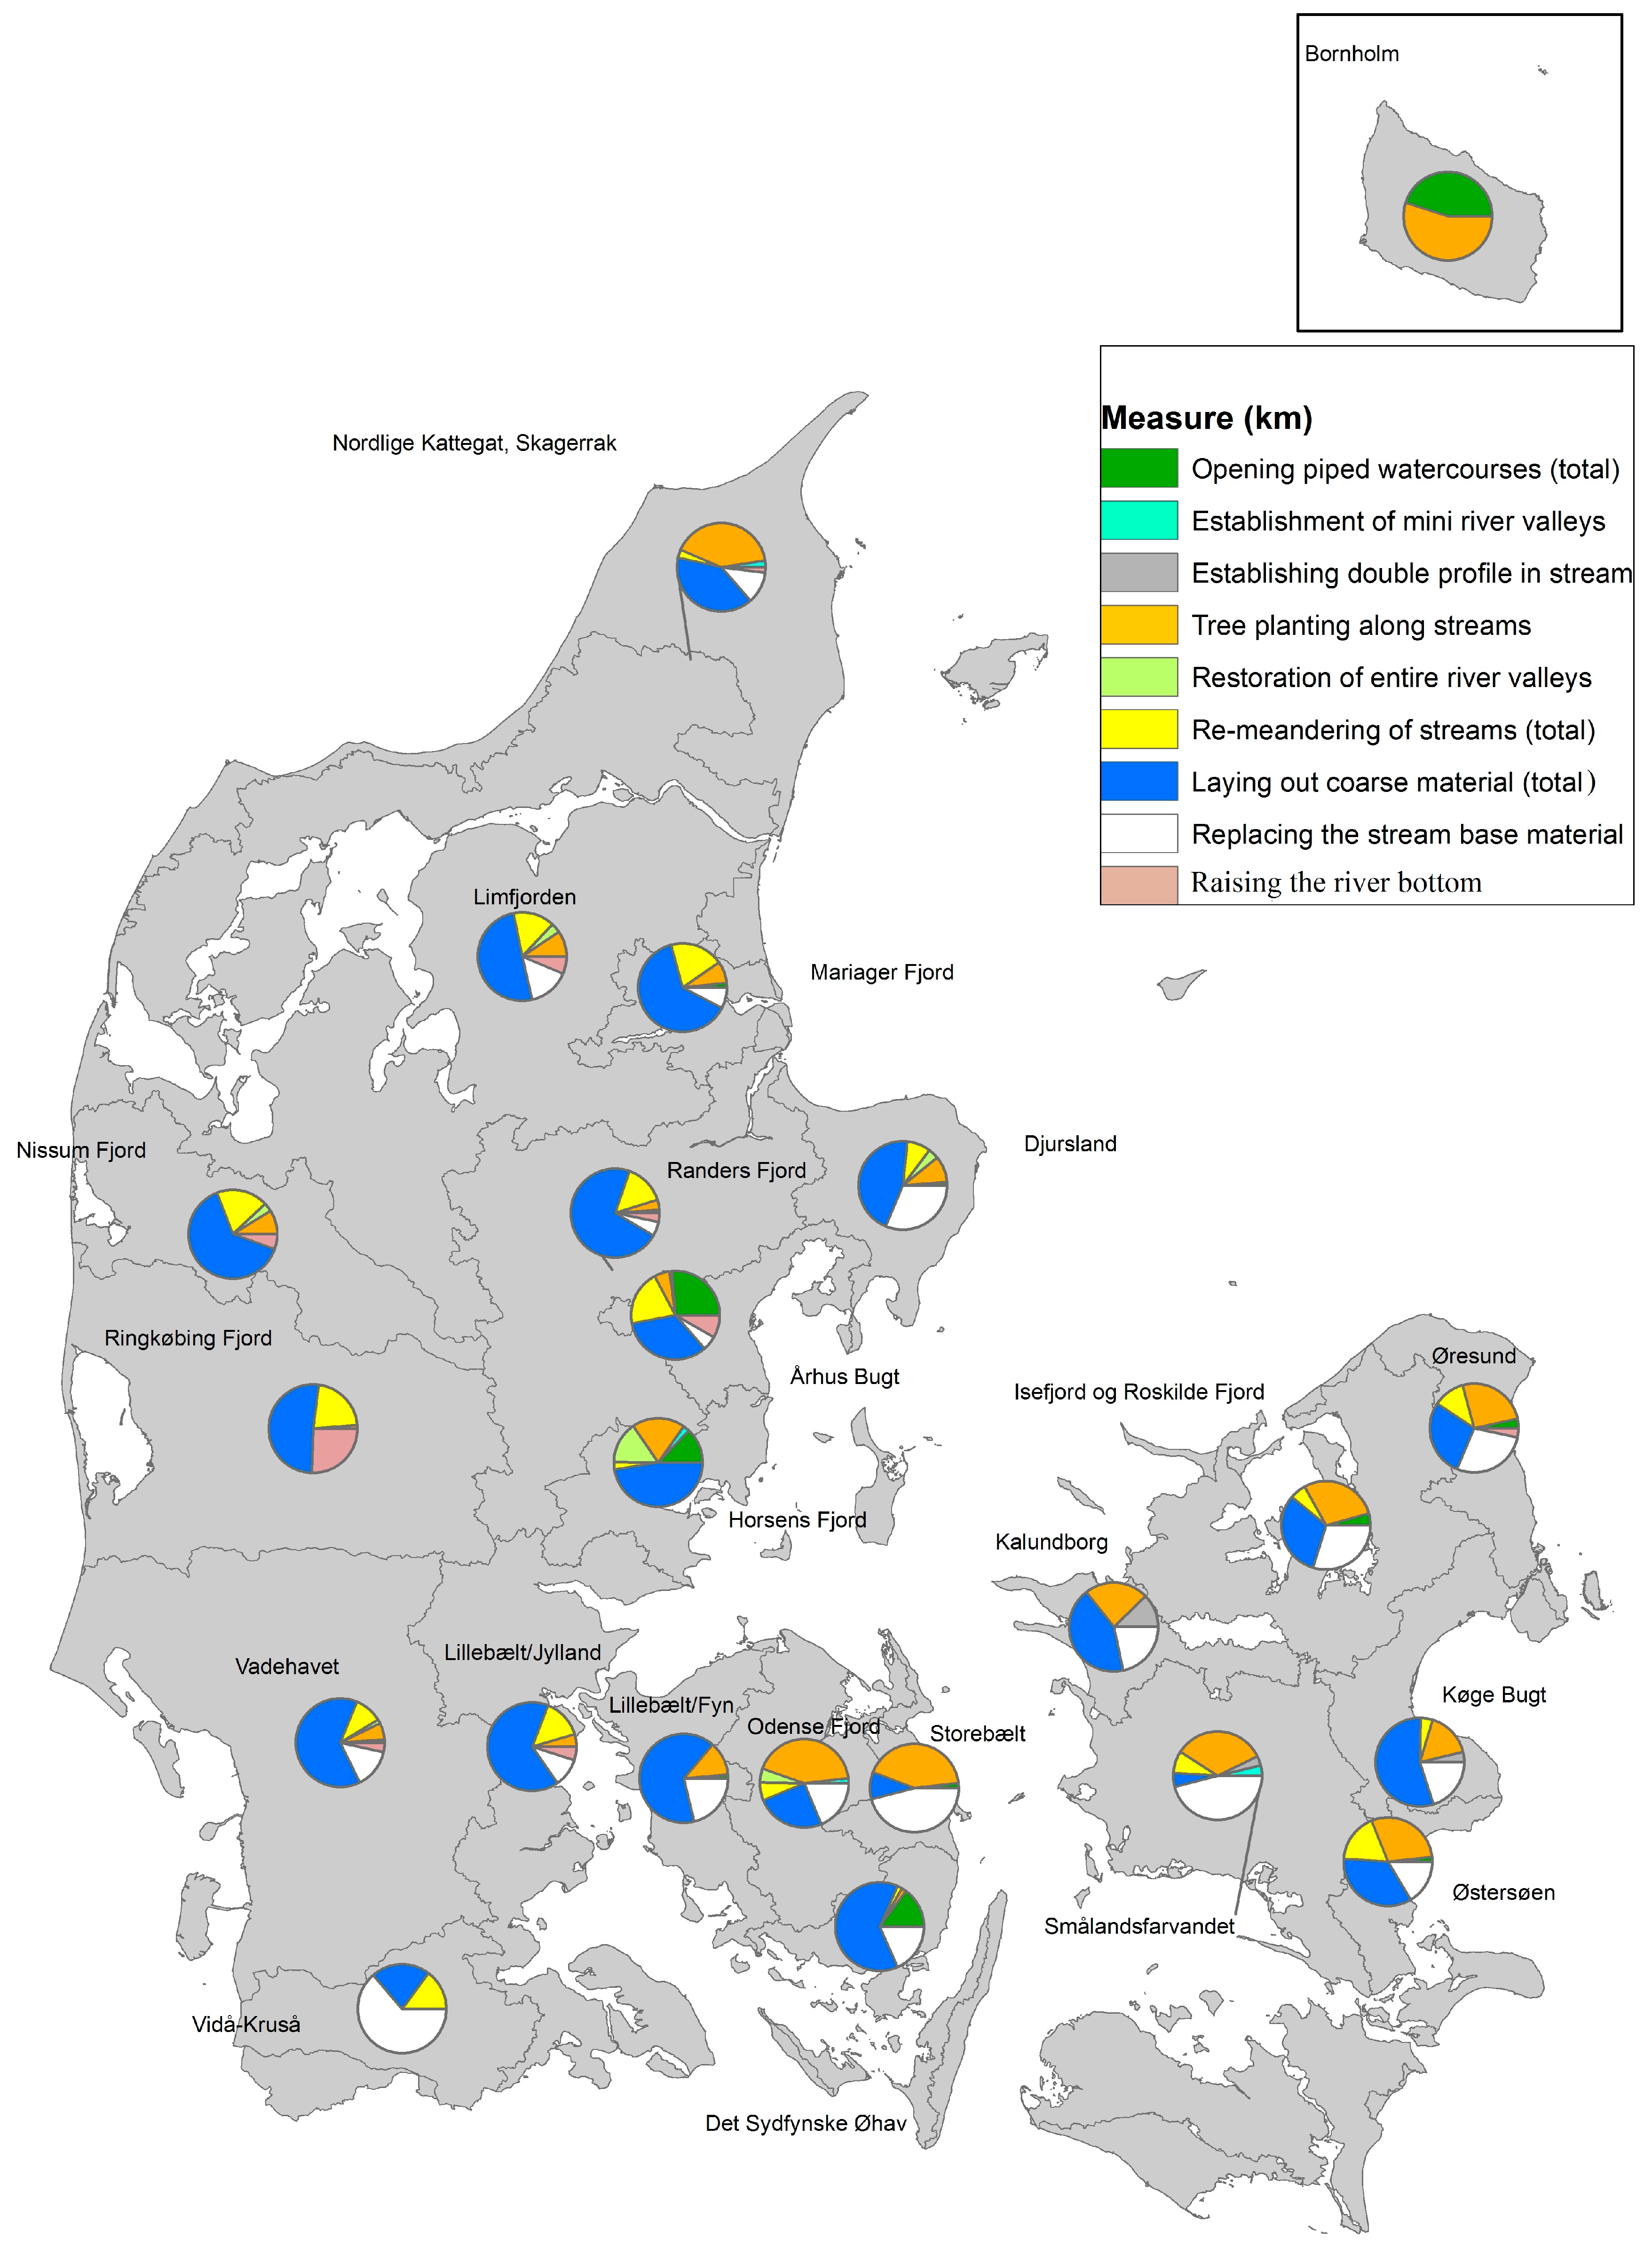
5.4. Geographical Differences in the Chosen Measures—“Be the River as it Rolls Along”

Besides the cost patterns of the chosen measures described above, there are also some spatial patterns in the measures chosen by the water councils. For example, in the central and southern parts of Denmark (specifically the RBDs Vadehavet, Lillebælt–Jylland, Lillebælt–Fyn, Randers Fjord, Det Sydfynske Øhav, Mariager Fjord, and Nissum Fjord), laying out coarse material in combination with tree planting along streams was proposed 60% of the time. This combination of measures was less used in the eastern parts of Denmark, such as in Odense Fjord, Storebælt, Øresund, and Smålandsfarvandet, with the exception of the RBD Vidå-Kruså in the southern part of Jutland, where this measure has been extensively proposed (Figure 4). Of the measures available, tree planting along streams has been proposed for 320 km of streams (18%). This makes it the second most frequently used measure in almost all the RBDs, and it was proposed for 131.2 km of streams in the RBD Kattegat Skagerrak, while the measure “replacing the stream base material” was proposed for 312 km (17%) of streams. In Kalundborg, Isefjord-Roskilde Fjord, Øresund, and Køge, replacing the stream base material was used between 20% and 29% of the proposals; in Smålandsfarvandet and Storebælt, this same measure was included in 46% of proposals; in Vidå-Kruså, it was proposed for 64%. This measure was also proposed more frequently in the eastern parts of Denmark, mainly on Zealand. The measure “replacing the stream base material” is a very popular measure in the Danish agricultural community, mainly because it is said to deliver better runoff in streams and better drainage when there is heavy precipitation. Thus, one hypothesis is that the choice made by water councils to replace the stream base material rather than lay out coarse material is because of the specific drainage context.
The main goal of the participatory experiment with water councils is ultimately to achieve improved (good) ecological status in our waters with greater efficiency. If specific agricultural interests rule out certain measures because of drainage interest, then the danger is that participation legitimises the self-serving interests of some groups instead of water quality. However, as it is assumed that all measures will achieve the target, the local context will most likely identify the measures that are best suited. If the target is not achieved with such measures, more measures will have to be implemented, as dictated by the Nature Agency. However, replacing the stream base material is one of the cheapest measures, suggesting that the water councils have considered cost-effectiveness when choosing their measures.
As discussed, for all the measures there are geographical differences pertaining to the water councils’ choices. However, the empirical evidence does not provide any good explanation as to why this might be the case. In future research, these geographical differences could be investigated using interviews with local water council members and municipality policymakers.
The measure “re-meandering of streams” was proposed for 194 km of streams (10%). It was used in almost all RBDs except for Storebælt and Kalundborg. In Limfjorden, Mariager, Nissum, Aarhus, Ringkøbing, Østersøen, and Kruså, re-meandering of streams was used in more than 15% of the measures available. In Mariager Fjord, Aarhus Bugt, and Ringkøbing, this same choice is used in more than 20%. Since it is more expensive but is able to yield more environmental improvements than the other measures, it is obviously regarded as an important and required measure in many RBDs. The measure “restoration of entire river valley” was proposed by 18 water councils, which corresponds to an effort of about 25 km of streams. This measure is an interesting choice because it delivers a particular synergy between water and nature when an entire river valley is to be restored. Specifically, it creates a wetland for the reduction of phosphorus and nitrogen while also helping to extensify previously intensively farmed lowland areas where climate change impacts are also likely (e.g., flooding).

6. Discussion

As the above cost-effectiveness analyses have shown, the cooperation of water councils with municipalities in the co-creation of PoMs where local stakeholder knowledge supplements the technical knowledge of the municipalities provides a significant advantage compared with a purely top-down river basin management approach using only expert-based knowledge from the central government level. One of the generally recognised benefits of stakeholder participation is the inclusion of local knowledge [79], which was the case in RBD Vidå-Kruså. A recent paper by Kochskämper et al. [31] studying the effects of participation on the environmental quality of governance outcomes also identified the provision of additional environmental knowledge as key to the environmental quality of the outputs and implementation. The study also identified the need for a balanced exchange of knowledge types—between, for example, lay local knowledge and expert knowledge—for more specific outputs. Another case study of participation in local-level planning in Lower Saxony in Germany showed similar tendencies that local knowledge helped generate ideas for measures, and again that top-down information was important and measures were shaped substantially by top-down direction from the state environmental agency [41].
With insights from this paper, it can be stated that cost-effective results can be achieved with a structured and fixed institutional framework around public participation (top-down meeting bottom-up). Without this bridge between top-down and bottom-up policy framework, it is not certain that collaboration automatically leads to sustainable outcomes, because there can be vested interests that undermine the effectiveness of EU environmental policies [59]. However, at the same time, the design of the framework around the Danish water council set-up is also a limiting factor. The policy design and institutional arrangement of the water council included specific requirements for how and what the water councils were meant to deliver. With these boundary limitations, the room for including innovative solutions in the PoMs was closed (e.g., integration of climate change concerns, nutrient management) that require the same local stakeholder knowledge.
It is emphasised throughout the scientific literature that geographical and temporal scales for water policy and governance are important for participation [80,81].
One of the limitations of the Danish water councils is size of the RBDs (538–7598 km2) that the water councils operate in. In a very large RBD, it is more difficult for members to have local knowledge of all streams. In these RBDs it can be argued that knowledge and access to knowledge was insufficient, thus making the water councils dependent on the local knowledge of watercourse characteristics of the staff from the local municipalities.
However, some water councils attempted to counter the potentially negative effects of the large-scale RBD by establishing local working groups. This helped ensure that the necessary knowledge about streams was distributed among the water council members and further up the system. Such local working groups were established in five water councils (Limfjorden, Østersøen, Smålandsfarvandet, Køge Bugt, and Mariager Fjord). In some water councils (such as Smålandsfarvandet and Østersøen), the public administrators established local working groups in addition to the water councils at RBD level from an early stage. This fits well with the findings of [68] (pp. 106–107), that divisions into local subgroups may facilitate knowledge-building. It is obviously more difficult and complicated to ensure local stakeholder participation and knowledge integration in large catchment areas with many municipalities than in smaller catchments with few municipalities—particularly when the project period is finite. However, the possibility of self-determination on certain aspects ensured that the water councils were able to counter the negative consequences of the large-scale catchments by setting up local working groups and by sharing knowledge between water council members and municipalities.
Findings from Sweden—where comparable water councils have existed since 2005—indicate that the institutional setup of Swedish water councils is essential for successful participation [63]. This includes a strong commitment to both the scope and the objectives of the project, the allocation of sufficient resources for the implementation of the planned activities, and the flexible representation of relevant stakeholders. Other factors influencing this work include the leadership of the process, goal-orientation, and the stakeholders who are involved and who contribute with their local knowledge [63]. As opposed to the Danish water councils, the Swedish water councils do not have any legal responsibilities in the Swedish water planning process. The Swedish water councils have mainly been involved in the dissemination of information, dialogues, and discussions, and have a minimum degree of active involvement. This might explain why the research studies of water councils in Sweden have focused on process and social learning output [62,63]. It has been argued that the experiences with the Swedish bottom-up councils show that when public participation is only a bottom-up process and there is no clear structure on how information is distributed further up the system (and therefore local knowledge is not integrated in the PoMs and in the end RBMPs), the effect of the participation is not clear. At the same time, the Danish experiences show that bottom-up processes need top-down human and monetary resources to be effective and to secure integration.
Other comparable experiments with active involvement can be found in the United Kingdom. The Catchment Based Approach (CaBA) was implemented in 2011 (during the second cycle of the UK’s RBMPs) [82]. Evaluation findings from the initial pilot stage and the second phase of this approach indicate that the development phase of CaBA was a success, particularly with respect to its collaborative planning activities and stakeholder engagement [83,84]. We did not find any direct evaluation studies on the cost-effectiveness of the CaBA approach in the UK, probably because this concept is still relatively new. Because of the differences in implementation strategies, scopes, and types of active stakeholder involvement, as well as outputs of the participatory processes across the EU, there is a need for empirical evidence regarding the cost-effectiveness of the various collaborative processes. The UK case with the CaBA implementation shows that without top-down resources, it is up to voluntary actions to deliver results, with mixed results as a consequence.
The Danish water councils had elements of the bottom-up approach in the framework. The municipalities and water councils were given flexibility in the process and could, for example, decide between them how they would develop the PoMs. This autonomy, with minimum interference from the central government, explains some of the success of the water council process, because stakeholders felt involved [65,85]. Other elements with a positive influence on the output of the work of the Danish water councils are the well-defined framework, money and resources allocated, and the brief given to the water councils. The tight timeframe for the water councils’ work (six months) was seen as both limiting and enabling of the progress of the councils. With a fixed timeframe, things get done, but it takes time for participation to institutionalize [86]. In addition, the fact that there was a broad desire among stakeholders to be involved aligned expectations and acceptance of the task, and the clear role of the municipalities as professional facilitators and the prospect of water councillors being able to influence the decisions were all important for the positive influence of the council work. The use of water councils as an active involvement strategy in implementing the WFD has proven useful to a certain degree in a Danish setting. The question is whether this concept can be transferred to other regions outside of Denmark and be valid in other water planning contexts besides the improvement of the physical condition of the streams. In years to come, the water councils in Denmark are also supposed to deal with other issues in the implementation of the WFD (e.g., nonpoint source pollution from agriculture, restoration of wetlands, etc.). These issues are much more complex and controversial than dealing with the physical conditions of the streams. However, perhaps it has been fortunate that the water councils in the first round only had to deal with the physical conditions, and in this way learn to engage with each other before more controversial issues are on the table. It is questionable whether the Danish water council concept could be transposed in its entirety to another EU member state, but key learnings from the Danish case suggest that for active involvement to be effective, governance needs both bottom-up and top-down structures. The authorities should empower local stakeholders and make room for self-organisation, but the local stakeholders need the technical knowledge and resources from authorities for co-creation to happen.
Initially, the Nature Agency did not have any plans for continuing the water councils after their six months of work, and the plan was that they would not meet again until the third generation of RBMPs (2021–2027) in 2018 [85]. However, in spring 2016, the minister of agriculture and environment announced that the water councils were to meet again in the new year of 2017 to look at designated streams. This is evidence that water councils may also be a key part of water planning at national, regional, and local levels in the future.

7. Conclusions

Water planning in Denmark has previously been characterised by a top-down, general regulatory approach. With the introduction of water councils in the public participation process, local knowledge was used to propose measures. The findings suggest that the use of water councils with their public participation in Danish water planning delivers some advantages. One benefit is that the involvement of relevant stakeholders increases the likelihood of measures being implemented; in most cases, this also increases cost-effectiveness. Additionally, knowledge of local conditions has been used to focus efforts and has aided the tendency towards using cheaper measures. In summary, this means that the length of stream that could be restored to reach the environmental objective has been more than doubled for the same amount of money. Without the involvement of the water councils, it is likely that the measures implemented would have been relatively close to the plan proposed by the Nature Agency. As we have demonstrated, it is useful to examine the decision-making process at the local level, to work within an allocated budget, and to apply well-defined environmental objectives. The economic framework of the water councils’ work has been well-defined in terms of costs per measure, and the allocated budget has also meant that the focus has been on cost-effectiveness and not on who is paying. The water councils have not exceeded the economic frame, and the proposed measures have had a higher than expected effect (i.e., more measures will result in the restoration of a larger percentage of the watercourses, which will likely result in a proportional ecological improvement). Since the water councils have been realistic in terms of the measures they have chosen, all of the measures have been included in the central government’s RBMPs. The analysis here demonstrates that using only investment per km—as opposed to the full costs (including maintenance and administrative costs)—has not given rise to less optimal solutions. The reason for this is mainly that the most expensive measures, with the highest investment costs and the highest administrative costs, have only been chosen in a few cases anyway. The four measures (laying out coarse material, tree planting, re-meandering of streams, and replacing the stream base material) were chosen by the water councils in 90% of the cases. This shows that the heterogeneity of the measures that were used was relative small. Some measures were included since they had side effects that covered nature and climate change mitigation effects. Although the process was short (six months), it was also effective. In fact, the process did not prolong the decision-making process, as one might have expected. Additionally, as the municipality or central government did not pay the invited members, the water councils’ administrative costs were relatively low.
As we have discussed, it has clearly helped that the focus has been on selected streams and not on the general water quality in the whole catchment, which is less tangible and hence would likely result in more conflicts. The overall frame was 700 million DKK (around 50 million DKK/year). In this paper, we show that a structured (top-down) public participation process is an effective way of involving stakeholders because resources are allocated to the process. The analysis shows that the local involvement of stakeholders delivers efficient results, and that knowledge of local conditions helps all to find efficient solutions. However, the policy design and institutional arrangement of the water council also creates boundary limitations, and the fixed frame did not allow room for including innovative solutions in the PoMs, for example integration of climate change concerns and nutrient management were never considered. In addition, the large-scale RBDs is a limiting factor that needs to be reconsidered in future water councils. It was only because of the opportunity for self-organisation that some water councils introduced local working groups where local knowledge could be harvested.
In conclusion, for public participation and active involvement to be effective, the process and structure need elements from both top-down and bottom-up planning. A clear framework with room for self-negotiation on certain elements can help member states develop effective RBMPs with knowledge integration for the stakeholders implementing the measures in the future. Some of the major challenges for the participatory process are to ensure progress and to make decisions that might be considered unfavourable for some council members. Consequently, the key objective in future water planning that involves stakeholders should focus on trying to form a bridge between both ensuring that local knowledge is included through bottom-up processes and a top-down integration and coherence in policy-making on securing the objective of good ecological status.

Acknowledgments

This article was written as part of a PhD study at the Department of Agroecology, Aarhus University, Denmark. The study was co-funded by the DNMARK strategic research alliance (http://dnmark.org), supported by the Danish Council for Strategic Research (Ref. 12-132421). Sincere thanks to the water council members and the Nature Agency for providing informative data and discussions for this study. The first author would also like to thank river keeper emeritus Bent Lauge Madsen for valuable discussions on Danish water planning and the use of stream restoration measures.

Author Contributions

Morten Graversgaard designed the study; Morten Graversgaard performed the research; Morten Graversgaard and Brian H. Jacobsen analysed the data; Brian H. Jacobsen, Chris Kjeldsen and Tommy Dalgaard provided information and advice; all authors reviewed and discussed the results. Morten Graversgaard took the lead and wrote the manuscript.

Conflicts of Interest

The authors declare no conflict of interest. The funding sponsors had no role in the design of the study; in the collection, analyses, or interpretation of data; in the writing of the manuscript, or in the decision to publish the results.

Appendix A

Table A1. List of participating organizations and associations.
OrganizationType of OrganizationsScale of Work
Landøkonomisk SelskabAgricultural associationRegional
Nordsjællands LandboforeningAgricultural associationLocal
Fredensborg VandløbslaugDrainage and agricultural interestsLocal
Gribskov VandløbslaugDrainage interestsLocal
Esrum Å-laugAngler associationLocal
Farum Naturparks VennerNature conservationLocal
Kastrup-Tiset LandvindingslagDrainage interestsLocal
Varde Å SammenslutningenAngler associationLocal
FugleværnsfondenOrnithologist associationNational
Dansk Landbrug SydhavsøerneAgricultural associationRegional
Havelse ÅlaugDrainage and agricultural interestsLocal
Holbæk ÅlavDrainage and agricultural interestsLocal
Vandløbslaug for Værebro ÅDrainage and agricultural interestsLocal
Vandløbslav for Roskilde KommuneDrainage and agricultural interestsLocal
Værløse NaturgruppeNature conservationLocal
DI HovedstadenIndustryNational
Landbrug og FødevarerAgricultural associationNational
Bæredygtigt LandbrugAgricultural associationNational
Dansk SkovforeningForestry associationNational
Odderbæk VandløbslaugDrainage and agricultural interestsLocal
Økologisk LandsforeningOrganic agricultural associationNational
Vestjysk LandboforeningAgricultural associationRegional
Dansk AmatørfiskerforeningAngler associationNational
Herning SportsfiskerforeningAngler associationLocal
FriluftsrådetRecreational (Danish outdoor council)National
Danske KloakmestreSewerage associationNational
Dansk AkvakulturDanish aquaculture farming businessNational
Danske VandløbDrainage and agricultural interestsNational
Foreningen til bevarelse af Tange SøDrainage and agricultural interestsLocal
Vandløbslauget for Alling ÅDrainage and agricultural interestsLocal
Vandløbslauget GSTDrainage and agricultural interestsLocal
Randers SportsfiskerforeningAngler associationLocal
Tønder roklubRecreational (rowing club)Local
DOFOrnithologist associationNational
FVDWater supply associationNational
Syd-Østsjællands LandboforeningAgricultural associationRegional
GefionAgricultural associationRegional
Amagerlandets ProducentforeningDrainage and agricultural interestsLocal
Bestyrelsen for Vallensbæk Moses PumpelagDrainage associationLocal
Køge Sports- og Stevns LystfiskerforeningerAngler associationLocal
Tryggevælde- og Stevns Ådals BevarelseNature conservationLocal
I/S Vandsamarbejdet GreveWater supply associationLocal
LandboNordAgricultural associationRegional
Familielandbruget MidtjyllandAgricultural associationRegional
Haslevgaard ålaugDrainage and agricultural interestsLocal
Nordøstvendsyssels ålaugDrainage and agricultural interestsLocal
Dansk land og strandjagtHunting associationNational
Liver å LystfiskerforeningAngler associationLocal
Dansk kano og kajakforbundRecreational (Danish Canoe and Kayak Federation)National
Sjællandske FamiliebrugAgricultural associationRegional
Odsherred LandboforeningAgricultural associationRegional
Andaks og Istebjerggrøftens ålaug/Tranemose ÅlaugDrainage and agricultural interestsLocal
Halleby å sammenslutningenAngler associationLocal
Oplandsrådet for Norsminde FjordDrainage and agricultural interestsLocal
Djursland LandboforeningAgricultural associationRegional
Korup ÅlaugDrainage and agricultural interestsLocal
Vandløbslauget Stensmark Bæk og SaltbækDrainage and agricultural interestsLocal
Østjydsk FamilielandbrugAgricultural associationRegional
Vandløbslaug ved Ryom ÅDrainage and agricultural interestsLocal
Sportsfiskerforeningen for Grenaa og OmegnAngler associationLocal
Landsforeningen Levende HavNature conservation (fishery)Regional
Syddjurs vandrådWater supply associationLocal
BornholmslandbrugAgricultural associationRegional
Vandpleje BornholmAngler associationRegional
Bornholms SportsfiskerforeningAngler associationLocal
Dansk Landbrug Midt-ØstjyllandAgricultural associationRegional
Langaa SportsfiskerforeningAngler associationLocal
Foreningen til nedlæggelsen af Tange SøNature conservationLocal
Vandrådet i Favrskov KommuneWater supply associationLocal
Uldum Kær NaturlaugDrainage and agricultural interestsLocal
CentroviceAgricultural associationRegional
Nyborg VandløbslaugDrainage and agricultural interestsLocal
Fyns FamilielandbrugAgricultural associationLocal
Langeland VandløbslaugDrainage and agricultural interestsLocal
Kerteminde Forsyning A/SWater supply associationLocal
Gråsten Nor I/SDrainage and agricultural interestsLocal
Kerteminde vandløbslaugDrainage and agricultural interestsLocal
Svendborg vandløbslaugDrainage and agricultural interestsLocal
Odense Bys MuseerRecreation (museum association)Local
IDA-Fyn-BYGIndustryRegional
Assens VandløbslaugDrainage and agricultural interestsLocal
Faaborg-Midtfyn VandløbslaugDrainage and agricultural interestsLocal
Nordfyns VandløbslaugDrainage and agricultural interestsLocal
Odense VandløbslaugDrainage and agricultural interestsLocal
Patriotisk SelskabAgricultural associationRegional
Ærø SportsfiskerforeningAngler associationLocal
DANVAWater supply and wastewater associationNational
Dansk MiljøteknologiIndustryNational
Familielandbruget VestjyllandAgricultural associationRegional
Herning Ikast Landboforening,Agricultural associationRegional
Holstebro Struer LandboforeningAgricultural associationRegional
Agri NordAgricultural associationRegional
DNNature ConservationNational
Lemvigegnens LandboforeningAgricultural associationRegional
Løgstør SportsfiskerforeningAngler associationLocal
Skalsådalens SportsfiskerforeningAngler associationLocal
Aalestrup LystfiskerforeningAngler associationLocal
Aulum sportsfiskerforeningAngler associationLocal
Talerøret for Skive-Karup ÅDrainage and agricultural interestsLocal
Centralforeningen for LimfjordenFishery associationRegional
Fjordvenner .dkNature conservationRegional
Bibæk VandløbslaugDrainage and agricultural interestsLocal
Sønderjyske VandløbDrainage and agricultural interestsRegional
Danmarks JægerforbundHunter associationNational
Ferskvandsfiskeriforeningen for DanmarkFishery associationNational
Ravsted og omegns vandløbslaug (tsunamigruppen)Drainage and agricultural interestsLocal
Sportsfiskerforeningen VidåAngler associationLocal
Danmarks SportsfiskerforeningAngler associationNational

Appendix B

Figure A1. RBD framework requirements relative to water council proposals in the RBMPs 2015–2021 (number of obstacles to be removed and number of ochre-removal basins to be established (pcs.)). The RBD framework compared with the suggested measures from the water council process. The PoM proposal is almost similar to the suggestions made by the water councils.
Water 09 00191 g005

Appendix C

Table A2. Overview of the restoration measures proposed in all 23 RBDs, showing the number of km or pcs of streams, the associated costs and % of total km.
Restoration MeasuresWater Council Proposed Measures (km/pcs. a).% of Total km Based Measures UsedWater Council Proposed Measures and Their Investment Costs (Excl. Adm. and Maintenance Expenses) (Mill. €/km. or pcs.)% of Total Investment Costs km Based Measures
Smaller restoration measures
Laying out coarse material7284020.129
Laying out coarse material + tree planting10863.96
Raising the river bottom7744.97
Tree planting along streams320182.84
Total smaller restoration measures12336831.746
Major restorations
Restoration of entire river valleys2415.78
Re-meandering of streams1941116.123
Re-meandering of streams b200.61
Replacing the stream base material312174.97
Opening piped watercourse sections c1712.13
Opening piped watercourse sections d901.12
Opening piped watercourse sections e100.30
Establishment of mini river valleys1614.87
Establishing double profile in stream1112.33
Total major restorations5863237.954
Total km based measures182010069.6100
Other measures
Removal of obstacles (Ob)222-12-
Sand traps (ST)266-1.7-
Ochre-removal basins (ORB)42-11.9-
Total other measures228Ob, 266ST, 43ORB-25.6-
Total all measures1820km, 228Ob, 266ST, 43 ORB-95.2-
Notes: a For sand traps, obstacles, and ochre-removal basins, costs are calculated per. pcs. b Combination with preventive measures (dikes etc.). c With subsequent elevation of the river bottom and/or restoration and re-meandering. d Without subsequent elevation of the river bottom or re-meandering but with smaller restorations. e With subsequent establishment of mini river valleys with re-meandering.

References

  1. Stoate, C.; Boatman, N.D.; Borralho, R.; Rio Carvalho, C.; de Snoo, G.; Eden, P. Ecological impacts of arable intensification in Europe. J. Environ. Manag. 2001, 63, 337–365. [Google Scholar] [CrossRef]
  2. Nienhuis, P.H.; Leuven, R.S.E.W. River restoration and flood protection: Controversy or synergism? Hydrobiologia 2001, 444, 85–99. [Google Scholar] [CrossRef]
  3. Gregory, K.J. The human role in changing river channels. Geomorphology 2006, 79, 172–191. [Google Scholar] [CrossRef]
  4. Kristensen, P.; Werner, B.; Christiansen, T.; Collins, R.; Belchior, C.; Jacobsen, B.; Solheim, A.L.; Austnes, K.; Kodeš, V.; Semaradova, S.; et al. European Waters—Assessment of Status and Pressures; EEA Report No. 8/2012; EEA: Copenhagen, Denmark, 2012. [Google Scholar]
  5. European Commission. River Basin Management Plans; Report from the Commission to the European Parliament and the Council on the Implementation of the Water Framework Directive; European Commission: Brussels, Belgium, 2012. [Google Scholar]
  6. Danish Nature Agency. Basisanalyse for Vandområdeplanerne 2015–2021; Overfladevandet og Grundvandets Karakteristika; Påvirkning og Arealanvendelse; Tilstand og Vurdering; (Characteristics of Surface Water and Groundwater for the 2. Generation (2015–2021) of River Basin Management Plans); Environmental Ministry Danish Nature Agency: Copenhagen, Denmark, 2014. [Google Scholar]
  7. European Commission. Economics and the Environment: The Implementation Challenge of the Water Framework Directive; A guidance document (WATECO) 7; European Commission: Brussels, Belgium, 2003. [Google Scholar]
  8. Berbel, J.; Martin-Ortega, J.; Mesa, P. A Cost-Effectiveness Analysis of Water-Saving Measures for the Water Framework Directive: The Case of the Guadalquivir River Basin in Southern Spain. Water Resour. Manag. 2011, 25, 623–640. [Google Scholar] [CrossRef]
  9. Ministry of Food and Environment of Denmark. Retningslinjer for Udarbejdelse af Vandområdeplaner 2015–2021. Intern Arbejdsinstruks, SVANA, 2016. Available online: http://svana.dk/media/203204/retningslinjer-vp2-22_12_2014.pdf (accessed on 3 March 2017).
  10. Dalgaard, T.; Hansen, B.; Hasler, B.; Hertel, O.; Hutchings, N.J.; Jacobsen, B.H.; Jensen, L.S.; Kronvang, B.; Olesen, J.E.; Schjørring, J.K.; et al. Policies for agricultural nitrogen management—Trends, challenges and prospects for improved efficiency in Denmark. Environ. Res. Lett. 2014, 9, 11. [Google Scholar] [CrossRef]
  11. Thorsøe, M.H.; Graversgaard, M.; Noe, N. The challenge of legitimizing spatially differentiated regulation: Experiences from the implementation of the Danish Buffer zone act. Land Use Policy 2017, 62, 202–212. [Google Scholar] [CrossRef]
  12. Wright, S.; Jacobsen, B.H. Combining Active Farmer Involvement with detailed Farm Data in Denmark: A Promising Method for Achieving Water Framework Directive targets? Water Sci. Technol. 2010, 61, 2625–2633. [Google Scholar] [CrossRef] [PubMed]
  13. Wright, S.; Jacobsen, B.H. Participation in the implementation of the Water Framework Directive in Denmark: The prospects for active involvement. Water Policy 2011, 13, 232–249. [Google Scholar] [CrossRef]
  14. Commission on Nature and Agriculture. Richer Nature, New Environmental Regulation and New Growth Opportunities for Agriculture. Executive Summary. The Danish Commission on Nature and Agriculture, 2013. Available online: www.naturoglandbrug.dk (accessed on 3 March 2017).
  15. Graversgaard, M.; Gertz, F.; Wiborg, I.A.; Kjeldsen, C.; Dalgaard, T. Vandråd—et nybrud i dansk vandforvaltning. (Water councils—A new starting point in Danish water management). Vand Jord. 2015, 22, 1. (In Danish) [Google Scholar]
  16. Jacobsen, B.H.; Tegner, H.; Baaner, L. Implementing the Water Framework Directive in Denmark—Lessons on agricultural measures from a legal and regulatory perspective. Land Use Policy. submitted.
  17. European Union. Common Implementation Strategy for the Water Framework Directive (2000/60/EC); Guidance Document No. 8; Public Participation in Relation to the Water Framework Directive; Produced by Working Group 2.9; European Commission: Brussels, Belgium, 2003. [Google Scholar]
  18. Boeuf, B.; Fritsch, O. Studying the implementation of the Water Framework Directive in Europe: A meta-analysis of 89 journal articles. Ecol. Soc. 2016, 21, 19. [Google Scholar] [CrossRef]
  19. Kallis, G.; Butler, D. The EU water framework directive: Measures and implications. Water Policy 2001, 3, 125–142. [Google Scholar] [CrossRef]
  20. Kaika, M. The Water Framework Directive: A New Directive for a Changing Social, Political and Economic European Framework. Eur. Plan. Stud. 2003, 11, 299–316. [Google Scholar] [CrossRef]
  21. Mostert, E. The European Water Framework Directive and water management research. Phys. Chem. Earth 2003, 28, 523–527. [Google Scholar] [CrossRef]
  22. Hering, D.; Borja, A.; Carstens, J.; Carvalho, L.; Elliott, M.; Feld, C.K.; Heiskanen, A.S.; Johnson, R.; Moe, J.; Pont, D.; et al. The European Water Framework Directive at the age of 10: A critical review of the achievements with recommendations for the future. Sci. Total Environ. 2010, 408, 4007–4019. [Google Scholar] [CrossRef] [PubMed] [Green Version]
  23. Page, B.; Kaika, M. The EU Water Framework Directive: Part 2. Policy innovation and the shifting choreography of governance. Eur. Environ. 2003, 13, 328–343. [Google Scholar] [CrossRef]
  24. Moss, T. The governance of land use in river basins: Prospects for overcoming problems of institutional interplay with the EU Water Framework Directive. Land Use Policy 2004, 21, 85–94. [Google Scholar] [CrossRef]
  25. Kastens, B.; Newig, J. Will participation foster the successful implementation of the water framework directive? The case of agricultural groundwater protection in northwest Germany. Local Environ. Int. J. Justice Sustain. 2008, 13, 27–41. [Google Scholar] [CrossRef]
  26. Rault, P.A.K.; Jeffrey, P.J. Deconstructing public participation in the Water Framework Directive: Implementation and compliance with the letter or with the spirit of the law? Water Environ. J. 2008, 22, 241–249. [Google Scholar] [CrossRef]
  27. De Stefano, L. Facing the water framework directive challenges: A baseline of stakeholder participation in the European Union. J. Environ. Manag. 2010, 91, 1332–1340. [Google Scholar] [CrossRef] [PubMed]
  28. Meijerink, S.; Wiering, M. River Basin Management in Europe: The ‘Up- and Downloading’ of a New Policy Discourse. In The Disoriented State: Shifts in Governmentality, Territoriality and Governance; Arts, B., van Houtum, H.J., Eds.; Springer Science: Dordrecht, The Netherlands, 2009; pp. 181–200. [Google Scholar]
  29. Steyaert, P.; Ollivier, G. The European Water Framework Directive: How ecological assumptions frame technical and social change. Ecol. Soc. 2007, 12, 25. Available online: http://www.ecologyandsociety.org/vol12/iss1/art25/ (accessed on 3 March 2017). [Google Scholar] [CrossRef]
  30. Ballester, A.; Lacroix, K.E.M. Public Participation in Water Planning in the Ebro River Basin (Spain) and Tucson Basin (U.S., Arizona): Impact on Water Policy and Adaptive Capacity Building. Water 2016, 8, 273. [Google Scholar] [CrossRef]
  31. Kochskämper, E.; Challies, E.; Newig, J.; Jager, N.W. Participation for effective environmental governance? Evidence from Water Framework Directive implementation in Germany, Spain and the United Kingdom. J. Environ. Manag. 2016, 181, 737–748. [Google Scholar] [CrossRef] [PubMed]
  32. Benson, D.; Fritsch, O.; Cook, H.; Schmid, M. Evaluating participation in WFD river basin management in England and Wales: Processes, communities, outputs and outcomes. Land Use Policy 2014, 38, 213–222. [Google Scholar] [CrossRef]
  33. Innes, J.E.; Booher, D.E. Consensus building and complex adaptive systems. J. Am. Plan. Assoc. 1999, 65, 412–423. [Google Scholar] [CrossRef]
  34. Brody, S.D. , Measuring the Effects of Stakeholder Participation on the Quality of Local Plans Based on the Principles of Collaborative Ecosystem Management. J. Plan. Educ. Res. 2003, 22, 407–419. [Google Scholar] [CrossRef]
  35. Armitage, D. Adaptive Capacity and Community-Based Natural Resource Management. Environ. Manag. 2005, 35, 703–715. [Google Scholar] [CrossRef] [PubMed]
  36. Newig, J.; Pahl-Wostl, C.; Sigel, K. The Role of Public Participation in Managing Uncertainty in the Implementation of the Water Framework Directive. Eur. Environ. 2005, 15, 333–343. [Google Scholar] [CrossRef]
  37. Carter, J.; Howe, J. Stakeholder participation and the water framework directive: The case of the Ribble Pilot. Local Environ. Int. J. Justice Sustain. 2006, 11, 217–231. [Google Scholar] [CrossRef]
  38. Jonsson, A.C.; Andersson, L.; Olsson, J.A.; Johansson, M. Defining goals in participatory water management: Merging local visions and expert judgements. J. Environ. Plan. Manag. 2011, 54, 909–935. [Google Scholar] [CrossRef]
  39. Fritsch, O.; Newig, J. Participatory governance and sustainability: Findings of a meta-analysis of stakeholder involvement in environmental decision making. In Reflexive Governance for Global Public Goods; Brousseau, E., Dedeurwaerdere, T., Siebenhüner, B., Eds.; MIT Press: Cambridge, MA, USA, 2012; pp. 181–204. [Google Scholar]
  40. Drazkiewicz, A.; Challies, E.; Newig, J. Public participation and local environmental planning: Testing factors influencing decision quality and implementation in four case studies from Germany. Land Use Policy 2015, 46, 211–222. [Google Scholar] [CrossRef]
  41. Koontz, T.M.; Newig, J. Cross-level information and influence in mandated participatory planning: Alternative pathways to sustainable water management in Germany’s implementation of the EU Water Framework Directive. Land Use Policy 2014, 38, 594–604. [Google Scholar] [CrossRef]
  42. Lee, M.; Abbot, C. The Usual Suspects? Public Participation under the Aarhus Convention. Mod. Law Rev. 2003, 66, 80–108. [Google Scholar] [CrossRef]
  43. Koontz, T.; Thomas, C. What Do We Know and Need to Know about the Environmental Outcomes of Collaborative Management? Public Adm. Rev. 2006, 66, 111–121. [Google Scholar] [CrossRef]
  44. Blackstock, K.L.; Richard, C. Evaluating stakeholder involvement in river basin planning: A Scottish case study. Water Policy 2007, 9, 493–512. [Google Scholar] [CrossRef]
  45. Howarth, W. Aspirations and Realities under the Water Framework Directive: Proceduralisation, participation and Practicalities. J. Environ. Law 2009, 21, 1–27. [Google Scholar] [CrossRef]
  46. Carr, G.; Blöschl, G.; Loucks, D.P. Evaluating participation in water resource management: A review. Water Resour. Res. 2012, 48. [Google Scholar] [CrossRef]
  47. Young, C.Y.; Jordan, A.; Searle, K.R.; Butler, A.; Chapman, D.S.; Simmons, P.; Watt, A.D. Does stakeholder involvement really benefit biodiversity conservation? Biol. Conserv. 2013, 158, 359–370. [Google Scholar] [CrossRef] [Green Version]
  48. Newig, J.; Koontz, T.M. Mulit-level governance, policy implementation and participation: The EU’s mandated participatory planning approach to implementing environmental policy. J. Eur. Public Policy 2014, 21, 248–267. [Google Scholar] [CrossRef]
  49. Liefferink, D.; Wiering, M.; Uitenboogaart, Y. The EU Water Framework Directive: A multi-dimensional analysis of implementation and domestic impact. Land Use Policy 2011, 28, 712–722. [Google Scholar] [CrossRef]
  50. Bourblanc, M.; Crabbé, A.; Liefferink, D.; Wiering, M. The marathon of the hare and the tortoise: Implementing the EU Water Framework Directive. J. Environ. Plan. Manag. 2013, 56, 1449–1467. [Google Scholar] [CrossRef]
  51. Nielsen, H.Ø.; Frederiksen, P.; Saarikoski, H.; Rytkönen, A.; Pedersen, A.B. How different institutional arrangements promote integrated river basin management. Evidence from the Baltic Sea Region. Land Use Policy 2013, 30, 437–445. [Google Scholar] [CrossRef]
  52. Jager, N.W.; Challies, E.; Kochskämper, E.; Newig, J.; Benson, D.; Blackstock, K.; Collins, K.; Ernst, A.; Evers, M.; Feichtinger, J.; et al. Transforming European Water Governance? Participation and River Basin Management under the EU Water Framework Directive in 13 Member States. Water 2016, 8, 156. [Google Scholar] [CrossRef]
  53. Petersen, T.; Klauer, B.; Manstetten, R. The environment as a challange for governmental responsibility—The case of the Water Framework Directive. Ecol. Econ. 2009, 68, 2058–2065. [Google Scholar] [CrossRef]
  54. Uitenboogaart, Y.J.; Kempen, J.J.H.; van Rijswick, H.F.M.W.; van Wiering, M.A. The Implementation of the WFD in the Netherlands. The Meuse River Basin District and the Dommel Catchment. In Dealing with Complexity and Policy Discretion. A Comparison of the Implementation Process of the European Water Framework Directive in Five Member states; SDU Uitgevers: Den Haag, The Netherlands, 2009; pp. 57–83. [Google Scholar]
  55. Gertz, F.; Knudsen, L.; Wiborg, I. Problematisk dansk implementering. (Problematic Danish implementation). Vand Jord. 2012, 3, 100–103. (In Danish) [Google Scholar]
  56. Danish Nature Agency. Vandplaner Med fem Vandveje. [Homepage of Naturstyrelsen, 2013. Available online: http://naturstyrelsen.dk/nyheder/2013/maj/vandplanermedfemvandveje/ (accessed on 3 March 2017).
  57. Folketinget. FT nr. 1606, Lov om Vandplanlægning. LOV nr 1606 af 26/12/2013. Available online: https://www.retsinformation.dk/forms/r0710.aspx?id=161126 (accessed on 3 March 2017).
  58. Danish Nature Agency. Vejledning om Arbejdet Med Forslag Til Indsatsprogram for Vandløbsindsatsen. 2014, p. 5. Available online: http://svana.dk/media/nst/8439930/vejledning.pdf (accessed on 3 March 2017).
  59. Boeuf, B.; Fritsch, O.; Martin-Ortega, J. Undermining European Environmental Policy Goals? The EU Water Framework Directive and the Politics of Exemptions. Water 2016, 8, 388. [Google Scholar] [CrossRef]
  60. Irvine, K.; O’Brien, S. Progress on stakeholder participation in the implementation of the Water Framework Directive in the Republic of Ireland. Biol. Environ. Proc. R. Irish Acad. 2009, 109b, 365–376. [Google Scholar] [CrossRef]
  61. Lamers, M.; Ottow, B.; Francois, G.; von Korff, Y. Beyond dry feet? Experiences from a participatory water-management planning case in The Netherlands. Ecol. Soc. 2010, 15, 14. [Google Scholar] [CrossRef]
  62. Lundmark, C.; Jonsson, G. Prospects for learning in river management: Exploring the initial implementation of the Water Framework Directive in a Swedish river basin. Environ. Educ. Res. 2014, 20, 161–176. [Google Scholar] [CrossRef]
  63. Franzén, F.; Hammer, M.; Balfors, B. Institutional development for stakeholder participation in local water management—An analysis of two Swedish catchments. Land Use Policy 2015, 43, 317–327. [Google Scholar] [CrossRef]
  64. Kampa, E.; Kranz, N.; Hansen, W. Public Participation in River Basin Management in Germany. From Borders to Natural Boundaries. In HarmoniCOP/WP 4; Ecologic—Institute for International and European Environmental Policy: Berlin, Germany, 2003. [Google Scholar]
  65. Graversgaard, M.; Thorsøe, M.H.; Kjeldsen, C.; Dalgaard, T. Evaluating public participation in Denmark’s water councils: How policy design and boundary judgements affect water governance! Outlook Agric. 2016, 45, 225–230. [Google Scholar] [CrossRef]
  66. Danish Nature Agency. Fordeling af Vandløbsindsatsen Samt Økonomisk Ramme, 2015–2021. 2014. Available online: http://naturstyrelsen.dk/media/nst/8433205/kort.pdf (accessed on 3 March 2017).
  67. Sabatier, P.A.; Focht, W.; Lubell, M.; Trachtenberg, Z.; Vedlitz, A.; Matlock, M. Collaborative approaches to watershed management. In Swimming Upstream: Collaborative Approaches to Watershed Management; Sabatier, P.A., Focht, W., Lubell, M., Trachtenberg, Z., Vedlitz, A., Matlock, M., Eds.; MIT Press: Cambridge, MA, USA, 2005; pp. 3–21. [Google Scholar]
  68. Innes, J.E.; Booher, D.E. Planning with Complexity—An Introduction to Collaborative Rationality for Public Policy; Routledge: New York, NY, USA, 2010. [Google Scholar]
  69. Kristensen, E.A.; Jepsen, N.; Nielsen, J.; Koed, A. Virkemidler til Forbedring af de Fysiske Forhold i Vandløb; DCE—Nationalt Center for Miljø og Energi—Videnskabelig Rapport fra DCE—Nationalt Center for Miljø og Energi; Aarhus Universitet: Aarhus, Denmark, 2013; Volume 86, Available online: http://dce2.au.dk/pub/SR86.pdf (accessed on 3 March 2017).
  70. European Union. European Union. Common Implementation Strategy for the Water Framework Directive (2000/60/EC). In Economics and Environment and the Implementation Challenge of the WFD European Commission; Guidance Document No. 1; European Union: Luxembourg, 2003. [Google Scholar]
  71. Balana, B.B.; Vinten, A.; Slee, B. A review on cost-effectiveness analysis of agri-environmental measures related to the EU WFD: Key issues, methods, and applications. Ecol. Econ. 2011, 70, 1021–1031. [Google Scholar] [CrossRef]
  72. Baatrup-Pedersen, A.; Riis, T. Impacts of different weed cutting practices on macrophyte species diversity and composition in a Danish stream. River Res. Appl. 2004, 20, 103–114. [Google Scholar] [CrossRef]
  73. Baattrup-Pedersen, A.; Holm, P.E.; Jensen, P.N.; Larsen, T.; Ovesen, N.B.; Pedersen, M.L.; Sand-Jensen, K.; Styczen, M. Faglig Udredning om Grødeskæring i Vandløb; DCE—Nationalt Center for Miljø og Energi, 106 s.—Videnskabelig Rapport fra DCE—Nationalt Center for Miljø og Energi; Aarhus Universitet: Aarhus, Denmark; Available online: http://dce2.au.dk/pub/SR188.pdf (accessed on 3 March 2017).
  74. Jacobsen, B.H. Beregning af vandløbsvirkemidlers omkostningseffektivitet (Calculation of the cost-efficiency of measures used when managing streams). In Note for the Danish Nature Agency; Memo. 2014/8.; Department of Food and Resource Economics, University of Copenhagen: Copenhagen, Denmark, 2014. [Google Scholar]
  75. Jacobsen, B.H. In Search of Cost-Effective Measures; IFRO Report, No. 191; Institute of Food and Resource Economics, Copenhagen University: Copenhagen, Denmark, 2007. [Google Scholar]
  76. Danish Nature Agency. Vandrådspakken Notat om Virkemiddelkatalog for Vandløb. 2014. Available online: http://naturstyrelsen.dk/media/nst/8437103/virkemiddelkatalog.pdf (accessed on 3 March 2017).
  77. Jacobsen, B.H. Analyse af Landbrugets Omkostninger ved Implementering af Vandplanerne fra 2011 (Analysis of the Agricultural Costs When Implementing the RBMP from 2011); Memo. 2012/6; Department of Food and Resource Economics, University of Copenhagen: Copenhagen, Denmark, 2012. [Google Scholar]
  78. Fabricius, K.; Danish Nature Agency, Randbøl, Denmark. Personal communication, 19 January 2016.
  79. Gadgil, M.; Olsson, P.; Berkes, F.; Folke, C. Exploring the role of local ecological knowledge in ecosystem management: Three case studies. In Navigating Social-Ecological System: Building Resilience for Complexity and Changes; Berkes, F., Colding, J., Folke, C., Eds.; Cambridge University Press: Cambridge, UK, 2003; pp. 189–209. [Google Scholar]
  80. Moss, T.; Newig, J. Multilevel Water Governance and Problems of Scale: Setting the Stage for a Broader Debate. Environ. Manag. 2010, 46, 1–6. [Google Scholar] [CrossRef] [PubMed]
  81. Van Lieshout, M.; Dewulf, A.; Aarts, N.; Termeer, C. The Power to Frame the Scale? Analysing Scalar Politics over, in and of a Deliberative Governance Process. J. Environ. Policy Plan. 2014, 1–24. [Google Scholar] [CrossRef]
  82. The Catchment Based Approach: Improving the Quality of Our Water Environment. 2013. Available online: https://www.gov.uk/government/publications/catchment-based-approach-improving-the-quality-of-our-water-environment (accessed on 3 March 2017).
  83. Evaluation of the Catchment Based Approach—Pilot Stage; Final Evaluation Report; Cascade Consulting: Manchester, UK, 2013.
  84. Rees, Y.; Kingsley-Rowe, D.; Cryle, P.; Conlan, K. Evaluation of the Catchment Based Approach: Phase 2; Final Report: WT1559; DEFRA: London, UK, 2015. [Google Scholar]
  85. Graversgaard, M. Evaluering af Vandrådsarbejdet; Udarbejdet for Naturstyrelsen, Morten Graversgaard: Copenhagen, Denmark, 2015. [Google Scholar]
  86. Reed, M. Stakeholder participation for environmental management: A literature review. Biol. Conserv. 2008, 141, 2417–2431. [Google Scholar] [CrossRef]
Figure 1. Overview of the 23 River Basin Districts (RBDs) and associated water councils established in 2014 in Denmark, showing the distribution of efforts to be achieved and the economic investment framework for each RBD and water council (for each RBD, the minimum effort is displayed after each RBD in km/number obstacles to be removed/possibly ochre-removal basins to be established/€ million (modified after [66]).
Water 09 00191 g001
Figure 2. Comparisons of two outputs: (1) the RBD framework requirements relative to the water councils/municipalities’ proposals (km stream, blue and green bars); and (2) the investment framework given to the water councils relative to the investments proposed in the RBMPs 2015–2021 (million DKK, red and grey symbols).
Water 09 00191 g002
Figure 3. Geographical distribution in the RBDs of the selected measures, based on investment.
Water 09 00191 g003
Figure 4. Geographical distribution and geographical differences between the RBDs and the chosen measures.
Water 09 00191 g004
Table 1. Presentation of the 16 stream restoration measures and their respective costs, modified after [66].
Restoration MeasuresCost (excl. Administrative and Maintenance Expenses) (€ per km) a
Type 1 stream (Width < 2 m)Type 2 Stream (Width 2–10 m)Type 3 Stream (Width > 10 m)
Smaller RestorationsLaying out coarse material (+tree planting)14,000 (24,000)42,000 (53,000)84,000 (97,000)
Raising the river bottom bed47,00080,00097,000
Tree planting along streams900090009000
Re-meandering of streams63,00093,000318,000
Major RestorationsRe-meandering of streams b218,000260,000742,000
Replacing the stream base material11,00019,00060,000
Establishment of mini river valleys250,000384,000-
Restoration of entire river valleys143,000257,000328,000
Establishing double profile in stream160,000218,000-
Opening piped watercourse sections c126,000 (63,000–190,000) 1947,000 (63,000–1,420,000) 1947,000 (473,000–1,420,000) 1
Opening piped watercourse sections d126,000 (63,000–190,000) 1947,000 (63,000–1,420,000) 1947,000 (473,000–1,420,000) 1
Opening piped watercourse sections e371,000 (185,000–556,000) 11,331,000 (185,000–1,996,000) 11,331,000 (665,000–1,996,000) 1
Removal of obstacles38,000 (13,000–80,000) 1147,000 (27,000–201,000) 1704,000 (352,000–1,055,000) 1
Other MeasuresEstablishment of sand traps300011,000-
Establishment of ochre-removal basins164,000390,000390,000
Notes: a For sand traps, obstacles and ochre-removal basins costs are calculated per. pcs. b Combination with preventive measures (dikes, etc.). c With subsequent elevation of the river bottom and/or restoration and re-meandering. d Without subsequent elevation of the river bottom or re-meandering, but with smaller restorations. e With subsequent establishment of mini river valleys with re-meandering. 1 These measures include a low- and high-cost estimate in addition to the estimated average price.
Table 2. Overview of the water council outputs, showing the differences between the minimum requirements formulated by the Nature Agency (non-participatory process) and the reported proposals for Programmes of Measures (PoMs) described in the draft River Basin Management Plans (RBMPs) from the water councils and in the final RBMPs, 2015–2021 (participatory process).
OutputsMinimum Requirements Prepared by the Nature AgencyInitial Water Council Proposals for PoMsFinal Water Council Proposals for PoMs (RBMPs 2015–2021)Water Council Index (PoM 2015/RBD 2014) **
Investments (Million €)939693100
Obstacles (No.)181222228125
Ochre-Removal Basins (No.)394243110
Length Streams (km)161536643800 *235
Notes: * There are measures allocated to 1820 km of stream, which is expected to deliver a total of 3800 km stream in good ecological status in 2021. ** The Water council index is calculated as the level included in the PoM from 2015 divided by the level in the original plans from 2014 multiplied by 100.
Table 3. Comparison of the investment costs and the annual costs of the selected measures (modified after [74]).
Measures (Stream Width 2 m a)Investment (Excl. Adm. and Maintenance Costs) (€/km/Year) bAnnual Costs (Excl. Adm. Costs). (€/km/Year) cAdm. Costs (€/km)
Low costsTree planting87002700
Replacing the stream base material10,700670***
Laying out coarse material13,8008004000–11,300
Medium costsRaising the river bottom47,20023300
Removal of obstacles38,20020005700–7000
Establishment of sand traps300027002100–2900
High costsRe-meandering of streams62,80043006700–11,000
Opening piped watercourse sections125,800870014,700–248,000
Establishment of mini river valleys249,00011,3000
Ochre-removal basins163,50012,000***
Restoration of entire river valleys142,7009700***
Notes: a Most Danish streams are below 2 m in width, which is why this stream width is used in the comparison. b Investment period is assumed to be 20 years. c For sand traps, obstacles and ochre-removal basins costs are calculated per unit. *** These measures do not include administrative costs, as few projects have been established and the costs vary greatly.

