Article

Spatiotemporal Distribution of Eutrophication in Lake Tai as Affected by Wind

1
Chinese Research Academy of Environmental Sciences, Beijing 100012, China
2
Department of Civil and Environmental Engineering, Old Dominion University, Norfolk, VA 23529, USA
*
Author to whom correspondence should be addressed.
Water 2017, 9(3), 200; https://doi.org/10.3390/w9030200
Submission received: 17 October 2016 / Revised: 1 March 2017 / Accepted: 3 March 2017 / Published: 10 March 2017
(This article belongs to the Special Issue Water-Soil-Vegetation Dynamic Interactions in Changing Climate)

Abstract

:
One common hypothesis is that wind can affect concentrations of nutrients (i.e., nitrogen and phosphorus) and chlorophyll-a (Chl-a) in shallow lakes. However, the tests of this hypothesis have yet to be conclusive in existing literature. The objective of this study was to use long-term data to examine how wind direction and wind speed affect the spatiotemporal variations of total nitrogen (TN), total phosphorus (TP) and Chl-a in Lake Tai, a typical shallow lake located in east China. The results indicated that the concentrations of nutrients and Chl-a tended to decrease from the northwest to the southeast of Lake Tai, with the highest concentrations in the two leeward bays (namely Meiliang Bay and Zhushan Bay) in the northwestern part of the lake. In addition to possible artificial reasons (e.g., wastewater discharge), the prevalent southeastward winds in warm seasons (i.e., spring and summer) and northwestward winds in cool seasons (i.e., fall and winter) might be the major natural factor for such a northwest-southeast decreasing spatial pattern. For the lake as a whole, the concentrations of TN, TP and Chl-a were highest for a wind speed between 2.1 and 3.2 m·s−1, which can be attributed to the idea that the wind-induced drifting and mixing effects might be dominant in the bays while the wind-induced drifting and resuspension effects could be more important in the other parts of the lake. Given that the water depth of the bays was relatively larger than that of the other parts, the drifting and mixing effects were likely dominant in the bays, as indicated by the negative relationships between the ratios of wind speed to lake depth, which can be a surrogate for the vertical distribution of wind-induced shear stress and the TN, TP and Chl-a concentration. Moreover, the decreasing temporal trend of wind speed in combination with the ongoing anthropogenic activities will likely increase the challenge for dealing with the eutrophication problem of Lake Tai.

1. Introduction

Lake eutrophication is a global environmental concern [1] because it can adversely affect ecosystem health and the quality of drinking water sources [2,3,4]. Herein, the profound reason for lake eutrophication is excessive input of nutrients (e.g., nitrogen and phosphorus) from human activities, while climate warming can exacerbate eutrophication and even trigger cyanobacterial bloom [5,6,7]. Because of a relatively small water depth and a large water surface area, shallow lakes are particularly susceptible to eutrophication-induced algal bloom and water quality degradation [8,9,10]. For a shallow lake, the wind-induced shear stress on the lake surface can be efficiently transferred downward through the shallow water column to the lakebed, resuspending bed sediments from which nutrients can be released into the ambient water [11,12,13,14,15,16]. The threshold shear stress, beyond which the resuspension of bed sediments will incept, depends on the physiochemical characteristics (e.g., texture, age and compaction) of the sediments [17,18].
In addition, the wind-induced shear stress can also stimulate water turbulence and flow currents, redistributing the released nutrients across the lake [19,20,21] and thus influencing the spatial distribution of aquatic organisms. For instance, wind could alter the spatial distribution of planktonic populations [22,23,24] and tends to concentrate cyanobacteria on the leeward side of a lake [25,26], which would otherwise float and aggregate on the surface of calm water. Further, there is a critical wind speed, below which cyanobacteria colonies tend to float and aggregate on the surface; once the critical wind speed is exceeded, however, the cyanobacteria colonies are usually redistributed across the vertical water column [27,28,29].
Given the importance of wind for concentrations of nutrients and Chl-a in shallow lakes, it is vital to understand their interrelations for better management and utilization of lake resources. However, such an understanding has been incomplete in existing literature [28]. The main objective of this study was therefore to use long-term field data to analyze how wind affects the spatiotemporal distribution of eutrophication in Lake Tai, a typical large shallow lake located in east China.

2. Materials and Methods
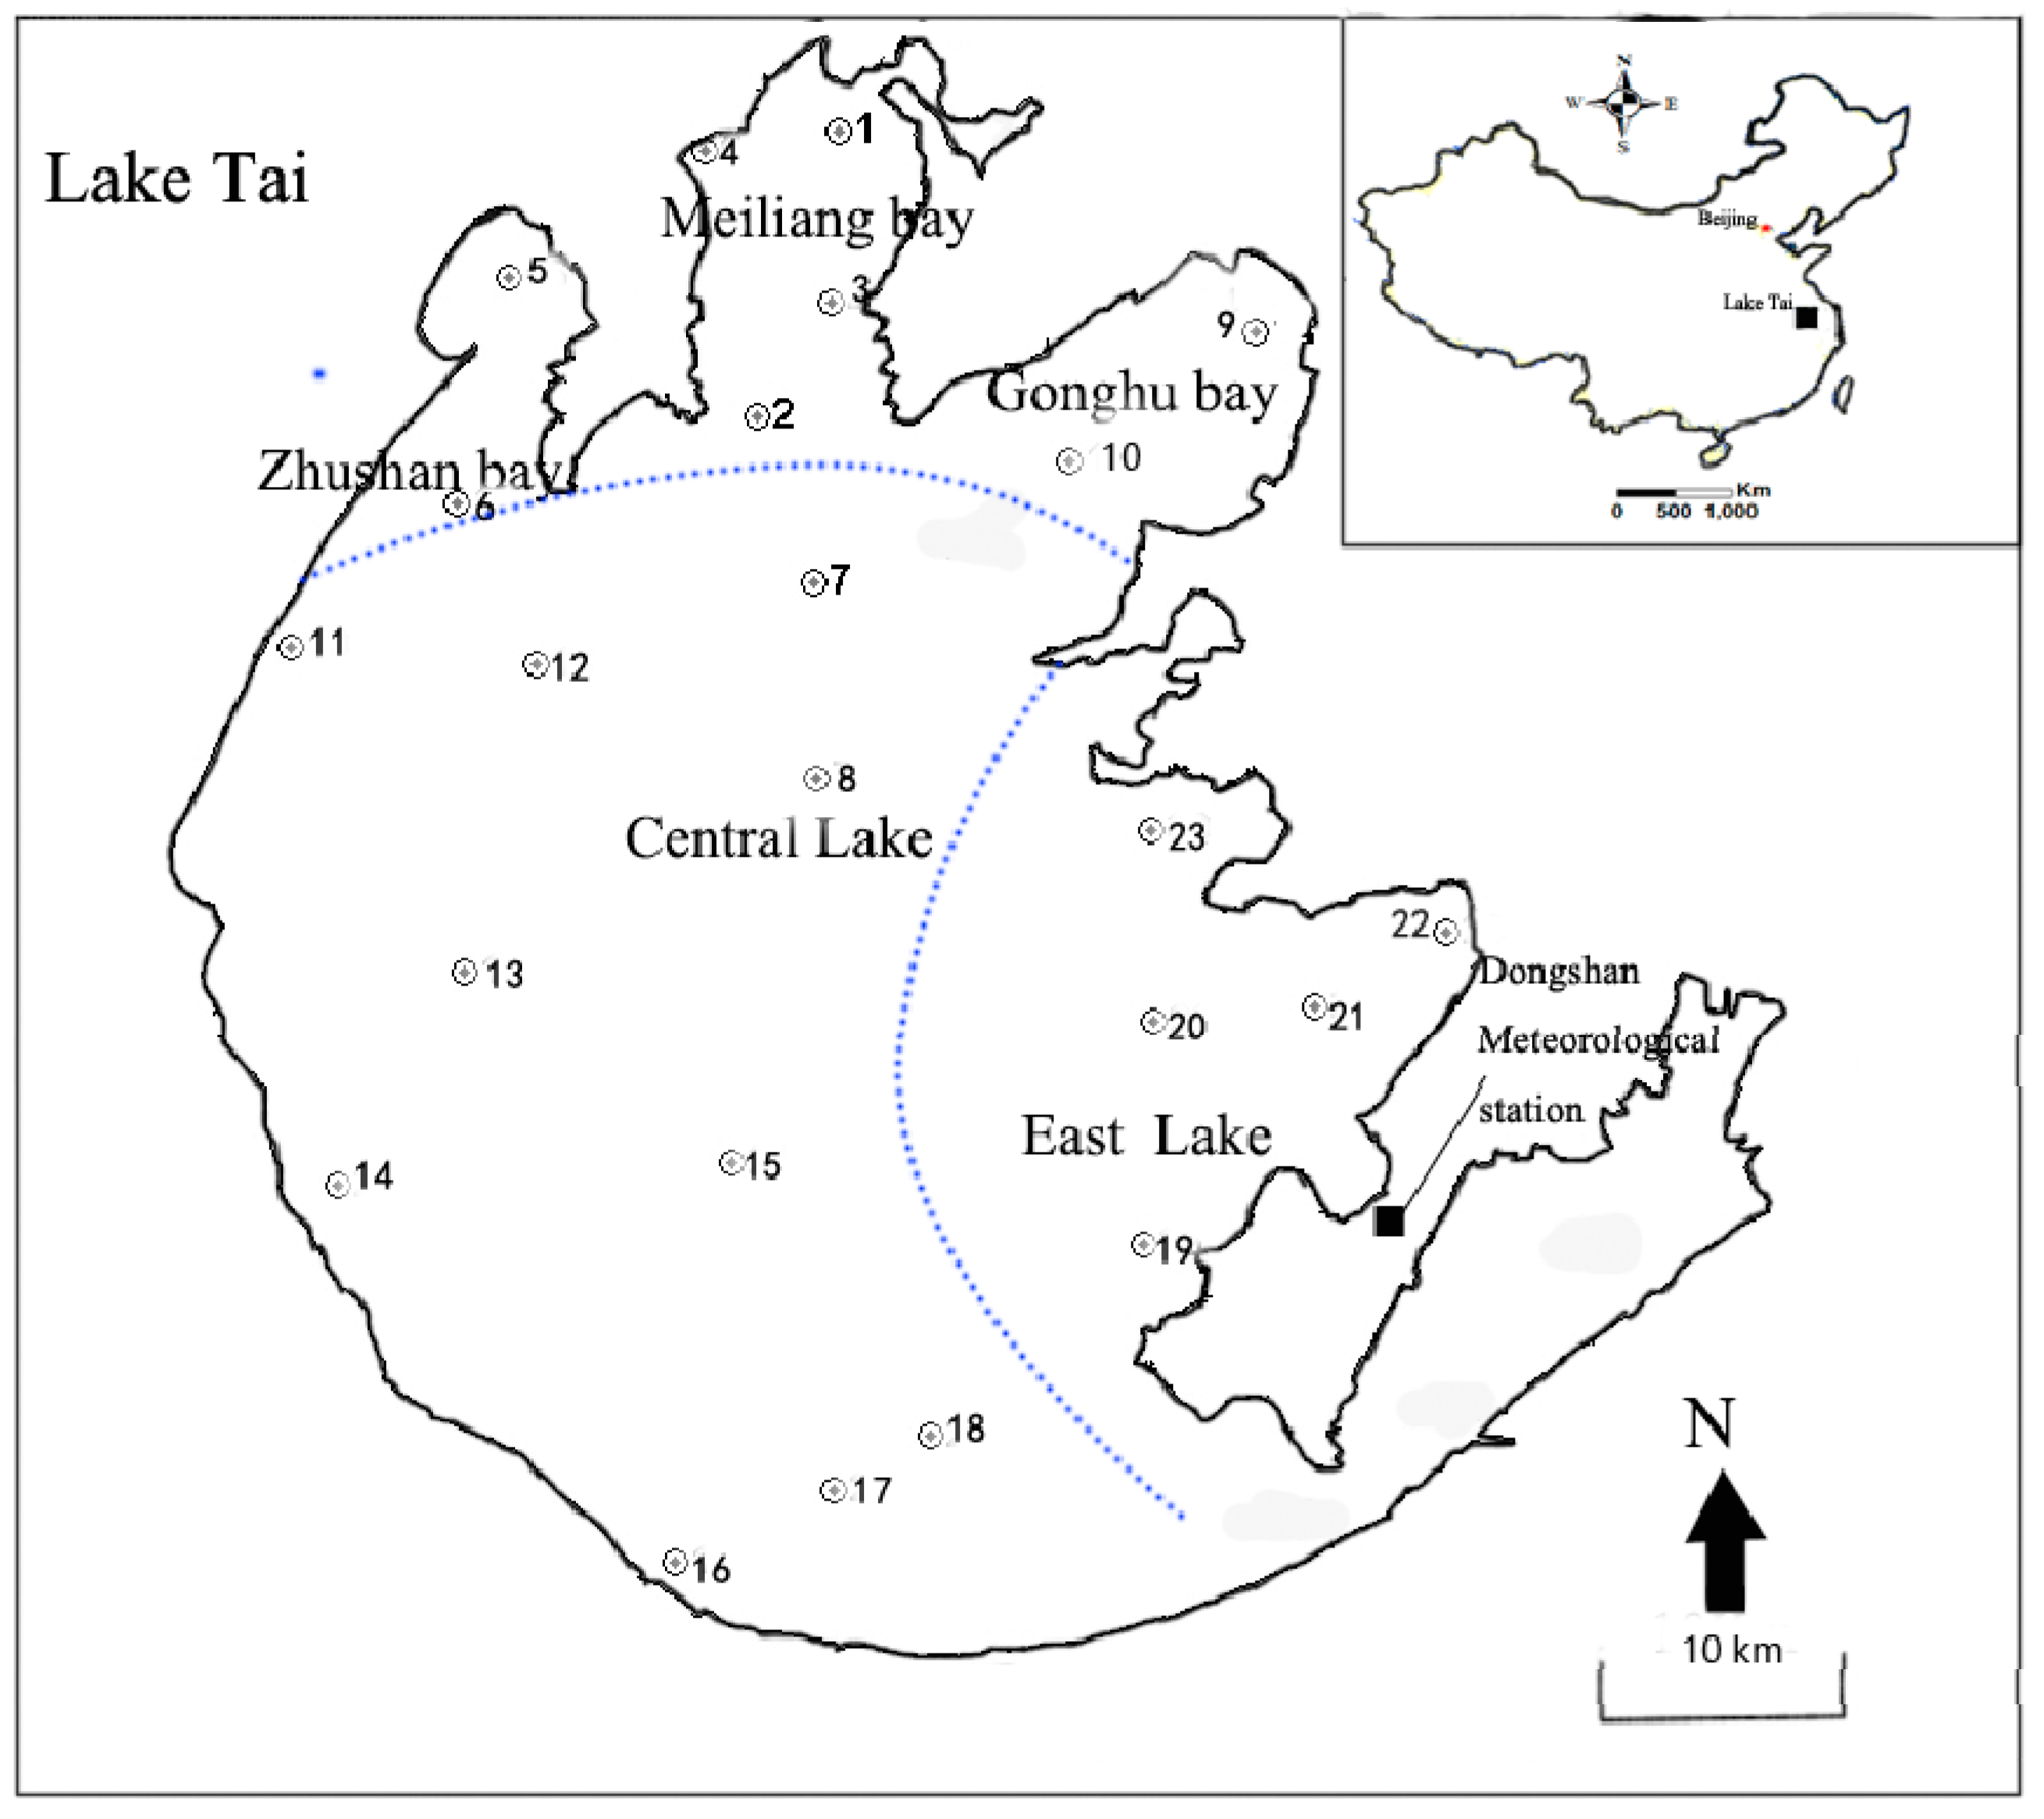
2.1. Lake Tai

Lake Tai (also known as Lake Taihu) (Figure 1) is located in east China, through which the lower reach of the Yangtze River meanders. It has an annual average water surface area of 2338 km2 and is the third largest freshwater lake in China. As a typical large shallow lake, Lake Tai has a maximum water depth of 2.6 m, but a mean water depth of just 1.9 m. The historical data for the period 1997–2006 reveal that the lake had a hydraulic retention time of 109–235 days [30]. Lake Tai has important ecological functions [31] and is the drinking water source for several major cities, including Wuxi (>1.5 million residents) and Suzhou (>1.4 million residents) in Jiangsu Province. However, over the past few decades, a large amount of wastewater with high concentrations of nutrients from local industries, domestics and agricultural sectors has been discharged into the lake, rendering the lake eutrophic with several severe cyanobacterial blooms [32,33]. Although most of the wastewater was discharged into the lake through the drainage system (e.g., channels and pipelines) located in the northwestern part, a considerable amount of wastewater was discharged into the lake from numerous locations along the lake shore. The water quality in Lake Tai is spatially heterogeneous [34]: Meiliang Bay and Zhushan Bay, both in the northern part of the lake, have the worst water quality, while the water quality in the eastern part (labeled as East Lake in Figure 1) is much better than that in other parts of the lake. In terms of the spatial heterogeneity of water quality, the lake can be subdivided into five zones (Figure 1), namely Meiliang Bay, Zhushan Bay, Gonghu Bay, Central Lake and East Lake.
Located in a subtropical monsoon region, Lake Tai experiences frequent high-speed winds with large seasonal variations for any given year. It is subject to heavy storms in summer [35]. Lake Tai has a dynamic ratio of 25.4, which is defined as the ratio of the square root of the lake surface area (in km2) to its depth (in m). Such a high dynamic ratio indicates that the lakebed sediments of Lake Tai are particularly susceptible to resuspension by wind-induced shear stress [36]. Most other lakes in China have a much smaller dynamic ratio than Lake Tai [34].

2.2. Data and Preprocessing

Data on concentrations of total nitrogen (TN), total phosphorus (TP) and chlorophyll-a (Chl-a) at the 23 sites shown in Figure 1 were obtained from Chinese Research Academy of Environmental Science (CRAES) for a period of January 2005 till September 2011. For a given year and at a given site, one value of TN, TP or Chl-a concentration was available for February, May, August or November, whereas, at the sites except for nine sites (labeled as 1 and 3 through 11 in Figure 1), no concentrations were available for the other eight months. At each of those nine exceptional sites and for a given year, one value of TN, TP or Chl-a concentration was available for each month. In total, for each of the three water quality variables, there were 1153 data points during the seven years across the 23 sites (Table 1). Herein, while determined using a grab sample on a particular day, the value for a month was empirically assumed to be the corresponding monthly mean concentration. Because of the unequal sample sizes and inconsistent months with missing values from one year to another, in order to validate the analyses in this study, the median of the monthly concentrations for a given year and a given water quality variable was computed in Microsoft® Excel and taken as the annual average concentration of this year and this water quality variable. As a result, for each variable, two water quality datasets were generated: one for monthly mean concentrations with a sample size of 1153, while another for annual average concentrations with a sample size of 23. Hereinafter, for description purposes, the datasets for TN, TP and Chl-a monthly mean concentrations were named as TNMC, TPMC and CAMC, respectively, while the datasets for TN, TP and Chl-a annual average concentrations were named as TNAC, TPAC and CAAC, respectively. In total, six water quality datasets (i.e., TNMC, TPMC, CAMC, TNAC, TPAC and CAAC) were formulated.
Data on wind speed at the Dongshan meteorological station (Figure 1) were downloaded from the China Meteorological Data Sharing Service System (CMDSSS) website (http://cdc.cma.gov.cn/home.do) for a period of January 1990 to September 2011. The prior-2004 data are monthly mean wind speeds, while the post-2005 data are daily average wind speeds. To capsulate the data, for a month after 2005, the arithmetic average of the daily wind speeds was computed in Excel and taken as the monthly mean wind speed of this month. This resulted in a dataset (named as WSMR, standing for Wind Speed of Monthly aveRage, for description purposes) of monthly mean wind speed with a sample size of 261. In addition, for a given year, the arithmetic average of the monthly mean wind speeds in the months of December to February was taken as the winter wind speed of this year; the arithmetic average in the months of March to May as the spring wind speed of this year; the arithmetic average in the months of June to August as the summer wind speed of this year; and the arithmetic average in the months of September to November as the fall wind speed of this year. This resulted in four more datasets of seasonal wind speeds with a sample size of 261. For description purposes, these datasets were named as WSWR (Wind Speed of Winter aveRage), WSSR (Wind Speed of Spring aveRage), WSUR (Wind Speed of sUmmer aveRage) and WSFR (Wind Speed of Fall aveRage) for winter, spring, summer and fall, respectively. Further, across a given year, the arithmetic average of the monthly mean wind speeds was computed and taken as the annual mean wind speed of this year. This resulted in a dataset (named as WSAR, sanding for Wind Speed of Annual aveRage, for description purposes) of annual mean wind speed with a sample size of 261. Moreover, for the years of 2005–2011, the daily average wind speeds on the days when TN, TP or Chl-a concentrations were available were extracted to formulate three more datasets with a sample size of 1153. In each of the datasets, the wind speeds and concentrations could be paired to examine their possible interrelations. For description purposes, the datasets corresponding to TN, TP and Chl-a were named as WSTN, WSTP and WSCA, respectively. In total, nine wind speed datasets (i.e., WSMR, WSWR, WSSR, WSUR, WSFR, WSAR, WSTN, WSTP and WSCA) were formulated.
Data on daily prevalent (i.e., most-lasting) wind direction at the Dongshan meteorological station were also downloaded from the same CMDSSS website for a period of January 2005 to September 2011. The daily prevalent directions on the days when TN, TP or Chl-a concentrations were available were extracted to formulate three datasets with a sample size of 1153. For description purposes, the datasets corresponding to TN, TP and Chl-a were named as WDTN, WDTP and WDCA, respectively. In these three abbreviations, WD stands for Wind Direction.
Moreover, the data on wind speed and water depth at Site 1 of Meiliang Bay (Figure 1) were used to compute the ratios of wind speed to water depth, which can be used as a surrogate for the vertical distribution of wind-induced shear stresses [34]. Such ratios were computed for 56 days because the data were just available for some days in four months (July to October) of 2010 and four months (May and July to September) of 2011. Over these 56 days, the lake water depth varied from 1.24–2.35 m, while the wind speed varied from 0.6 and 5.2 m·s−1. The ratios of wind speed to water depth ranged from 0.306–2.406, with a mean of 1.435. For these days, data on TN, total dissolved nitrogen (TDN), TP, total dissolved phosphorus (TDP) and Chl-a were also available. The TN concentration varied from 1.12–8.38 mg·L−1, with a mean of 2.225 mg·L−1, while the TDN concentration varied from 0.43–2.76 mg·L−1, with a mean of 1.099 mg·L−1. The TP concentration ranged from 0.039–0.642 mg·L−1, with a mean of 0.14 mg·L−1, while the TDP ranged from 0.077–0.015 mg·L−1, with a mean of 0.0367 mg·L−1. The Chl-a concentration fluctuated between 435.24 and 3.4 μg·L−1, with a mean of 36.71 μg·L−1. The ratios of wind speed to water depth versus TN, TDN, TP, TDP and Chl-a concentration were paired and organized into five datasets, which for description purposes, were designated SSTN, SSTDN, SSTP, SSTDP and SSCA, respectively. In these five abbreviations, SS stands for Shear Stress.

2.3. Analysis Methods

The data on daily prevalent wind direction were used to determine the empirical probability distributions of wind direction at annual and seasonal (i.e., spring-summer and fall-winter) temporal scales. For the annual scale, the entire dataset was used, while for a seasonal scale, the sub-dataset of this season was used. Herein, an angular interval of 22.5° was used to define 16 ranges of directions. For instance, the interval of 0°–22.5° represents a direction between eastward (i.e., E) and east-north-eastward (i.e., ENE), while the interval of 22.5°–25.0° represents a direction between ENE and north-eastward (NE). Similarly, the interval of 112.5°–145.0° represents a direction between north-north-westward (NNW) and north-westward (NW), while 292.5°–315.0° represents a direction between south-south-eastward (SSE) and south-eastward (SE). Regardless of the temporal scale, for a given angular interval, the number of days with a wind direction within this interval was counted and then divided by the dataset or sub-dataset size to get the empirical probability (i.e., frequency) of wind directions within this interval. As a result, for each of the temporal scales, 16 frequency values were obtained and then plotted to visually examine the patterns of wind direction. Subsequently, the paired values of water quality versus wind direction in datasets WDTN, WDTP and WDCA were superimposed on the frequency plots to scrutinize how water quality was affected by wind direction. Previous studies showed that wind direction can be an important factor influencing algal distributions in Lake Tai [37].
In addition, the wind speed datasets WSAR, WSWR, WSSR, WSUR and WSFR were plotted in Origin® 9.0 to visually detect the temporal trends of wind speed in the region where Lake Tai is located. Furthermore, plots showing daily average wind speed versus TN, TP and Chl-a, respectively, were generated using the datasets WSTN, WSTP and WSCA, respectively. These plots were visually examined to identify the relationships between water quality and wind speed. In terms of the detected trends and the identified relationships, the possible future water quality in Lake Tai, as affected by the trends of wind speed, were postulated. Whisker’s box plots were generated using the datasets WSTN, WSTP and WSCA to visually examine the thresholds of wind speed, beyond which the water quality might be either better or worse. A one-way analysis of variance (ANOVA) [38] was conducted to test whether the concentrations corresponding to the wind speed ranges defined by the thresholds were different from each other at a significance level of α = 0.05. Herein, the null hypothesis was that the concentrations were from the same population and thus independent of wind speed magnitudes.
Further, for each year of 2005–2011, the water quality datasets TNAC, TPAC and CAAC were used in ArcGIS® to generate the spatial distribution maps of TN, TP and Chl-a concentrations, respectively. These maps were overlaid with the wind direction plots discussed above to examine the overall effects of wind direction on water quality across Lake Tai. Moreover, the datasets SSTN, SSTDN, SSTP, SSTDP and SSCA were plotted to examine effects of possible resuspension of bed sediments and water mixing on water quality.

3. Results

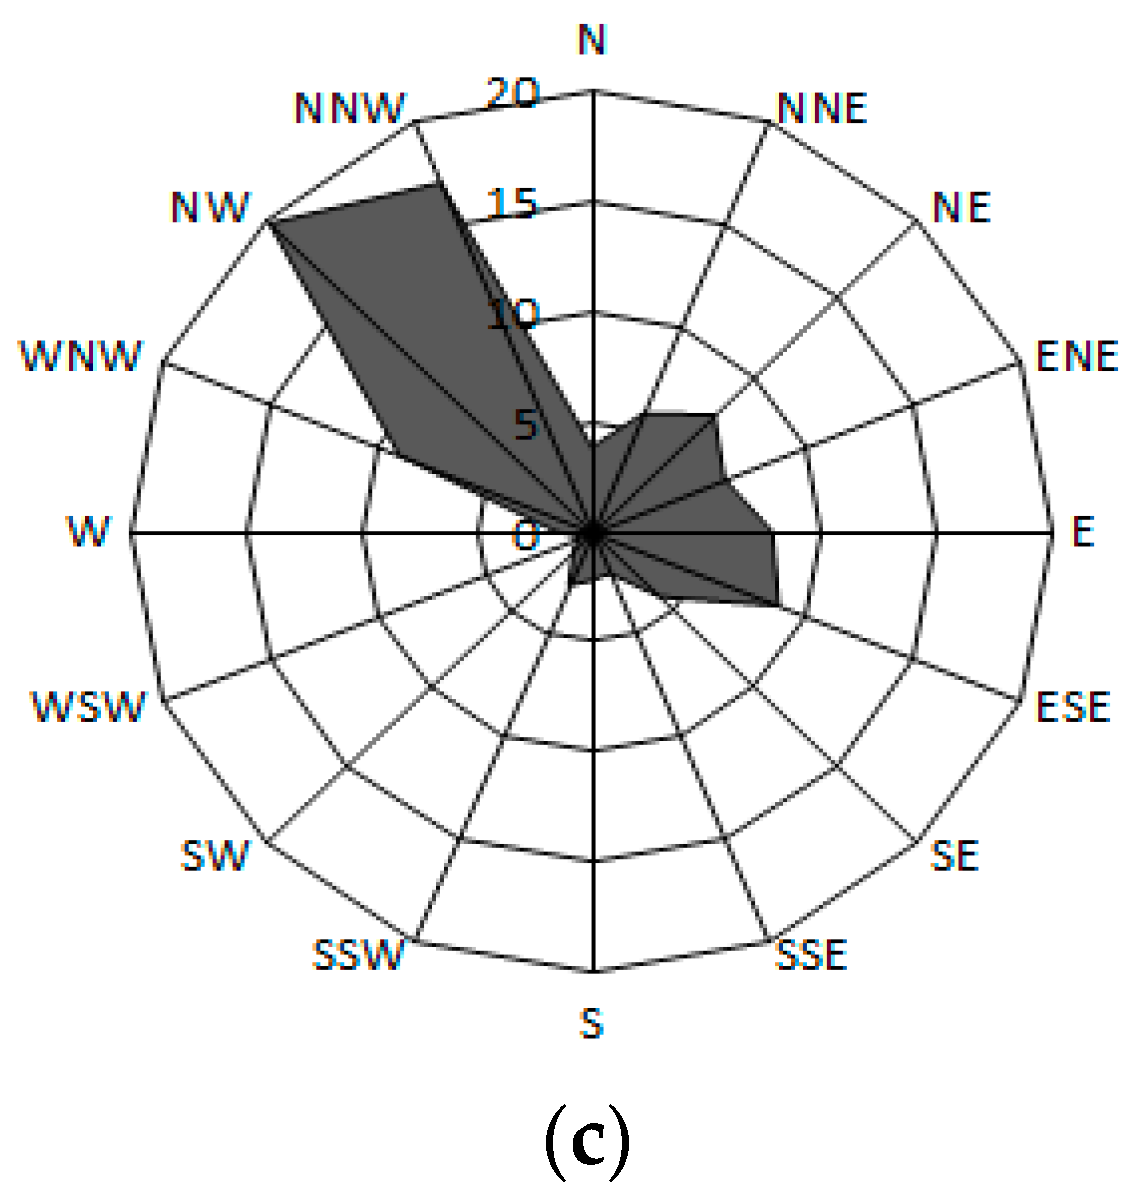
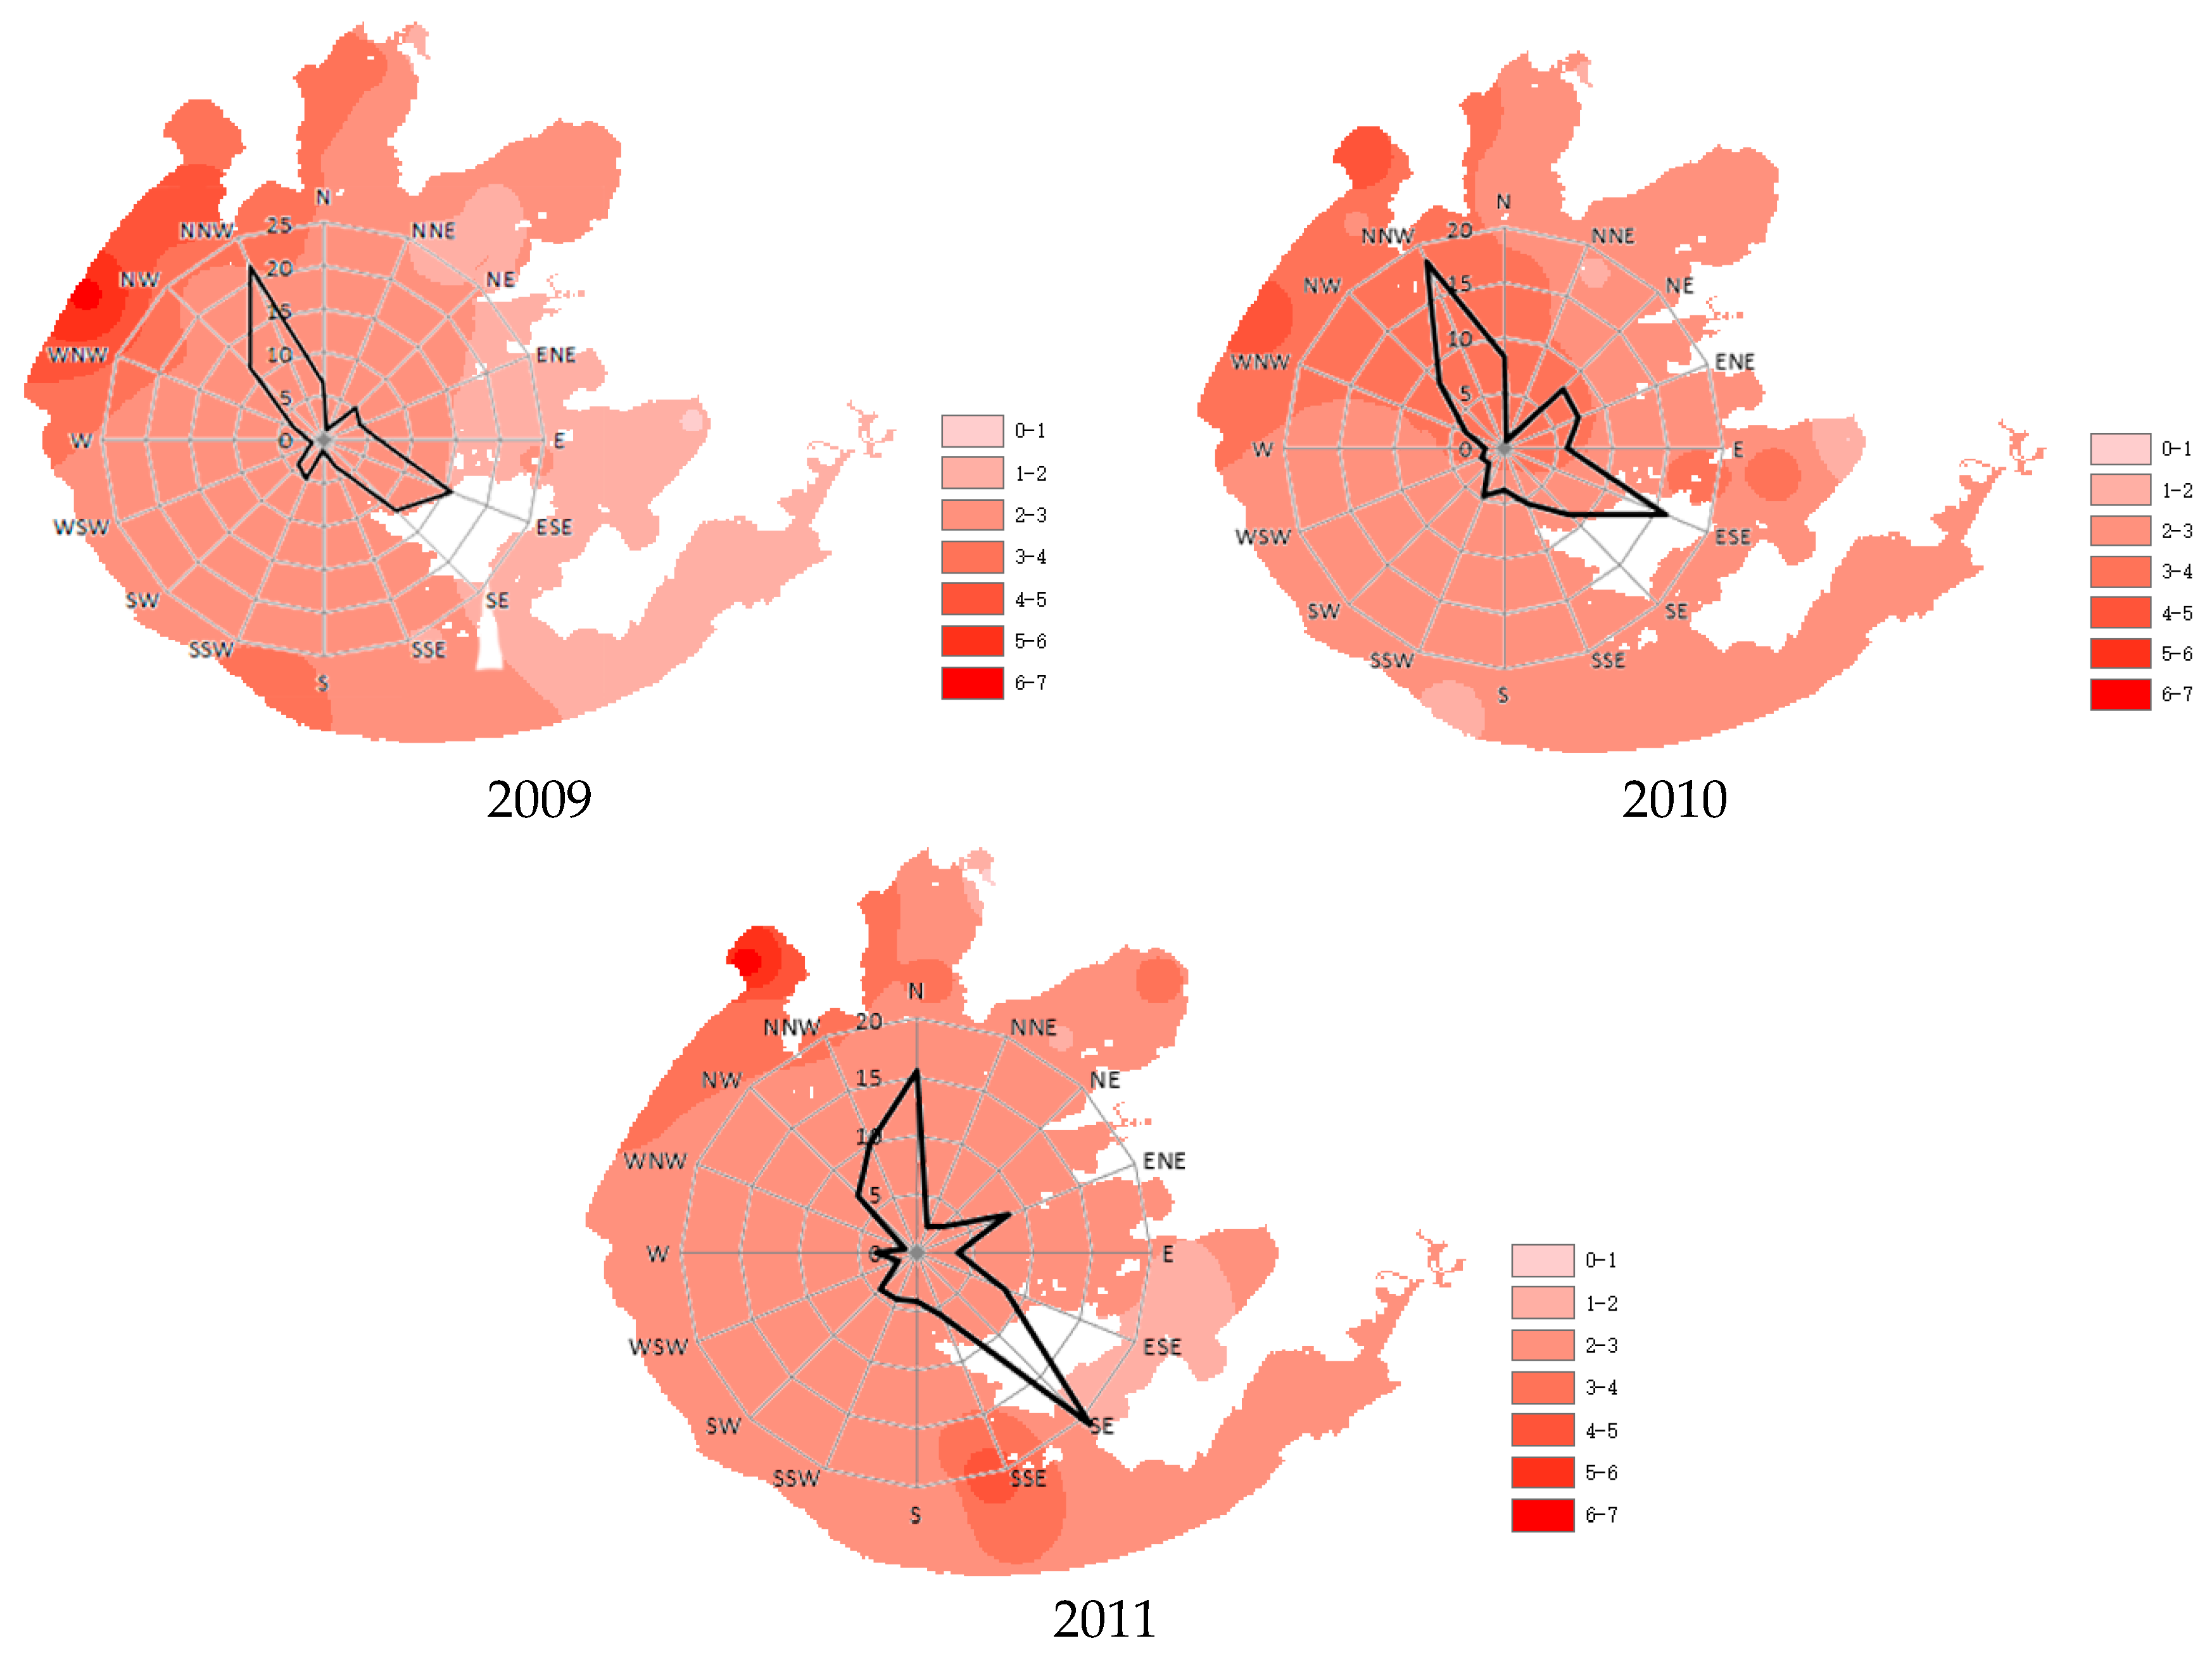
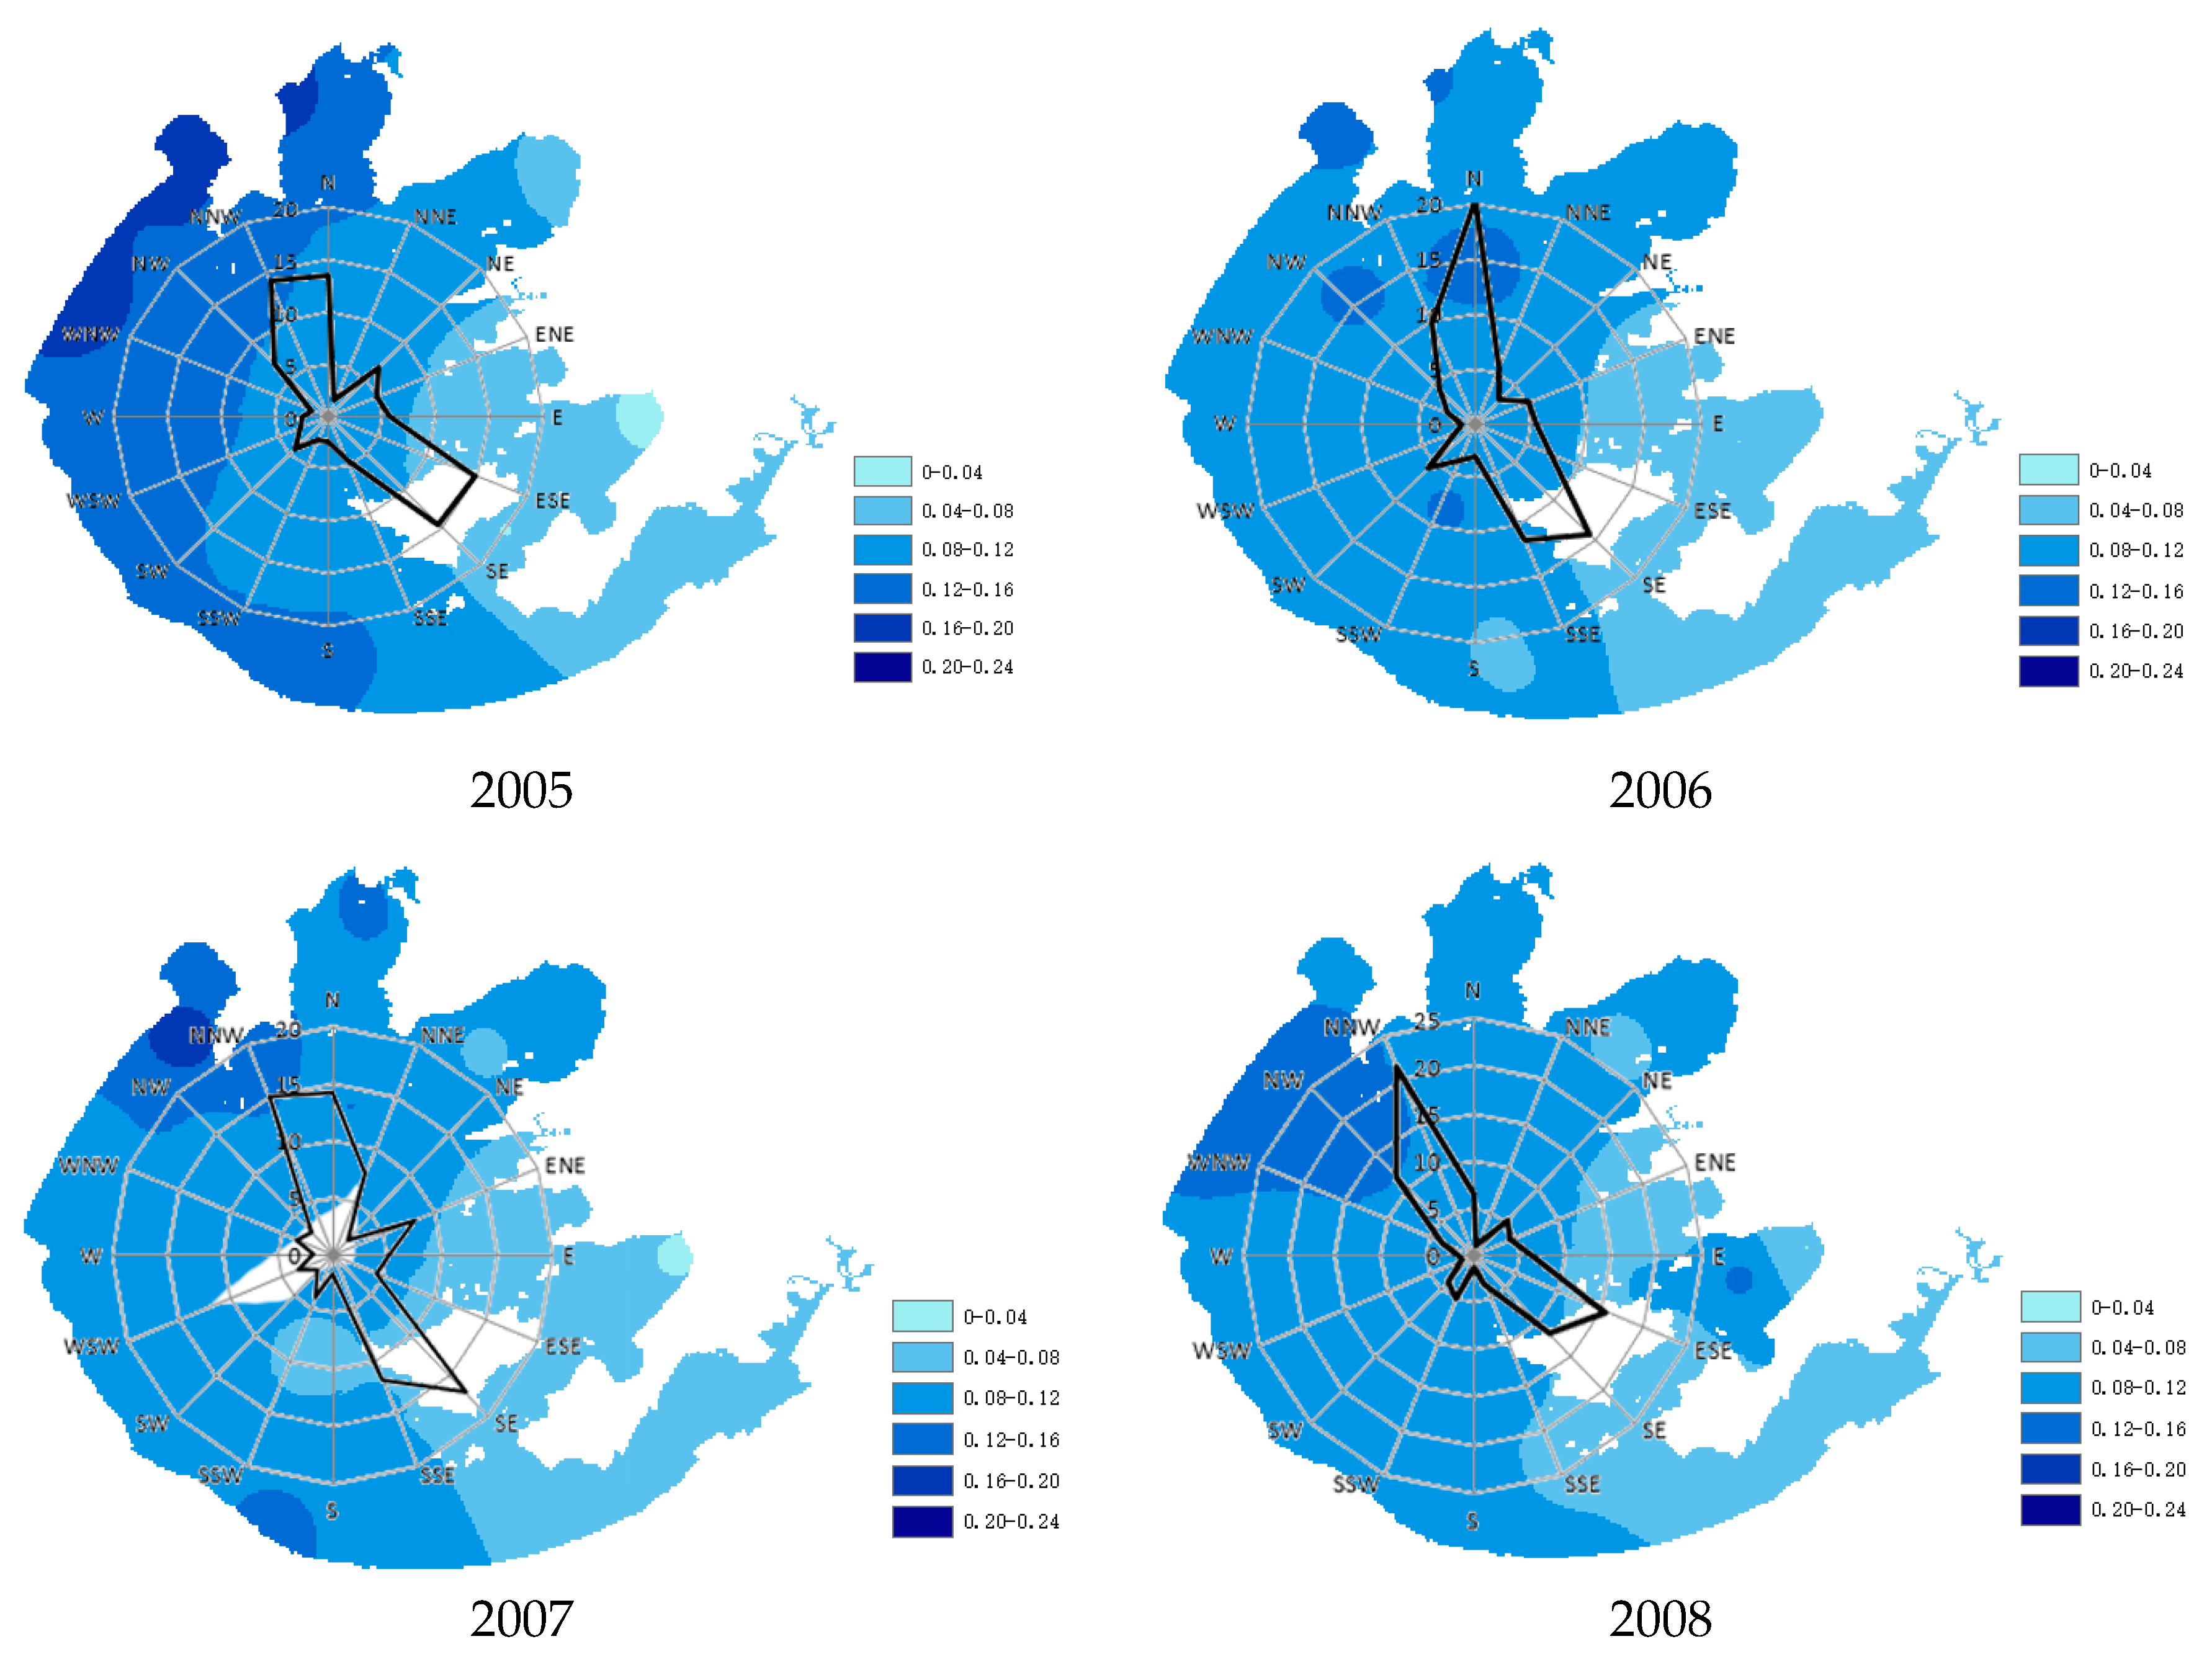
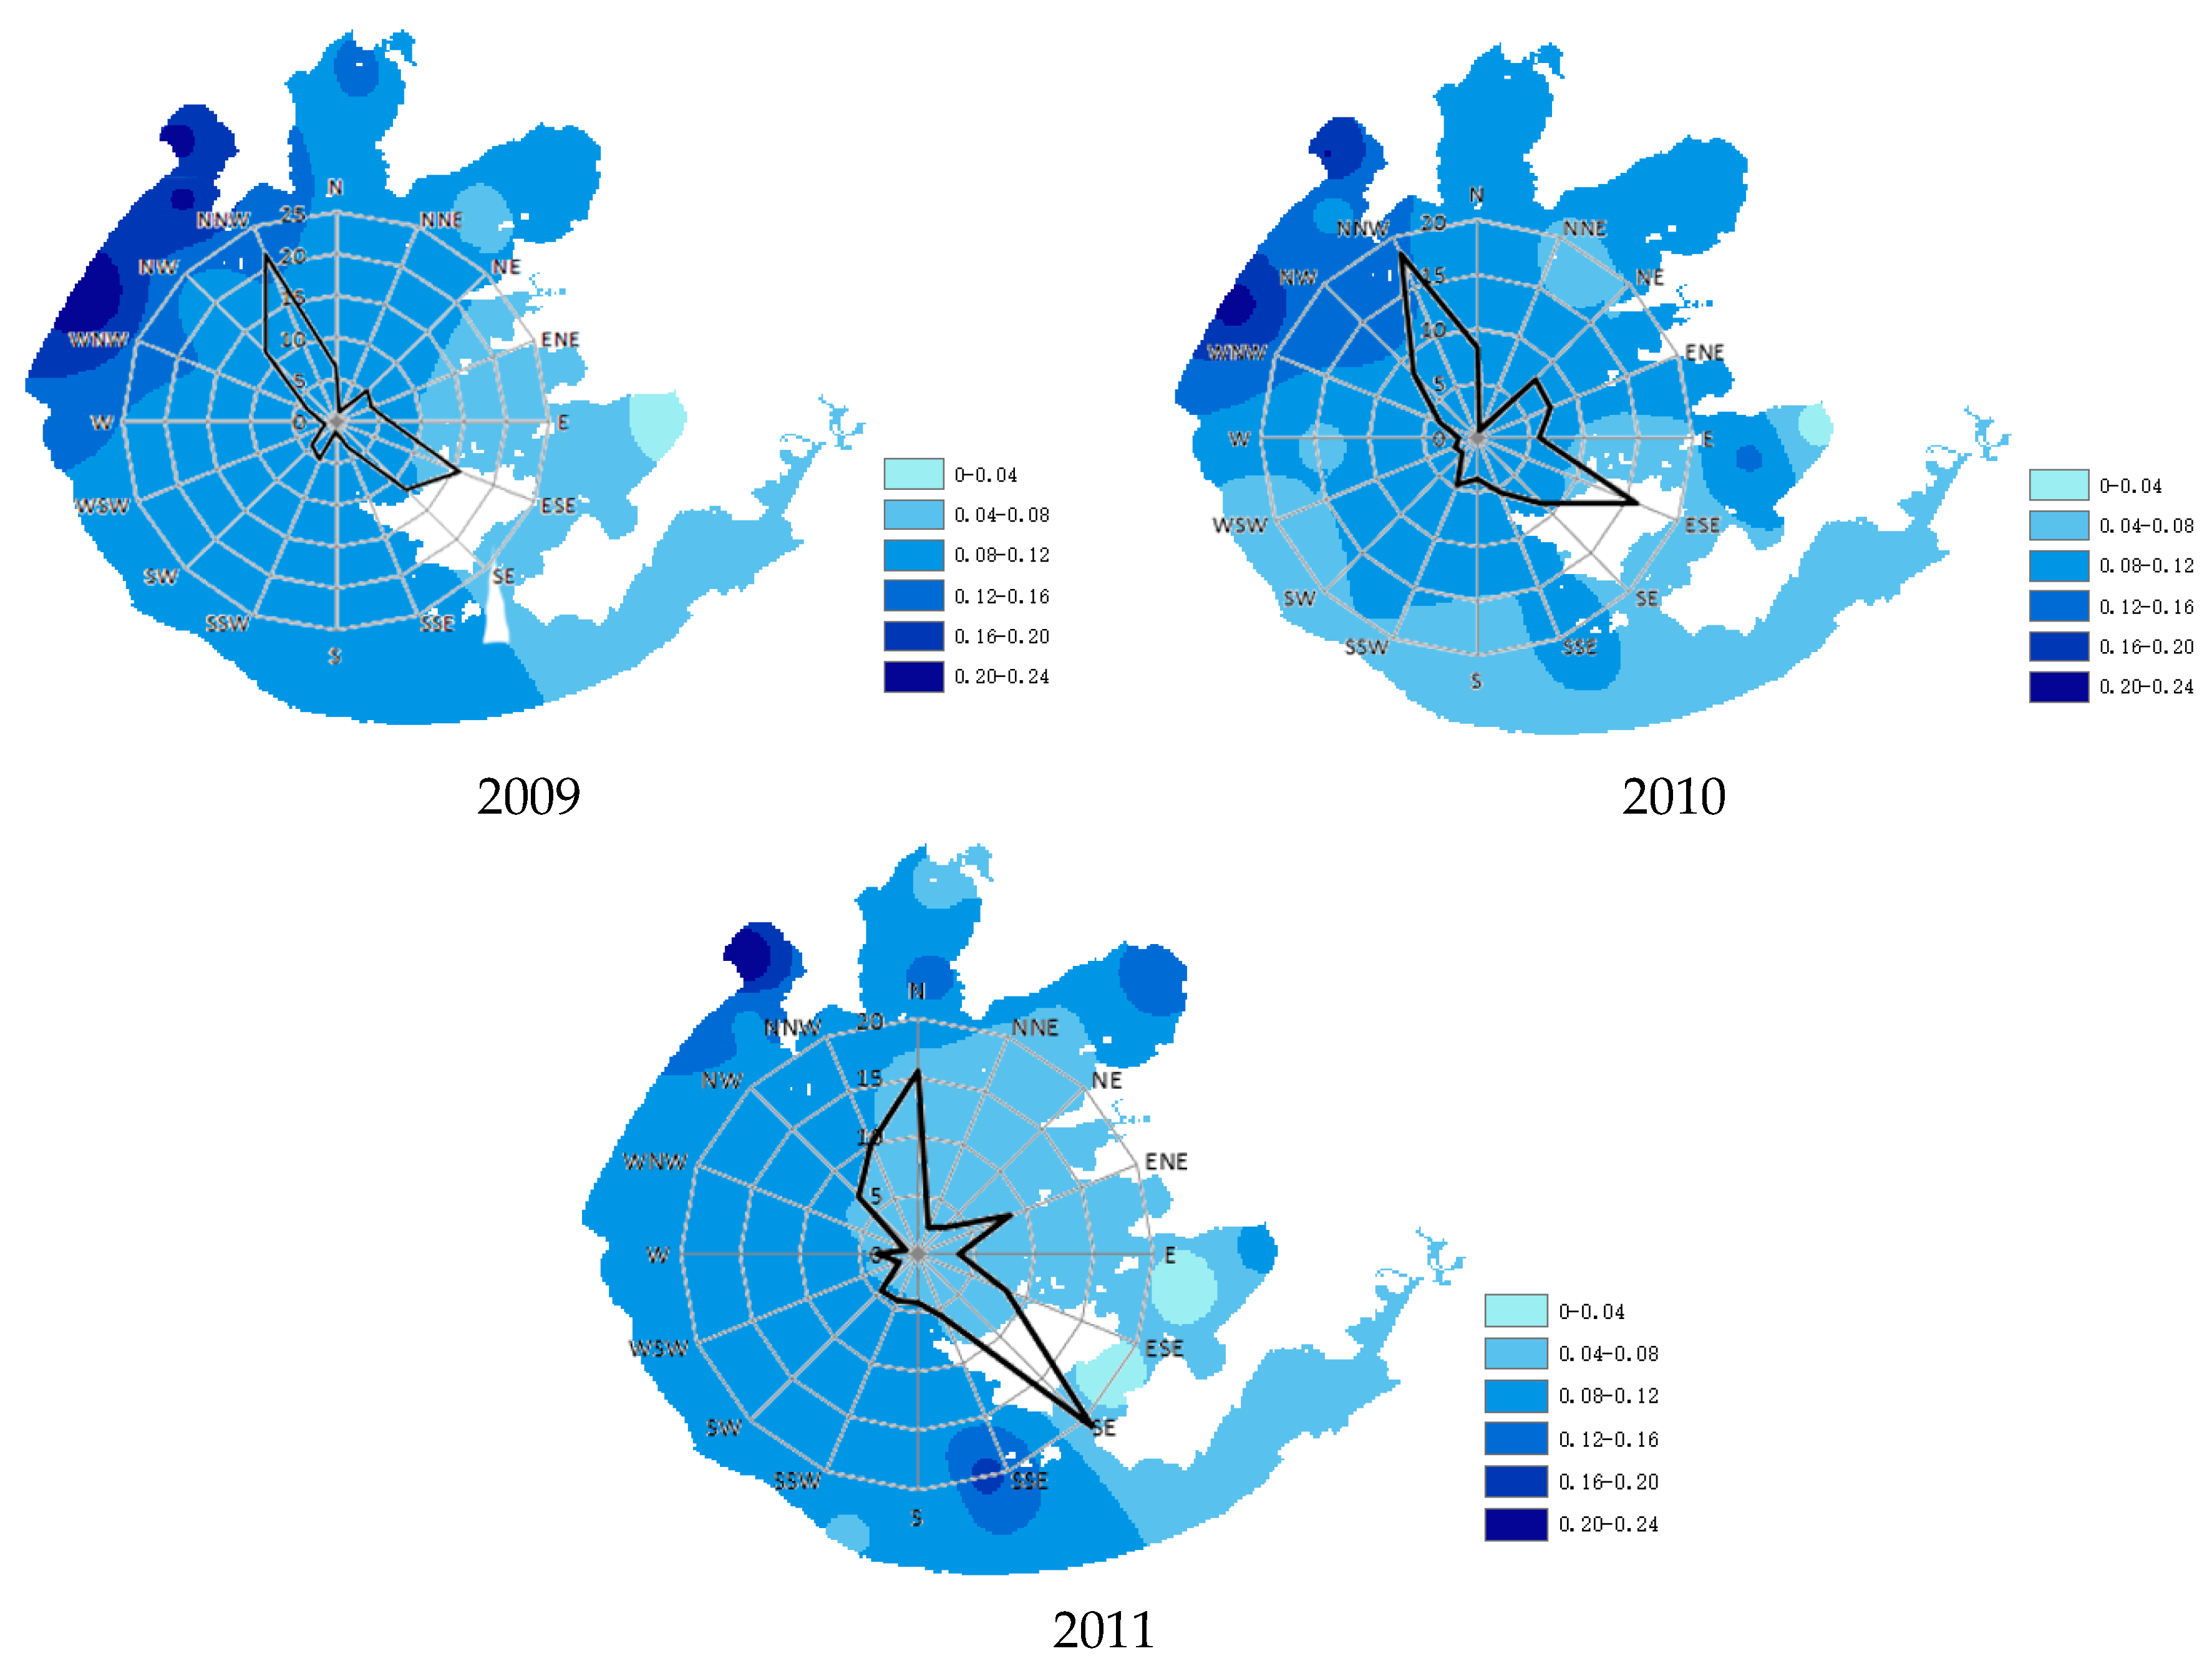
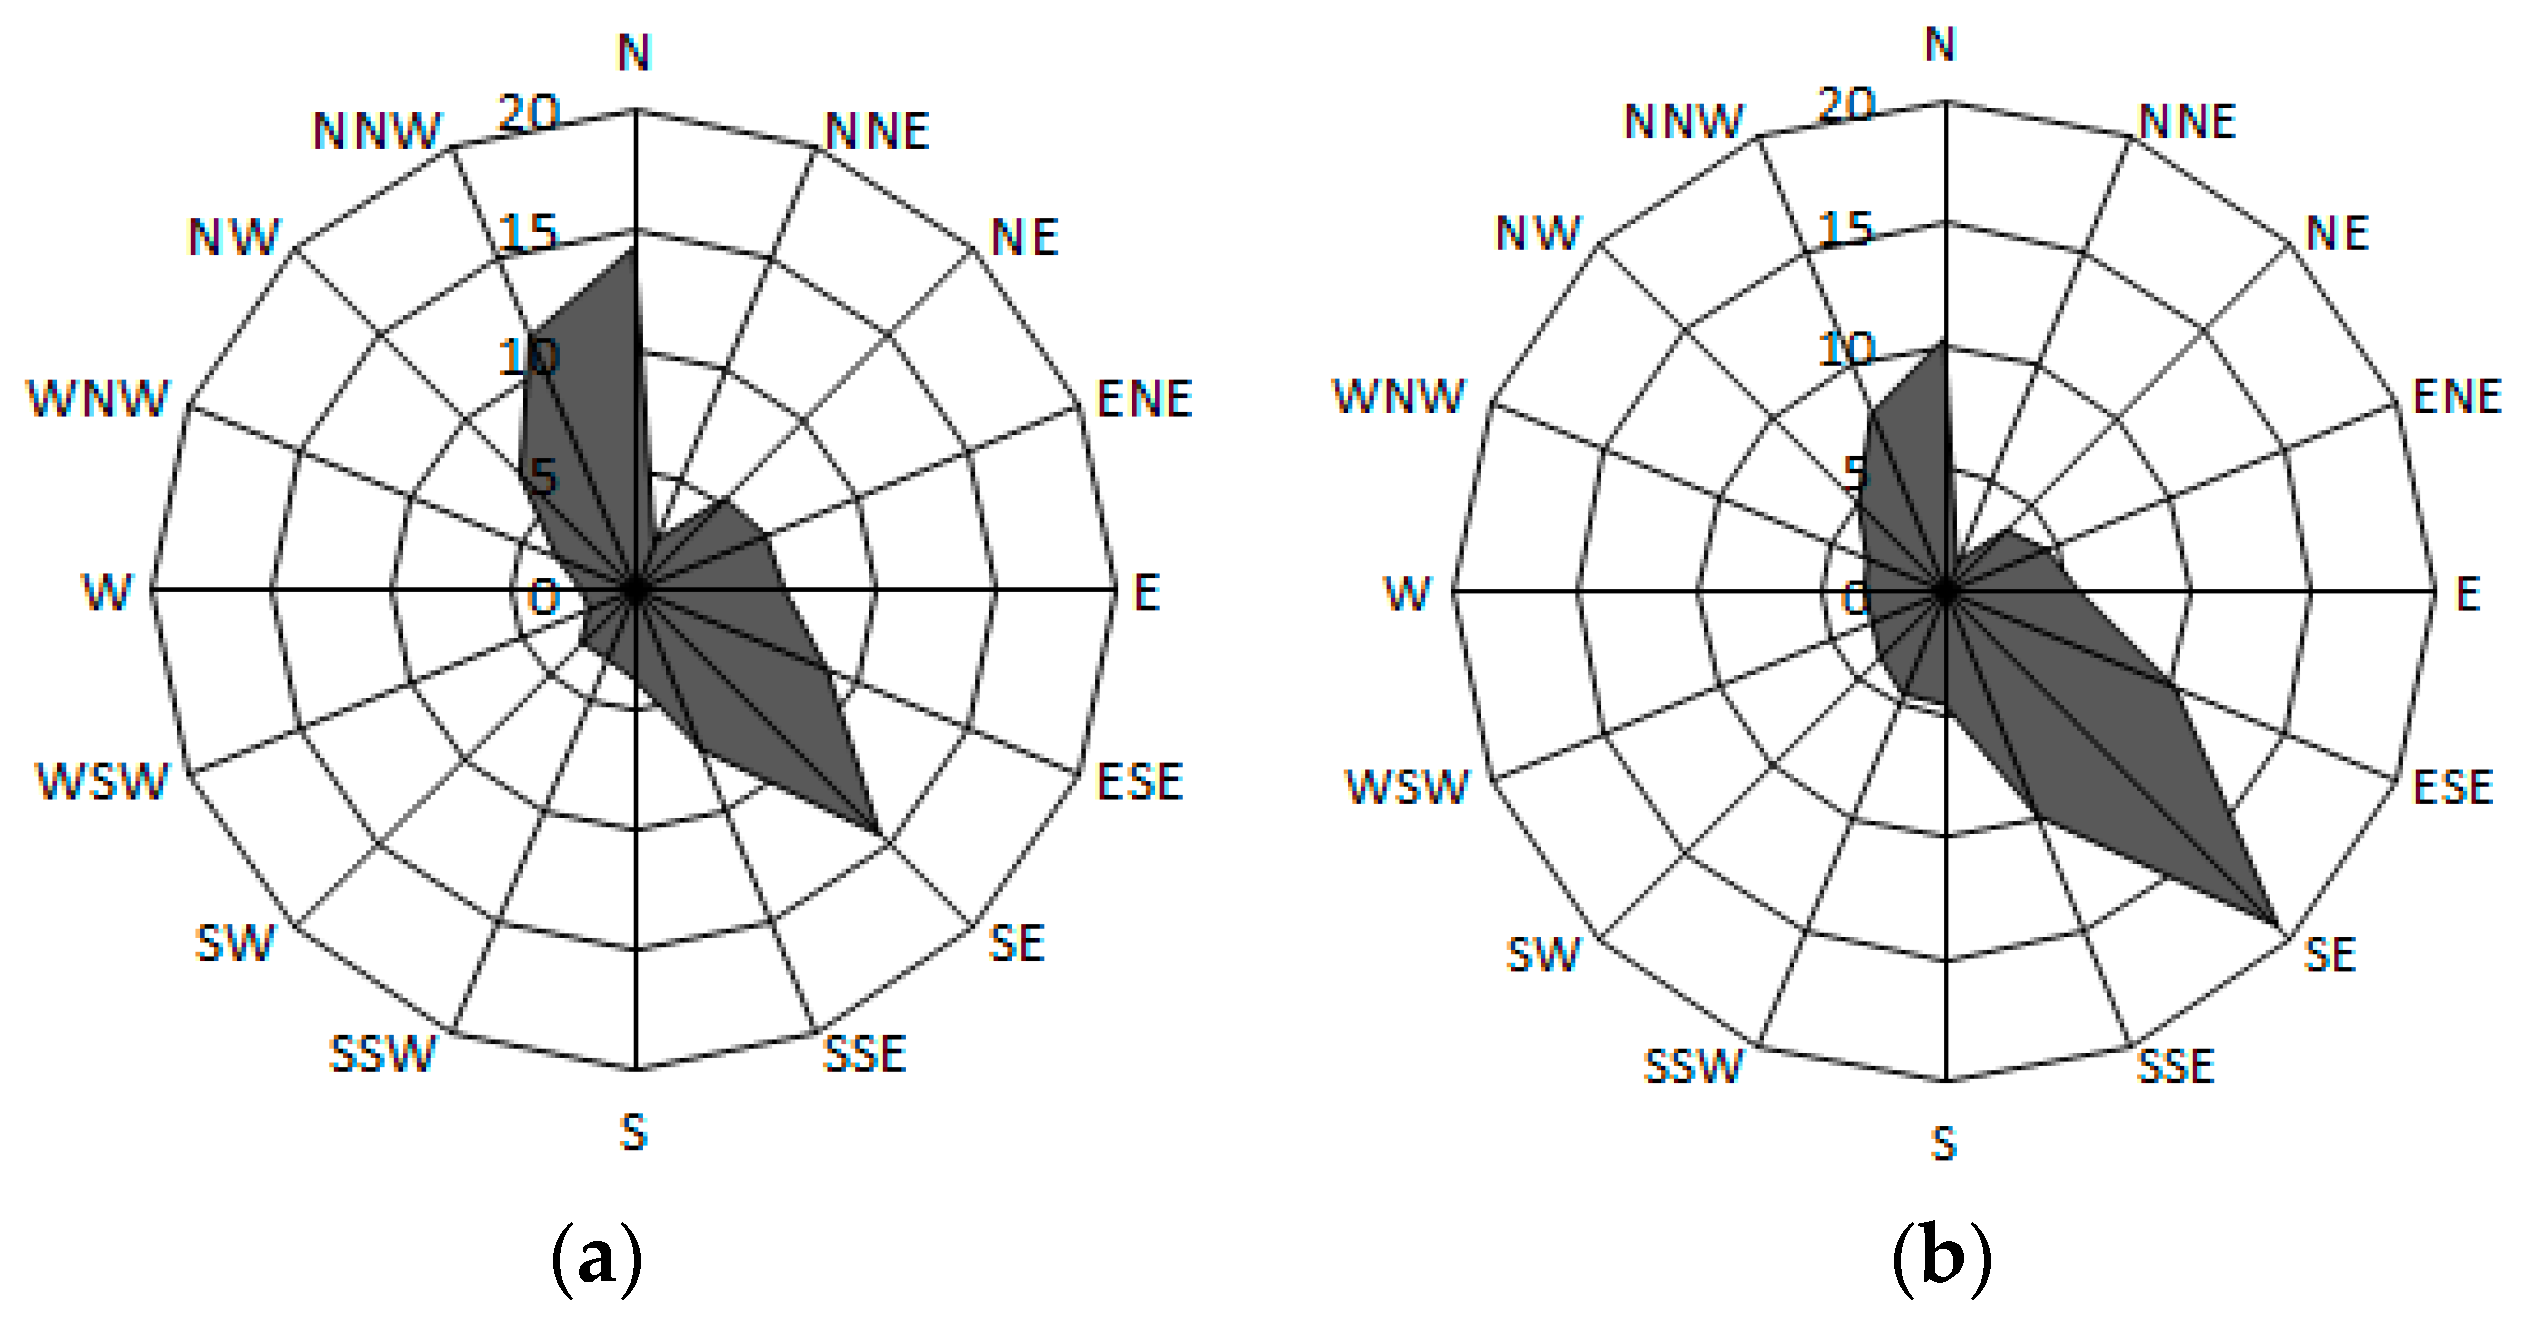
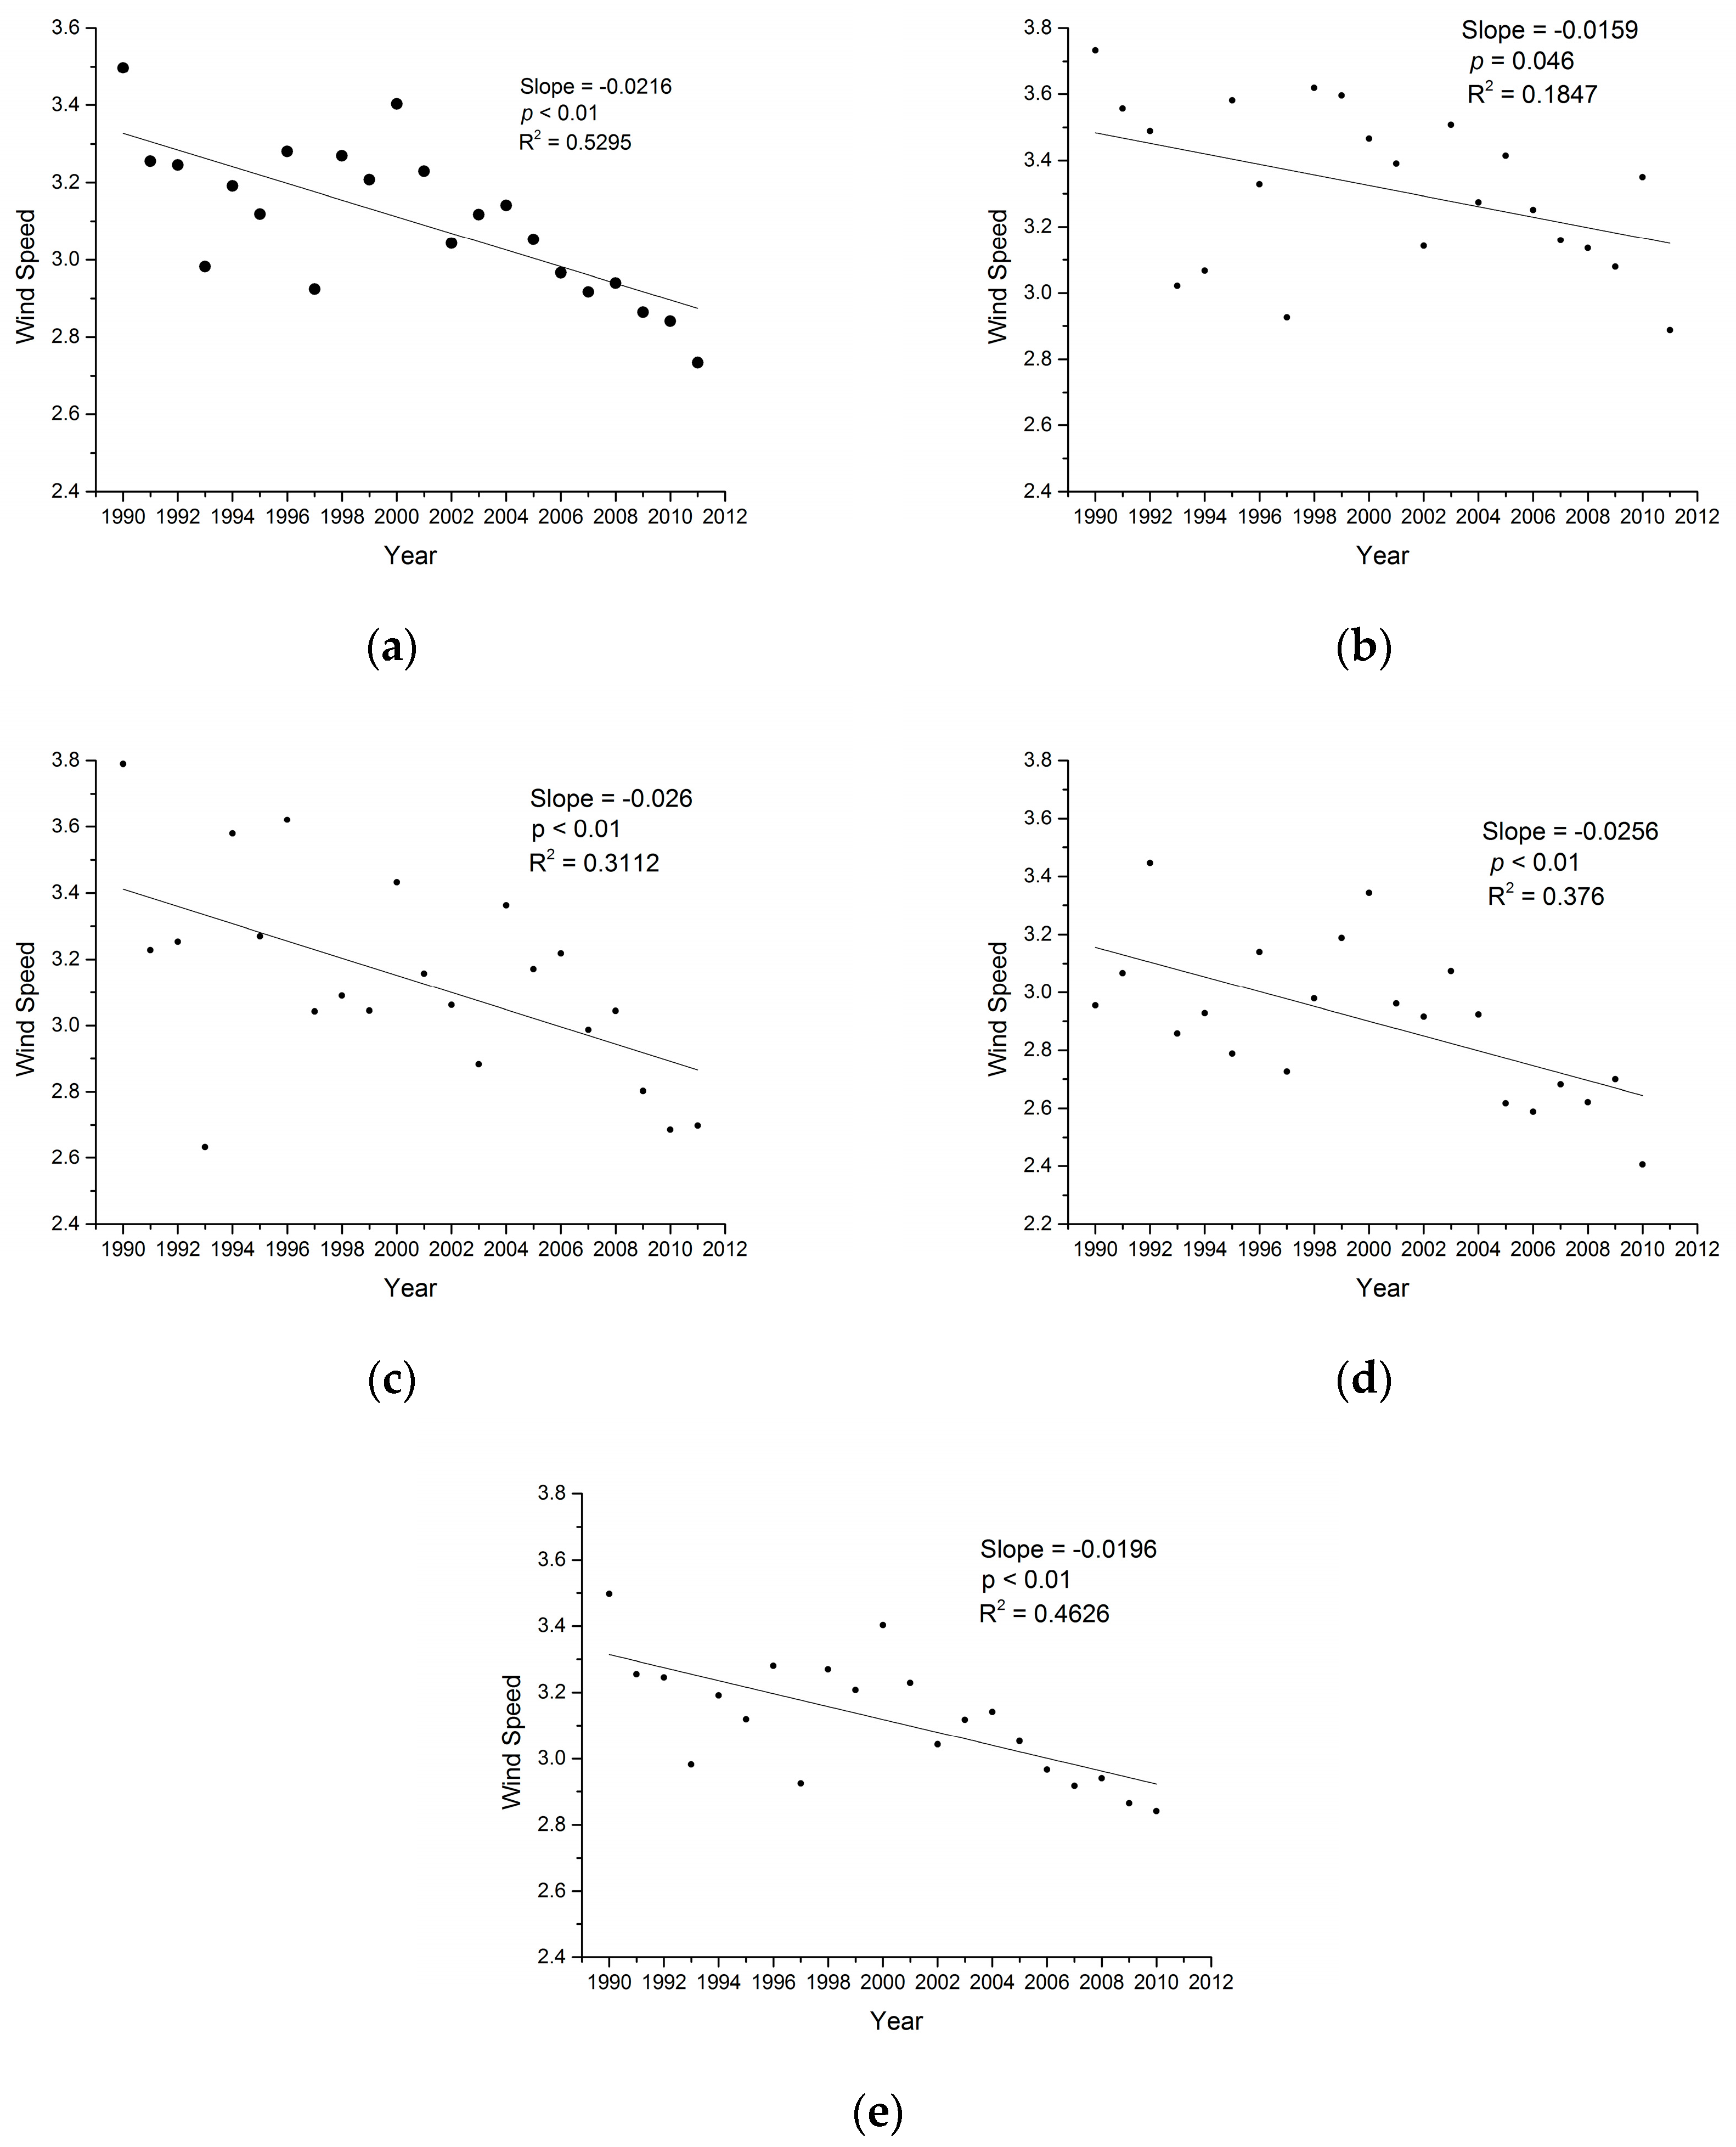
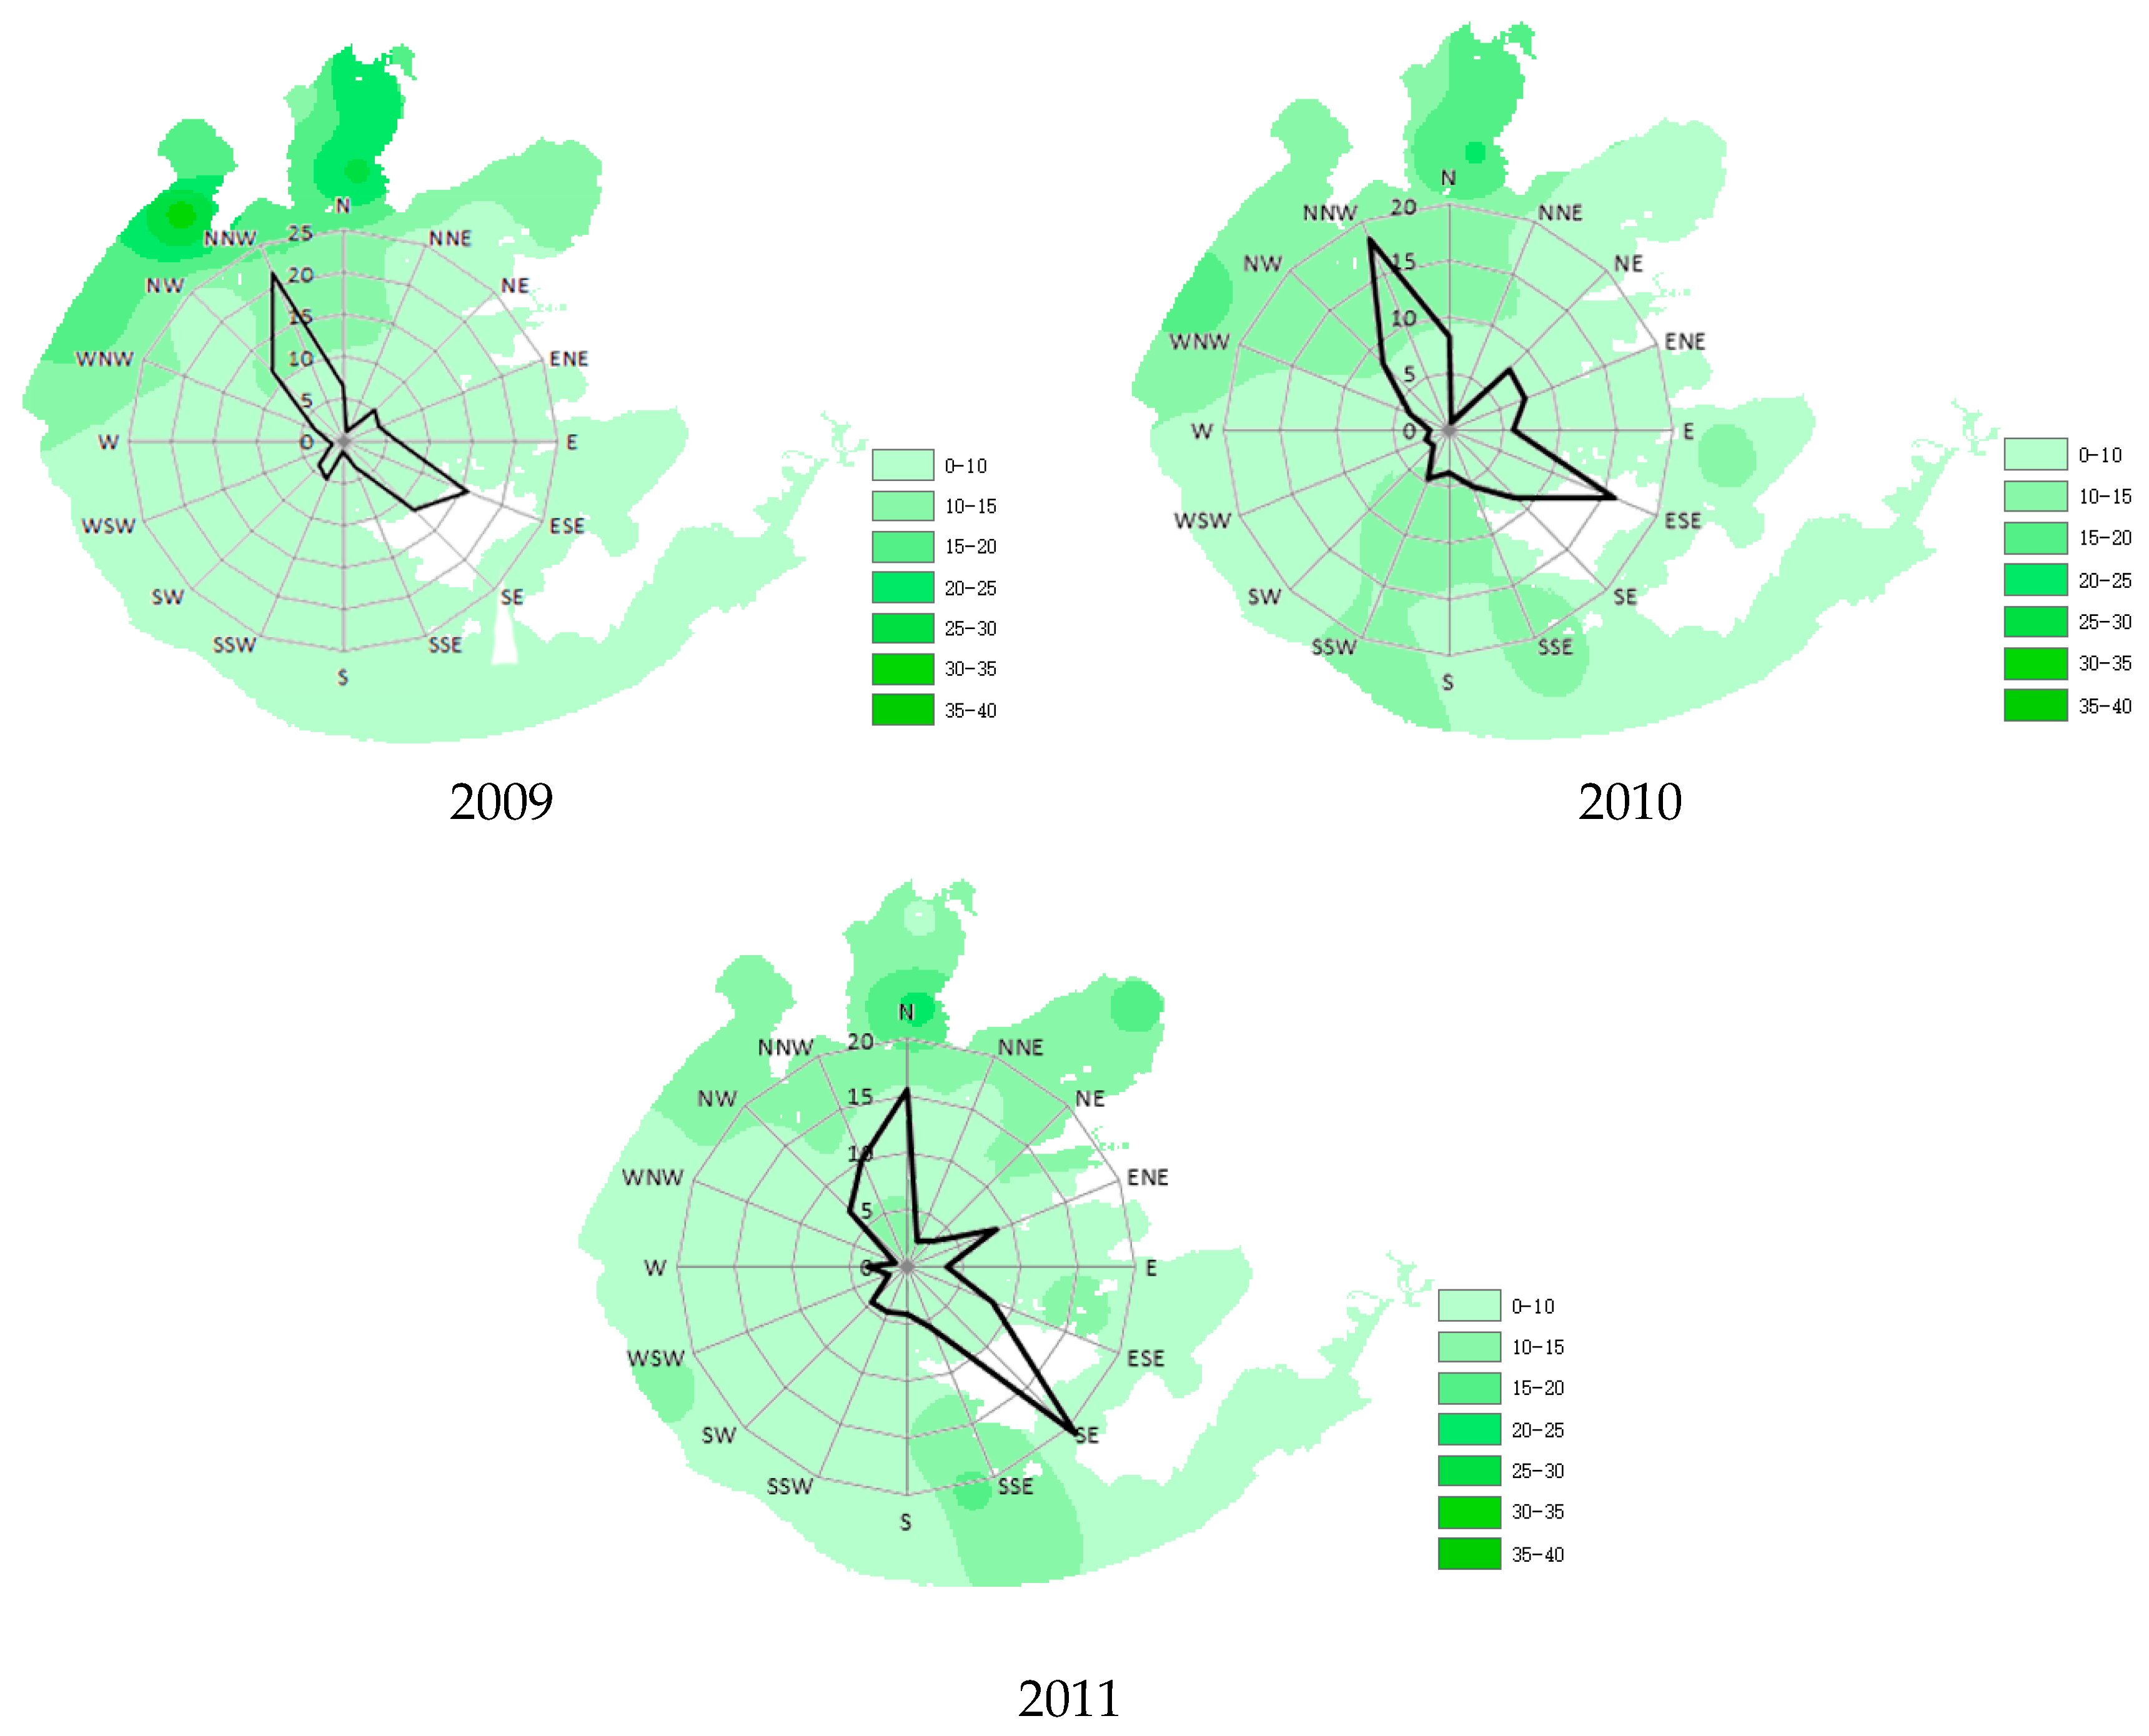
3.1. Wind Direction and Speed

During the study period (January 2005 to September 2011), 40.3% of the days had a southeastward wind direction, while 38% of the days had a northwestward wind direction (Figure 2a). These were also the primary wind directions at seasonal scales. In spring and summer, 49.4% of the days had a southeastward wind direction, while 29.8% of the days had a northwestward wind direction (Figure 2b). On the other hand, in fall and winter, 47.4% of the days had a northwestward wind direction, while 6.6% of the days had a southeastward wind direction (Figure 2c). These results showed that within a given year, the chance for the lake water to be blown toward East Lake was almost the same as the chance for the lake water to be blown toward Zhushan Bay and Meiliang Bay (Figure 1). However, during warm seasons (i.e., spring and summer), the lake water had a larger chance to be blown toward East Lake than toward the bays, whereas, during cool seasons (i.e., fall and winter), the lake water had a larger chance to be blown toward the bays than toward East Lake.
During the study period (January 2005 to September 2011), the daily average wind speed varied from 0.4–10.7 m·s−1, with a mean of 2.9 m·s−1, while for the days (hereinafter referred to as monitoring days) when TN, TP and Chl-a concentrations were measured, the daily average wind speed varied from 0.5–5.4 m·s−1, with a mean of 2.7 m·s−1. That is, the monitoring days had a smaller fluctuation of wind speed than the entire study period, but the means were comparable. A close examination revealed that the larger fluctuation during the entire study period was caused by the few gusts occurring on just 99 days (<4%) with a daily average wind speed greater than 5.4 m·s−1. Given that such gusts did not occur very often, it was judged that the wind speeds during the monitoring days could well represent the statistical distribution of wind speed in the lake area. For a given day, the instantaneous wind speed could vary greatly. For the days with a daily average wind speed of below 2 m·s−1, the maximum instantaneous wind speed could reach up to 4.2 m·s−1, while for the days with a daily average wind speed of 2–3 m·s−1, the maximum instantaneous wind speed could be as high as 7 m·s−1. For the days with a daily average wind speed of over 3 m·s−1, the maximum instantaneous wind speed could be 9 m·s−1.
The wind speed in the Lake Tai region tended to decrease from 1990–2011 (Figure 3), with an overall decrease rate of 0.0216 m·s−1·year−1. The decreasing trends were statistically significant (p-value < 0.05) at both annual and seasonal scales, and they became much steeper from 2000 onward. The annual average wind speed from 2006–2011 was smaller than 3 m·s−1 (Figure 3a), whereas the annual average wind speed from 1990–2005 was larger. At seasonal scales, the seasonal average wind speed was highest in spring (3.32 m·s−1) and lowest in fall (2.90 m·s−1) (Figure 3b versus Figure 3e). The seasonal average wind speeds in summer (3.14 m·s−1) and winter (3.12 m·s−1) were comparable. Although the seasonal average wind speeds did vary somewhat across the four seasons, all seasons shared a similar downward trend over the last two decades, with a decreasing rate of 0.0159–0.026 m·s−1·year−1.

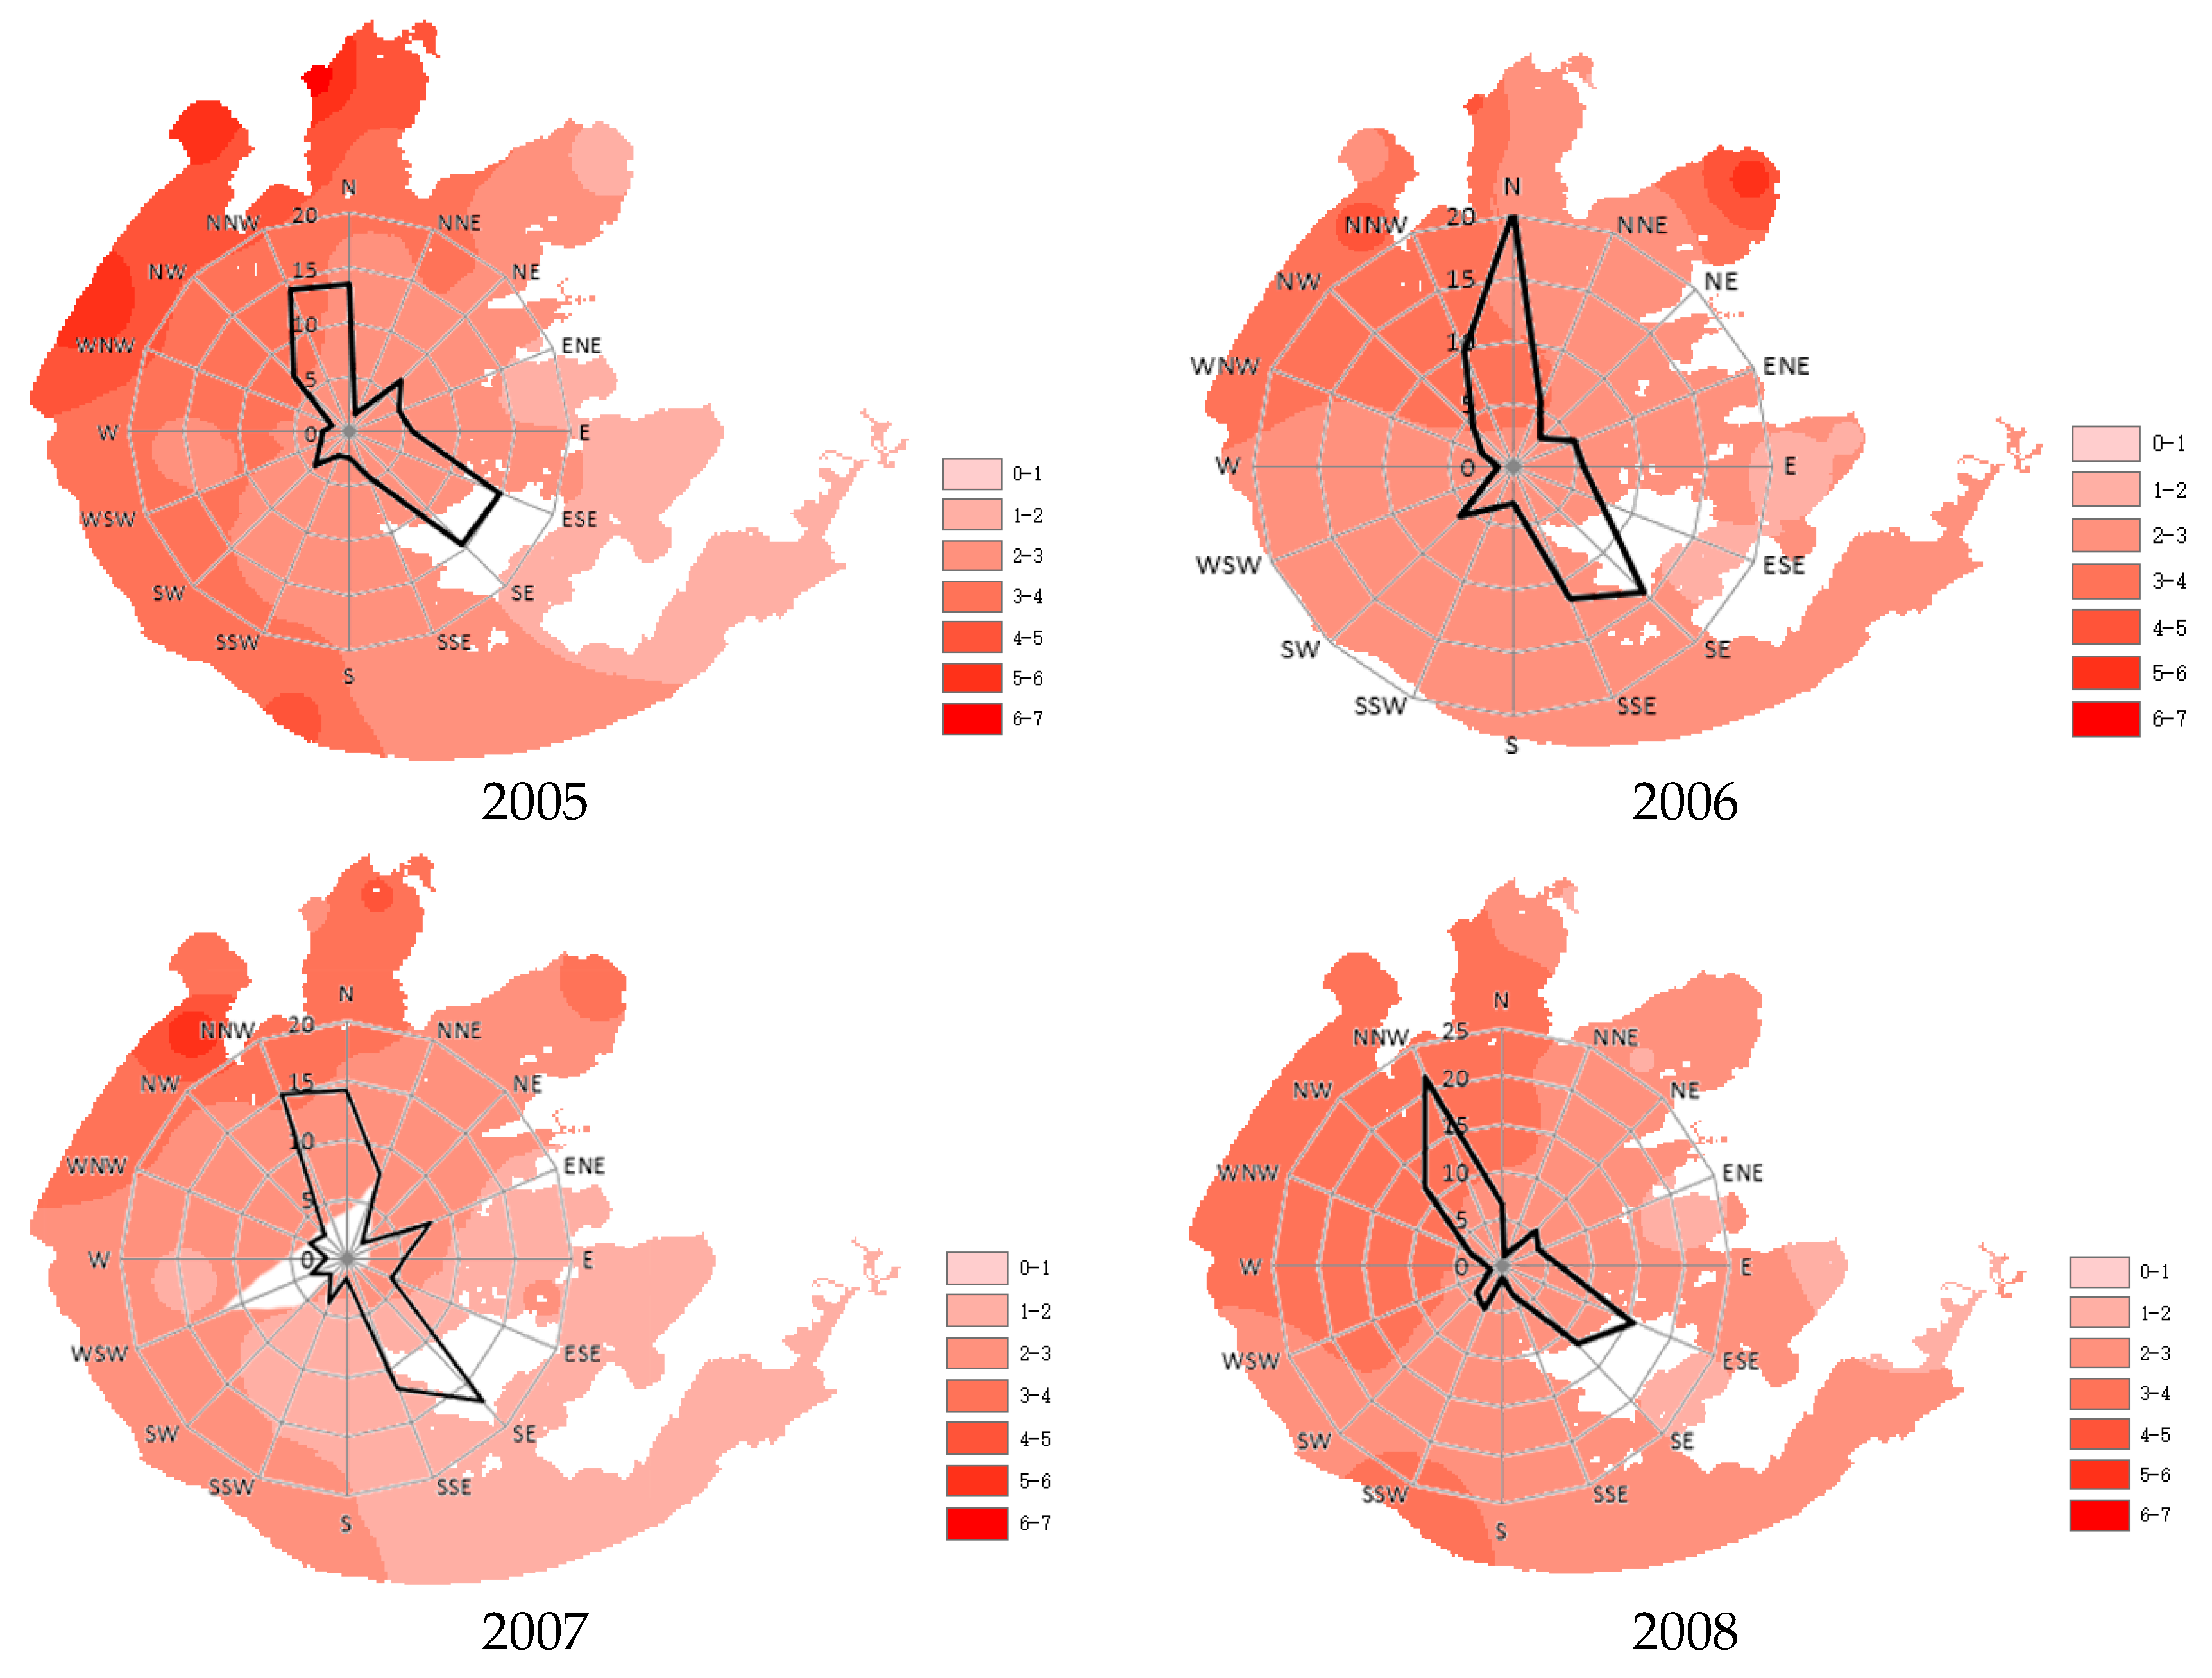
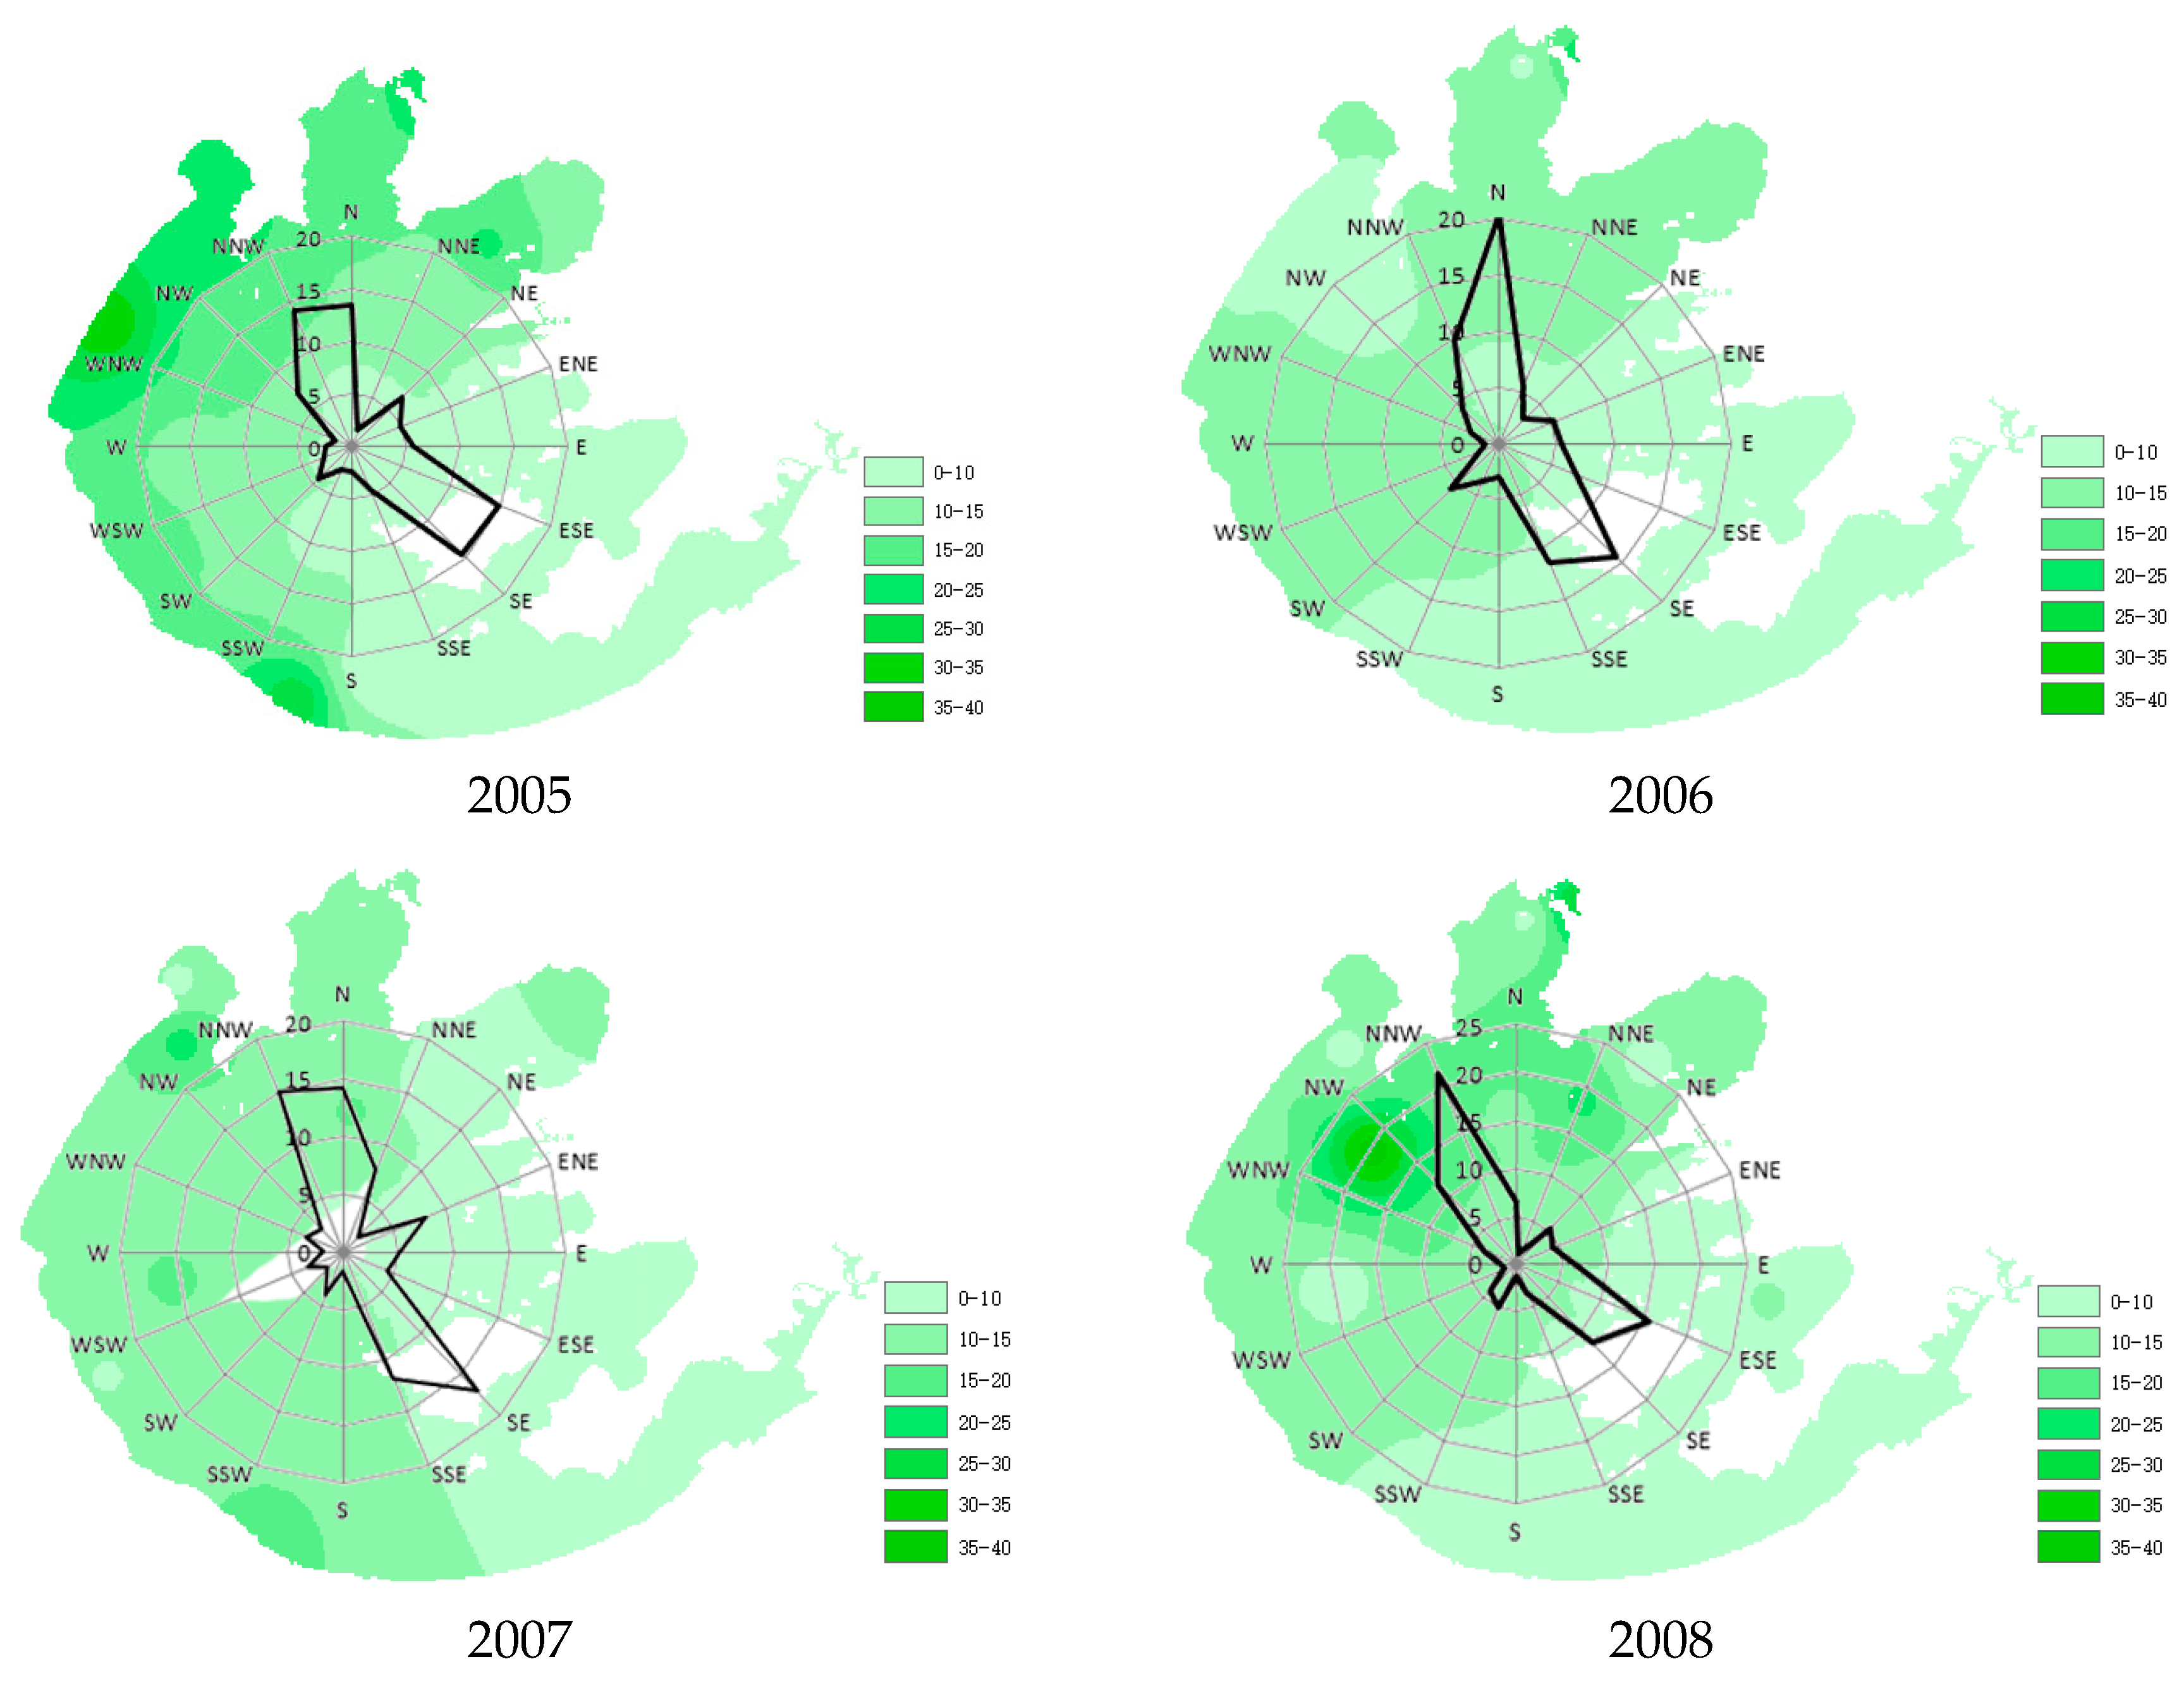
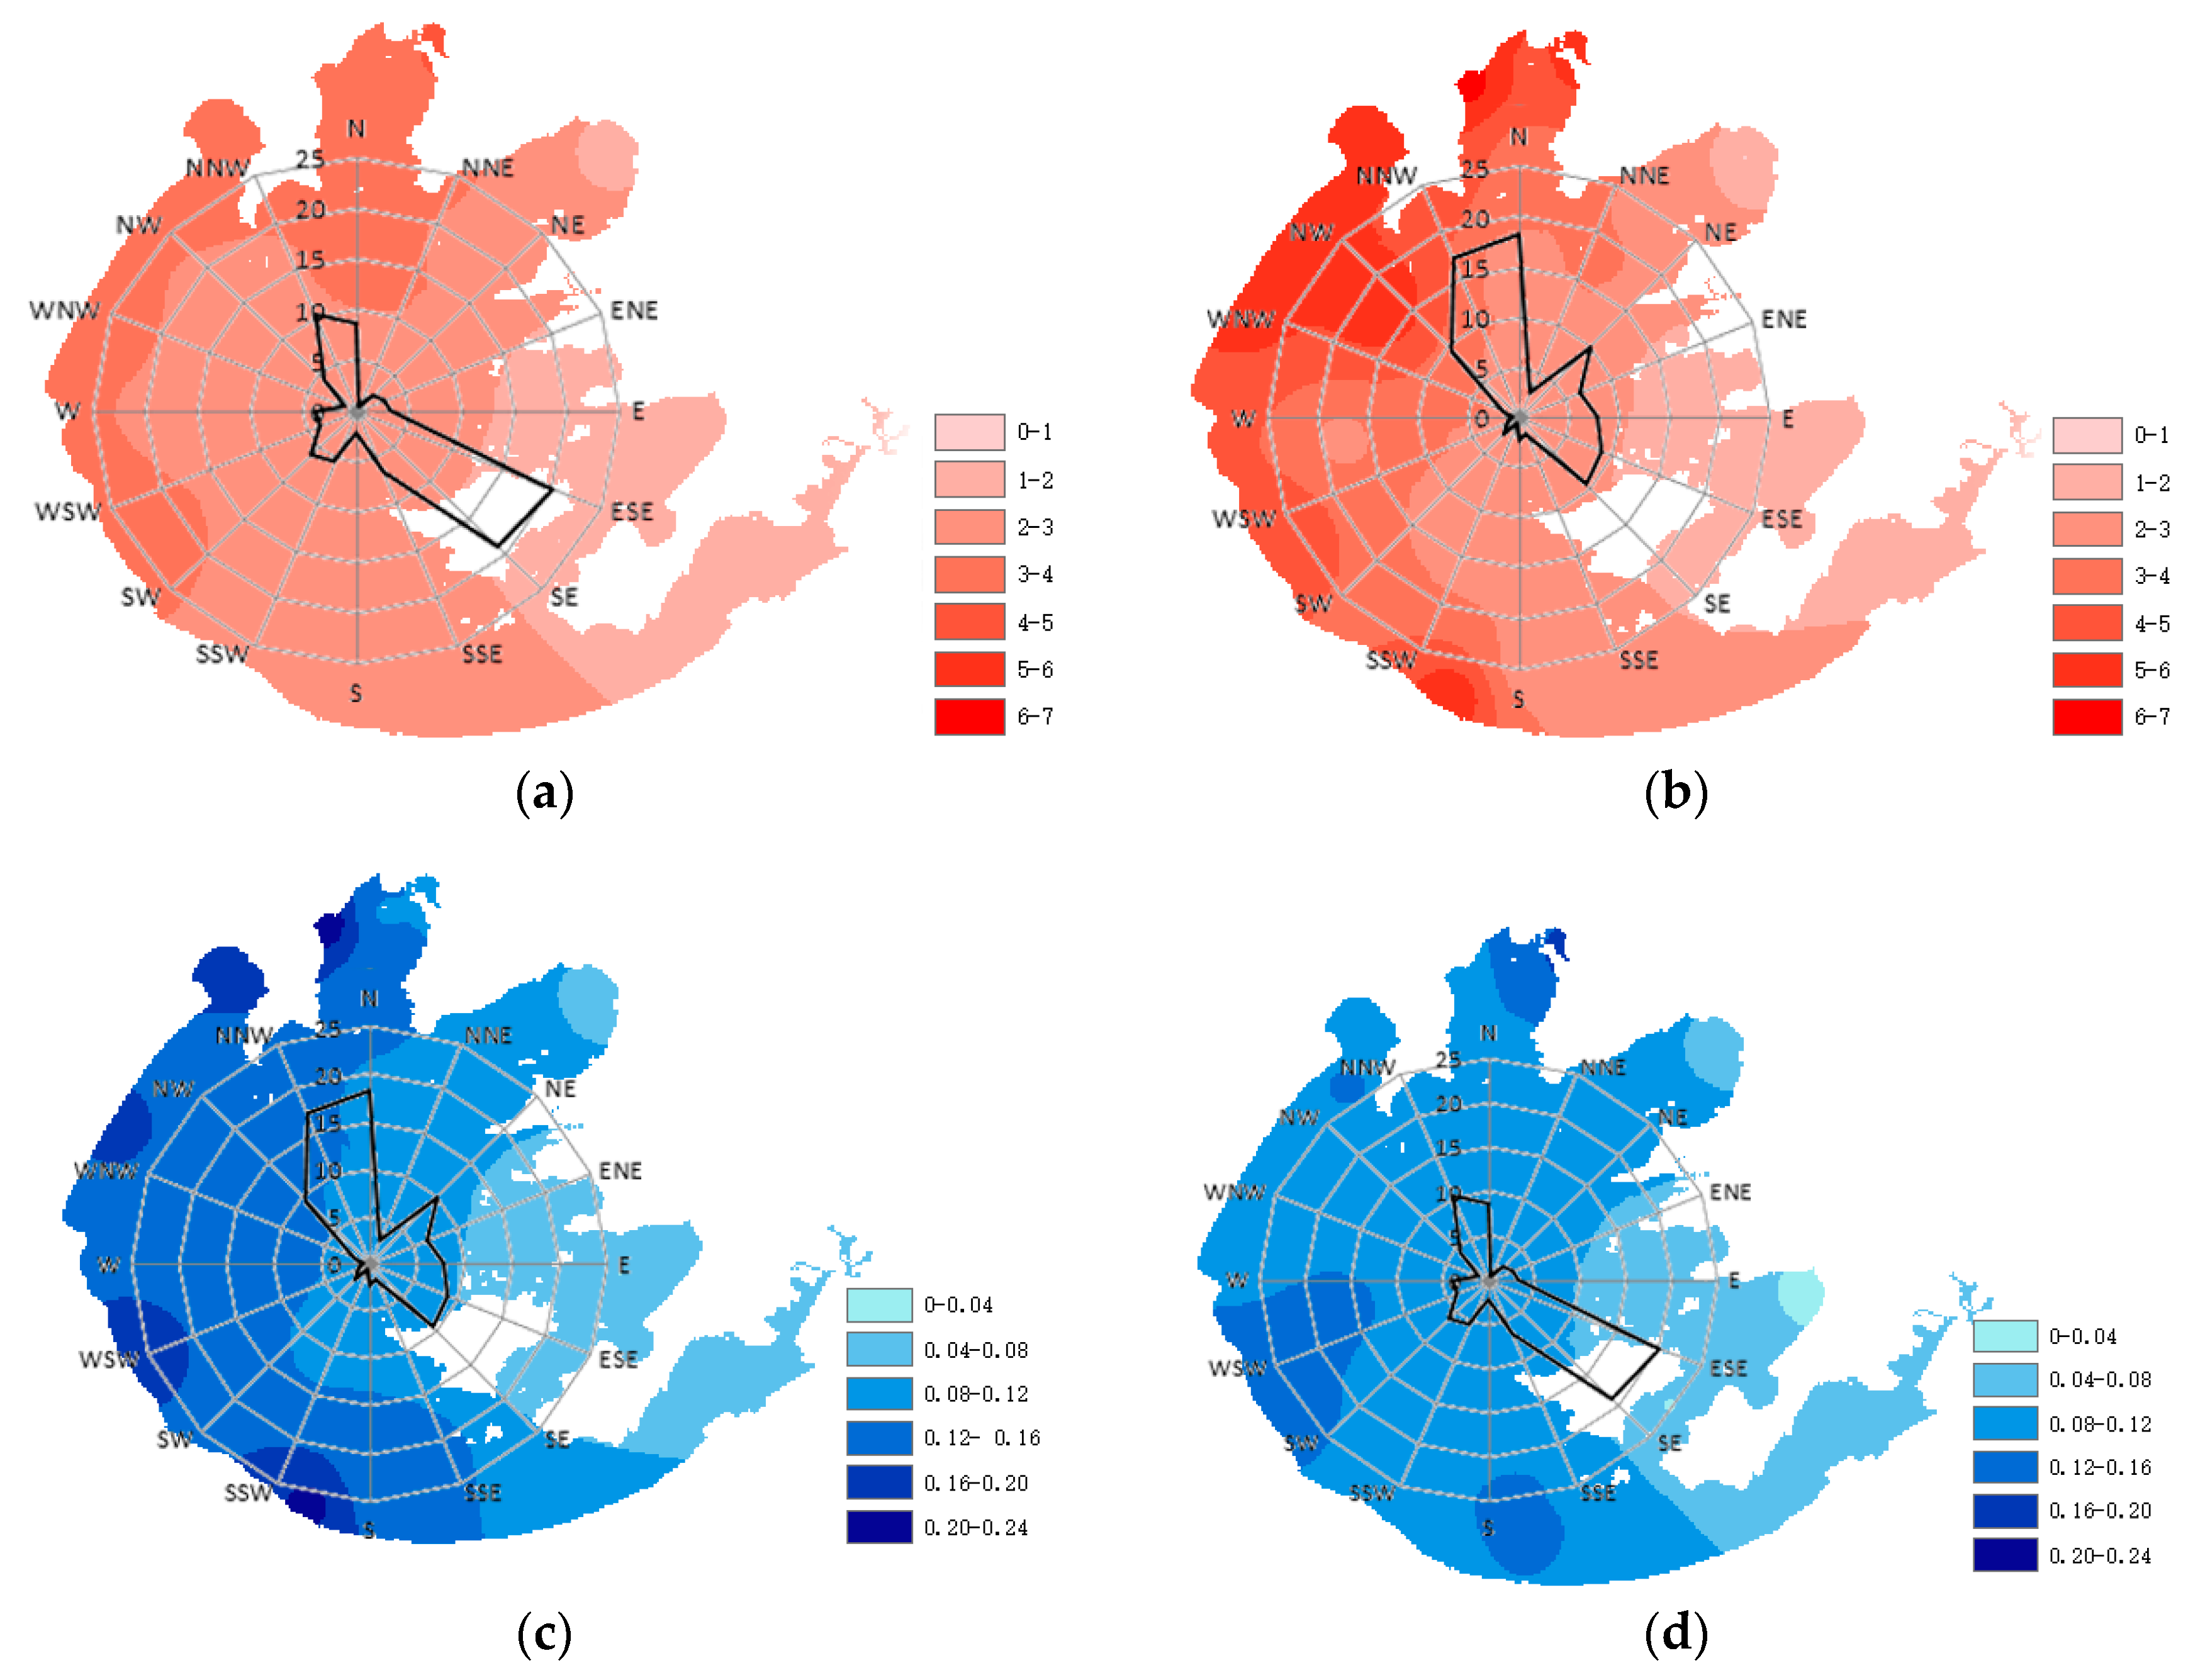
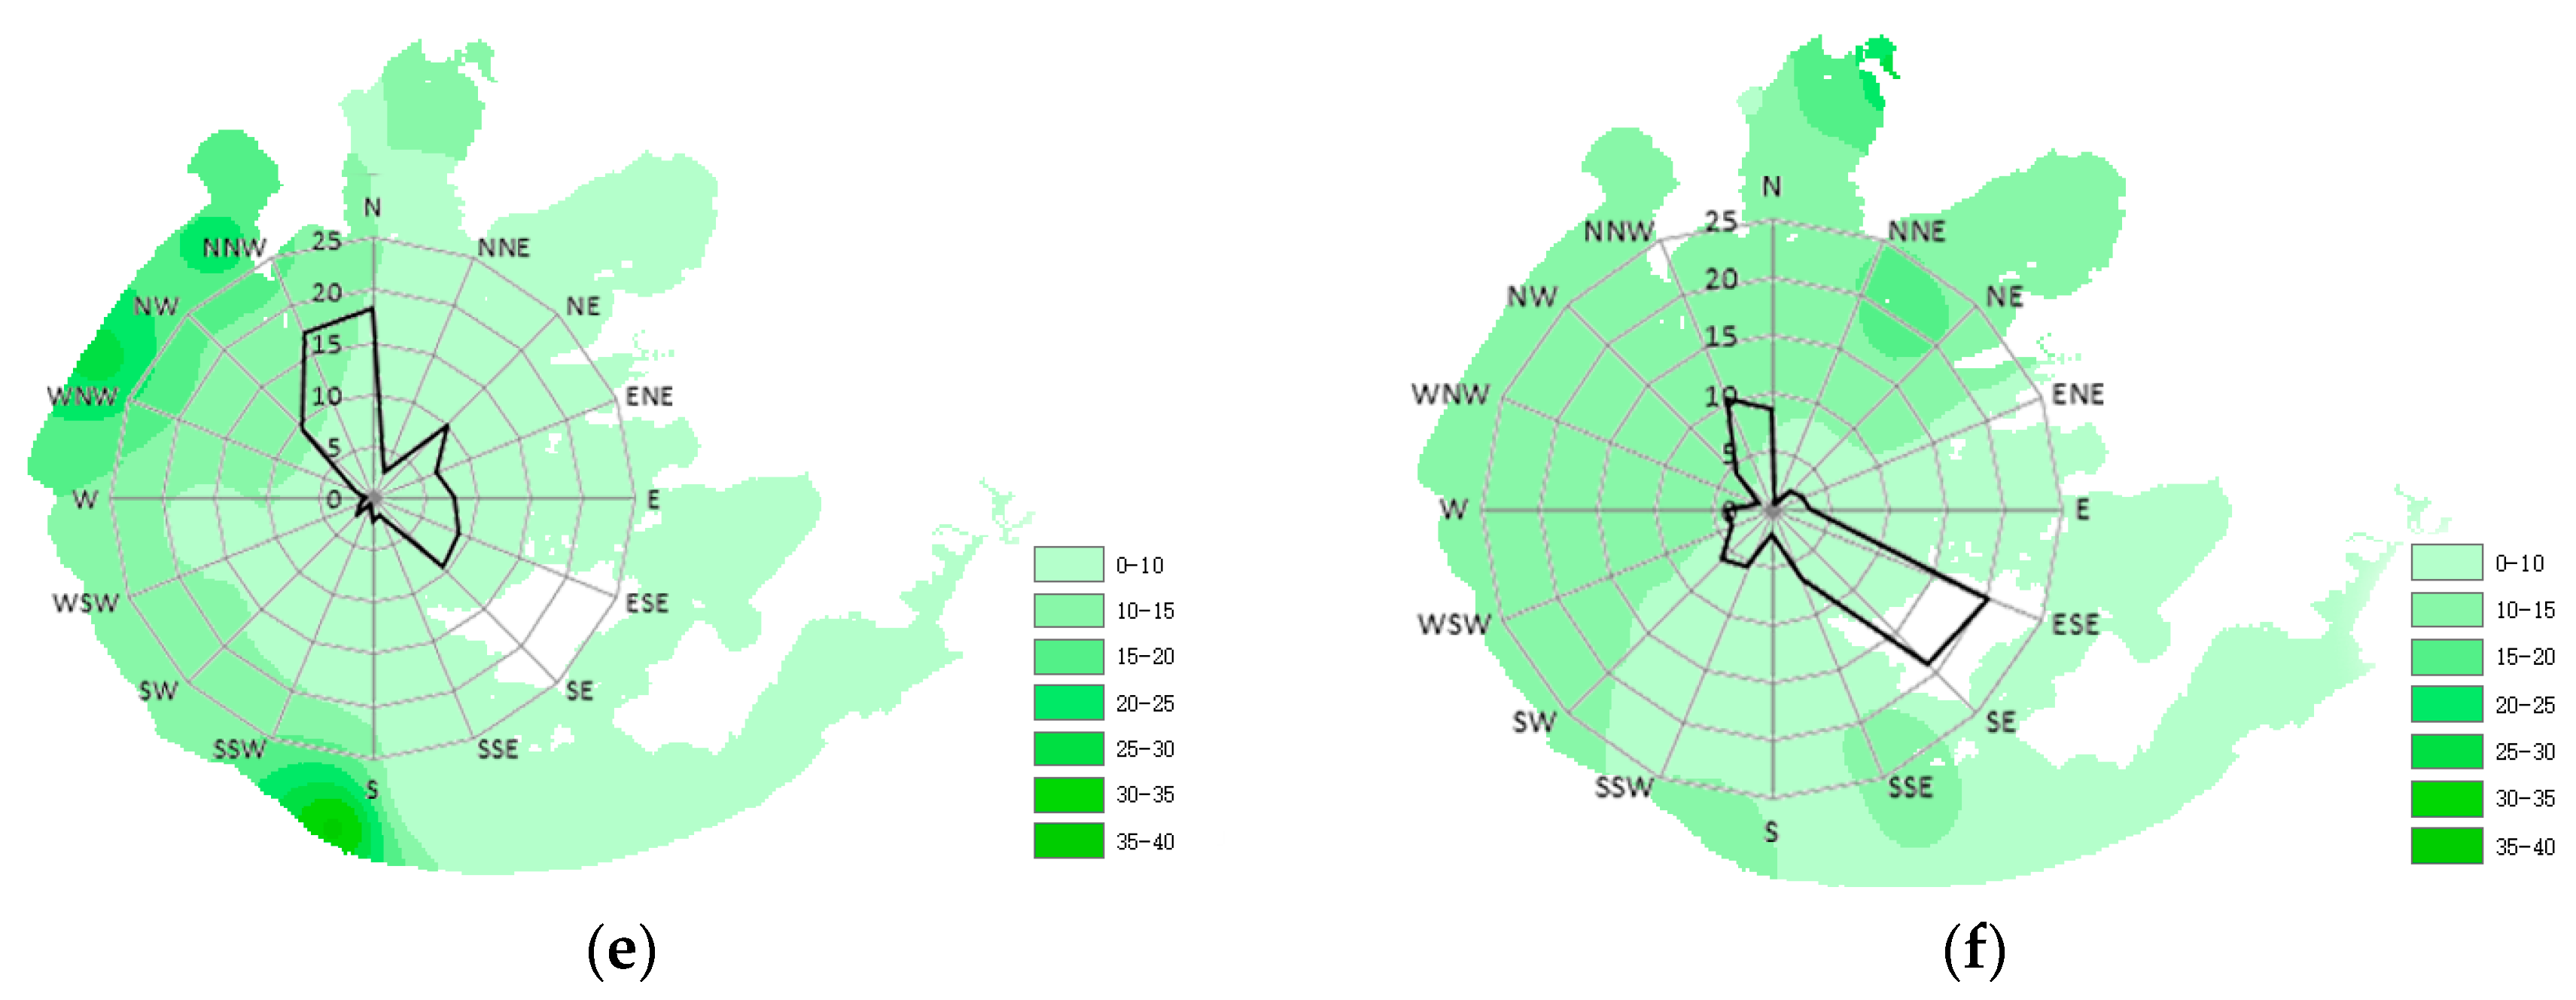
3.2. Effects of Wind Direction on Water Quality

At the annual scale, the water quality exhibited an obvious spatial pattern from the northwest to southeast of Lake Tai (Figure 4, Figure 5 and Figure 6). The water quality in the northwestern Zhushan Bay and Meiliang Bay was worse than that in Central Lake, which in turn was worse than that in the southeastern East Lake. Averaged across the study period (January 2005 to September 2011), the Chl-a concentration in the bays was almost 4.5-times higher than that in East Lake, while the TN and TP concentrations in the bays were more than twice higher than those in East Lake (Table 2). For a given year (e.g., 2005), the more prevalent southeastward winds in spring and summer tended to blow nutrients and Chl-a toward northwest into the bays (Figure 7a,c,e), whereas the more prevalent northwestward winds in fall and winter tended to blow nutrients and Chl-a out of the bays into Central Lake and East Lake (Figure 7b,d,f). This was true for other study years, as well. As a result, the area with worse water quality in the northwestern part of the lake was larger in warm seasons than across the year (Figure 7a versus Figure 4a; Figure 7c versus Figure 5a; Figure 7d versus Figure 6a), while the spatial distribution of water quality in fall and winter became more uniform than that across the year (Figure 7b versus Figure 4a; Figure 7d versus Figure 5a; Figure 7e versus Figure 6a). That is, across the lake, the spatial distribution of water quality was more heterogeneous in spring and summer than that in fall and winter. However, for a given location, the water quality could be either better or worse in warm seasons than in cool seasons, probably as a result of combined effects of wind-induced drifting, mixing and resuspension in addition to sporadic wastewater discharge.

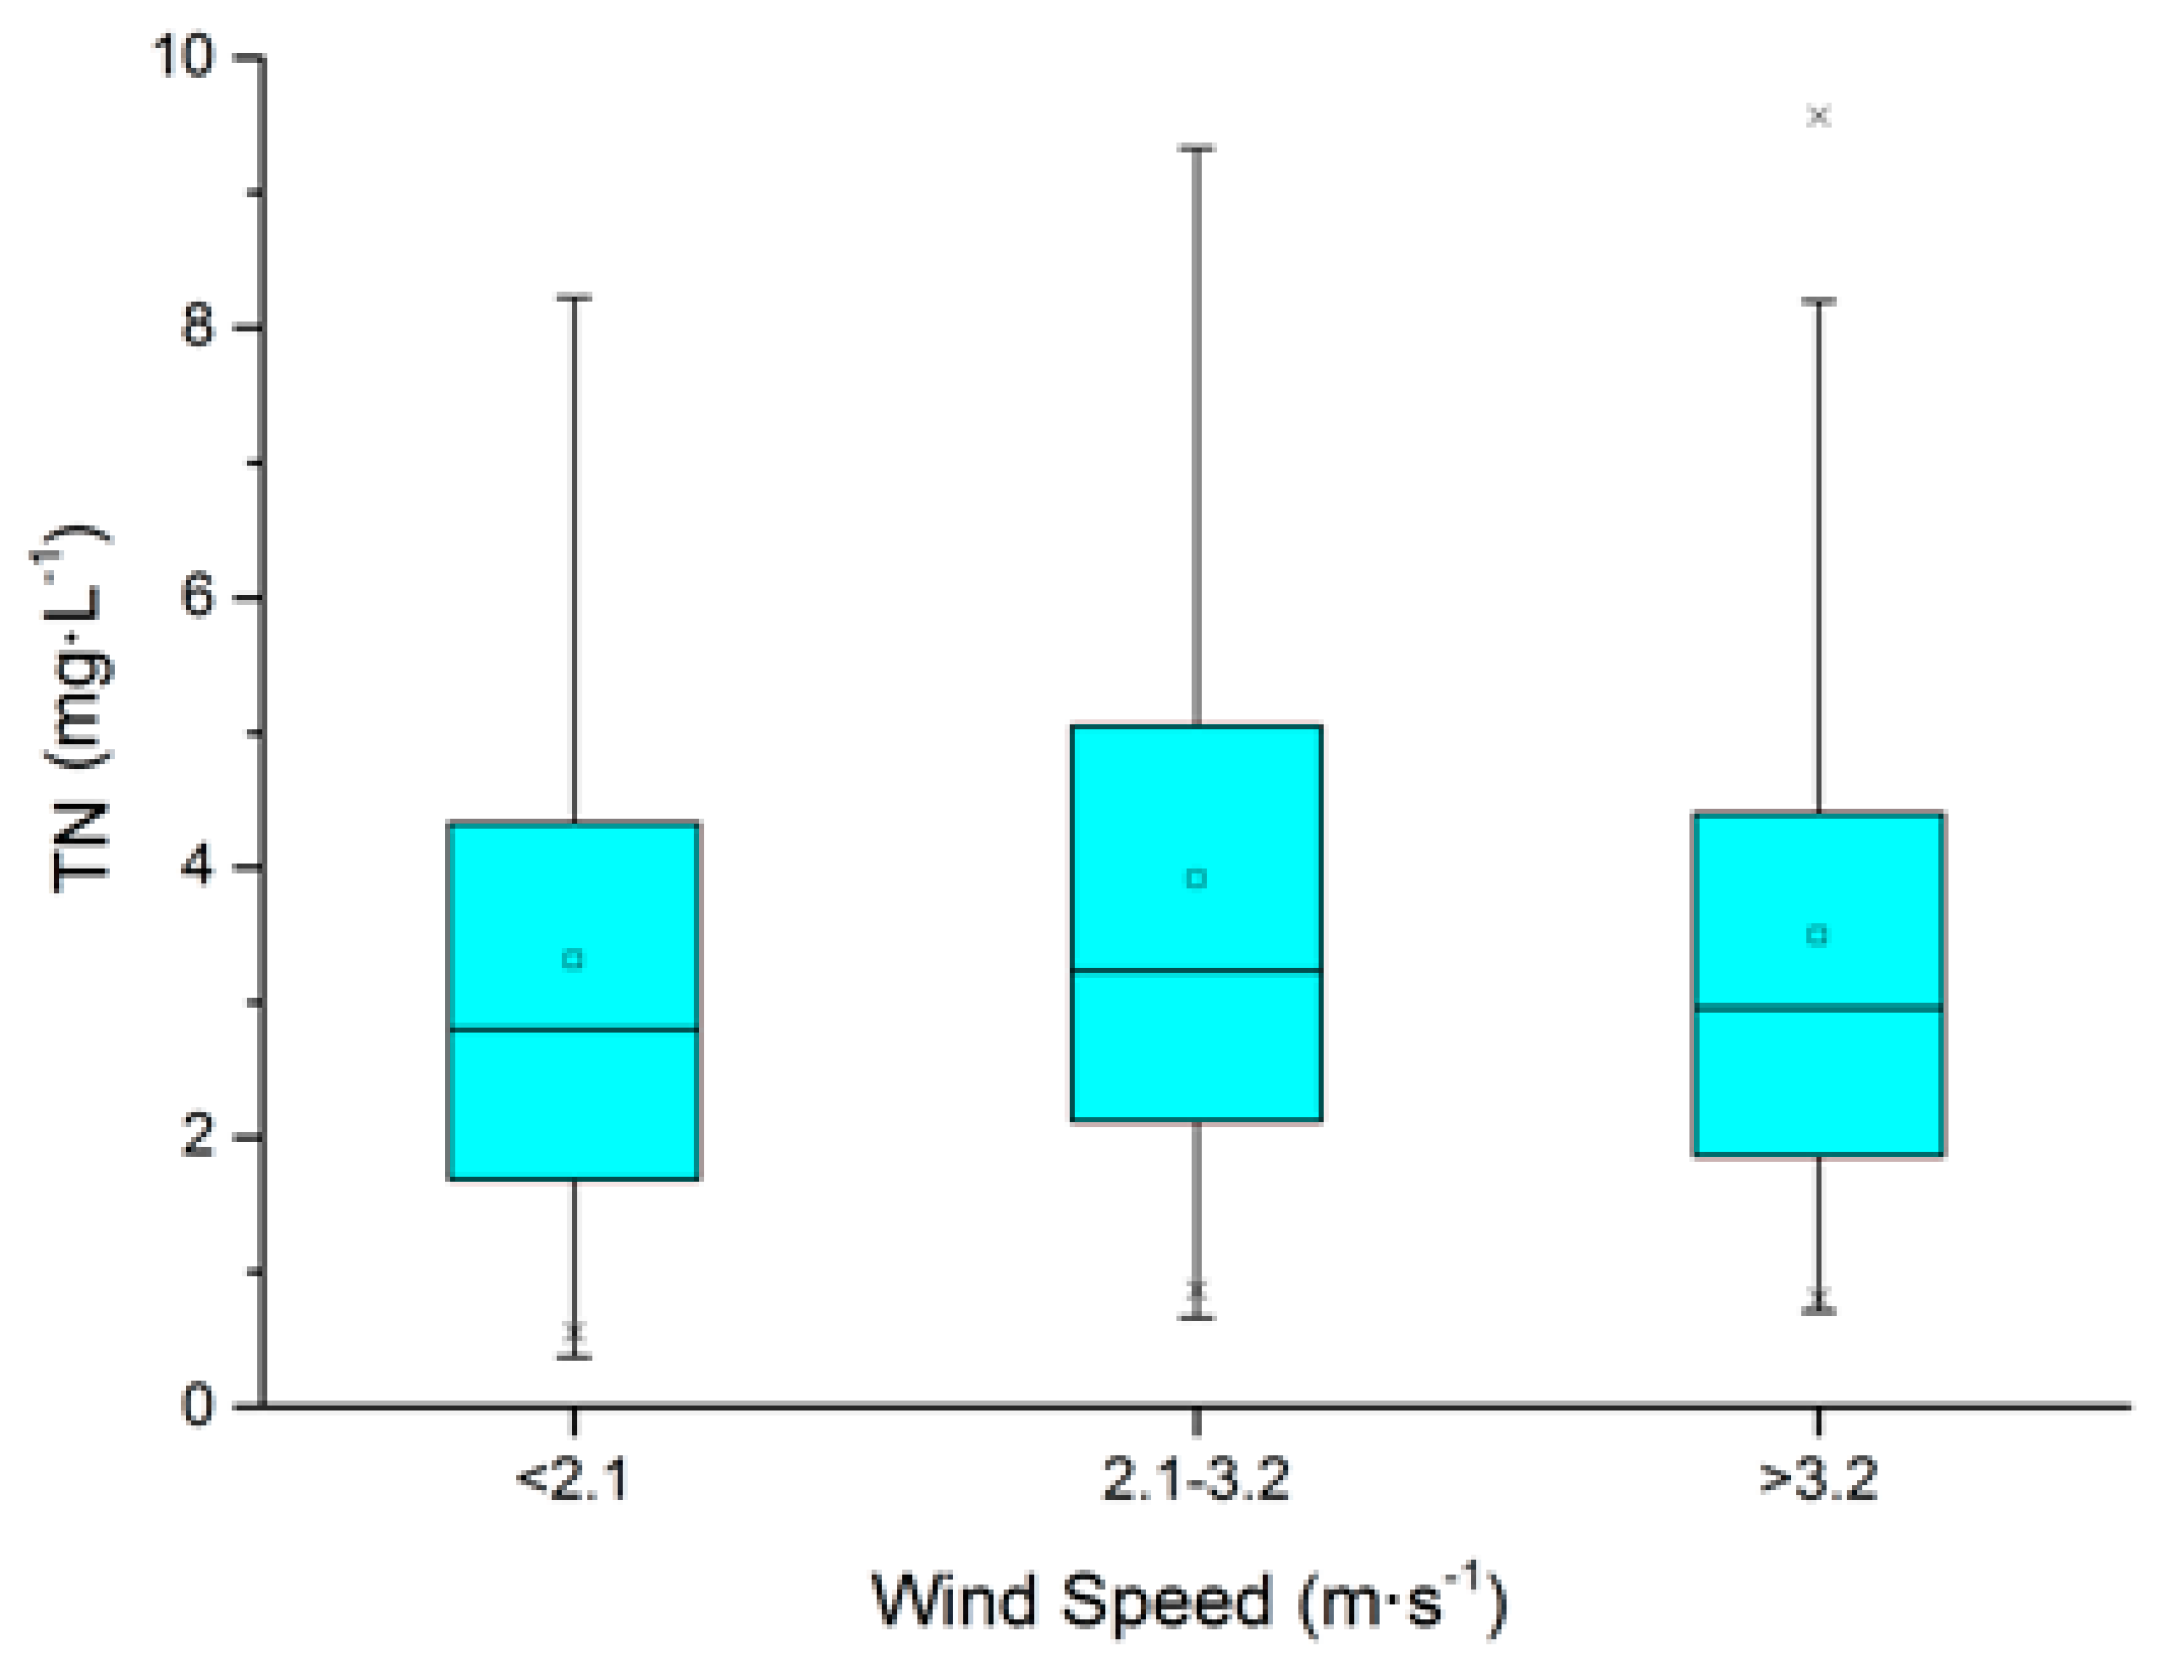
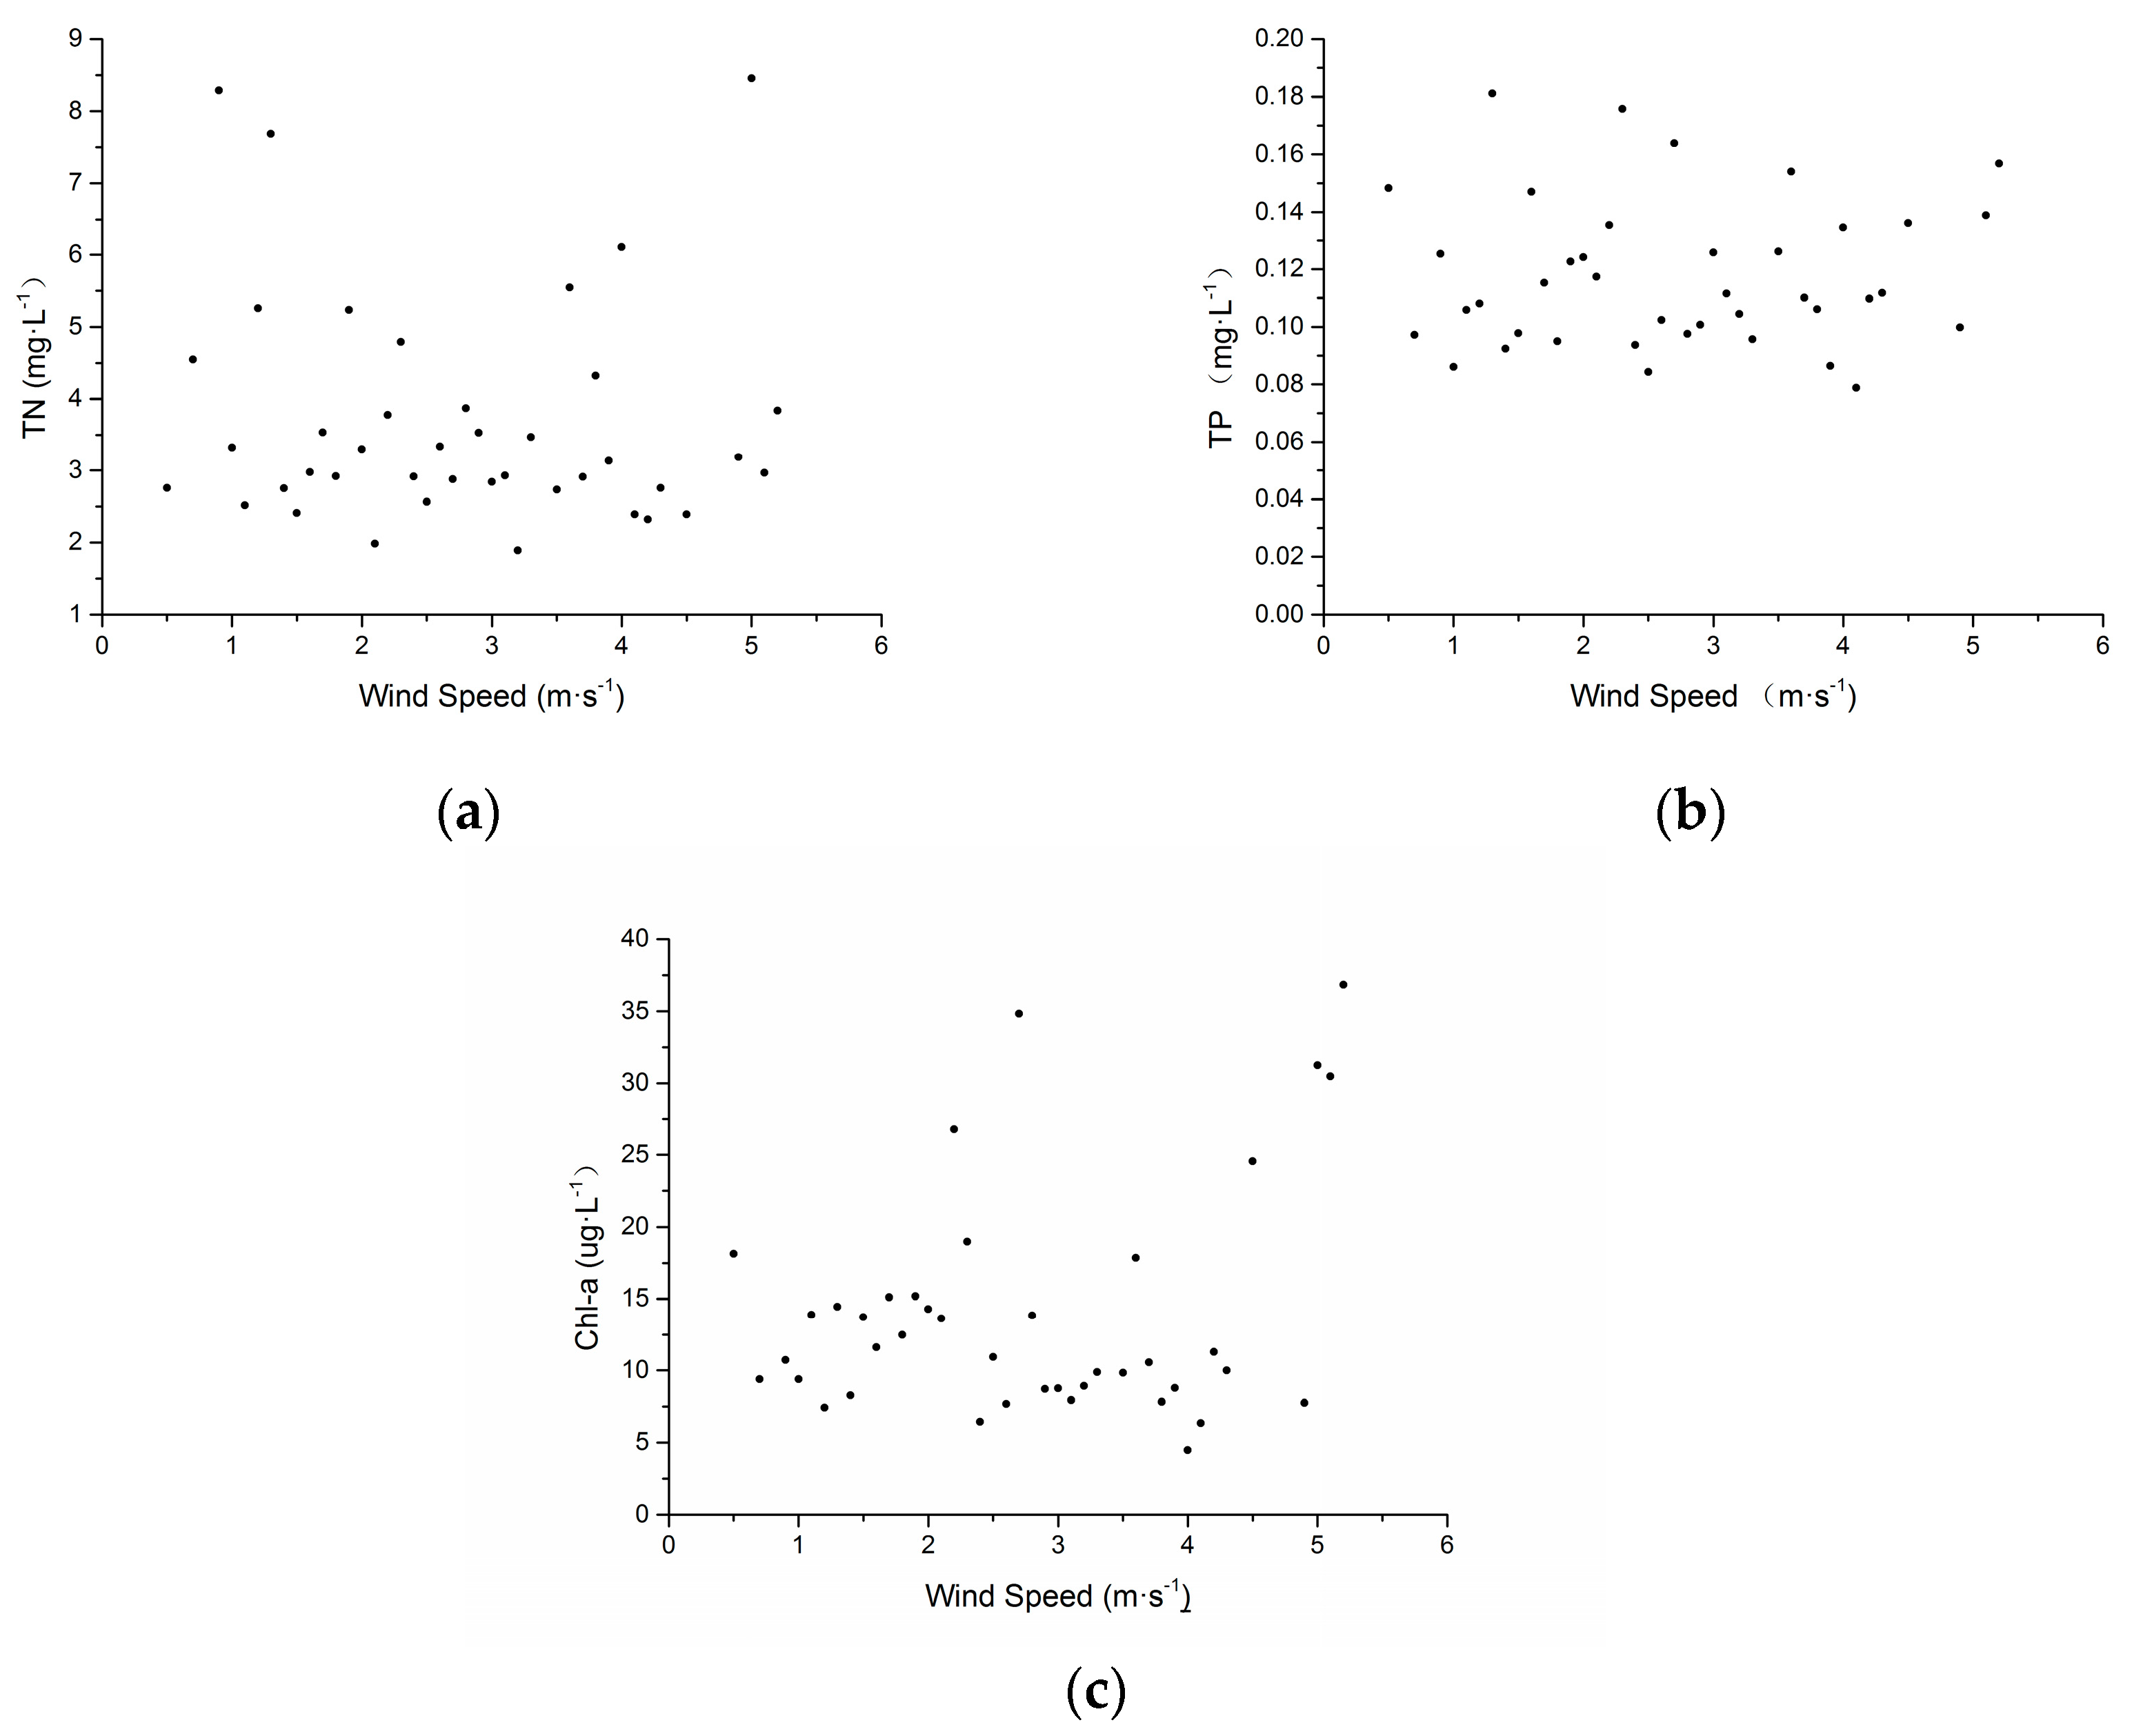
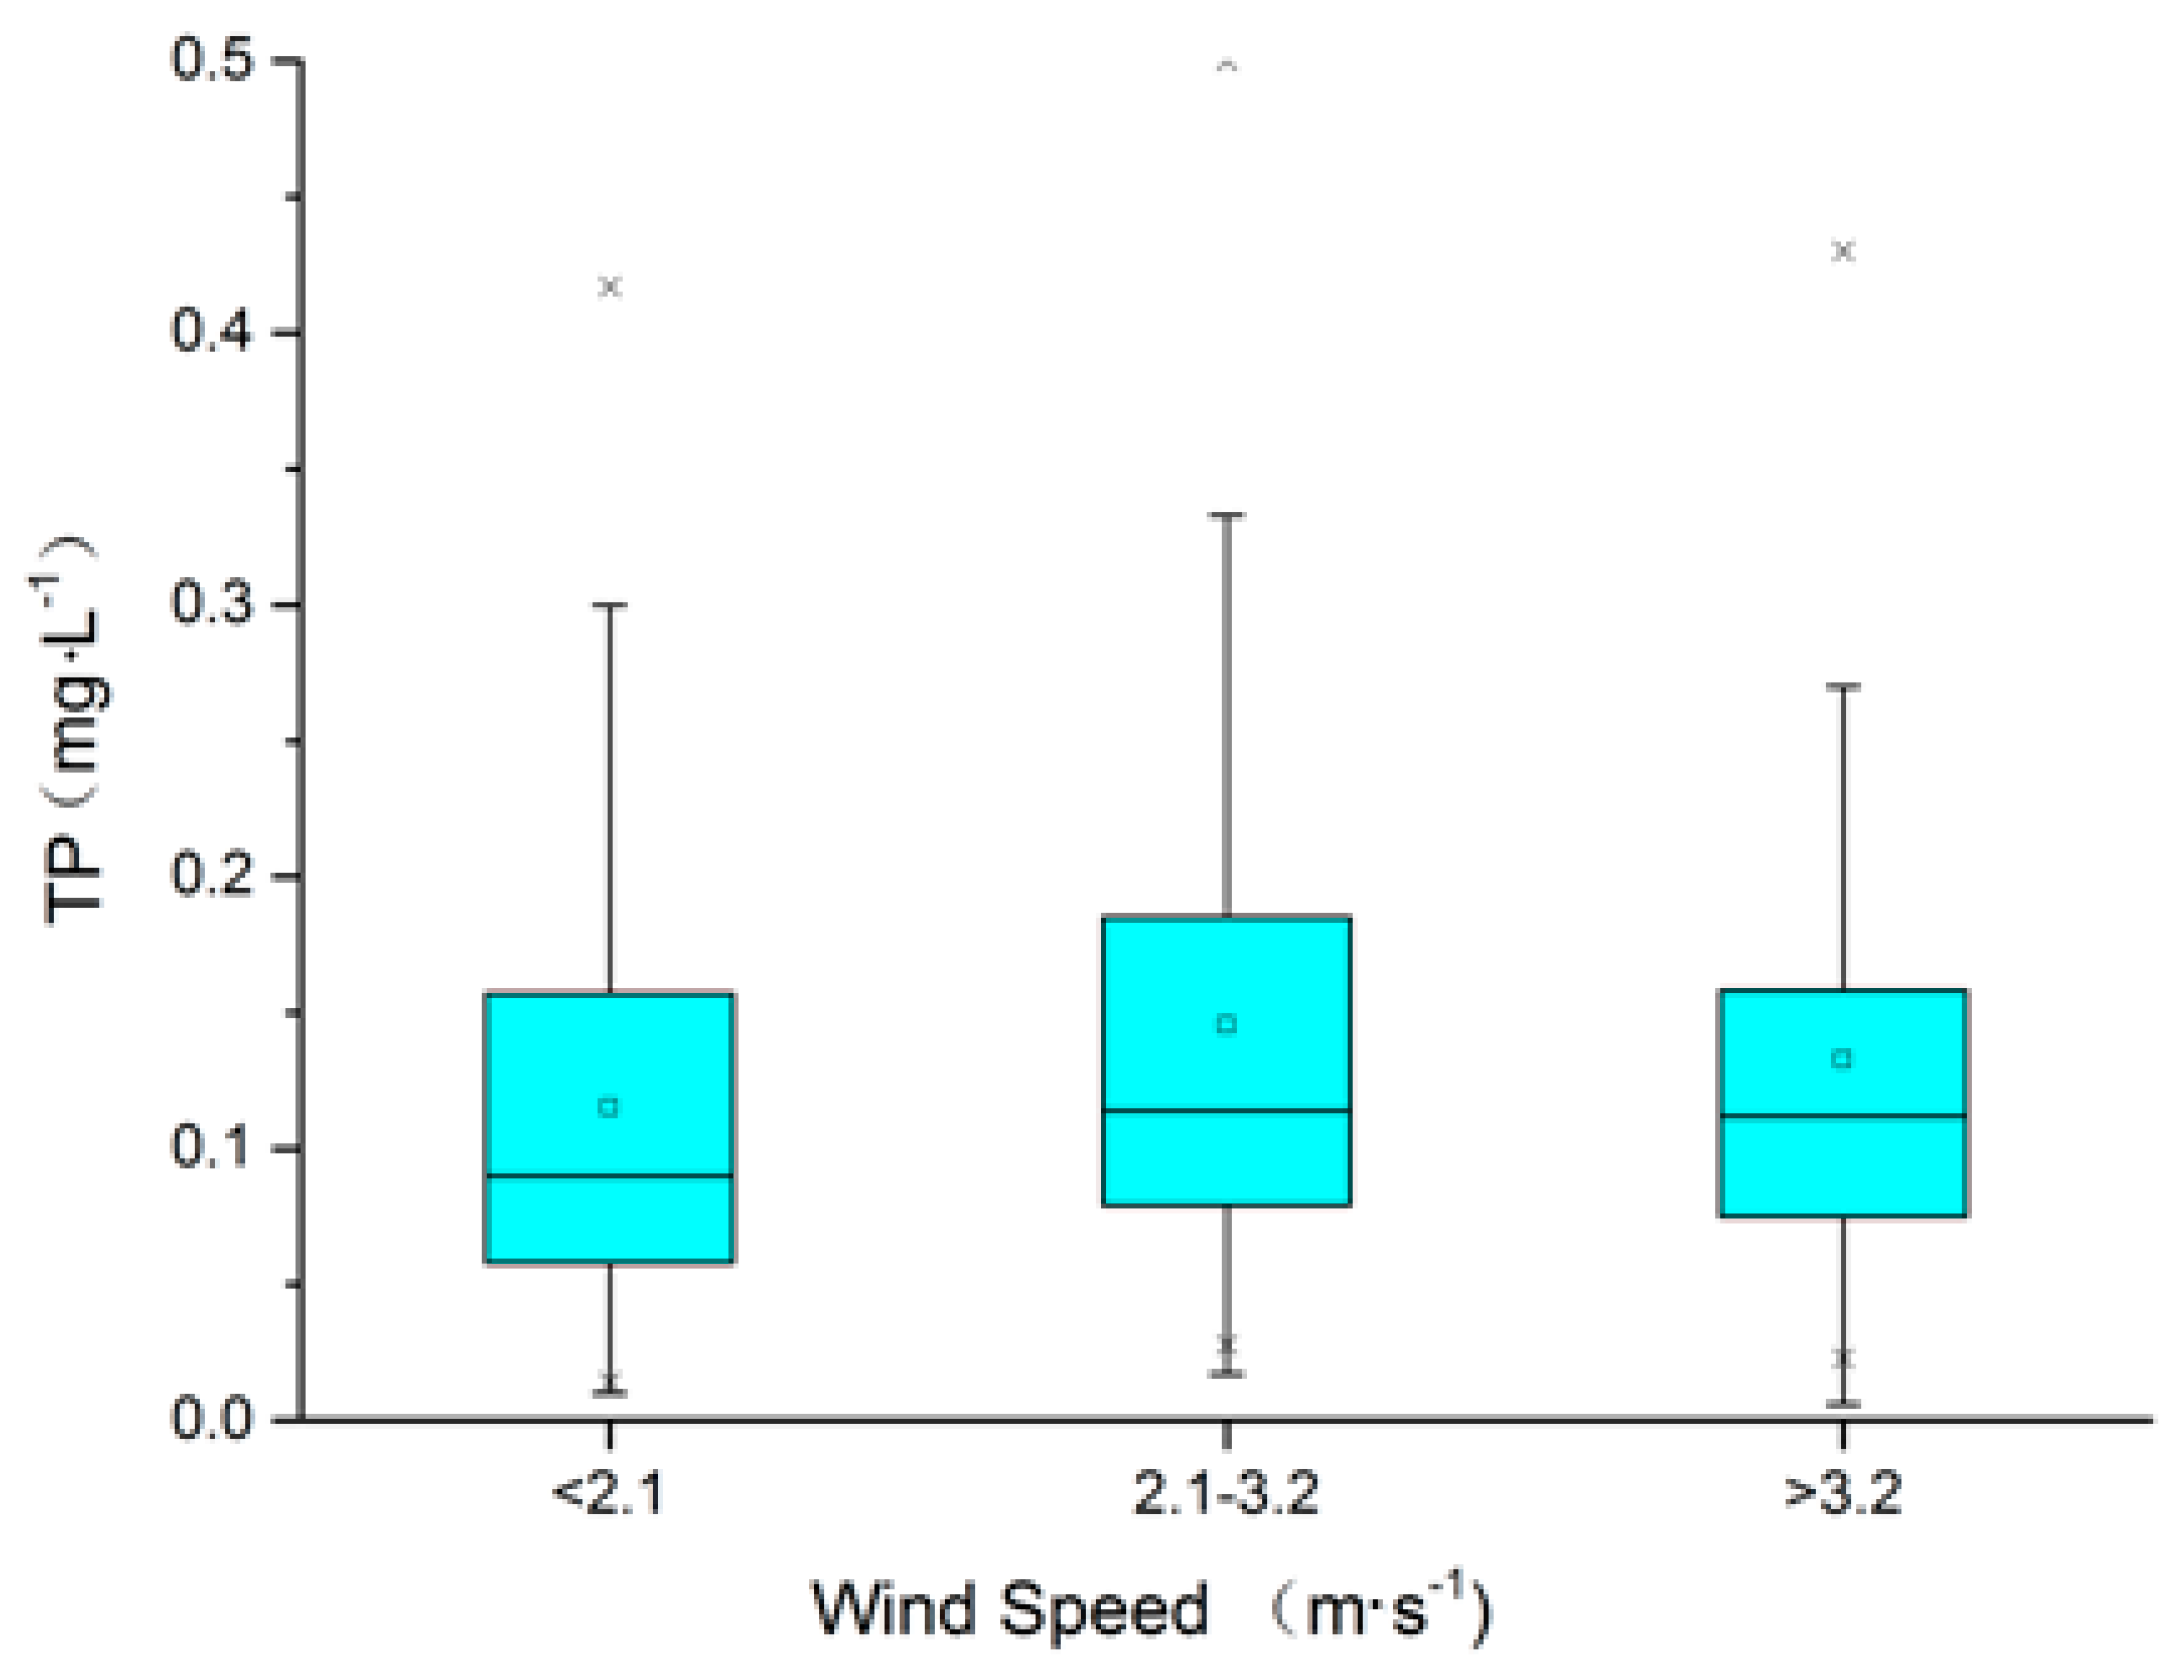
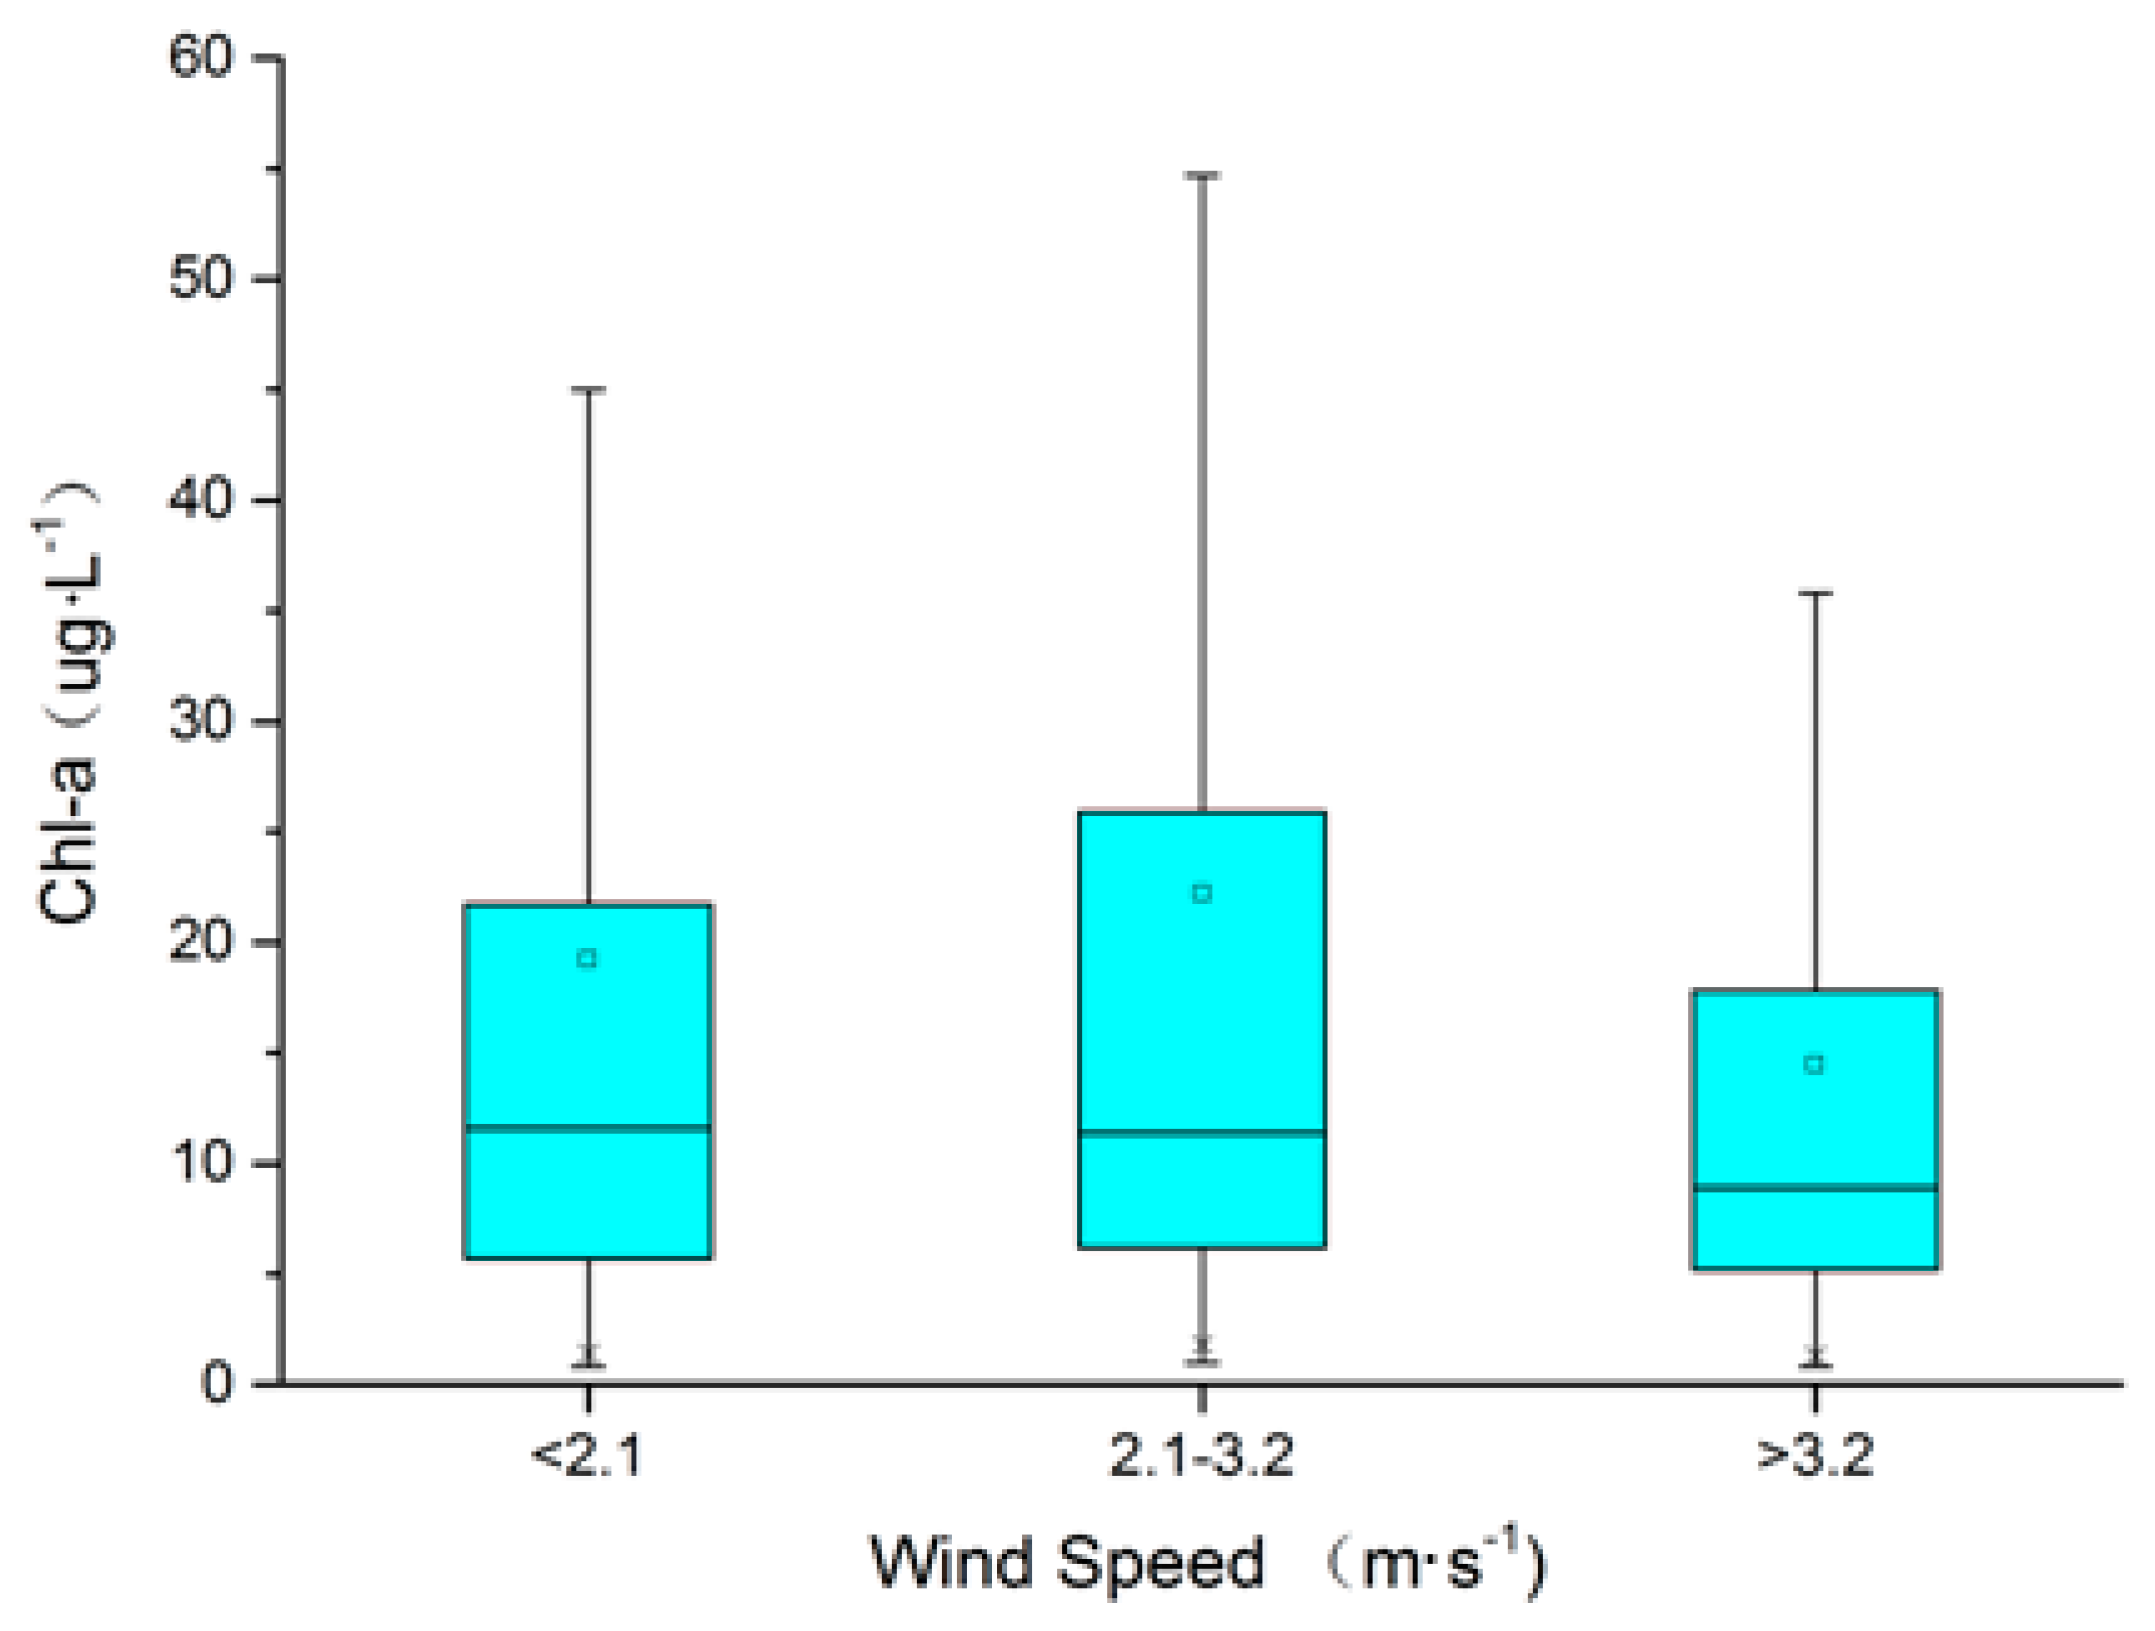
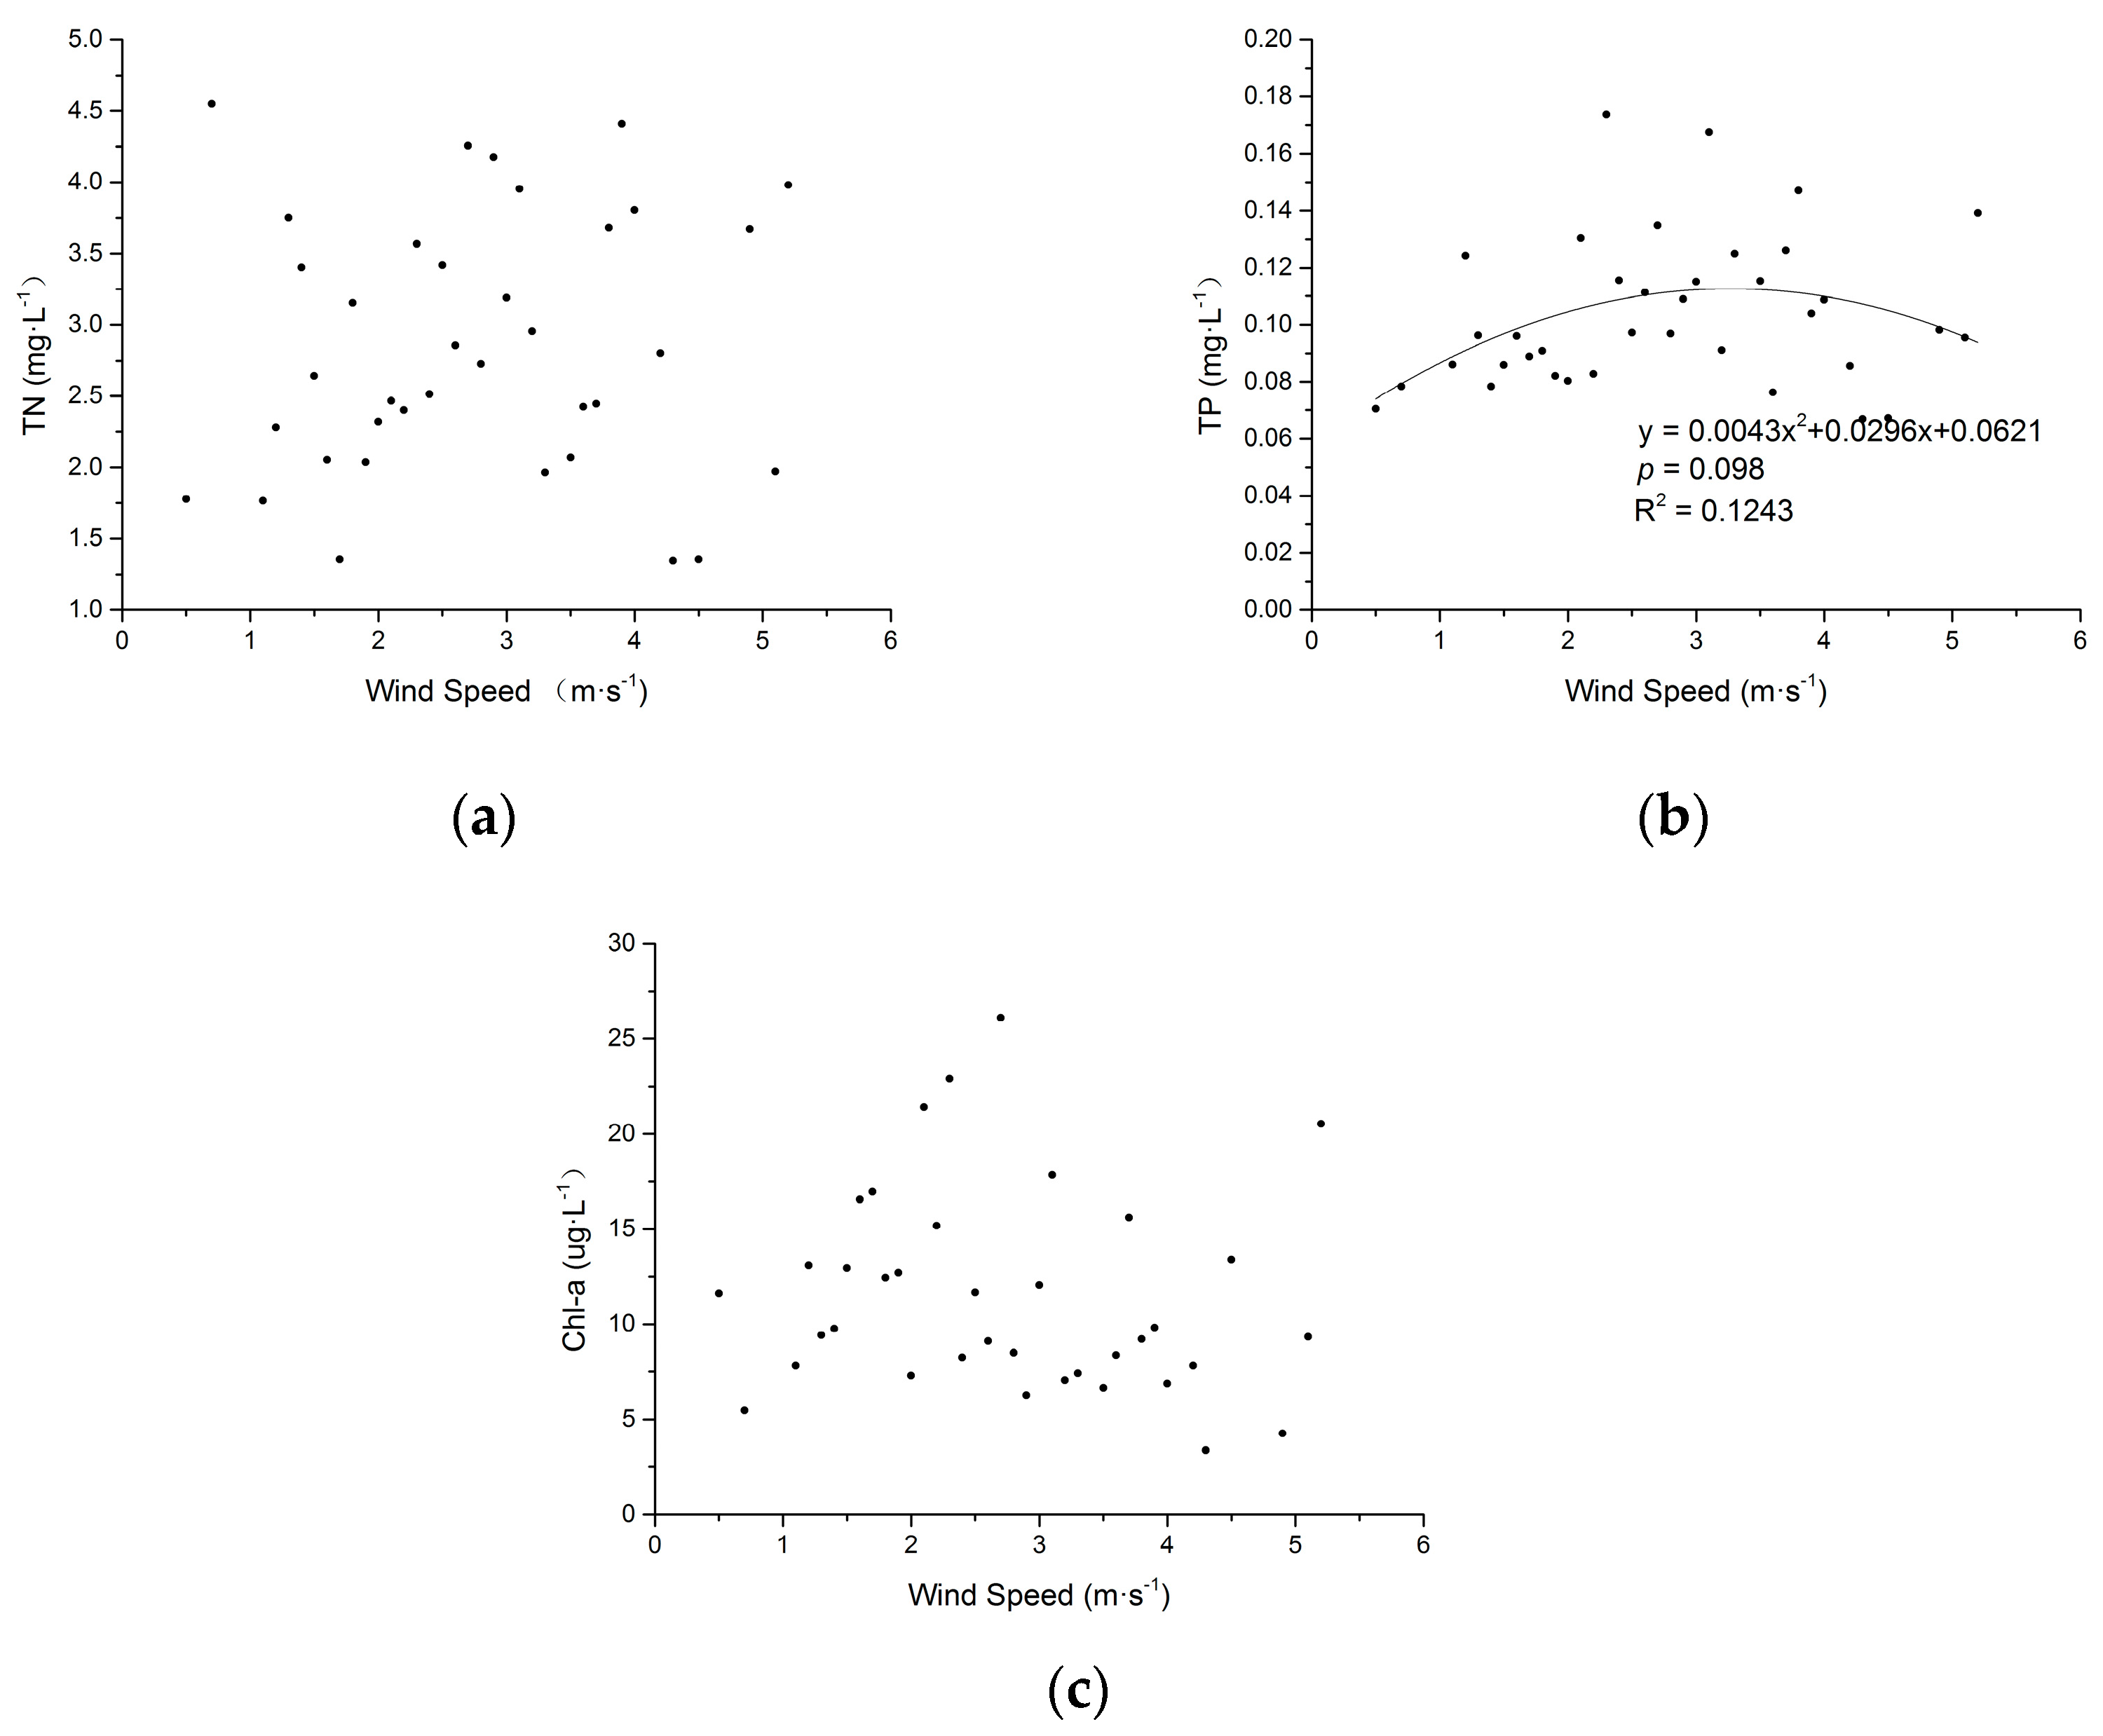
3.3. Effects of Wind Speed on Water Quality

Based on the effects on water quality, the wind speed was classified into three groups: below 2.1 m·s−1 (i.e., low speed or LS), 2.1–3.2 m·s−1 (i.e., mild speed or MS) and over 3.2 m·s−1 (i.e., high speed or HS). The TN concentration for the MS group was highest, while the TN concentration for the LS group was lowest (Figure 8). The TN concentration differences among the three groups were statistically significant (p-value < 0.01). The mean TN concentrations for the LS, MS and HS groups were 3.31, 3.91 and 3.31 mg·L−1. Similarly, the TP concentration for the MS group was highest, while the TP concentration was lowest (Figure 9). The TP concentration differences among the three groups were statistically significant (p-value < 0.049). The mean TP concentrations for the LS, MS and HS groups were 0.115, 0.145 and 0.133 mg·L−1. In contrast, the Chl-a concentration for the LS group (mean 19.22 μg·L−1) was statistically the same as that for the MS group (mean 22.19 μg·L−1) (p-value = 0.077), but they were significantly higher than that for the HS group (14.47 μg·L−1) (p-value < 0.01), as shown in Figure 10.
Although the correlations between water quality and wind speed were not strong, as indicated by the large scatteredness (Figure 11 and Figure 12), when examined separately for the bays and other parts of the lake, the relations between water quality and wind speed were found to follow somewhat opposite variation patterns. In the bays, the median TN or Chl-a concentration tended to decrease and then increase with the increase of wind speed (Figure 11a,c), whereas the median TP concentration tended to gradually decrease with the increase of wind speed (Figure 11b). The lowest median TN and Chl-a concentrations likely occurred at an MS wind speed. On the other hand, in Central Lake and East Lake, the median concentrations of TN, TP and Chl-a tended to increase and then decrease with the increase of wind speed (Figure 12). The highest concentrations likely occurred at an MS wind speed. As a result of these opposite patterns, when the water quality was examined for the lake as a whole, the effects of wind speed on water quality might be classified into the three groups discussed above. The TN and TP concentrations were highest for the MS group, indicating that Central Lake and East Lake might be the primary sources for TN and TP, whereas the Chl-a concentration had a consistent increasing trend with wind speed and was highest for the HS group, indicating that the bays might be the primary sources for Chl-a.

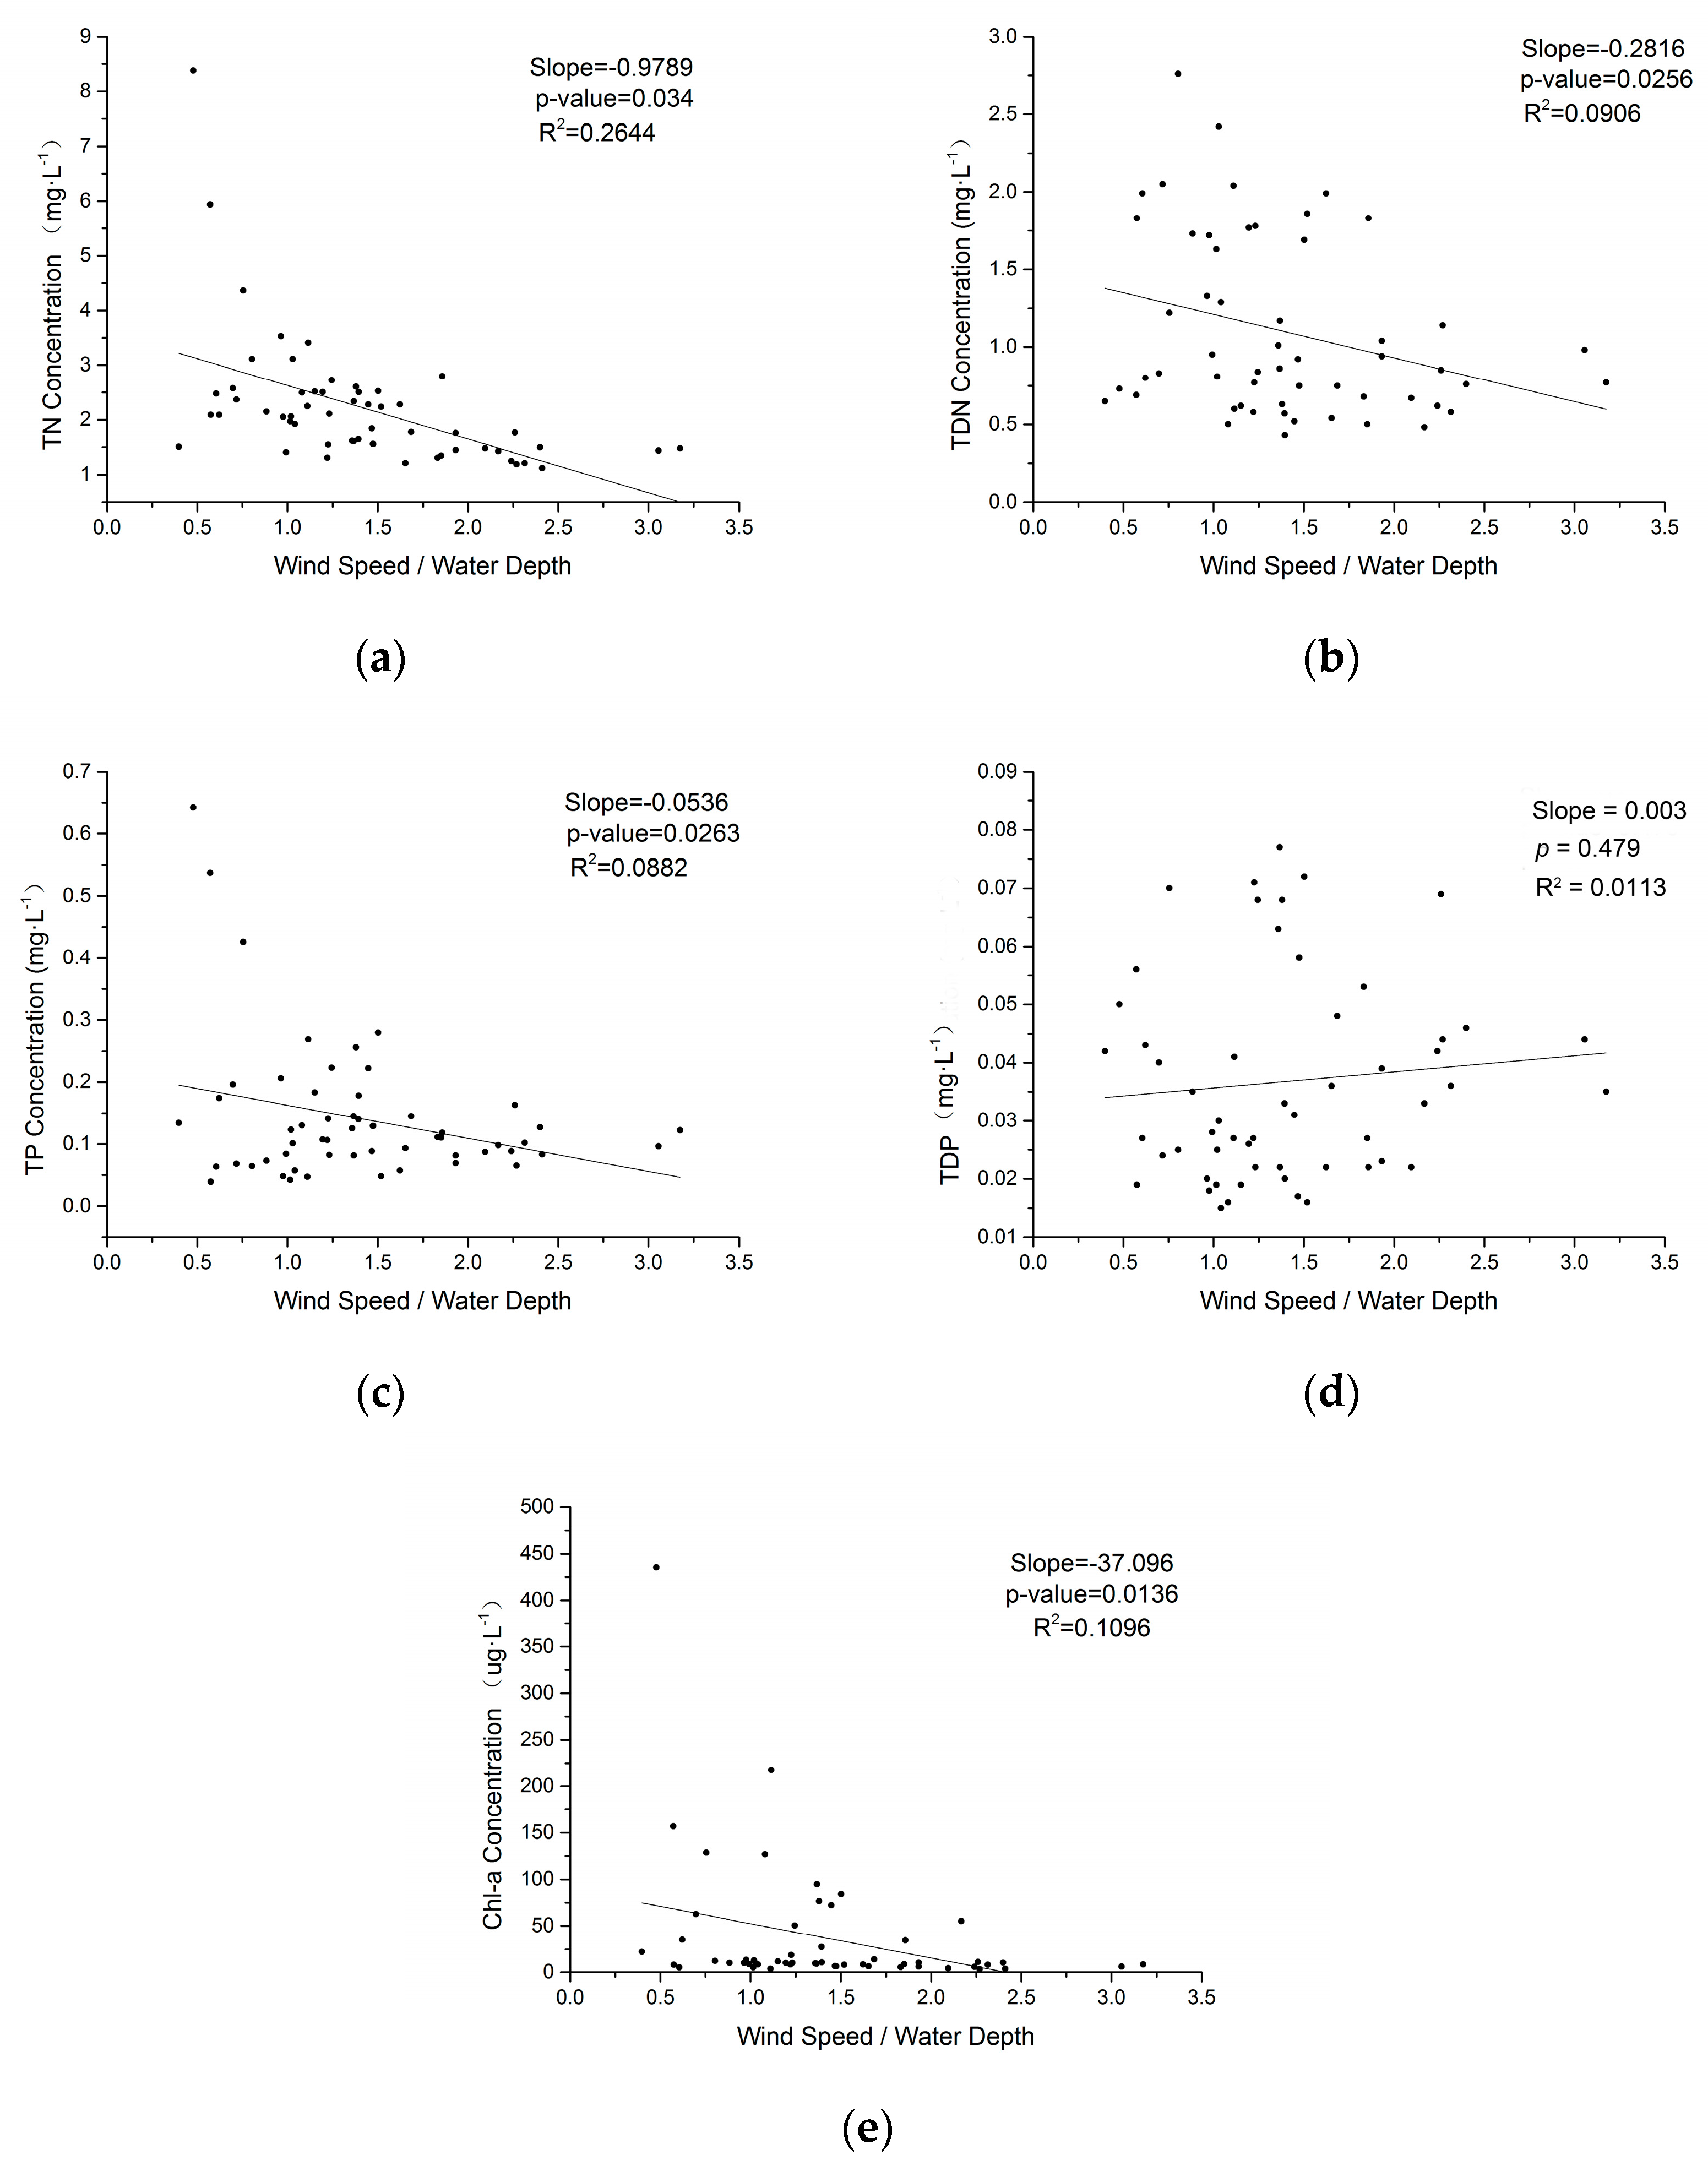
3.4. Effects of Wind-Induced Shear Stress on Water Quality

As mentioned above, the ratio of wind speed to water depth can be used as a surrogate for the vertical distribution of wind-induced shear stresses [34]. For Meiliang Bay, the shear stress was found to be beneficial to the water quality. Although they were weakly correlated (coefficient of determination R2 < 0.27) (Figure 13), the shear stress had a significant negative influence on the water quality (p-value < 0.034), except for TDP. The concentrations of TN, TDN, TP and Chl-a tended to become lower with increasing shear stress. However, the TDP concentration was visually not affected much by shear stress (Figure 13d).

4. Discussion

The concentrations of TN, TP and Chl-a exhibited an obvious spatial pattern across Lake Tai: they were highest in the bays located in the northwest, but tended to decrease toward the southeastern part of the lake. As mentioned above, most of the wastewater was discharged into the lake through the drainage system (e.g., channels and pipelines) located in the northwestern part [32,33]. This may be the primary reason for the bays to have the highest concentrations of TN, TP and Chl-a. However, the prevalent northwestward winds in cool seasons (i.e., fall and winter) and southeastward winds in warm seasons (i.e., spring and summer) could redistribute TN, TP and Chl-a across the lake. When external wastewater was discharged into the northwestern part of the lake, the northwestward winds in cool seasons might blow nutrients and Chl-a southeasterly into the other parts. On the other hand, the southeastward winds in warm seasons could blow nutrients and Chl-a back into the bays, making the water quality in the bays worse in warm than cool seasons. The prevalent southeastward winds in spring and summer might also cause the accumulation of Chl-a in the bays: as cyanobacteria float on the lake surface, they are easily drifted by wind-induced shear force and so tend to be pushed back into the bays (especially Meiliang Bay and Zhushan Bay).
The correlations between water quality and wind speed were found to be not strong, as indicated by the large scatteredness. This is because a number of other factors also affect water quality [34]. For instance, depending on the timing, amount, location and constituents of wastewater discharge, the TN and TP concentrations could be elevated almost instantaneously, in particular in the bays and lake areas along the shorelines. Furthermore, water temperature can influence the nitrification-denitrification process and Chl-a growth, changing the TN and Chl-a concentrations. Nevertheless, winds can affect concentrations of TN, TP and Chl-a as a result of drifting, mixing and/or resuspension of bed sediments. The drifting effect is mainly caused by the wind-induced shear stress on the lake surface, whereas the resuspension likely occurs once the shear stress transferred downward to the lake bed is larger than the critical shear strength of the bed sediments [39,40]. The mixing effect is due to the shear stress transferred into the water column. Given that the TN, TP and Chl-a concentrations are determined using water samples near the lake surface, they are higher than the corresponding concentrations at a deeper depth of the water column [9].
For the bays where the water depth is relatively deeper, the drifting and mixing effects might be dominant for LS and MS winds, which have a speed below 3.2 m·s−1, while the resuspension effect could start to play a role for HS winds, which have a speed above that. Because of the drifting and mixing effects, the water near the lake surface was mixed with the water at deeper depths, diluting the concentrations of TN, TP and Chl-a, whereas the resuspension effect of winds with a speed of above 3.2 m·s−1 might cause the release of nitrogen from the bed sediments and thus the increase of TN. The possible reason for the TP concentration to consistently decrease is that the bed sediments of the bays may have low phosphorus content. In contrast, for Central Lake and East Lake, where the water depth is relatively shallower, the resuspension effect might start to play a role in releasing TN and TP from bed sediments regardless of wind speed, causing the increase of their concentrations, whereas the drifting and mixing effects of winds with a speed of over 3.2 m·s−1 could cause the decrease of TN and TP concentrations. That the increase and then decrease of the Chl-a concentration with the increase of wind speed can be attributed to the drifting and mixing effects.
For the lake as a whole, two critical wind speeds were identified for TN, TP and Chl-a concentrations, all of which were found to have a lower critical wind speed of 2.1 m·s−1 and a higher critical wind speed of 3.2 m·s−1. These critical wind speeds are relatively low, mainly because the wind speed data utilized in this study consist of the average daily rather than instantaneous wind speeds. Furthermore, the wind data used in this study were collected at the meteorological station on the land, and thus, the wind speeds were likely lower than the corresponding wind speeds on the lake surface [15,41].
Below the lower critical wind speed, the flow structure changes very little with increasing wind speed [42] and has a minimal effect on the lakebed sediment, so the nutrient concentration in the water column is in a relatively low state compared to higher wind speeds. Sediment resuspension induced by wind-induced waves commences once bottom stresses exceed the critical shear strength [43,44]. In this study, once the daily mean wind speed exceeded 2.1 m·s−1, both the nitrogen and phosphorus concentrations increased probably because of the nutrient release effect of sediment.
However, nutrient concentrations did not simply continue to increase with increasing wind speed, but instead experienced a second critical wind speed at 3.2 m·s−1, above which the nutrient concentration decreased. Between these two critical wind speeds, the TN and TP concentrations peaked, achieving their highest values of the three wind speed divisions. This may be because stronger winds trigger higher water current volatility, thus dispersing the pollutants in the more polluted zones into less polluted regions. Another factor may be the tendency of nutrient release to reach an equilibrium state between the sediment and water column after a certain point [45]. A higher wind speed would exert a stronger mixing effect, decreasing the nutrient concentrations in the surface water and increasing them at deeper depths, thus lowering the nutrient concentrations for the highest wind speed group compared to those measured at more gentle wind speeds of 2.1–3.2 m·s−1.
As cyanobacteria can float in water, they are easily influenced by wind. Nutrient availability is the most important factor for algal growth [46,47], so when the wind speed falls below 2.1 m·s−1 and nutrient concentrations are also low compared to those at a higher wind speed, conditions are less favorable for the growth of algae. Wind-driven drift has been found to cause the algae accumulation along shorelines when wind speed is low [48]; however, when the wind speed is too low to induce sufficient shear stress on the lake surface, the drifting effect on cyanobacteria can become negligible, and thus, the Chl-a concentration remains low, as well. Once the wind speed exceeds 2.1 m·s−1, the Chl-a concentration starts to build, reaching its highest value between 2.1 and 3.2 m·s−1. This is largely due to the combined effect of rising nutrient concentrations and a stronger drifting effect on algae bloom. Interestingly, as shown by the results of this study, once the wind speed exceeds 3.2 m·s−1, the average Chl-a concentration decreases more sharply than the TN or TP concentrations. Previous studies suggest that this effect may be due to the mixing effect induced by wind, which can entrain and drive cyanobacteria downward below the euphotic zone, thus both limiting their subsequent growth due to the sub-optimal light conditions and decreasing the algal biomass present in the surface water [49,50]. Strong winds may also restrict the growth of cyanobacteria by directly damaging the cyanobacteria cells, reducing the algal bloom [27,29]. In Meiliang Bay, where the water depth is deepest, the wind-induced shear stress mainly has a mixing effect, causing the consistent decrease of nutrient concentrations.
The data also showed that overall, the wind speed in the Lake Tai region has been decreasing at a rate of 0.0216 m·s−1·year−1. This decreasing trend of wind speed, plus the increasing air temperature [38], will likely have a more adverse impact on the water quality of Lake Tai, which is a typical eutrophic lake with both the water and lakebed sediments already in eutrophic states. The decrease in wind speed may boost the release of sediment nutrients. In addition, because a low wind speed is favorable for the growth of cyanobacteria, the decreasing wind speed and increasing air temperature may increase the challenge for dealing with the problem of eutrophication in Lake Tai.

5. Conclusions

While the eutrophication of Lake Tai seems to be mainly due to anthropogenic activities (e.g., wastewater discharge), wind may have some influences on nutrients (i.e., TN and TP) and Chl-a in the lake. In the lake region, the primary wind direction was southeastward in warm seasons (i.e., spring and summer), but northwestward in cool seasons (i.e., fall and winter). Such a pattern of wind direction prompted the accumulation of nutrients and cyanobacteria in the lake’s bays, namely Meiliang Bay and Zhushan Bay. For the lake as a whole, two critical wind speeds (2.1 and 3.2 m·s−1) were identified to characterize the concentrations of TN, TP and Chl-a. The concentrations of nutrients and Chl-a peaked at a wind speed between these two critical values. This indicates that the critical interval may represent the wind speeds associated with the maximum mixing effect and disturbance of the lakebed sediments, accelerating the release of nutrients and creating optimum conditions for the growth of cyanobacteria. Below the lower critical wind speed, the nutrient and Chl-a concentration was lower, probably due to the weak sediment release and the drifting effect. Above the higher critical wind speed, the nutrient and Chl-a concentration started to decline, probably because the increased drifting can disperse away the nutrients and cyanobacteria in the horizontal direction and/or damage the cyanobacteria cells. For the bays, the drifting and mixing effects of winds might be dominant, whereas, for Central Lake and East Lake, the drifting and resuspension effects of winds could be more important. As expected, the concentrations of TN, TP and Chl-a in the bays were higher than those in the other parts of the lake, while they tended to become more uniform in cool than warm seasons. Moreover, the decreasing wind speed in combination with the ongoing anthropogenic activities is of major concern because it may increase the challenge for dealing with the problem of eutrophication in Lake Tai. The anthropogenic activities should be addressed by policy makers.

Acknowledgments

This study was financially supported by: (1) The Natural Science Foundation of China’s (NSFC) project on The Effect of Hydrology and Hydrodynamics on Eutrophication in Chinese Shallow Lakes (Contract # 41473110); and (2) the Integrated Technology for Water Pollution Control and Remediation at Watershed Scale and its Benefit Assessment (Contract # 2014ZX07510-001). The authors thank our colleagues at Chinese Research Academy of Environmental Sciences (CRAES) for providing the data. Our thanks are also extended to the anonymous reviewers, whose comments were very helpful for improving the quality of the paper.

Author Contributions

All authors made substantial contributions to data acquisition and results interpretation, and they also all participated in drafting and revising the article. And all authors gave their approval of the version submitted for publication.

Conflicts of Interest

All authors declare no conflict of interest. The funding agencies played no roles in design of the study, data collection and analyses, interpretation of the results nor writing/revising of the article.

References

  1. Smith, V.H.; Tilman, G.D.; Nekol, J.C. Eutrophication: Impacts of excess nutrient inputs on freshwater, marine, and terrestrial ecosystems. Environ. Pollut. 1999, 100, 179–196. [Google Scholar] [CrossRef]
  2. Nakamura, T.; Adachi, Y.; Suzuki, M. Floating and sedimentation of a single Microcystis floc collected from surface bloom. Water Res. 1993, 27, 979–983. [Google Scholar] [CrossRef]
  3. Paerl, H.W.; Xu, H.; McCarthy, M.J.; Zhu, G.W.; Qin, B.Q.; Li, Y.P.; Gardner, W.S. Controlling harmful cyanobacterialblooms in a hypereutrophic lake (Taihu Lake, China): The need for a dual nutrient (N & P) management strategy. Water Res. 2011, 45, 1973–1983. [Google Scholar] [PubMed]
  4. Paerl, H.W.; Huisman, J. Blooms like it hot. Science 2007, 320, 57–58. [Google Scholar] [CrossRef] [PubMed]
  5. Van Rijssel, J.C.; Hecky, R.E.; Kishe-Machumu, M.A.; Meijer, S.; Pols, J.; Van Tienderen, K.; Ververs, J.; Wanink, J.H.; Witte, F. Climatic variability in combination with eutrophication drives adaptive responses in the gills of Lake Victoria cichlids. Oecologia 2016, 182, 1187–1201. [Google Scholar] [CrossRef] [PubMed]
  6. Jeppesen, E.; Meerhoff, M.; Jacobsen, B.; Hansen, R.; Søndergaard, M.; Jensen, J.P.; Lauridsen, T.L.; Mazzeo, N.; Branco, C.W.C. Restoration of shallow lakes by nutrient control and biomanipulation—The successful strategy varies with lake size and climate. Hydrobiologia 2007, 581, 269–285. [Google Scholar] [CrossRef]
  7. Zhang, M.; Duan, H.T.; Shi, X.L.; Yu, Y.; Kong, F.X. Contributions of meteorology to the phenology of cyanobacterial blooms: Implications for future climate change. Water Res. 2012, 46, 442–452. [Google Scholar] [CrossRef] [PubMed]
  8. Huang, J.; Xu, Q.; Xi, B.; Wang, X.; Jia, K.; Huo, S.; Su, J.; Zhang, J.; Li, C. Effects of lake-basin morphological and hydrological characteristics on the eutrophication of shallow lakes in east China. J. Great Lakes Res. 2014, 40, 666–674. [Google Scholar] [CrossRef]
  9. Vicente, I.D.; Lopez, R.; Pozo, I.; Green, A.J. Nutrient and sediment dynamics in a Mediterranean shallow lake in southwest Spain. Limnetica 2012, 31, 231–250. [Google Scholar]
  10. Havens, K.E.; Fukushima, T.; Xie, P.; Iwakuma, T.; James, R.T.; Takamura, N.; Hanazato, T.; Yamamoto, T. Nutrient dynamics and eutrophication of shallow lakes Kasumigaura (Japan), Donghu (PR China), and Okeechobee (USA). Environ. Pollut. 2001, 111, 263–272. [Google Scholar] [CrossRef]
  11. Thompson, C.E.L.; Couceiro, F.; Fones, G.R.; Helsby, R.; Amos, C.L.; Black, K.; Parker, E.R.; Greenwood, N.; Statham, P.J.; Kelly-Gerreyn, B.A. In situ flume measurements of resuspension in the North Sea. Estuar. Coast. Shelf Sci. 2011, 94, 77–88. [Google Scholar] [CrossRef] [Green Version]
  12. Li, Y.; Tang, C.; Wang, C.; Anim, D.O.; Yu, Z.; Acharya, K. Improved Yangtze River diversions: Are they helping to solve algal bloom problems in Lake Taihu, China. Ecol. Eng. 2013, 51, 104–116. [Google Scholar] [CrossRef]
  13. Ahlgren, J.; Reitzel, K.; de Barbanere, H.; Gogoll, A.; Rydin, E. Release of organic P forms from lake sediments. Water Res. 2011, 45, 565–572. [Google Scholar] [CrossRef] [PubMed]
  14. Li, E.H.; Li, W.; Liu, G.H.; Yuan, L.Y. The effect of different submerged macrophyte species and biomass on sediment resuspension in a shallow freshwater lake. Aquat. Bot. 2008, 88, 93–111. [Google Scholar] [CrossRef]
  15. You, B.; Zhong, J.; Fan, C.; Wang, T.; Zhang, L.; Ding, S. Effects of hydrodynamics process on phosphorus fluxes from sediment in large, shallow Taihu Lake. J. Environ. Sci. 2007, 19, 1055–1060. [Google Scholar] [CrossRef]
  16. Hamilton, D.P.; Mitchell, S.F. An empirical model for sediment resuspension in shallow lakes. Hydrobiologia 1996, 317, 209–220. [Google Scholar] [CrossRef]
  17. Chung, E.G.; Bombardelli, F.A.; Schladow, S.G. Sediment resuspension in a shallow lake. Water Resour. Res. 2009, 45, 207–213. [Google Scholar] [CrossRef]
  18. Koçyigit, M.B.; Falconer, R.A. Three-dimensional numerical modelling of wind-driven circulation in a homogeneous lake. Adv. Water Resour. 2004, 27, 1167–1178. [Google Scholar] [CrossRef]
  19. Johengen, T.H.; Biddanda, B.A.; Cotner, J.B. Stimulation of Lake Michigan plankton metabolism by sediment resuspension and river runoff. J. Great Lakes Res. 2008, 34, 213–227. [Google Scholar] [CrossRef]
  20. Chubarenko, B.V.; Wang, Y.Q.; Chubarenko, I.P.; Hutter, K. Wind-driven current simulations around the Island Mainau (Lake Constance). Ecol. Model. 2001, 138, 55–73. [Google Scholar] [CrossRef]
  21. Anderson, E.J.; Schwab, D.J. Relationships between wind-driven and hydraulic flow in Lake St. Clair and the St. Clair Babin Delta. J. Great Lakes Res. 2011, 37, 147–158. [Google Scholar] [CrossRef]
  22. Johnson, M.V. Relation of plankton to hydrographic conditions in Sweetwater Lake. J. Am. Waterworks Assoc. 1949, 41, 347–356. [Google Scholar]
  23. Verduin, J. A comparison of phytoplankton data obtained from a mobile sampling method with those obtained from a single station. Am. J. Bot. 1951, 38, 5–11. [Google Scholar] [CrossRef]
  24. Webster, I.T. Effect of wind on the distribution of phytoplankton cells in lakes. Limnol. Oceanogr. 1990, 35, 989–1001. [Google Scholar] [CrossRef]
  25. Reynolds, C.S.; Walsby, A.E. Water blooms. Biol. Rev. Camb. Philos. Soc. 1975, 50, 437–481. [Google Scholar] [CrossRef]
  26. Paerl, H.W.; Hall, N.S.; Calandrino, E.S. Controlling harmful cyanobacterial blooms in a world experiencing anthropogenic and climatic-induced change. Sci. Total Environ. 2011, 409, 1739–1745. [Google Scholar] [CrossRef] [PubMed]
  27. Brookes, J.D.; Regel, R.H.; Ganf, G.G. Changes in the photochemistry of Microcystis aeruginosa in response to light and mixing. New Phytol. 2003, 158, 151–164. [Google Scholar] [CrossRef]
  28. Moreno-Ostos, E.; Cruz-Pizarro, L.; Basanta, A.; George, D.G. The influence of wind-induced mixing on the vertical distribution of buoyant and sinking phytoplankton species. Aquat. Ecol. 2009, 43, 271–284. [Google Scholar] [CrossRef]
  29. Wu, T.F.; Qin, B.Q.; Zhu, G.W.; Luo, L.C.; Ding, Y.Q.; Bian, G.Y. Dynamics of cyanobacterial bloom formation during short-term hydrodynamic fluctuation in a large shallow, eutrophic and wind-exposed, LakeTaihu, China. Environ. Sci. Pollut. Res. 2013, 20, 8546–8556. [Google Scholar] [CrossRef] [PubMed]
  30. Zhai, S.J.; Hu, W.P.; Zhu, Z.C. Ecological impacts of water transfers on Lake Taihu from the Yangtze River, China. Ecol. Eng. 2010, 26, 406–420. [Google Scholar] [CrossRef]
  31. Xu, J.; Zhang, Y.; Zhou, C.B.; Guo, C.S.; Wang, D.M.; Du, P.; Luo, Y.; Wan, J.; Meng, W. Distribution, sources and composition of antibiotics in sediment, overlying water and pore water from Taihu Lake, China. Sci. Total Environ. 2014, 497–498, 267–273. [Google Scholar] [CrossRef] [PubMed]
  32. Guo, L. Doing battle with the green monster of Lake Taihu. Science 2007, 317, 1166. [Google Scholar] [CrossRef] [PubMed]
  33. Stone, R. China aims to turn tide against toxic lake pollution. Science 2011, 333, 1210–1211. [Google Scholar] [CrossRef] [PubMed]
  34. Huang, J.; Xu, Q.; Wang, X.; Xi, B.; Jia, K.; Huo, S.; Liu, H.; Li, C.; Xu, B. Evaluation of a modified Monod model for predicting algal dynamics in Lake Tai. Water 2015, 7, 3626–3642. [Google Scholar] [CrossRef]
  35. Ding, Y.; Qin, B.; Zhu, G.; Wu, T.; Wang, Y.; Luo, L. Effects of typhoon Morakot on a large shallow lake system, Lake Taihu, China. Ecohydrology 2012, 5, 798–807. [Google Scholar] [CrossRef]
  36. Bachmann, R.W.; Hoyer, M.V.; Canfield, D.E. The potential for wave disturbance in shallow Florida lakes. Lake Reserv. Manag. 2000, 16, 281–291. [Google Scholar] [CrossRef]
  37. Liu, H.; Bao, L.; Zeng, E.Y. Recent advances in the field measurement of the diffusion flux of hydrophobic organic chemicals at the sediment-water interface. Trends Anal. Chem. 2014, 56, 56–64. [Google Scholar] [CrossRef]
  38. Hubert, M.; Vandervieren, E. An adjusted boxplot for skewed distributions. Comput. Stat. Data Anal. 2008, 52, 5186–5201. [Google Scholar] [CrossRef]
  39. Cózar, A.; Gálvez, J.A.; Hull, V.; García, C.M.; Loiselle, S.A. Sediment resuspension by wind in a shallow lake of Esteros del Iberá (Argentina): A model based on turbidmetry. Ecol. Model. 2005, 186, 63–76. [Google Scholar] [CrossRef]
  40. Huang, J.; Xi, B.; Xu, Q.; Wang, X.; Li, W.; He, L.; Liu, H. Experiment study of the effects of hydrodynamic disturbance on the interaction between the cyanobacterial growth and the nutrients. J. Hydrodyn. 2016, 28, 411–422. [Google Scholar] [CrossRef]
  41. Qin, B.Q.; Hu, W.P.; Gao, G.; Luo, L.C.; Zhang, J.S. Dynamic mechanism and conceptual model of inner source release of sediments suspension from Taihu Lake. Chin. Sci. Bull. 2003, 48, 1822–1831. (In Chinese) [Google Scholar]
  42. Wu, T.F.; Qin, B.Q.; Brookes, J.D.; Shi, K.; Zhu, G.W.; Zhu, M.Y.; Yan, W.M.; Wang, Z. The influence of changes in wind patterns on the areal extension of surface cyanobacterial blooms in a large shallow lake in China. Sci. Total Environ. 2015, 518–519, 24–30. [Google Scholar] [CrossRef] [PubMed]
  43. Chao, X.B.; Jia, Y.F.; Shields, F.D., Jr.; Wang, S.S.; Cooper, C.M. Three-dimensional numerical modeling of cohesive sediment transport and wind wave impact in a shallow oxbow lake. Adv. Water Resour. 2008, 31, 1004–1014. [Google Scholar] [CrossRef]
  44. Qin, B.Q.; Zhu, G.W.; Zhang, L.; Luo, L.C.; Gao, G.; Gu, B.H. Estimation of internal nutrient release in large shallow Lake Taihu. Sci. China 2006, 49, 38–50. [Google Scholar] [CrossRef]
  45. Cyr, H.; MaCabe, S.K.; Nürnberg, G.K. Phosphorus sorption experiments and potential for internal phosphorus loading in littoral areas of a stratified lake. Water Res. 2009, 43, 1654–1666. [Google Scholar] [CrossRef] [PubMed]
  46. Qin, B.Q.; Zhu, G.; Gao, G.; Zhang, Y.; Li, W.; Paerl, H.W.; Carmichael, W.W. A drinking water crisis in Lake Taihu, China: Linkage to climatic variability and lake management. Environ. Manag. 2010, 45, 105–112. [Google Scholar] [CrossRef] [PubMed]
  47. Reynolds, C.S. Ecology of Phytoplankton; Cambridge University Press: Cambridege, UK, 2006. [Google Scholar]
  48. Huisman, J.; Weissing, F.J. Light-limited growth and competition for light in well-mixed aquatic environments: An elementary model. Ecology 1994, 75, 507–520. [Google Scholar] [CrossRef]
  49. Wallace, B.B.; Hamilton, D.P. Simulation of vertical position of buoyancy regulating Microcystis aeruginosa in a shallow eutrophic lake. Aquat. Sci. 1999, 62, 320–333. [Google Scholar] [CrossRef]
  50. George, D.G.; Edwards, R.W. The effect of wind on the distribution of chlorophyll a and crustacean zooplankton in a shallow eutrophic reservoir. J. Appl. Ecol. 1976, 13, 667–690. [Google Scholar] [CrossRef]
Figure 1. Map showing the location and five zones (i.e., Meiliang Bay, Zhushan Bay, Gonghu Bay, Central Lake and East Lake) of Lake Tai, superimposed by the 23 water quality sites and the meteorological station where data were available and used in this study.
Water 09 00200 g001
Figure 2. Plots showing the occurrence of wind direction during the study period (January 2005 to September 2011): (a) across the year; (b) in spring and summer; and (c) in fall and winter.
Water 09 00200 g002aWater 09 00200 g002b
Figure 3. Plots showing the temporal trends of annual average wind speed, in m·s−1, from 1990–2011: (a) across year; (b) in spring; (c) in summer; (d) in fall; and (e) in winter.
Water 09 00200 g003
Figure 4. Map showing the spatial distribution of mean annual total nitrogen (TN) concentration (mg·L−1), superimposed by the plot (signified by black line) of wind direction occurrence.
Water 09 00200 g004aWater 09 00200 g004b
Figure 5. Map showing the spatial distribution of mean annual total phosphorus (TP) concentration (mg·L−1), superimposed by the plot (signified by black line) of wind direction occurrence.
Water 09 00200 g005aWater 09 00200 g005b
Figure 6. Map showing the spatial distribution of mean annual chlorophyll-a (Chl-a) concentration (μg·L−1), superimposed by the plot (signified by black line) of wind direction occurrence.
Water 09 00200 g006aWater 09 00200 g006b
Figure 7. Map showing the spatial distribution of: (a,b) mean total nitrogen or TN concentration in mg·L−1; (c,d) mean total phosphorus or TP concentration in mg·L−1; and (e,f) mean chlorophyll-a or Chl-a concentration in μg·L−1, for the year 2005. (a,c,e) are for the warm seasons (i.e., spring and summer), while (b,d,f) are for the cool seasons (i.e., fall and winter).
Water 09 00200 g007aWater 09 00200 g007b
Figure 8. The whisker’s boxplot of total nitrogen (TN) concentration for the three wind speed groups.
Water 09 00200 g008
Figure 9. The whisker’s boxplot of total phosphorus (TP) concentration for the three wind speed groups.
Water 09 00200 g009
Figure 10. The whisker’s boxplot of chlorophyll-a (Chl-a) concentration for the three wind speed groups.
Water 09 00200 g010
Figure 11. Plots showing wind speed versus median concentration of: (a) total nitrogen (TN); (b) total phosphorus (TP); and (c) chlorophyll-a (Chl-a), in the bays (namely Zhushan Bay, Meiliang Bay and Gonghu Bay in Figure 1).
Water 09 00200 g011
Figure 12. Plots showing wind speed versus median concentration of: (a) total nitrogen (TN); (b) total phosphorus (TP); and (c) chlorophyll-a (Chl-a), in Central Lake and East Lake (Figure 1).
Water 09 00200 g012
Figure 13. Plots showing vertical shear stress (as measured by the ratio of wind speed to water depth) versus concentrations of: (a) total nitrogen(TN); (b) total dissolved nitrogen(TDN); (c) total phosphorus (TP); (d) total dissolved phosphorus (TDP); and (e) chlorophyll-a (Chl-a), in Meiliang Bay (see Figure 1).
Water 09 00200 g013
Table 1. Summary statistics of the historical data.
ParameterSample Size Min Max Median
Primary Production
Chlorophyll-a (Chl-a) (µg·L−1) 11530.8189.719
Chemical Parameters
Total nitrogen (TN) (mg·L−1) 11530.420.83.6
Total phosphorus (TP) (mg·L−1) 11530.010.880.13
Climate
Daily average wind speed (m·s−1) 71820.311.33.09
Notes: The number of data values before preprocessing for the entire study period at the 23 water quality sites or the meteorological station (Figure 1); the statistics were computed using the pre-processing data for the entire study period at the 23 water quality sites or the meteorological station (Figure 1); the study period is January 2005 to September 2011; the study period is January 1990 to September 2011.
Table 2. Water quality from January 2005 to September 2011 in the zones (Figure 1) of Lake Tai.
Water QualityAbbreviationMeiliang and Zhushan BayCentral Lake East Lake
Chlorophyll-a (μg·L−1)Chl-a27.312.816.10
Total nitrogen (mg·L−1)TN4.552.851.81
Total phosphorus (mg·L−1)TP0.170.100.06

