
Assessing the Integration of Wetlands along Small European Waterways to Address Diffuse Nitrate Pollution
by
 , , ,
, , ,
Natalia Donoso
1,2,* ,
,
Sacha Gobeyn
2,
Pieter Boets
2,
Peter L. M. Goethals
2,
Denis De Wilde
3 and
Erik Meers
1 1
Department of Applied Environmental Chemistry, Ghent University, Coupure Links 653, 9000 Ghent, Belgium
2
Department of Applied Ecology and Environmental Biology, Ghent University, Coupure Links 653, 9000 Ghent, Belgium
3
Rietland Agro, Van Aertselaerstraat 70, 2322 Minderhout, Belgium
*
Author to whom correspondence should be addressed.
Water 2017, 9(6), 369; https://doi.org/10.3390/w9060369
Submission received: 31 March 2017
/
Revised: 16 May 2017
/
Accepted: 22 May 2017
/
Published: 24 May 2017
(This article belongs to the Special Issue Treatment Wetlands for Nutrient Removal)
Abstract
:Nitrate concentrations in numerous European fresh watercourses have decreased due to end-of-pipe measures towards manure and fertilization management, but fail to meet the environmental objectives. The implementation of complementary measures to attenuate diffuse nitrate pollution in densely populated regions characterised by limited available area has been barely studied. To tackle this issue, this study evaluates the feasibility of integrating Constructed Wetlands (CWs) along waterways as a promising tool to facilitate compliance with the nitrate regulations. The aim is to calculate the required area of land alongside a specific watercourse to integrate CWs to reduce nitrate concentrations consistently below the 11.3 and 5.65 mgNO3-N/L levels, according to the Nitrates Directive and the Flemish Environmental Regulations. Nitrate-nitrogen removal efficiencies achieved at case study CWs were compared and validated with reported values to estimate the needed wetland areas. In addition, the removal efficiencies and areas needed to meet the standards were calculated via the kinetic model by Kadlec and Knight. The predicted areas by both methods indicated that CWs of 1.4–3.4 ha could be implemented in certain regions, such as Flanders (Belgium), with restricted available land. To conclude, three designs for ICWs (Integrated Constructed Wetlands) are proposed and evaluated, assessing the feasibility of their implementation.
1. Introduction
Agricultural activities and livestock production are responsible for increased nutrient levels in surface water [1]. Although several end-of-pipe measurements have been implemented to mitigate the effects of agriculture on the environment, nutrient concentrations in waterways remain elevated due to non-point (diffuse) sources. Excessive amounts of nitrogen in water lead to oxygen depletion affecting aquatic life and organisms. Nitrogen could be present in surface water in different forms, but total nitrogen (TN), ammonium nitrogen (NH4-N), organic nitrogen, nitrite (NO2), and nitrate (NO3) are the main forms that end up in the surface water [2,3]. Several studies have reported that nitrate and nitrite concentrations in rivers greatly differ from each other, with nitrite concentrations being negligible in most cases. However, nitrate and ammonium are highly soluble and directly end up in the surface water due to runoff. Unlike nitrate, ammonium remains for relatively short periods in the waterways, as it is converted to oxidised forms of nitrogen. Therefore, ammonium is considered as an appropriate water quality indicator of heavily polluted water since high concentrations of ammonium are the result of the direct impact of wastewater treatment plants, industrial effluents, or household discharges, among others [4,5]. As a consequence, environmental policies and demands consider nitrate as the primary monitoring parameter, and therefore, the main importance is given to nitrate in the present study.
To draw attention to these facts, the EU Water Framework Directive (EU WFD) (2000/60/EC), the Nitrates Directive, and policy makers demand the protection of water resources, promote its sustainable use, and prevent further contamination [6]. Belgium, especially the Flanders region, is greatly impacted by intensive agricultural activities and the main attention is given to animal husbandry. According to the Manure Decree which was implemented as part of the Nitrates Directive, Belgium is obligated to decrease the annual average nitrate concentrations below the 11.3 mgNO3-N/L limit. By 2018, only 5% of all monitoring stations should register nitrate concentrations above the 11.3 mgNO3-N/L; nevertheless, currently 16% of the sampling points are currently exceeding this limit [7]. Furthermore, according to the Flemish Environmental Regulations (VLAREM) 90% of the measurements recorded in polder watercourses on a monthly basis must be smaller or equal to 5.65 mgNO3-N/L up to a maximum of 8.48 mgNO3-N/L [8].
An interesting approach to tackle this problem is to implement Integrated Constructed Wetlands (ICWs) along waterways as complementary measures to end-of-pipe solutions. However, as Flanders is a densely populated region with over 460 inhabitants per km2, conflicting demands among various types of land use must be considered. In this region Constructed Wetlands (CWs) have been extensively used for the treatment of urban, industrial, and dairy wastewater [9]; though none of them have been tested to treat agricultural runoff as compared to other countries such as the United States, Norway, Turkey, Sweden, the Netherlands, among others [10,11,12,13,14,15]. Previous case studies showed that the nitrogen removal from non-point source pollution by CWs can vary from low percentages of nitrogen removal such as 3–15% [10] to higher values of between 10% and 92% [13,16,17].
Therefore, this study investigates whether eco-engineering and installing ICWs with limited available land alongside a selected waterway in Flanders can reduce diffuse NO3 pollution. The design, the variation of surface flow due to seasonality, and the land area needed were the studied variables, given the importance of estimating the performance of the wetlands and of facilitating the decision making processes.
The aim of this study is to estimate the area needed to implement CWs in a site-specific location, where a limited amount of land is available, to alleviate nitrate pollution in small watercourses impacted by agricultural activities and livestock production. It focuses on the reduction of nitrate concentrations from as high as 19.1 mgNO3-N/L, representing a frequent peak concentration registered at the case study watercourse. The study also considers that the environmental standard limits of 11.3 mgNO3-N/L and 5.65 mgNO3-N/L according to the Nitrates Directive and the Flemish Environmental Regulations, respectively, have to be met. Depending on land availability, CWs could be implemented by adapting their design to the landscape. Therefore, three different ways to adapt the wetlands are analysed based on their strengths and weaknesses. The importance of conserving the waterway’s natural course and its connectivity with the aquatic ecosystem were considered in a way in which no negative impacts are expected on surface flow conditions, habitat of the biota, or animal mobility. Surface flow treatment wetlands (SFTWs) were the type of wetland considered for the proposed designs, since the shallow water depth and the presence of macrophytes would regulate to some extent the surface flow of the small watercourses which are considered as potential locations for the implementation of CWs. Therefore, in this paper three CW designs were qualitatively evaluated, regarding: (1) their impact on the water quality, surface flow, and the ecosystem (2) feasibility of being implemented based on the available land and the least modifications needed in the river banks. As a consequence, stakeholders, policy makers, and community organizations can consider the implementation of CWs as a potential nitrate removal treatment technique to reduce the input from agricultural runoff.
2. Materials and Methods
To test the implementation of CWs along watercourses in Flanders, the area that would be required on a site-specific location was estimated based on: theoretical and practical nitrate removal rates, the surface flow, air temperature, and total nitrogen and nitrate concentrations. A description of the locations and data selected to investigate our research questions as well as two methodological approaches selected to define nitrate-nitrogen removal ranges and areas needed are described below:
2.1. Site Selection and Data Compilation
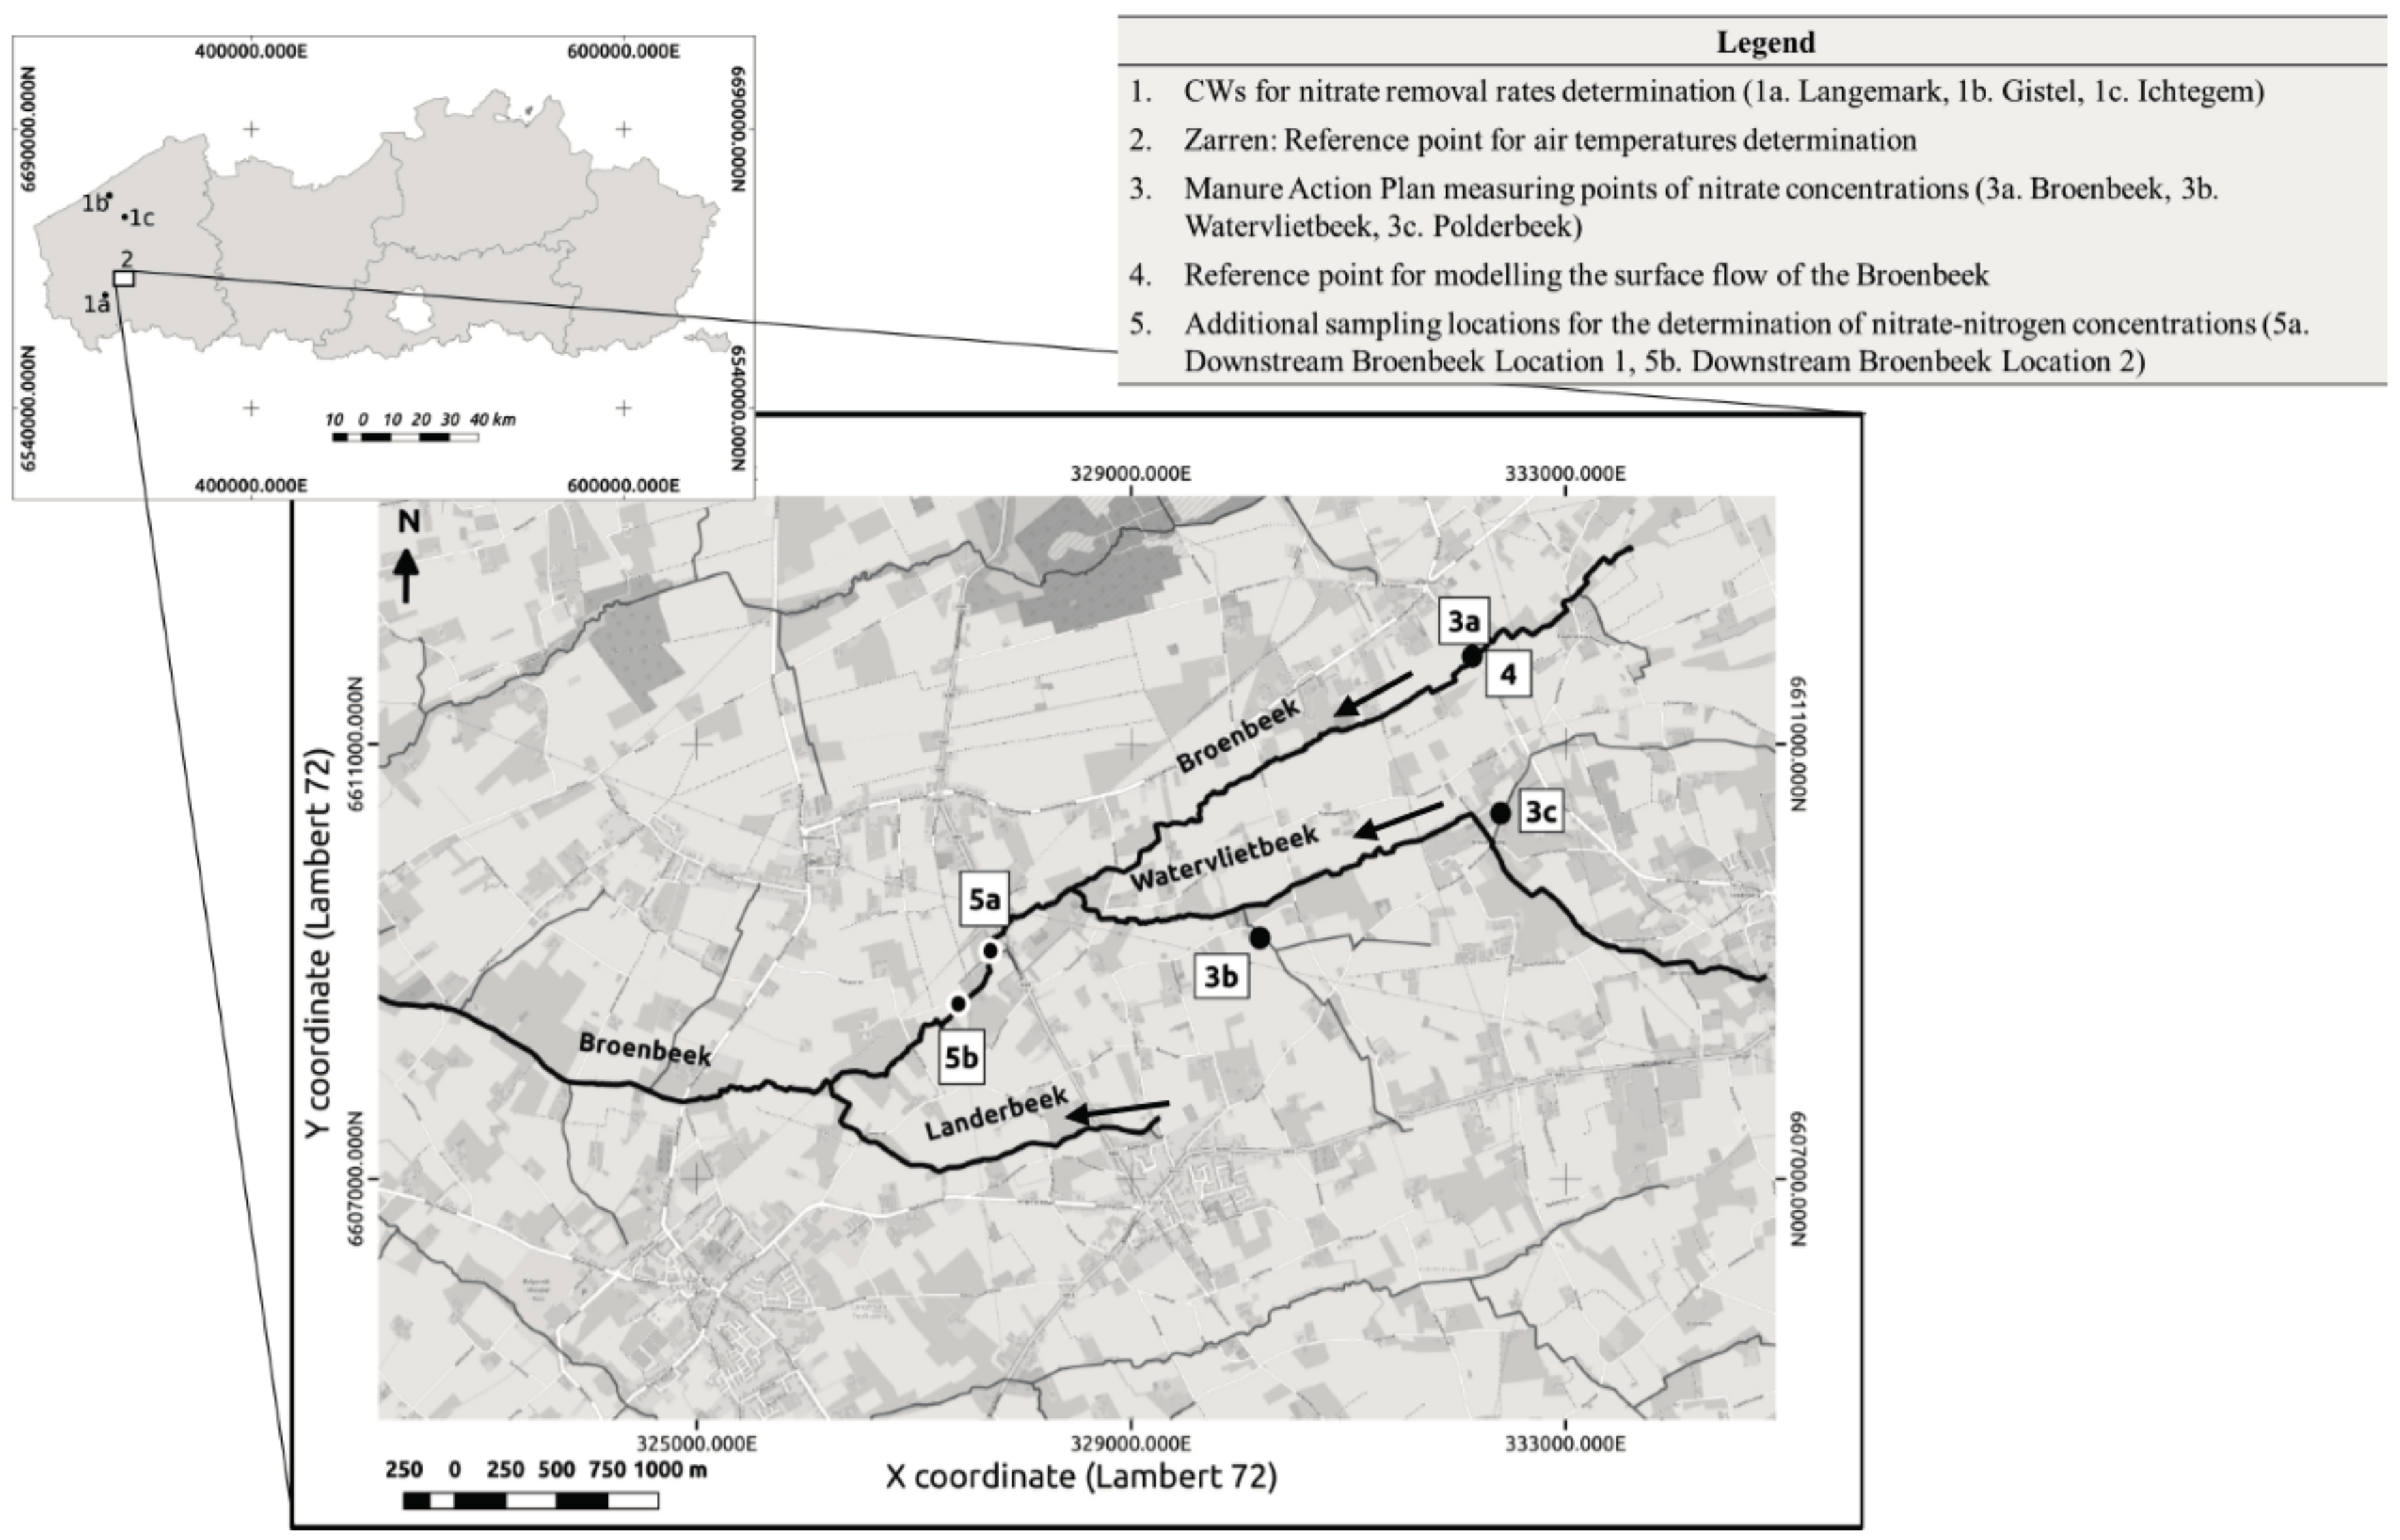
The Broenbeek is an unnavigable watercourse, part of the IJzer basin, with a catchment area of approximately 3 km2. It is characterized as a polder watercourse, meaning that it generally has a low flow and that human intervention has modified its natural course. Moreover, the Broenbeek flowing through Langemark–Poelkapelle receives the impact of different agricultural activities, such as the cultivation of grains, potatoes, ornamental plants, as well as intensive pig and cattle farming [18]. Therefore, it was considered as an appropriate stream where ICWs could be implemented. Figure 1 shows the complete course of the Broenbeek to which two other streams, the Watervlietbeek and the Landerbeek, join. Additionally, it plots the Flanders region with all the measuring points from which data were retrieved for this study. The local environmental conditions and the water quality data of the Broenbeek were acquired from the Flanders Environment Agency (VMM) portal site, or via contact with water resource managers working at this entity. Points 2, 3a, and 4 were used for retrieving, processing, and analysing data. Points 3b and 3c measuring locations of the VMM, were considered as the reference of nitrate concentrations impacting the Broenbeek (see Figure 1 points 2, 3a, 3b, 3c, and 4). In addition, to compare the reported values by the VMM and to determine nitrate-nitrogen concentrations downstream from point 3a, two sampling locations receiving the discharged effluent from a CW located in Langemark were considered (see Figure 1 points 5a and 5b).
Furthermore, the range of nitrate removal rates was defined based on reported data from the literature shown in Table 1, as well as on the performance of three case study CWs treating animal manure (Figure 1 points 1a, 1b, and 1c, located in Langemark, Gistel, and Ichtegem, respectively). A detailed explanation of how the data from Table 1 were assessed is presented in Section 2.3.1.
2.2. Total Nitrogen, Nitrate Concentrations, and Water Quantity Measurements
Upstream from the Broenbeek, at a sampling location of the VMM (Figure 1 point 3a), nitrate concentrations are frequently measured and the monthly reported average values were considered for calculations. Nitrate concentrations of a 14-year period (2002–2016) were evaluated in the present study. However, the main focus was given to the last seven years due to the decreasing concentrations recorded during this period. In addition, downstream from the Broenbeek at points 5a and 5b (Figure 1), the total nitrogen concentrations were determined during the period from April 2014 to June 2015. Total Kjeldahl Nitrogen (TKN) concentrations were measured in accordance with the standard methods 4500-Norg B [27]. Moreover, from point 4 (Figure 1) the water velocity, the water levels, and the modelled surface flow of the Broenbeek were considered. The reported values by data managers and water reporting in charge at the VMM were obtained via the Probability Distributed Model (PDM) as described by Moore [28] and Donoso et al. [29]. This conceptual rainfall-runoff model uses rainfall and potential evaporation data to transform it to the flow of the catchment outlet. The modelled surface flow data of a 5 year period (2010–2015) were used for calculations.
2.3. Nitrogen Removal Capacity
Nitrate removal rates were calculated based on two approaches. The first approach considers actual conditions and removal efficiencies achieved at three CWs designed for the treatment of wastewater coming from animal manure (Figure 1 points 1a, 1b, and 1c). A detailed description of the design and functioning of these wetlands were described by Meers et al. [30] and Donoso et al. [29]. The aim was to define the performance of the case study CWs regarding the treated flows, and the surface area used to have an estimation of the CWs performance in the field. On the contrary, the second approach to define the range of nitrate-nitrogen removal rates considers a rule-of-thumb model design for CWs developed by Kadlec and Knight [31]. This method considers a fixed value for the NO3-N removal rate which is corrected on the basis of temperature fluctuations due to seasonality.
The aim of relating the two approaches for the calculation of the NO3-N removal rates was to compare the resulting areas needed by using different values of the NO3-N removal rates.
2.3.1. Achieved and Validated Nitrogen Removal Rates Based on Operating CWs in Flanders
In the first approach, the range of the NO3-N removal rate was determined based on field and literature data. Initially, the data retrieved from the three wetlands used as case studies were considered. Since relatively low nitrate concentrations need to be assessed in watercourses such as the Broenbeek, only the removal efficiencies reached in the extensive or polishing zone of each wetland were calculated. In these last ponds of the systems, low concentrations of nutrients are removed. For calculations, the averages of the incoming concentrations at the beginning of the extensive zone as well as the outgoing concentration were considered. The incoming flows, expressed in m3/day, were calculated based on the cumulative flows registered monthly, given the frequency of the sampling campaigns in the field during a period of four years (2011–2015). Additionally, the total surface area of the extensive zone, expressed in m2, was calculated based on the length, width, and depth of each pond. Finally, the average mass flux of nitrogen per unit area was determined using Equation (1):
where, k = average nitrate-nitrogen removal rate (g/m2·day), Cin = incoming concentration to the wetland and/or to the extensive zone (mgNO3-N/L), Cout = outgoing concentration from the wetland (mgNO3-N/L), Qin = flow rate incoming to the wetland and/or to the extensive zone (m3/day), As = treatment area of the wetland and/or to the extensive zone (m2).
Later, literature values (see Table 1) were cross compared with field measurements to validate that the calculated values were a good estimation of wetlands’ performance for NO3-N removal in Flanders. The literature data were analysed as follows: First, the reported nitrate-nitrogen removal rates obtained at FWS CWs treating wastewater originated by agro-urban activities were investigated. Mainly wastewaters assessed by this type of CWs were considered based on the scope of the study. Considering that the frequent peak concentrations at the Broenbeek is 19.1 mgNO3-N/L measured, the literature revision was performed looking at CWs receiving water with a similar and lower nitrate-nitrogen content. It was presumed that these would be the incoming concentrations that a CW within the stream would receive. Finally, the surface area needed for the treatment was taken into account, given the fact that only a limited amount of land is available in Flanders for the implementation of CWs.
In consequence, a nitrate-nitrogen removal range was set based on the exposed values in Table 1 and the supplementary values in Table A1 in Appendix A.
2.3.2. First Order Rate Constant Based on the Kadlec and Knight Design Model Considering Seasonal Variations
A second approach was developed based on both Reed et al. [32] and the Kadlec and Knight [31] design modelling equation. The model presumes a first-order decay, plug flow for the most common surface water pollutants including total nitrogen. In this method, area removal rate constants are considered for all pollutants independently of variations in climatic conditions, except for nitrogen. In fact, to define aerial temperature rate constants, Kadlec and Knight used empirical data regarding wetlands’ performance from the North American Data Base (NADB). For the present study, the temperature correction to determine the first order rate constant was performed considering recorded values during the period from 2009 to 2016. Air temperatures constantly measured by the Flemish water regulators were retrieved online from the official website of the Flemish Government [33]. The aim was to consider a wider range of temperature variations in the study area rather than water temperatures which are more case specific. Frequently, air temperature is continuously measured and readily accessible, in comparison to water temperature. In addition, Kadlec and Reddy [34] estimated that the difference in temperature between air and wetlands’ water is differentiated by about one degree as long as the water temperature does not fall below zero. Therefore, air temperature values were used for the present estimations. A measuring station at Zarren-Kortemark was selected as the location of reference. The measuring point is located between each of the studied CWs, approximately 18 km away from each other, as shown in Figure 1, point 2. The first order rate constants were calculated by applying a modified Arrhenius temperature dependence Equation (2), as suggested by the Kadlec and Knight design model. Monthly registered temperatures were grouped per seasons of the year to estimate the variations in temperature occurring in the study area and were then averaged to be used in the following formula:
where kT = first order rate constant at temperature T (m/year), k20 = first order rate constant at temperature 20 °C (m/year), θ = temperature correction factor (-), T = mean air temperature (°C).
2.4. Integrated Constructed Wetlands Dimensioning
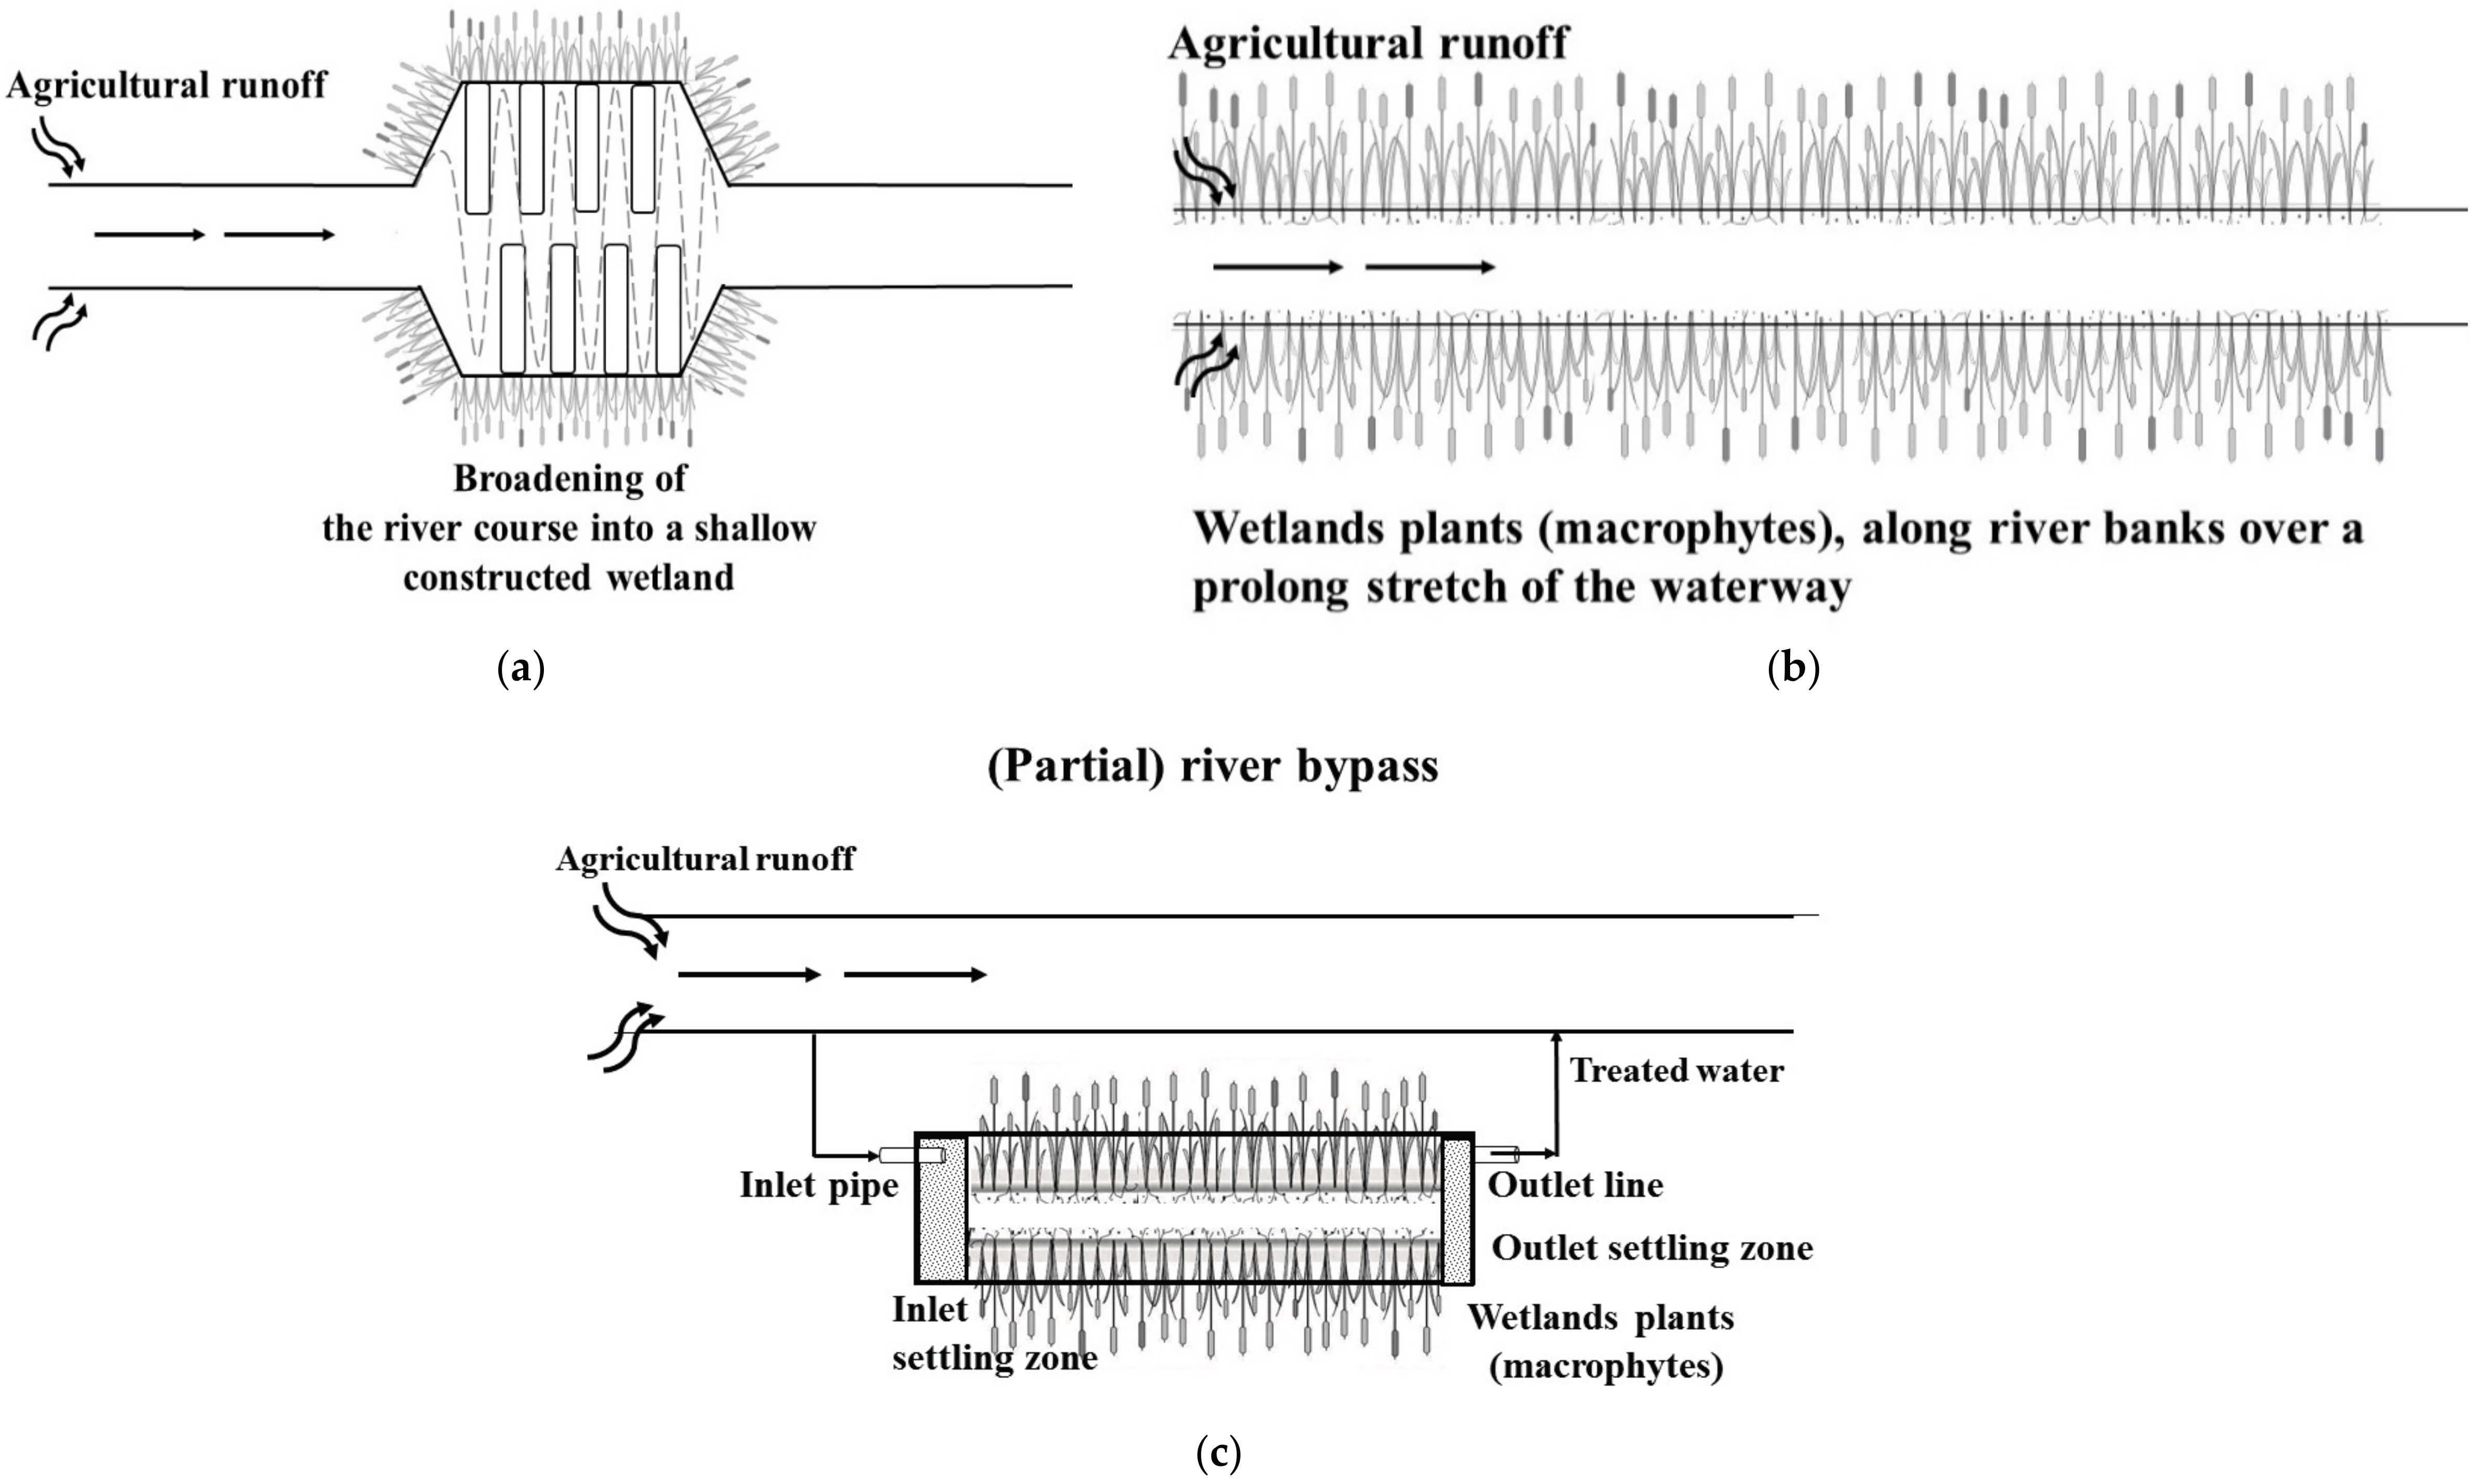
To define the area needed to implement CWs in the Broenbeek, the estimated NO3-N removal rates by the above-mentioned methods were considered. Looking at the available land in the surroundings of the study area and considering the tested studies in the field [16,23,35,36], three different designs, as shown in Figure 2, were proposed. The first option (a), suggests that artificial wetlands could be implemented aligning with the stream by adapting river banks and broadening the stream course to the extent that the majority of the area used would be effective for nitrogen removal. To control short-circuiting that commonly occurs in CWs at high or fluctuating surface water flows, sand bags and stones could be allocated at the sides of the wetland to force the water to pass through most of the matrix. The second option (b), incorporates macrophytes along the length of the river banks promoting the constant uptake of nutrients given the capacity of the rhizosphere to provide surface and oxygen for the growth of bacteria participating in the nitrification process. In this second design, river banks could be lowered or dug out to allow for a better and prolonged contact of the surface water with the vegetation. The third option (c), incorporates CWs next to the watercourse, so that part of the circulating water is directed to the wetland, treated, and is later returned into the stream.
It is important to note that regardless of the proposed designs, the potential surface areas needed for implementation were calculated with the achieved removal rates, (Section 2.3.1) and based on the Kadlec and Knight model (Section 2.3.2).
2.4.1. Surface Area Based on the Achieved Removal Rates in the Field
In the first approach, the 90th percentile of NO3-N concentrations recorded on a monthly basis at the Broenbeek and reported by the VMM, the average flow, and the environmental standard limits of 11.3 mgNO3-N/L and 5.65 mgNO3-N/L as the target effluent concentrations, were considered to determine the area. The NO3-N concentrations as well as the surface flow data were aggregated according to the seasons of the year to take into account the performance fluctuations in the wetland. Based on this fact, the defined range of NO3-N removal rates, discussed in Section 2.3.1, was considered for the calculations. Equation (3) was applied to calculate the area needed to install CWs treating agricultural runoff.
where As = treatment area of the wetland (m2), Qin/out = flow rate incoming and outgoing from the wetland (m3/day), Ce = target effluent concentration (mgNO3-N/L), Cin = influent concentration (mgNO3-N/L), k = nitrogen removal rate (gNO3-N/m2·day).
2.4.2. Surface Area Based on the Kadlec and Knight Model Design
The surface area was calculated based on the reported NO3-N concentrations. For this case, the Broenbeek’s modelled surface flows aggregated by seasons of the year and the k values calculated as described in Section 2.3.2 were considered. Equation (4) was applied to determine the area of wetland needed to decrease the NO3-N concentrations to levels below the environmental standard limits of 5.65 and 11.3 mgNO3-N/L.
where As = treatment area of the wetland (m2), Qin = flow rate incoming into the wetland (m3/day), k = first order rate constant at temperature T (m/year), Cin = influent concentration (mgNO3-N/L), Ce = target effluent concentration (mgNO3-N/L), C* = background pollutant concentration (mgNO3-N/L) representing the concentration that will be always present in the watercourse.
Nevertheless, it is acknowledged that once CWs are implemented, surface flows would vary depending on each of the proposed designs due to the adaptations performed at the river banks and the watercourse. Therefore, based on the calculated surface area, the values for the hydraulic retention time (HRT) were estimated. The aim was to determine if these could be achieved in reality and to obtain an insight of the adaptations that should be done at the watershed and watercourse levels to maintain the surface water for a prolonged time in the system. To this end, two equations were considered:
where V = volume (m3), As = treatment area of the wetland (m2), D = depth of the CW (m).
where HRT = hydraulic retention time (day), V = volume (m3), Qin = incoming flow (m3/day).
HRT = V/Qin
3. Results
3.1. Total Nitrogen—Nitrate Concentrations and Water Quantity Measurements
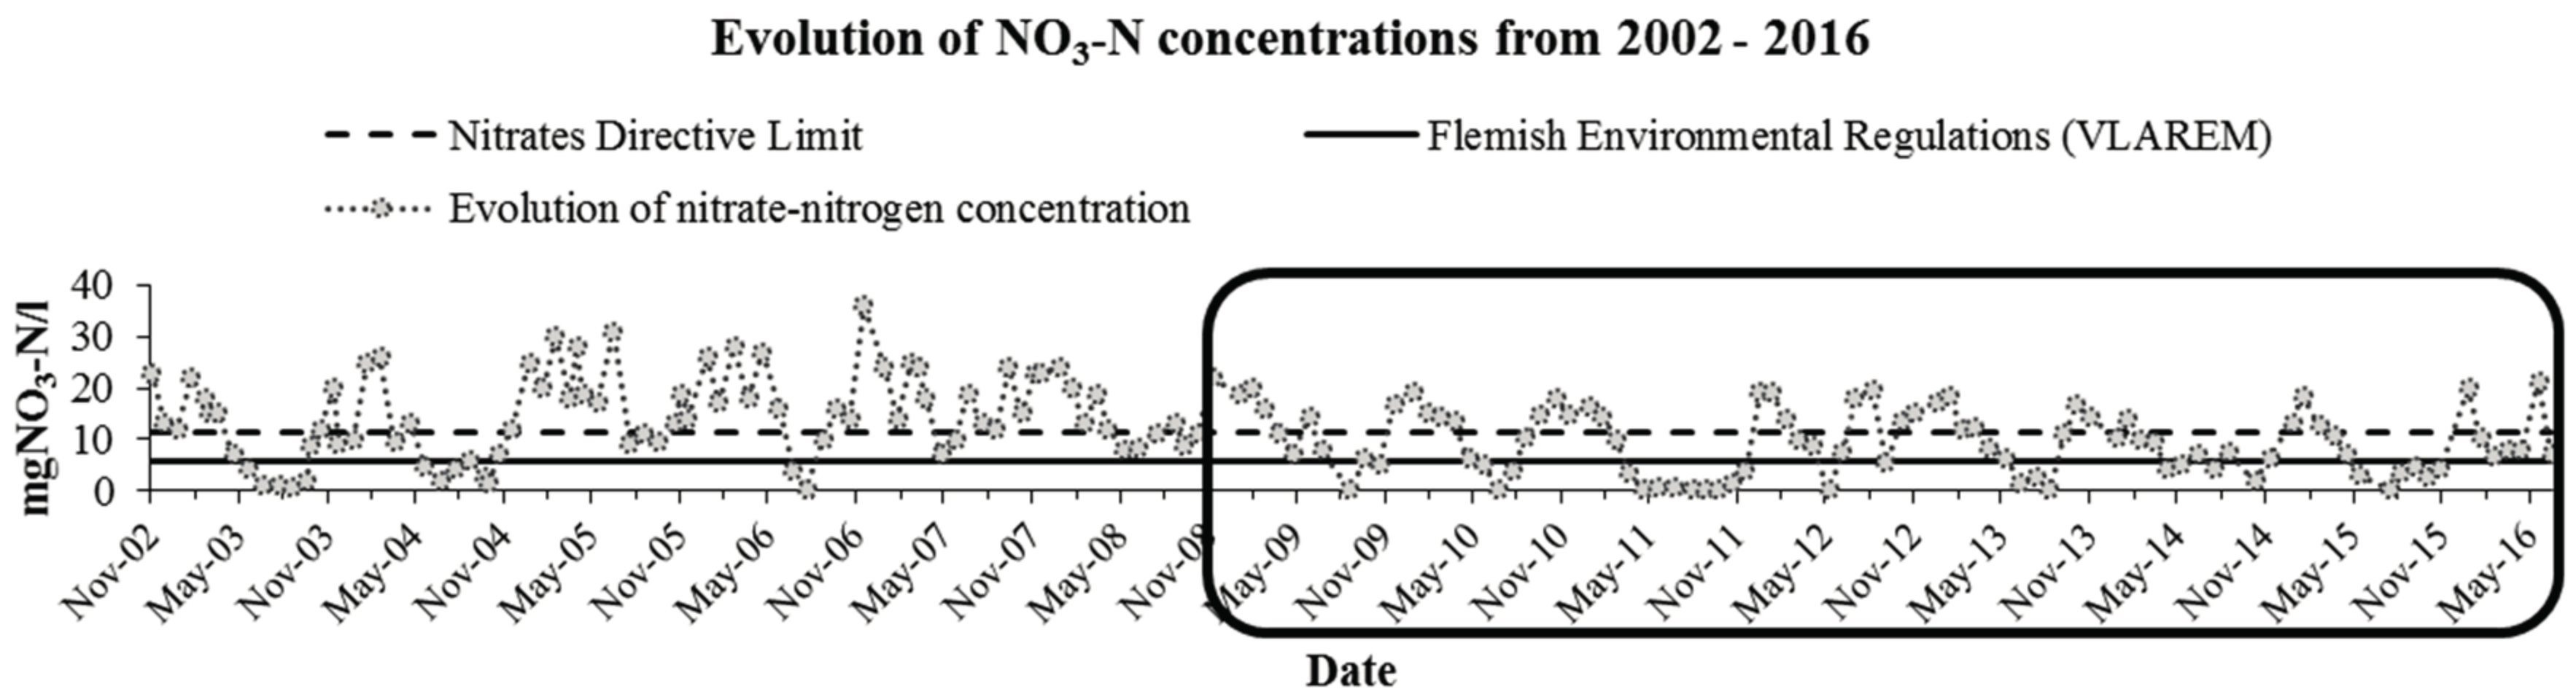
Total nitrogen concentrations measured downstream of the Broenbeek (Figure 1 points 5a and 5b) receiving the discharged effluent from the CW located in Langemark–Poelkapelle and the runoff, were compared to the Flemish Environmental Regulations (VLAREM) environmental standard limit of 6 mgTN/L, whereas the nitrate-nitrogen concentrations reported by the VMM at their measuring station (Figure 1 point 3a) were evaluated with the 5.65 mgNO3-N/L and 11.3 mgNO3-N/L legislative limits. The results showed that during the period from May 2014 to March 2015, the TN concentrations downstream were higher than the environmental standard limit of 6 mgTN/L (see supplementary Table A1). Additionally, the NO3-N concentrations reported by the VMM showed that seven out of ten measurements, registered in the same period, exceeded the VLAREM environmental standard limit and in one instance, the limit imposed by the Nitrates Directive. Considering that the 6 mgTN/L limit and 5.65 mgNO3-N/L are relatively close to each other, a comparison to define the exceedances of the measured concentrations could be done. Figure 3 shows the evolution of the monthly average nitrate concentrations recorded at the monitoring station in the Broenbeek–Stadendrevebeek from November 2002 until July 2016. It indicates that exceedances were encountered mostly during autumn and winter. Amongst the registered nitrate concentrations, 51% and 75% of the measurements exceeded the 11.3 mgNO3-N/L and the 5.65 mgNO3-N/L environmental standard limits, respectively. The maximum registered concentration in this period was 36 mgNO3-N/L (Figure 3). However, from January 2009 until July 2016 there was an evident decrease of the nitrate concentrations given the enforcement of the environmental decrees and a maximum concentration of 21 mgNO3-N/L was registered in this period. For this reason, the data recorded between 2009 and 2016 were considered as representative to determine the surface area needed to implement the ICW.
3.2. Nitrogen Removal Capacity
3.2.1. Achieved and Validated Nitrogen Removal Rates Based on Operating CWs in Flanders
At the extensive or polishing zone of the three different CWs, the nitrogen concentrations of the treated water ranged between 36.4 and 19.5 mgTN/L. The estimation of nitrogen removal indicated that nitrogen could be removed with an efficiency of 56–64%. The CW in Langemark reached the lowest nitrate-nitrogen removal rate during the studied period (Table A2 in Appendix A). Comparing the incoming concentrations between wetlands, it could be seen that the NO3-N removal rates decreased as lower concentrations of TN had to be removed. At the CW in Langemark, the average of the incoming concentration to the extensive zone was 19.2 mgNO3-N/L, which is lower than the 33.3 and 36.4 mgNO3-N/L registered in Gistel and Ichtegem, respectively. Nevertheless, the evaluation between the nitrogen removal rates reported in the literature and the ones achieved in the field validated the effectiveness of CWs in Flanders to remove low nitrogen concentrations from wastewater. Based on the resulting removal range of 0.15–0.43 gNO3-N/m2·day and the reported nitrogen removal rates between 0.08 and 0.46 gNO3-N/m2·day, further area estimations were performed based on the (0.05–0.45 gNO3-N/m2·day) range. However, in this study the range between 0.25 and 0.35 gNO3-N/m2·day was the major focus since it is considered as the closest estimation of the real and current behaviour of CWs in Flanders.
3.2.2. First Order Rate Constant Based on the Kadlec and Knight Design Model Considering Seasonal Variations
In the second approach, four different constants were calculated to consider the effect of seasonality in nitrate removal. Table 2 presents the model constant values. Results indicated that in summer, higher removal rates would be achieved. Nitrate-nitrogen removal rates (kT) ranged between 9.5 m/year in winter to 27 m/year in summer [17,22,37]. Later, the presented model parameter values were used for the estimation of the surface area of FWS CWs.
3.3. Integrated Constructed Wetland Dimensioning
To estimate the areas needed for a CW, the defined parameters for winter conditions were used. These represent the worst-case scenario for performance efficiency, water quality, and flows that should be treated by the wetlands. In addition, the NO3-N removal rates calculated by both methodological approaches were considered, and then the estimated areas were compared between methods.
Based on the assumption that removal rates in Flanders could range between 0.25 and 0.35 gNO3-N/m2·day, the resulting surface area needed for implementing CWs ranged between 1.4 and 2 ha to meet the Nitrates Directive goal and between 2.4 and 3.4 ha to meet the Flemish Environment Regulations (see Table 3), which were slightly similar to the areas derived by the Kadlec and Knight approach which ranged between 1.3 and 3 ha to meet the Nitrates Directive goal and the Flemish Environment Regulations, respectively (see Table 4). Based on these results, the hydraulic retention times were calculated to estimate the likelihood of keeping the water in the wetlands in reality. In principle, extended periods of 12 to 28 days would be needed to keep the surface water in the CW to meet the Nitrates Directive and the VLAREM limits.
4. Discussion
The need to decrease diffuse nitrate pollution in the watercourses in Flanders and to meet environmental standard limits offers the opportunity to implement CWs as an eco-friendly treatment technique rather than an end-of-pipe method. CWs can be considered as an extra instrument to contribute to the achievement of the Nitrates Directive, not only in Flanders, but in other regions throughout Europe. Given the straightforward adaptability to the existing land, CWs can have different designs. Three potential options were presented for their implementation considering the land use and available open areas in the surroundings of the studied watercourse. In this section, the initial required control parameters are first discussed. Then the approach of how the nitrate removal rates were derived next to their importance for dimensioning ICWs is evaluated. Finally, the opportunities and shortcomings of the different proposed designs are discussed.
4.1. Total Nitrogen—Nitrate Concentrations and Water Quantity Measurements
Flanders has a network to closely monitor the physico-chemical parameters of large and small watercourses. Therefore, the potential locations where CWs can be allocated could be based on complied surface flows, monthly measured nitrate concentrations, frequent peak concentrations, and land use data. In the case of the Broenbeek, exceedances of nitrate concentrations have been recorded since 2002. To define an optimal design and location for the implementation of a CW, it was important to determine the water quality of the watercourse in the study. Higher NO3-N concentrations downstream from the Broenbeek, points 5a and 5b for example, could be the result of a significant input of nutrient concentrations coming from upstream agricultural activities and the high nutrient concentrations of the Watervlietbeek flowing into the Broenbeek. Donoso et al. [29] indicated that the current water quality status of the Broenbeek results from upstream discharge impacts rather than the discharged effluent from the CW in Langemark. In fact, nitrate concentrations in the Watervlietbeek, according to the reported values by the VMM, also exceed the environmental standard limits frequently. However, information on the spatial distribution of non-point pollution and loading rates is scarce, which can be a challenging factor prior to defining an optimal location for a CW.
The VMM measuring point showed that the highest nitrate concentrations mostly occurred during cold and rainy periods. During autumn and winter, higher concentrations of nutrients are expected due to agricultural and urban runoff coming into the watercourses, and therefore annual reports are presented for each winter year [38]. Additionally, lower nitrate concentrations in summer could be explained by the fact that the uptake of nutrients increases as the growth of macrophytes is promoted by warm and long daylight periods. This is in contrast to the colder seasons, when the macrophytes’ activity is low [17,34,37,39,40,41,42,43]. Moreover, the VMM report of 2012 indicated that the decreasing tendency of nitrate concentrations shown from 2009 to the present time is the result of implementing the Manure Decree in 2000, the enforcement of standard levels, and the reduction of livestock production [44].
4.2. Nitrogen Removal Capacity
A large number of CWs have been used as tertiary treatment techniques of wastewater in comparison with wetlands used to control non-point source pollution. Hence, the achieved and reported removal rates in the literature mostly represent the outcomes obtained from wetlands working under controlled conditions. On the contrary, CWs treating agricultural runoff have to deal with different surface flows and pollutant concentrations of different sources [15,16,21,25,36,45,46]. Therefore, the determined nitrate removal rates could be considered as a good guide for estimating the surface area needed, but validation in the field will increase the certainty of the predicted values. Although the used information is representative for the case study, it is acknowledged that a more careful investigation of the local conditions and of the exact location of high nutrient load sources can further refine the dimensioning of the CWs.
For the aim of this study, the modelled surface flows by the VMM allowed the prediction of flow variations and volume that should be treated by a CW. Nonetheless, as the expected NO3-N removal rates can greatly differ, therefore the worst case conditions were taken into account to define the area needed for implementation [47,48].
4.3. Integrated Constructed Wetland Dimensioning
Two different approaches to estimate the surface area needed for CWs to decrease the NO3-N concentrations from small waterways were tested and compared. The analysis to define whether the implementation of CWs would be feasible indicated that by considering specific parameters, a good estimate of the surface area needed could be derived. In this case, the surface water flow, the NO3-N concentrations of the waterway, air temperature fluctuations due to seasonality, and nitrate removal rates were the parameters of focus for the development of this conceptual model. Andersson et al. [26], Carleton et al. [49], and Tonderski et al. [11] took into account the same parameters to estimate the reduction of nitrogen and phosphorus in potential wetlands. The outcome of the developed dynamic mass balance model showed a positive contribution of the air temperature on the water balance to simulate the nutrient dynamics and to determine the impact of CWs on their reduction.
Consequently, the calculations of the nitrate removal rates and the estimated areas showed that for the present case study, a reasonable surface area would be needed to build a full-scale CWs. In addition, the size was comparable to the data reported in the literature. For example, Fink and Mitsch [17] proved that a created or restored wetland of 1.2 ha could effectively reduce diffuse nitrate concentrations coming from an agricultural and forested watershed of 17 ha. Similar to the present study, the seasonal and flow variations, nutrient loads, retention time, and land use were considered to estimate the effectiveness of the restored wetland. The average net reduction of nitrate levels of 40%, was similar to the studies performed by Hernandez and Mitsch [21] and Land et al. [22]. Thus, our estimated results could be theoretically evaluated with the literature findings presenting CWs as an appealing tool to tackle agricultural diffuse pollution. Nevertheless, only by following the Kadlec and Knight approach, residence times were estimated once the area needed was known. As a result, surface water is expected to be retained for a prolonged period to reach the NO3-N concentrations up to or below the Nitrates Directive limit. Therefore, there is a need to adapt the CW design based on the available land, the hydrology, and the conservation of the ecosystem. Currently, the results suggest that for the wetlands’ design, other variables should come into play, as retaining the water for extended periods (14–28 days) in the calculated areas without pumps or other adaptations that control the flow is not feasible. Otherwise, larger surface areas will have to be converted to wetlands. Keeping in mind that the impact on the whole ecosystem functioning must be minimal, the CW design should be adapted to the site location to reduce the residence time and to meet the environmental water quality standards. We underline that, notwithstanding the designs presented in Figure 2, the required areas could be applied for any option, as the three of them represent FWS CWs. However, it differs in the way that each design would be adapted to the available land and to the expected NO3-N removal once the CWs are functioning on the field scale.
Similar to the present study, Arheimer and Wittgren [50] estimated the retention time required to decrease nitrogen concentrations to a target value by evaluating the performance of full scale natural wetlands receiving agricultural runoff. Then, they predicted the fate of the nutrients into a whole catchment to evaluate the effect of using CWs to decrease pollutants. Finally, a good estimate of the area that would be needed to implement wetlands throughout the catchment area was achieved. In the results, Arheimer and Wittgren [50] showed that a large area would be required and no significant decrease of nitrogen concentrations would be reached. However, the studied watercourses had much lower nitrogen concentrations, in the range of 4.6–17.1 mgTN/L, than the ones we considered in our study. In contrast to our study, Arheimer and Wittgren [50] used hypothetical values for surface flows and they did not consider the location of potential wetlands, whereas in the present case study, the surface flows were defined based on the PDM run by the VMM (383.4–1226.1 m3/day) and these predicted values were also much lower than the reported ones (1402–27,326 m3/day). Therefore, implementing CWs throughout our selected case study location can result in a decrease of the NO3-N concentration, as reported in other studies [35,51].
Considering the limited land availability in Flanders, it can be suggested that the important factors for defining the most appropriate location of CWs are: the streams with high NO3-N concentrations and low surface flows surrounded by available land which could be replaced by a CW.
To this end, three different designs were proposed. Broadening of the river course (Figure 2a) represents the most promising option since a larger amount of surface water could be treated in comparison with the two other designs (Figure 2b,c). However, this design suggests that not all the water running through the wetland will be equally treated and NO3-N concentrations will not always decrease proportionally with the retention time. Thus, by placing sand bags opposite to each other, in each side of the wetland and in alternated positions as shown in Figure 2a, water would be forced to pass through the entire matrix. Nevertheless, it is acknowledged that one of the disadvantages of this design is that high fluctuations of water flow will inevitably lead to short-circuiting.
Even though high nutrient removal efficiencies cannot always be reached with traditional engineering systems, especially in—hard to control—systems as presumed in this study, promoting implementation at the field scale would result in decreased nitrate levels in streams at reduced human labour and low costs. In addition, extra ecosystem services could result from their implementation, for instance, flood control, groundwater recharge, biodiversity increase, habitat for spawning and wildlife, as well as aesthetic values [52]. Another advantage of broadening the river course is that the arable land needed would be equally distributed at both sides of the stream. At some locations where land is needed but limited, land owners would trade their land, mainly of bare profit, be converted to a wetland in return for subsidies. It is important to consider that social acceptance also plays an important role for implementing the present study, hence, permits and regulations should be balanced between the preservation of the environment and the welfare of farmers’ activities.
The second option, where wetland plants are planted along the bank (Figure 2b) in comparison to the other two presented designs could result in a less amount of water treated. It is expected that a major part of the polluted water would not be treated as it would follow the centre of its natural course. Thus, limited contact time between the water and macrophytes would lead to low NO3-N removal rates, even though the incorporation of macrophytes through the whole length of the river bank promotes the constant uptake of nutrients. Macrophytes will assimilate nitrogen from the soil and accumulate it in the plant tissues. Moreover, they comprise a good source of carbon that enhances the denitrification process [53]. Yet, an opportunity of this proposal in comparison with the other two designs is the minor modifications and impact caused on the riverbanks, surface flow, and ecosystem. The enhancement of NO3-N removal could be tested and compared by incorporating different types of macrophytes versus monocultures. On the one hand, different plants will enhance the landscape and biodiversity. On the other hand, having monocultures of non-native species such as Phragmites australis, Typha angustifolia, or latifolia, whose efficiency and robustness for pollutant removal have been tested, can result in higher nitrate removal concentrations [41,54,55].
The third option (Figure 2c) proposes the treatment of some volume of the surface water by a CW built next to the watercourse. Nonetheless, the amount of water that could be treated will depend on: (1) the available land for implementing CWs, (2) the relevant decrease of NO3-N concentrations downstream that could be achieved, after the treated water is brought back to the stream. In this case, the surface flow would be regulated by pumps or by differentiating the level between the watercourse and the location where CWs are built. Therefore, there is a higher chance to control conditions and more accurately estimate the efficiency of the treatment plants. Yet, a higher contribution of human labour and energy would be needed.
In their study, Gachango et al. [56] reported different components that a cost-analysis for implementing CWs should have. Excavation, machinery, transportation of materials, ground work, and wetland vegetation establishment costs were some of the considered factors. Other components such as consultancy fees of wetlands experts, permits for implementations, and land use trade-offs were reported as less essential, but could also influence the overall costs. The authors concluded that nitrogen pollution could be reduced at relatively low costs. However, they acknowledged that an accurate cost-analysis needs relevant and substantial case specific data on incoming flows, loading concentrations, wetland design, construction, and nutrient removal.
Based on the estimated and reported values by the Department of Agriculture and Fisheries, the Flanders’ Agricultural Marketing Board, and the land market, the value of one hectare of agricultural land fluctuates between 60,000 and 80,000 euros [57,58,59,60]. In addition to these values, it has been estimated that the price for constructing wetland systems fluctuates between 100,000 and 200,000 euros per hectare [61]. These prices, however, include intensive excavation works, the use of specialized substrates, liners, pipes, and pumps to treat water with high nitrate concentrations.
Thus, if the maximum costs and calculated area of 3.4 hectares for a CW are considered, the total costs of land acquisition and conversion could vary between 544,000 and 952,000 euros. Nevertheless, it is important to note that this study suggests the integration of CWs preferably at marginal land found along the waterways, periodically flooded, and with existing depression. In this manner, the land and excavation costs will decrease. Additionally, regarding Figure 2a,b, it is assumed that no liner, pumps, or pipes are needed. The integration of wetlands into the landscape in a harmonious way implies the operation with clay, natural substrates, constant flows, and no extra protection for groundwater. As a consequence, the total cost for implementing ICWs will be case specific, although reduced to less than 50,000 euros. High-priced components would be mainly related to hydraulic infrastructure works (e.g., particular considerations for bank adaptations and improvements).
In summary, taking into account the three proposed designs, the actual difference of implementation costs will depend on the labour work, machinery, planting of wetland vegetation, and the effective removal rates achieved by CWs tested in the field. Nonetheless, it is important to note that, the overall implementation costs between the three designs would be comparable.
5. Conclusions
In conclusion, our study showed that ICWs offer an interesting perspective to tackle diffuse nitrate pollution in small watercourses given its relatively easy construction according to the available land. To avoid the overestimation of the wetland size, the insights of flow dynamics, nutrient type, and concentrations at the small fresh watercourses, as well as temperature variations have to be well documented. Two approaches based on the literature findings and field studies to determine the area needed for a CW were assessed. Areas of around 1.4 to 2 ha and around 2.4 to 3.4 ha were calculated as the land needed to decrease nitrate-nitrogen concentrations from agricultural runoff and to meet the Nitrates Directive and the VLAREM limits, respectively. Flanders is characterised as a densely populated region where land conflicts are encountered and strict environmental standard limits are yet to be met. Implementing CWs of relatively small areas that are adapted to the available land to tackle diffuse nitrate pollution can be considered as a viable solution to this issue.
The present study showed that wastewater with relatively low NO3-N concentrations (average of 36.4 mgNO3-N/L), could be efficiently treated across CWs located in Flanders to meet the environmental standard limits. We found that the important factors to define the most appropriate location of CWs are streams with high NO3-N concentrations and low surface flows as well as available land which could be replaced with a wetland. The added ecosystem services and existing expertise in the functioning and performance of CWs in the field make this study an important source of information that stakeholders and policy makers could take into consideration not only in Flanders but across Europe.
Acknowledgments
This work was supported by the National Secretary of Higher Education, Science, Technology, and Innovation (SENESCYT)–Ecuador. Open Call 2012, Second Phase. We would like to thank the Flanders Environment Agency (VMM) which provided us with data on the hydrological regime, nitrate concentrations of the watercourse, and temperature.
Author Contributions
Erik Meers conceived the analysis and performance of the present study; Peter L. M. Goethals, Pieter Boets, Sacha Gobeyn, and Natalia Donoso participated in the design and development of the research hypotheses; Denis De Wilde collected and analysed the water samples; Sacha Gobeyn and Natalia Donoso analysed the data; Natalia Donoso wrote the paper with collaboration and revision from Pieter Boets, Sacha Gobeyn, Erik Meers, and Peter L. M. Goethals.
Conflicts of Interest
The authors declare no conflict of interest. The founding sponsors had no role in the design of the study; in the collection, analyses, or interpretation of data; in the writing of the manuscript, and in the decision to publish the results.
Appendix A

Table A1.
Evolution of total nitrogen (TN) concentrations upstream and downstream from the discharge of the effluent coming from the CW located in Langemark versus the reported data by the VMM at the measuring point Broenbeek–Stadendrevebeek.
Table A1.
Evolution of total nitrogen (TN) concentrations upstream and downstream from the discharge of the effluent coming from the CW located in Langemark versus the reported data by the VMM at the measuring point Broenbeek–Stadendrevebeek.
| Sampling Site Code | 5a | 5b | 3a |
|---|---|---|---|
| Sampling Date | Downstream Broenbeek Location 1 | Downstream Broenbeek Location 2 | Manure Action Plan Measuring Point |
| mgTN/L | mgTN/L | mgNO3-N/L | |
| 14 April | 10.8 (a) | 10.7 (a) | 9.6 (b) |
| 14 May | 18.6 (a) | 21.8 (a) | 5.0 |
| 14 July | 14.9 (a) | 21.9 (a) | 7.0 (b) |
| 14 August | 15.5 (a) | 25.9 (a) | 4.2 |
| 14 September | 11.8 (a) | 15.9 (a) | 7.5 (b) |
| 14 October | 10.3 (a) | 12.8 (a) | 1.7 |
| 14 November | 12.1 (a) | 14.6 (a) | 6.3 (b) |
| 14 December | 15.8 (a) | 15.6 (a) | Not reported |
| 15 March | 23.9 (a) | 28.5 (a) | 12.6 (c) |
| 15 April | 25.9 (a) | 38.0 (a) | 10.8 (b) |
| 15 May | 36.0 (a) | 40.3 (a) | 7.0 (b) |
Notes: (a) Values indicating TN concentrations exceeding the VLAREM (6 mgTN/L). (b) Values indicating NO3-N concentrations exceeding the VLAREM (5.65 mgNO3-N/L) limit. (c) Value indicating NO3-N concentration exceeding the Nitrate Directives (11.3 mgNO3-N/L) limit.
Table A2.
Nitrate-nitrogen removal capacity of the extensive zone or polishing zone of CWs in Flanders by treating the liquid fraction of animal manure.
Table A2.
Nitrate-nitrogen removal capacity of the extensive zone or polishing zone of CWs in Flanders by treating the liquid fraction of animal manure.
| Sampling Site | Units | 3a | 3b | 3c |
|---|---|---|---|---|
| Location | Langemark | Gistel | Ichtegem | |
| Average incoming flow | m3/day | 9.0 | 71.5 | 11.1 |
| Average incoming TN concentration | g/m3 | 19.2 | 33.3 | 36.4 |
| Average outgoing TN concentration | g/m3 | 7.9 | 14.6 | 12.9 |
| Extensive or polishing zone surface area | m2 | 676 | 6000 | 604 |
| Average NO3-N removal rate | g/m2·day | 0.15 | 0.22 | 0.43 |
| Removal efficiency | % | 59 | 56 | 64 |
References
- Eurostat Agri-Environmental Indicator-Nitrate Pollution of Water. Available online: http://ec.europa.eu/eurostat/statistics-explained/index.php/Agri-environmental_indicator_-_nitrate_pollution_of_water (accessed on 8 February 2016).
- Lee, C.; Fletcher, T.D.; Sun, G. Nitrogen removal in constructed wetland systems. Eng. Life Sci. 2009, 9, 11–22. [Google Scholar] [CrossRef]
- Miller, J.J.; Handerek, B.P.; Beasley, B.W.; Olson, E.C.S.; Yanke, L.J.; Larney, F.J.; McAllister, T.A.; Olson, B.M.; Selinger, L.B.; Chanasyk, D.S.; et al. Quantity and quality of runoff from a beef cattle feedlot in southern Alberta. J. Environ. Qual. 2005, 33, 1088–1097. [Google Scholar] [CrossRef]
- EPA Aquatic Life Criteria-Ammonia. Available online: https://www.epa.gov/wqc/aquatic-life-criteria-ammonia (accessed on 7 February 2017).
- European Environment Agency Ammonium Concentrations in Rivers. Available online: http://www.eea.europa.eu/data-and-maps/indicators/ammonium-concentrations-in-rivers (accessed on 7 February 2017).
- Collins, A.L.; McGonigle, D.F. Monitoring and modelling diffuse pollution from agriculture for policy support: UK and European experience. Environ. Sci. Policy 2008, 11, 97–101. [Google Scholar] [CrossRef]
- Vlaamse Milieumaatschappij. Nutriënten in Oppervlaktewater in Landbouwgebied, Resultaten MAP-Meetnet 2014–2015; Vlaamse Milieumaatschappij: Aalst, Belgium, 2015. (In Dutch) [Google Scholar]
- Vlaamse Milieumaatschappij. VLAREM II-Bijlagen; Vlaamse Milieumaatschappij: Aalst, Belgium, 2016; p. 443. (In Dutch) [Google Scholar]
- Rousseau, D.P.; Vanrolleghem, P.A.; De Pauw, N. Constructed wetlands in Flanders: A performance analysis. Ecol. Eng. 2004, 23, 151–163. [Google Scholar] [CrossRef]
- Braskerud, B.C. Factors affecting nitrogen retention in small constructed wetlands treating agricultural non-point source pollution. Ecol. Eng. 2002, 18, 351–370. [Google Scholar] [CrossRef]
- Tonderski, K.S.; Arheimer, B.; Pers, C.B. Modeling the Impact of Potential Wetlands on Phosphorus Retention in a Swedish Catchment. AMBIO A J. Hum. Environ. 2005, 34, 544–551. [Google Scholar] [CrossRef]
- Gunes, K.; Tuncsiper, B.; Drizo, A.; Masi, F.; Ayaz, S.; Tufekci, H. Constructed and riverine wetlands design considerations for domestic and agricultural diffuse pollution treatment—A case study from Turkey. Desalin. Water Treat. 2016, 57, 11988–11998. [Google Scholar] [CrossRef]
- Baker, L.A. Introduction to nonpoint source pollution in the United States and prospects for wetland use. Ecol. Eng. 1992, 1, 1–26. [Google Scholar] [CrossRef]
- Van der Valk, A.G.; Jolly, R.W. Recommendations for research to develop guidelines for the use of wetlands to control rural nonpoint source pollution. Ecol. Eng. 1992, 1, 115–134. [Google Scholar] [CrossRef]
- Mitsch, W.J.; Day, J.W.; Gilliam, J.W.; Groffman, P.M.; Hey, D.L.; Randall, G.W.; Wang, N. Reducing nitrogen loading to the Gulf of Mexico from the Mississippi River basin: Strategies to counter a persistent ecological problem. Bioscience 2001, 51, 373–388. [Google Scholar] [CrossRef]
- Mitsch, W.J.; Day, J.W.; Zhang, L.; Lane, R.R. Nitrate-nitrogen retention in wetlands in the Mississippi River Basin. Ecol. Eng. 2005, 24, 267–278. [Google Scholar] [CrossRef]
- Fink, D.F.; Mitsch, W.J. Seasonal and storm event nutrient removal by a created wetland in an agricultural watershed. Ecol. Eng. 2004, 23, 313–325. [Google Scholar] [CrossRef]
- Luc, L.; Dominiek, V.; Guy, M.; Johan, M.; Saelens, S. Gemeentelijk Ruimtelijk Structuurplan LANGEMARK POELKAPELLE; West-Vlaamse Intercommunale (WVI): Langemark Poelkapelle, Belgium, 2012; Available online: http://www.langemark-poelkapelle.be/website/1617-www/version/default/part/AttachmentData/data/deel%201%20grs.pdf (accessed on 26 May 2016).
- Cawley, A.M.; Healy, M. Evaluation of Waste Treatment Performance of Constructed Wetlands with Special Reference to Williamstown Co. Galway Wetland System. In National Hydrology Seminar 2000; NUI Galway OÉ Gaillimh: Galway, Ireland, 2000; pp. 42–50. [Google Scholar]
- Bachand, P.A.M.; Horne, A.J. Denitrification in constructed free-water surface wetlands: I. Very high nitrate removal rates in a macrocosm study. Ecol. Eng. 1999, 14, 9–15. [Google Scholar] [CrossRef]
- Hernandez, M.E.; Mitsch, W.J. Denitrification in created riverine wetlands: Influence of hydrology and season. Ecol. Eng. 2007, 30, 78–88. [Google Scholar] [CrossRef]
- Land, M.; Granéli, W.; Grimvall, A.; Hoffmann, C.; Mitsch, W.J.; Tonderski, K.S.; Verhoeven, J.T. How effective are created or restored freshwater wetlands for nitrogen and phosphorus removal? A systematic review protocol. Environ. Evid. 2013, 2, 16. [Google Scholar] [CrossRef]
- Beutel, M.W.; Newton, C.D.; Brouillard, E.S.; Watts, R.J. Nitrate removal in surface-flow constructed wetlands treating dilute agricultural runoff in the lower Yakima Basin, Washington. Ecol. Eng. 2009, 35, 1538–1546. [Google Scholar] [CrossRef]
- Kemp, M.C.; George, D.B. Subsurface flow constructed wetlands treating municipal wastewater for nitrogen transformation and removal. Water Environ. Res. 1997, 69, 1254–1262. [Google Scholar] [CrossRef]
- Tonderski, K.; Geranmayeh, P.; Johannesson, K.; Ulén, B.; Weisner, S.E.B. Nitrogen and Phosphorus removal in agricultural wetlands. In Proceedings of the Wetlands in Agricultural Landscapes: Present State and Perspectives in Europe, International Conference, Prague, Czech Republic, 11–16 Octorber 2015; Ministry of the Environment of Czech Republic: Praha, Czech Republic, 2015. [Google Scholar]
- Andersson, J.L.; Bastviken, S.K.; Tonderski, K.S. Free water surface wetlands for wastewater treatment in Sweden: Nitrogen and phosphorus removal. Water Sci. Technol. 2005, 51, 39–46. [Google Scholar] [PubMed]
- Standard Methods for the Examination of Water and Wastewater, 21st ed.; APHA (American Public Health Association): Washington, DC, USA; AWWA (American Water Works Association): Denver, CO, USA, 2005.
- Moore, R.J. The PDM rainfall-runoff model. Hydrol. Earth Syst. Sci. 2007, 11, 483–499. [Google Scholar] [CrossRef]
- Donoso, N.; Boets, P.; Michels, E.; Goethals, P.L.M.; Meers, E. Environmental Impact Assessment (EIA) of Effluents from Constructed Wetlands on Water Quality of Receiving Watercourses. Water Air Soil Pollut. 2015, 226, 205. [Google Scholar] [CrossRef]
- Meers, E.; Tack, F.M.G.; Tolpe, I.; Michels, E. Application of a Full-scale Constructed Wetland for Tertiary Treatment of Piggery Manure: Monitoring Results. Water Air Soil Pollut. 2008, 193, 15–24. [Google Scholar] [CrossRef]
- Kadlec, R.H.; Knight, R.L. Treatment Wetlands; Lewis-CRC Press: Boca Raton, FL, USA, 1996. [Google Scholar]
- Reed, S.C.; Crites, R.W.; Middlebrooks, J.E. Natural Systems for Waste Management and Treatment, 2nd ed.; McGraw-Hill, Inc.: New York, NY, USA, 1995. [Google Scholar]
- Flemish Government WATERINFO.be. Available online: http://www.waterinfo.be/ (accessed on 26 May 2016).
- Kadlec, R.H.; Reddy, K.R. Temperature Effects in Treatment Wetlands. Water Environ. Res. 2001, 73, 543–557. [Google Scholar] [CrossRef] [PubMed]
- Díaz, F.J.; Ogeen, A.T.; Dahlgren, R.A. Agricultural pollutant removal by constructed wetlands: Implications for water management and design. Agric. Water Manag. 2012, 104, 171–183. [Google Scholar] [CrossRef]
- Vymazal, J.; Březinová, T. The use of constructed wetlands for removal of pesticides from agricultural runoff and drainage: A review. Environ. Int. 2015, 75, 11–20. [Google Scholar] [CrossRef] [PubMed]
- Spieles, D.J.; Mitsch, W.J. The effects of season and hydrologic and chemical loading on nitrate retention in constructed wetlands: A comparison of low- and high-nutrient riverine systems. Ecol. Eng. 1999, 14, 77–91. [Google Scholar] [CrossRef]
- De Cooman, W.; Theuns, I.; Vos, G.; Pelicaen, J.; Maeckelberghe, H.; Gabriels, W.; Timmermans, G.; Kestens, S.; Barrez, I.; Van den Broeck, S.; et al. Milieurapport Vlaanderen, Achtergronddocument 2010, Kwaliteit Oppervlaktewater; Vlaamse Milieumaatschappij: Alst, Belgium, 2010. (In Dutch) [Google Scholar]
- Garfí, M.; Pedescoll, A.; Bécares, E.; Hijosa-Valsero, M.; Sidrach-Cardona, R.; García, J. Effect of climatic conditions, season and wastewater quality on contaminant removal efficiency of two experimental constructed wetlands in different regions of Spain. Sci. Total Environ. 2012, 437, 61–67. [Google Scholar] [CrossRef] [PubMed]
- Fleming-Singer, M.S.; Horne, A.J. Balancing wildlife needs and nitrate removal in constructed wetlands: The case of the Irvine Ranch Water District’s San Joaquin Wildlife Sanctuary. Ecol. Eng. 2006, 26, 147–166. [Google Scholar] [CrossRef]
- Lee, B.H.; Scholz, M. What is the role of Phragmites australis in experimental constructed wetland filters treating urban runoff? Ecol. Eng. 2007, 29, 87–95. [Google Scholar] [CrossRef]
- Tanner, C.C.; Kadlec, R.H. Influence of hydrological regime on wetland attenuation of diffuse agricultural nitrate losses. Ecol. Eng. 2013, 56, 79–88. [Google Scholar] [CrossRef]
- García-Lledó, A.; Ruiz-Rueda, O.; Vilar-Sanz, A.; Sala, L.; Bañeras, L. Nitrogen removal efficiencies in a free water surface constructed wetland in relation to plant coverage. Ecol. Eng. 2011, 37, 678–684. [Google Scholar] [CrossRef]
- Leroy, P.; D’Hondt, P.; Van Steertegem, M.; Raspoet, D.; Vinckier, C.; Beyst, V.; Vanongeval, L.; Cloots, L.; Van Gils, W.; Loots, I.; et al. MIRA Indicatorrapport 2012; Vlaamse Milieumaatschappij: Alst, Belgium, 2012. (In Dutch) [Google Scholar]
- Hammer, D.A. Designing constructed wetlands systems to treat agricultural nonpoint source pollution. Ecol. Eng. 1992, 1, 49–82. [Google Scholar] [CrossRef]
- Bhuvaneswari, G. Nitrogen Dynamics in a Constructed Wetland Receiving Plant Nursery Runoff in Southeastern United States; University of Florida: Gainesville, FL, USA, 2008. [Google Scholar]
- U.S. Department of the Interior. Guidelines for Collecting Data to Support Statistical Analysis of Water Quality for Wetland Planning; Bureau of Reclamation Technical Service Center: Denver, CO, USA, 2013.
- Wu, H.; Zhang, J.; Ngo, H.H.; Guo, W.; Hu, Z.; Liang, S.; Fan, J.; Liu, H. A review on the sustainability of constructed wetlands for wastewater treatment: Design and operation. Bioresour. Technol. 2015, 175, 594–601. [Google Scholar] [CrossRef] [PubMed]
- Carleton, J.N.; Grizzard, T.J.; Godrej, A.N.; Post, H.E. Factors affecting the performance of stormwater treatment wetlands. Water Res. 2001, 35, 1552–1562. [Google Scholar] [CrossRef]
- Arheimer, B.; Wittgren, H.B. Modelling nitrogen removal in potential wetlands at the catchment scale. Ecol. Eng. 2002, 19, 63–80. [Google Scholar] [CrossRef]
- Ellis, J.B.; Shutes, R.B.E.; Revitt, D.M. Guidance Manual for Constructed Wetlands; Environment Agency: London, UK, 2003.
- Pappalardo, S.E.; Otto, S.; Gasparini, V.; Zanin, G.; Borin, M. Mitigation of herbicide runoff as an ecosystem service from a constructed surface flow wetland. Hydrobiologia 2016, 774, 193–202. [Google Scholar] [CrossRef]
- Saeed, T.; Sun, G. A review on nitrogen and organics removal mechanisms in subsurface flow constructed wetlands: Dependency on environmental parameters, operating conditions and supporting media. J. Environ. Manag. 2012, 112, 429–448. [Google Scholar] [CrossRef] [PubMed]
- Salehzadeh, M.; Hossein, R. Performance Removal Nitrate and Phosphate from Treated Municipal. J. Civ. Eng. Urban. 2014, 4, 315–321. [Google Scholar]
- Todorovics, C.; Garay, T.M.; Bratek, Z. The use of the reed (Phragmites australis) in wastewater treatment on constructed wetlands. In Proceedings of the 8th Hungarian Congress on Plant Physiology and the 6th Hungarian Conference on Photosynthesis, Szeged, Hungary, 22–25 August 2005; Volume 49, pp. 81–83. [Google Scholar]
- Gachango, F.G.; Pedersen, S.M.; Kjaergaard, C. Cost-Effectiveness Analysis of Surface Flow Constructed Wetlands (SFCW) for Nutrient Reduction in Drainage Discharge from Agricultural Fields in Denmark. Environ. Manag. 2015, 56, 1478–1486. [Google Scholar] [CrossRef] [PubMed]
- Aquarama Novotel Kiest Belucht Rietveld Voor Zuivering Afvalwater. Available online: http://www.saniwijzer.nl/media/stowa_saniwijzer/org/documents/lopende projecten/aquarama71nl_84_85_novotel.pdf (accessed on 12 May 2017).
- Livios Hoeveel Kost Landbouwgrond? Available online: http://www.livios.be/nl/bouwinformatie/bouwen-verbouwen-of-kopen/ (accessed on 12 May 2017).
- De Beleggersgids Wat Is de Waarde van Landbouwgrond? Available online: https://debeleggersgids.be/vastgoed/types/waarde-landbouwgrond (accessed on 12 May 2017).
- Bergen, D. Grond te Koop? Elementen Voor de Vergelijking van Prijzen van Landbouwgronden en Onteigeningsvergoedingen in Vlaanderen en Nederland; Departement Landbouw en Visserij: Brussel, Belgium, 2011. (In Dutch) [Google Scholar]
- Van Oirshot, D.; (Rietland, Minderhout, Antwerp, Belgium). Personal communication, 2017.
Figure 1.
Map overview indicating points of reference and measuring points from which nitrate and total nitrogen concentrations, nitrate-nitrogen removal rates, surface flow, and temperature data were retrieved.
Figure 1.
Map overview indicating points of reference and measuring points from which nitrate and total nitrogen concentrations, nitrate-nitrogen removal rates, surface flow, and temperature data were retrieved.

Figure 2.
Schematic representation of possible designs for ICWs. (a) Shallow ICW within the watercourse; (b) Wetland plants along the river banks; (c) ICW next to the watercourse functioning as a partial bypass.
Figure 2.
Schematic representation of possible designs for ICWs. (a) Shallow ICW within the watercourse; (b) Wetland plants along the river banks; (c) ICW next to the watercourse functioning as a partial bypass.

Figure 3.
Evolution of monthly average NO3-N concentrations at the Broenbeek from November 2002 to April 2016. Data from the period of January 2009 to April 2016 is used in this study and indicated by the black box.
Figure 3.
Evolution of monthly average NO3-N concentrations at the Broenbeek from November 2002 to April 2016. Data from the period of January 2009 to April 2016 is used in this study and indicated by the black box.

Table 1.
Nitrogen removal rates reported in the literature.
| Reference Data Used for Calculations and Scientific Validation | Type of Treated Wastewater | Measure of Control | CWs Type | Temperature | Incoming Concentration | Nitrogen Removal Rates | Efficiency | Area | Reference |
|---|---|---|---|---|---|---|---|---|---|
| °C | mgNO3-N/L | gNO3-N/m2·day | % | ha | |||||
| [*] Review Field validated | Urban wastewater and Agricultural run-off | End-of-pipe treatment | FWS | 6–18 | 18–32 | 0.46 | 58 | 0.1 | [19] |
| [*] Field validated | Urban wastewater | End-of-pipe treatment Macrocosm | FWS | 21 | 8 | 0.1–2.8 | 20 | 0.36 | [20] |
| [*] Field validated | Agricultural run-off | Diffuse pollution control at river basin level | FWS | 19–21 | 4.1 | 0.08–0.19 | N/A | 1 | [21] |
| [*] Field validated | Agricultural run-off and groundwater | Diffuse pollution control at river basin level | FWS | N/A | 0.79 | 0.11 | 41 | 1.2 | [17] |
| [*] Review Field validated | Agricultural run-off | End-of-pipe treatment and diffuse pollution control at river basin level | FWS | 14–19 | Different concentrations | 0.11–0.50 | 39 | N/A | [22] |
| [*] Field validated | Agricultural run-off | End-of-pipe treatment | FWS | 10–21 | 1–3 | 0.14–0.15 | 57–63 | 1.6 | [23] |
| [*] Model based predictions | Urban wastewater | Diffuse pollution control at river basin level | SF | 11–18 | 0.8 | 0.35 | 25–50 | 5–20 | [24] |
| [*] Field validated | Urban wastewater | End-of-pipe treatment | FWS | 5–18 | 4.5–8.4 | 0.17–0.37 | 41–88 | 20–28 | [25,26] |
Notes: CWs = Constructed Wetlands, SF = Surface flow. FWS = Free water surface CWs with emergent plants. [*] = Data used to cross compare and validate field measurements to estimate the performance of CWs for NO3-N removal in Flanders.
Table 2.
Model parameter values for the design of FWS CWs and first order rate constants calculated at different temperatures. First order rate constant at temperature 20 °C [k20 (m/year)] = 35, Temperature correction factor (θ) = 1.09, Background pollutant concentration [C* (mgNO3-N/L)] = 0.00.
Table 2.
Model parameter values for the design of FWS CWs and first order rate constants calculated at different temperatures. First order rate constant at temperature 20 °C [k20 (m/year)] = 35, Temperature correction factor (θ) = 1.09, Background pollutant concentration [C* (mgNO3-N/L)] = 0.00.
| Seasons | Average Temperature (°C) | First Order Rate Constant kT (m/year) | Incoming NO3-N Concentration (mgNO3-N/L) | Average Incoming Surface Water Flow (m3/day) |
|---|---|---|---|---|
| Winter | 4.8 | 9.4 | 19.1 | 634.4 |
| Spring | 13.0 | 19.1 | 14.8 | 383.4 |
| Summer | 17.0 | 27.0 | 11.2 | 895.7 |
| Autumn | 8.7 | 13.2 | 10.4 | 1226.1 |
Table 3.
Surface area based on the achieved removal rates in the field considering variations of the surface flow and incoming concentrations according to seasonality.
Table 3.
Surface area based on the achieved removal rates in the field considering variations of the surface flow and incoming concentrations according to seasonality.
| Experimental and Reported Nitrate Removal Rates | Season | 0.05 | 0.15 | 0.25 | 0.35 | 0.45 |
|---|---|---|---|---|---|---|
| gNO3-N/m2·day | ||||||
| VLAREM Limit | Surface Area ha | |||||
| 5.65 mgNO3-N/L | Winter | 17 | 5.7 | 3.4 | 2.4 | 1.9 |
| Spring | 6.9 | 2.3 | 1.4 | 1.0 | 0.8 | |
| Summer | 9.9 | 3.3 | 2.0 | 1.4 | 1.1 | |
| Autumn | 12 | 3.9 | 2.3 | 1.7 | 1.3 | |
| Nitrates Directive Limit | ||||||
| 11.3 mgNO3-N/L | Winter | 10 | 3.3 | 2.0 | 1.4 | 1.1 |
| Spring | 2.7 | 0.9 | 0.5 | 0.4 | 0.3 | |
| Summer | - | - | - | - | - | |
| Autumn | - | - | - | - | - | |
Note: VLAREM = Flemish Environmental Regulations.
Table 4.
Surface area estimated based on Kadlec and Knight’s approach considering four different first order rate constants at temperature T, variations in the surface flow, and incoming concentrations according to seasonality.
Table 4.
Surface area estimated based on Kadlec and Knight’s approach considering four different first order rate constants at temperature T, variations in the surface flow, and incoming concentrations according to seasonality.
| Season | VLAREM Limit mgNO3-N/L | Nitrates Directive Limit mgNO3-N/L | ||
|---|---|---|---|---|
| 5.65 | 11.3 | |||
| HRT | Surface Area | HRT | Surface Area | |
| days | ha | days | ha | |
| Winter | 28 | 3.0 | 12 | 1.2 |
| Spring | 11 | 0.7 | 3 | 0.2 |
| Summer | 6 | 0.8 | 0.0 | |
| Autumn | 10 | 2.1 | 0.0 | |
Note: HRT = Hydraulic Retention Time.
© 2017 by the authors. Licensee MDPI, Basel, Switzerland. This article is an open access article distributed under the terms and conditions of the Creative Commons Attribution (CC BY) license (http://creativecommons.org/licenses/by/4.0/).
Share and Cite
MDPI and ACS Style
Donoso, N.; Gobeyn, S.; Boets, P.; Goethals, P.L.M.; Wilde, D.D.; Meers, E. Assessing the Integration of Wetlands along Small European Waterways to Address Diffuse Nitrate Pollution. Water 2017, 9, 369. https://doi.org/10.3390/w9060369
AMA Style
Donoso N, Gobeyn S, Boets P, Goethals PLM, Wilde DD, Meers E. Assessing the Integration of Wetlands along Small European Waterways to Address Diffuse Nitrate Pollution. Water. 2017; 9(6):369. https://doi.org/10.3390/w9060369
Chicago/Turabian StyleDonoso, Natalia, Sacha Gobeyn, Pieter Boets, Peter L. M. Goethals, Denis De Wilde, and Erik Meers. 2017. "Assessing the Integration of Wetlands along Small European Waterways to Address Diffuse Nitrate Pollution" Water 9, no. 6: 369. https://doi.org/10.3390/w9060369
Note that from the first issue of 2016, this journal uses article numbers instead of page numbers. See further details here.