Abstract
This study integrated coastal watershed models and combined them with a risk assessment method to develop a methodology to investigate the impact resulting from coastal disasters under climate change. The mid-western coast of Taiwan suffering from land subsidence was selected as the demonstrative area for the vulnerability analysis based on the prediction of sea level rise (SLR), wave run-up, overtopping, and coastal flooding under the scenarios of the years from 2020 to 2039. Databases from tidal gauges and satellite images were used to analyze SLR using Ensemble Empirical Mode Decomposition (EEMD). Extreme wave condition and storm surge were estimated by numerical simulation using the Wind Wave Model (WWM) and the Princeton Ocean Model (POM). Coastal inundation was then simulated via the WASH123D watershed model. The risk map of study areas based on the analyses of vulnerability and disaster were established using the Analytic Hierarchy Process (AHP) technique. Predictions of sea level rise, the maximum wave condition, and storm surge under the scenarios of 2020 to 2039 are presented. The results indicate that the sea level at the mid-western coast of Taiwan will rise by an average of 5.8 cm, equivalent to a rising velocity of 2.8 mm/year. The analysis indicates that the Wuqi, Lukang, Mailiao, and Taixi townships are susceptive, low resistant and low resilient and reach the high-risk level. This assessment provides important information for creating an adaption policy for the mid-western coast of Taiwan.
1. Introduction
“Climate change” has been one of the most prevalent issues in the natural science field. The 2015 United Nations Climate Change Conference (COP 21) was held in Paris, France, and the Paris Agreement on the reduction of climate change was signed by participating countries. The Intergovernmental Panel on Climate Change (IPCC) also has its Fifth Assessment Report (AR5) [1] highlighting the latest global climate change trends with warnings. The report concludes that many natural systems are being negatively affected by regional climate changes as shown by much continental and marine evidence [2]. According to the IPCC (2014) report, the warming of the climate system is unequivocal. Since 1950, there have been unprecedented changes in the climate systems, which can be seen in both the observational historical records, from the late nineteenth century, and with paleoclimatic records spanning the last millennia. These changes are manifested by the warming of the atmosphere and oceans, by a decrease in the mass of the cryosphere, and by an increase in the concentrations of atmospheric greenhouse gases, among other types of processes [3].
The estimated average global flood losses are approximately US$6 billion per year, increasing to US$52 billion by 2050 with projected socio-economic change alone [4]. Recent studies concluded that climate scenarios from General Circulation Models (GCMs) or Regional Climate Models (RCMs) are the largest uncertainty for the estimation of future flows [5,6,7,8]. More studies have furthermore pointed out that climate change has been shown to affect local rainfall amounts, surface runoffs, and distribution of water resources [9,10,11,12]. This is typically characterized by shifts in temperature and precipitation, in response to the specifics of the regions, e.g., alteration of extremes, intensities, frequencies, and spatial and temporal patterns [13,14,15]. Climate change alters the risk of hydrological extremes on regional scales, and the hydrological response of a catchment can vary substantially, not only due to its location but also depending on the characteristics of the catchments [16,17,18,19].
During the past few decades, the upward historical trends of sea level rise (SLR) quantified from a small set of California tide gauges to a value of approximately 20 cm/century. This is very similar to the estimated value of the global mean sea level [20]. It is attributed primarily to global climate change and associated with the land situations [20,21,22,23]. So, using a dynamic modeling framework to examine the effects of global climate change, and SLR in particular, on tropical cyclone-driven storm surge, inundation is implemented [15,24,25,26,27]. The number of people estimated to be affected by flooding in 2100 is 16–388 million people/year for the mid (55-cm) global-mean SLR scenarios and up to 510 million people/year for the high (96-cm) scenario [28]. On the northern Gulf of Mexico, the total inundated land area increases by 87% and peak surge increases by as much as 1 m above the applied SLR in some areas, and other regions were subject to a reduction in peak surge with respect to the applied SLR, indicating a nonlinear response [25]. Passeri et al. [27] addressed that tidal amplitudes within the bays increased by 67% of 10.0 cm under the highest SLR scenario, and the ratio of the maximum flood to maximum ebb velocity decreased in the future scenarios by 26% and 39%. Bilskie et al. [24] showed that the storm surge response to SLR is dynamic and sensitive to changes in the landscape. Hovenga et al. [15] presented the effects of climate change on overland processes, river inflow, and sediment loading for the Apalachicola region. For the same region, Chen et al. [29] reported that the seasonal responses of runoff and sediment loads are slight, with contrasting behaviors from different models. However, flow increased from the baseline by 8% using model simulation. Previous researches have shown that tidal flows and storm surge dynamics really depend on future SLR scenarios [24,26,27].
Taiwan is located at the hub of the typhoon route in the West Pacific Ocean and is frequently struck by typhoons and tropical depressions with raging storms and pouring rains during the summer and autumn seasons. According to past century typhoon records from the Central Weather Bureau (CWB) in Taiwan, there are on average 4.0 typhoons per year in Taiwan. It is also noted that the strength and the scale of a typhoon has increased with the decreased center pressure in the last 14 years. This brings about heavy rains, big waves, storm surges, and floods in the coastal areas. The related long-term observations indicate that the SLR increases at a speed of 3.32 mm/year [24,30,31]. Statistics of historical data from different stations also confirm the increasing rising trend. A global rate of 3.36 ± 0.41 mm/year over the 14 years from 1993 to 2007 is investigated, but the regional sea level trend comparisons for the time periods of 1993–1999 and 1999–2005 reveal strong basin-scale polarities and pronounced inter-decadal variability, with a relative increase in the global mean SLR trend of 1.5 ± 0.7 mm/year in the latter seven years [30]. Water level changes due to storm surges and high tides resulting from typhoons often cause severe disaster to the coastal areas of Taiwan [32]. The storm surges and high tides directly striking the coasts bring about serious beach erosion and waves overtopping the seawall, causing seawater intrusion and floods in the coastal areas. These damage the crops, the fishing farms, life, and properties. They also have a colossal negative impact on the development of marine environment in Taiwan [32]. The assessment of the possible impact of climate changes could help us to create appropriate strategies for remediation and prevention. To classify risk levels, the Analytic Hierarchy Process (AHP) method was used to identify a flood hazard risk assessment [33,34].
Large populations live in the coastal areas, where they are exposed to a range of hazards including coastal flooding [35,36]. There are many studies on flood risk analysis that utilize geographic information systems, remote sensing, and hydraulic models in a combined way [37], and the basic model used to predict flood impacts has already been outlined by earlier studies [38,39]. This study aims to investigate the coastal adaptability to climate change-related disasters. A methodology integrating coastal watershed models and a risk assessment method was developed to investigate such impact on coastal areas. The mid-western coast of Taiwan was selected as the demonstrative site to test the approach. The final results of this methodology would produce risk maps derived from the results of analyses of vulnerability and hazard under the scenarios. The map could provide important information for engineers to make adaptations in Taiwan.
2. Methodology
2.1. Coastal Risk Assessment
Humans living in the coastal areas are often prone to the impact of storms, sea waves, tides, and SLR. To make matters worse, the present situations of global warming and climate change have made the SLR problems more conspicuous. Therefore, a systematic approach to assess the risk, including overall vulnerability and disaster analyses, becomes a necessity. The United Nations Disaster Relief Organization (UNDRO) in its 1979 report on Natural Disaster and Vulnerability Analysis [40] made an operational definition for disaster risk, which is the multiplication of hazard potential and vulnerability. Based to the definitions of UNDRO [40], hazard potential means the probability of occurrence, within a specific period of time in a given area, of a potentially damaging natural phenomenon. Furthermore, vulnerability represents the degree of loss to a given element at risk or to a set of such elements resulting from the occurrence of a natural phenomenon of a given magnitude, and it can be expressed on a scale from 0 (no damage) to 1 (total loss).
As mentioned above, the final results of risk analysis are represented by digital maps, which are overlapped by different hazard and vulnerability indexes, see Table 1. These indexes consist of four Coastal Hazard Indexes (CHIs) and 13 Coastal Vulnerability Indexes (CVIs). Each index in this study is to be categorized into five different levels represented by five different points, i.e., very low (1 point); low (2 points); medium (3 points); high (4 points); very high (5 points). These values provide a quantitative indicator to assess the risk. The higher weight of an indicator represents more significance than the lower one. A detailed description of these indexes and how the points are assigned will be presented later. The Analytic Hierarchy Process (AHP) was then employed to evaluate the risk. The AHP technique, developed by Thomas Saaty since the 1970s, is an effective tool for dealing with complex decision making and may aid the decision maker to set priorities and make the best decision. By reducing complex decisions to a series of pairwise comparisons and then synthesizing the results, the AHP helps to capture both subjective and objective aspects of a decision. In addition, the AHP incorporates a useful technique for checking the consistency of the decision maker’s evaluations, thus reducing the bias in the decision-making process [41]. It is calculated by the following equations:
where is the index of jth CHI or CVI in the ith domain, is the normalized index determined by the maximum and minimum , is the constructor of the ith domain by the weighted summation with the weight , and is the risk defined by the weight .

Table 1.
The structures and weights of the coastal risk analysis based on the Analytic Hierarchy Process (AHP) evaluation.
The Geographic Information System (GIS) was utilized for calculation, analysis, and display. The AHP calculation decomposes problems into simple hierarchical frameworks. Each layer of the framework is then searched for its key factors, whose order of precedence or contributions are evaluated. Then, the results are overlapped and processed into the final order of precedence of each project (factor). The AHP calculating process in this study can be briefly organized as: (1) describing the problems; (2) confirming all elements affecting the problems; (3) establishing hierarchical relationship; (4) establishing pairwise comparison matrices; (5) calculating eigenvectors to get the largest eigenvalue and calculate priority vectors; (6) checking consistency; (7) calculating hierarchical weights; (8) providing decision-making information. More details of the AHP process can be found in Lin and Tang [42].
According to Lan et al. [43], coastal hazard potential consists of four indexes which are associated with storm surges and floods in coastal areas caused by typhoons. Considering the specific threads of typhoons in Taiwan, the overflow in coastal areas results from the combined impact of precipitation, sea level rise, storm surge, wave setup, wave run-up, and overtopping. In this study, the integrated coastal watershed models were employed to describe the overflow as well as to determine each CHI. The results of these models provide the important information of the range and depth of coastal flooding. The weight of each index is determined by questionnaires from 100 experts and scholars with different major fields, including ocean engineering, hydraulic engineering, coastal engineering, and so on. The weight of each index is presented in Table 1. In addition, due to the vulnerability of these coastal areas, especially during the typhoon seasons, the weights of hazard indexes are higher than those of vulnerability indexes to reflect the seriousness of the problem.
The CVIs are indicators of a region with specific weakness exposed to natural disasters and the capability of coping with it. The concept of coastal vulnerability was first proposed by the Coastal Zone Management (CZM) of the International Plant Protection Convention (IPPC) in 1991 [44]. The coastal vulnerability defined in this study refers to the potential coastal disasters which are caused in the process of flooding or SLR resulting from climate change-related stormy rains. By referring to related researches (e.g., [45,46,47,48]) as well as to the consideration of domestic status quo and data availability, 13 coastal vulnerability indicators were established within the constructs of artificial facilities, environmental geography, and social economy. Within these 13 indicators, the relative ratios of seawall length, seawall height, and tidal gates belong to the construct of artificial facility, which refers to the protection facilities of the hydraulic engineering structures. The coastal elevation, slopes, tidal range, land subsidence rate, coastal erosion rate, and land uses, e.g., harbors, industrial zones, agricultural areas, national parks, etc., belong to the environmental geography. The population density, education background, dependency ratio, and enterprise return are considered as the construct of social economy. The weights of indicators were also derived from the surveys of 100 experts and scholars in different disciplines, and they are also listed in Table 1. It is noted that the environmental geography domain is weighted at 0.548, which is higher than other values and indicates significant environmental problems.
2.2. Integrated Coastal Watershed Models
Coastal inundations due to wave overtopping of coastal structures and storm surges often cause serious damage to the populations. Ascertaining the areas that are prone to coastal inundation is essential to provide countermeasures for the mitigation of disaster. Integrated POM-WWM-WASH123D models [32] were employed for simulating the inundation areas of different scenarios. The Rankin Vortex Model (RVM) [49] was used to generate wind fields for the study area. Wave run-up and overtopping were also simulated based on the Reynolds averaged Navier–Stokes (RANS) equations with the particle level set method [50]. Different techniques, including Ensemble Empirical Mode Decomposition (EEMD) [31] and Fast Fourier Transformation (FFT), were applied to analyze the SLR of future scenarios. The upstream precipitation is estimated by time and space with a designed rainfall pattern, which is based on the “Hydrological Design Application Manual” published by the Water Resource Agency (WRA) of Taiwan, with long-term and short-term delays [51]. These provided initial and boundary conditions for the Integrated POM-WWM-WASH123D models to simulate the overland flow floods in the coastal areas and the hazard maps of the future climate scenarios.
The integrated POM-WWM-WASH123D models are briefly introduced as follows. The Princeton Ocean Model (POM) was developed by [52] and widely used to study oceanographic problems. It has been used to simulate the interactions between tides and ocean waves at the estuaries. The POM has been shown to be capable of simulating flow characteristics near estuaries. A more complete discussion of the theoretical bases and development of POM can be found in the public document [53]. The Wind Wave Model (WWM) was developed by Hsu et al. [54] to describe the processes of wave generation, refraction and diffraction, dissipation, and nonlinear wave–wave interactions. Data assimilation techniques were also included to improve the applicability of the sequential simulation. WASH123D stands for the Watershed Systems of 1D Stream-River Network, 2D Overland Regime, and 3D Subsurface Media and is an integrated multimedia, multi-process, physics-based computational model used for describing watershed-scale hydrology [55]. It also includes the flows of dendritic river/stream/canal networks, overland regimes, and subsurface media [56]. The depth-averaged 2-D diffusive wave equations are used to calculate the fluid flow in the watershed system [55]. The equations are solved with semi-Lagrangian and Galerkin finite element methods to determine coastal inundations [51]. Model applications were developed and applied to many of the river basins in Taiwan for flood and inundation forecasts for the purpose of disaster reduction [32,51,56]. In this study, WASH123D was employed for simulating surface routing to estimate the flood regions of the coast. The downstream boundary conditions were imposed on the basis of the surging tides as well as of the overtopping. The upstream boundary conditions were then specified by the precipitation. More details of POM-WWM-WASH123D models, including description, calibration, validation, and application, can be found in previous studies [32,51].
3. Application Area, Future Scenarios, and Results
3.1. Application Area
As shown in Figure 1, the mid-western coast of Taiwan, where Taichung City, Changhua County, and Yunlin County are located, were selected as the demonstrative site. The Da-an River, Dajia River, Wu River, Jhuoshuei River, and the Beigang River are major rivers flowing through these areas. The Taichung coast is mainly situated between the Da-an River and the Wu River, and its length is about 41 km. The area near the Da-an River and the Dajia River is an estuarine alluvial plain, featuring large tidal ranges, a well-developed tidal flat, and a famous wetland. In addition, this coastal area has suffered severe disasters in earlier times due to extremely storm surges, huge waves, and flat terrain. The Changhua coast is mainly located between the Wu River and the Jhuoshuei River, having a total length of about 61 km. The supply of sediments from the Wu River and the Jhuoshuei River and part of the Dajia River produces the alluvial plain. The beach slope is so mild that the tidal flat is broad with several kilometers exposed during the ebb tide.
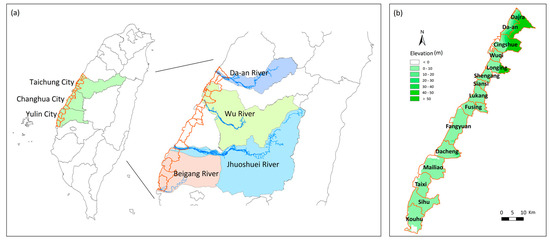
Figure 1.
Study areas in the mid-western coast of Taiwan, including Taichung City, Changhua County, and Yulin County (a); and their digital terrain model (DTM) (b).
The Yulin coast, located between the Jhuoshuei River and the Beigang River, has a total coastal length of about 55 km. A segment of this coast was protected in the early stages by the offshore sandbank barriers from the surge invasion. However, the coastal erosion is even more serious, and the beach diminished in the further south areas according to the surveys by the WRA. This is due to the reduction of the sand supply for the shortage of offshore sandbank barriers hit by typhoon waves and storm surges. Moreover, severe land subsidence has been observed in recent years, causing difficulties in inner drainage. These areas are prone to severe floods, but the situation has been improved thanks to the mitigation measures by the WRA since 2005.
3.2. Coastal Assessment under Climate Changes
For the purpose of studying and assessing the coastal flooding and risk under climate change in the mid-western coast of Taiwan, a status quo investigation and data collection on different aspects, including engineering, socioeconomics, land uses, geology, disaster prevention facilities, etc. was carried out. Based on the collected information and the availability of the data, the analysis periods are 1980–1999 for the base years and 2020–2039 for the scenario years representing the near future. This classification refers to the platform of the Taiwan Climate Change Projection and Information Platform Project (TCCIP) [57]. The TCCIP is coordinated by the National Science and Technology Center for Disaster Reduction (NCDR), which is one of three major climate change projects funded by the Ministry of Science and Technology. The TCCIP project not only produces climate change data for impact assessments and adaptations, but also aims to support the national adaptation policy frameworks (TCCIP, 2016), where the years 1980–1999 are treated as the base time and the years 2020–2039 are defined as the near future. The astronomical tides, stormy surges, typhoon waves deriving from nearshore wave setup, wave run-up, and overtopping of the future scenario are then predicted for coastal flooding and risk analysis.
According to the database of the Central Weather Bureau (CWB) in Taiwan, the yearly average of minimum typhoon low pressures from 1980 to 1999 is 921.55 hPa, which is treated as the status quo value of atmospheric pressure of typhoons striking Taiwan. The extremely low pressure value of 846 hPa, occurring in the year 1961, was recommended by the WRA in Taiwan as the designed atmospheric pressure intensity for scenario years. The WWM was used to simulate the maximum typhoon-induced wave heights and the maximum storm surge deviations. According to Lan et al. [43], data measured from Changhua coastal waters has been shown to almost obey the Weibull distribution for the extreme value analysis. The exceeding probability that the event is less than 10% is proposed for the estimation of wave height and storm surge in the target future. In Taiwan, the return period of 250 years is often used to represent the extreme event. Furthermore, the maximum designed rainfall/storm over a watershed or discharges in flood routing of 200 or 250 years are commonly used in governmental reports. Therefore, different maximum wave height and storm surge deviations of different return periods (5 years, 50 years, 100 years, 200 years, and 250 years) for the target’s future were then derived, and some of them are listed in Table 2 and Table 3, respectively. Table 4 also presents the amount of overtopping of different return periods at some major seawalls for the target’s future. The maximum wave height induced by typhoons will increase on average by 35.98% (about 2.55 m); the maximum typhoon surge deviation will increase on average by 29.15% (about 0.28 m). To check the results with station measurements at Northern Taiwan, Figure 2 and Figure 3 show the rapidly increasing trend of the maximum wave height measured at Long Dong station and the maximum annual surge level at Fugan station, respectively. At inspection of Figure 2 and Figure 3, it is noticed that the increasing rate is sometimes higher than 45% for some periods.
Table 2.
Maximum typhoon-induced wave heights of different return periods for the target’s future.
Table 3.
Maximum storm surge deviations of different return periods for the target’s future.
Table 4.
The amount of overtopping of different return periods at different places for the target’s future.
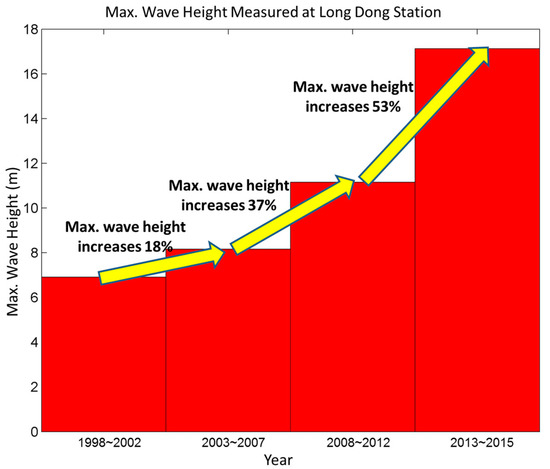
Figure 2.
Increasing trend of maximum wave height measured at Long Dong station located at the northeast coast of Taiwan.
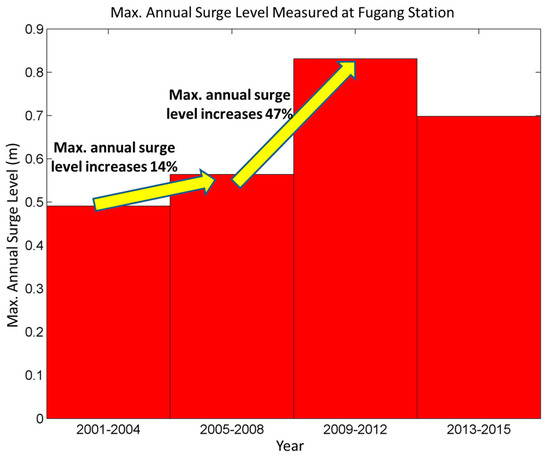
Figure 3.
Increasing trend of maximum annual surge level measured at Fugang station located at the southeast coast of Taiwan.
The above results provide a database to fit the assumption that the offshore waves hit the nearshore seawalls on the right front. The simulations of the impact on wave run-up and overtopping for the status quo year of 2014 and the scenarios for the years 2020 to 2039 were performed. The simulated results show the surging tides (astronomic tides superposed with surging tide deviations) of different recurrence periods and the sea level rising volumes of the target years. The sea level rising volume of 6.0 cm at the Taichung Harbor is chosen as the reference level for the model simulation. The average wave overtopping volumes of all the major seawalls were examined. The results indicated that most seawalls have a small amount of wave overtopping, except for the Shingong seawall in the Kouhu Township of Yulin County.
Two different techniques, FFT and EEMD, were utilized to analyze the SLR for the target’s future. The estimation of the average SLR at Taichung Harbor and Dongshi tidal stations are summarized in Table 5. The satellites data used there to extract the sea surface height were obtained online from AVISO (Archiving, Validation and Interpretation of Satellite Oceanographic Data). The sea surface height relative to the geoid (the mean ocean surface of the Earth if the ocean is at rest) was derived from TOPEX/Poseidon, Envisat, Jason-1, and OSTM/Jason-2 altimetry measurements. Altimetry is a technique for measuring height. Satellite altimetry measures the time taken by a radar pulse to travel from the satellite antenna to the surface and back to the satellite receiver. Combined with precise satellite location data, altimetry measurements yield sea surface heights. This AVISO dataset was created by binning and averaging monthly values on 1-degree grids [59]. The average amount of sea level rise is in the range from 5.2 cm to 6.2 cm from 2020 to 2039, equivalent to a rising velocity approaching 2.8 mm/year. The comparison analysis from the Taichung Harbor and Dongshi tide-gauge station of Chiayi County shows that the Fourier analysis gives the most similar sea level rising trend of the above two stations. The maximum sea level difference rising up to 120 mm from other analysis. It is apparent that different analysis methods predict SLR somewhat inconsistently and uncertainly.
Table 5.
Estimation of average sea level rise in the mid-western coast of Taiwan.
3.3. Discussions of Risk Map
To investigate the coastal flooding in the mid-western coastal areas of Taiwan, the integrated coastal watershed models were employed. The simulations for the scenario of the target future were carried out using adaptive grids for the varying topography and considered the impact of sea level rise, astronomic tide, storm surge, run-up, and overtopping. Based on the standard design of engineering practice, it is acceptable to adopt the design of the 50-year return periods of waves, and the probability of structure damages within the design year is about 64% [32]. A comparison of the simulated flooding areas of the status quo years (1980–1999) and the target’s future (2020–2039) under the climate change scenarios with different return periods of 50 years, 100 years, and 200 years during typhoons in the study area were conducted. The typhoon was from the East Pacific Ocean to the west coast of Taiwan, resulting in much flooding. The overall simulation result shows that surge tides and overtopping by typhoons of different paths can result in floods of different magnitudes. Estuaries are more prone to implicate a lot of floods. Model results also indicate that the flooding depths vary from 0.5 m to 0.8 m. Simulations show that the maximum flooding areas of the status quo years (1980–1999) are 4376, 4527, and 4600 hectares in the 50-year, 100-year, and 200-year return period, respectively. For the target’s future (2020–2039), they are 6933, 7693, 7812 hectares in the 50-year, 100-year, and 200-year return period. In other words, an additional 70% of flooding regions are extended in the future climate effects.
The simulated results also help to produce the hazard maps. These hazard maps, together with surveys of artificial facilities, environmental geography, and socio-economics, can produce risk maps indicating the risk of different classifications: very low, low, medium, high, and very high. Figure 4 shows the vulnerability of the target’s future (2020–2039), considering surge tides and precipitations with AHP weights (see Table 1). Figure 4 shows that the risk of most villages or towns is in the range from medium to low, but Wuqi, Lukang, Mailiao, and Taixi can reach the high-risk level. Based on further modeling results, several alternatives, e.g., enhancing the monitoring facilities and data accuracy, increasing the seawall height for areas with higher population density, establishing second seawalls, deploying emergency pumping equipment in areas prone to flooding, and improving disaster response systems, etc., are recommended to reduce the loss of lives and properties.
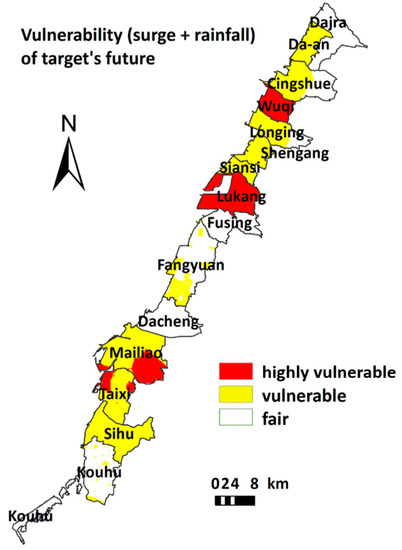
Figure 4.
Vulnerability map of target’s future (2020–2039), considering surge tides and precipitations using AHP weights.
4. Conclusions
The purpose of this study was to assess the impact of coastal disasters under climate change with integrated coastal watershed models and AHP risk assessment approaches. The assessment of this study focuses on sea level rise, seawall safety, floods, and coastal vulnerability. The mid-western coasts of Taiwan, within the administrative divisions of Taichung City, Changhua County, and Yulin County, were illustrated for simulation and analysis. Based on the above studies, the following conclusions are made:
- An approach using integrated coastal watershed models (POM-WWM-WASH123D) combined with a risk assessment method (AHP) is proposed to develop a methodology to investigate the impact resulting from coastal disasters under climate change.
- Simulation results indicate that the sea level at the mid-western coast of Taiwan will rise on average by 5.8 cm from 2020 to 2039, equivalent to a rising velocity of 2.8 mm/year. The maximum typhoon-induced wave height will increase by about 35.98% and the maximum typhoon surge deviation will increase by 29.15% as compared to the status quo situation.
- To assess coastal disaster risks under climate change using the AHP weighting mode, the Wuqi, Lukang, Mailiao, and Taixi counties reach the high-risk level. Results also showed that climate change has a significant impact on the study area.
Acknowledgments
This research is founded by the Water Recourses Agency, Ministry of Economic Affairs, Taiwan, under Grant No. MOEA-WRA-1040038.
Author Contributions
Tai-Wen Hsu and Dong-Sin Shih conceived and designed the study, and performed the model simulations; Dong-Sin Shih wrote the paper; Tai-Wen Hsu and Chi-Yu Li modified the manuscript; Chi-Yu Li and Yuan-Jyh Lan provided some analysis results on waves; Yu-Chen Lin provided analysis results on vulnerability.
Conflicts of Interest
The authors declare no conflict of interest.
References
- Intergovernmental Panel on Climate Change. Fifth Assessment Report (AR5). Available online: https://www.ipcc.ch/report/ar5/ (accessed on 20 May 2016).
- IPCC. Summary for Policymakers. In Climate Change 2014, Mitigation of Climate Change, Contribution of Working Group III to the Fifth Assessment Report of the Intergovernmental Panel on Climate Change; Edenhofer, O., Pichs-Madruga, R., Sokona, Y., Farahani, E., Kadner, S., Seyboth, K., Adler, A., Baum, I., Brunner, S., Eickemeier, P., et al., Eds.; Cambridge University Press: Cambridge, UK; New York, NY, USA, 2014. [Google Scholar]
- Martínez-Graña, A.M.; Boski, T.; Goy, J.L.; Zazo, C.; Dabrio, C.J. Coastal-flood risk management in central Algarve: Vulnerability and flood risk indices (South Portugal). Ecol. Indic. 2016, 71, 302–316. [Google Scholar] [CrossRef]
- Hallegatte, S.; Green, C.; Nicholls, R.J.; Corfee-Morlot, J. Future flood losses in major coastal cities. Nat. Clim. Chang. 2013, 3, 802–806. [Google Scholar] [CrossRef]
- Déqué, M.; Rowell, D.P.; Lüthi, D.; Giorgi, F.; Christensen, J.H.; Rockel, B.; Jacob, D.; Kjellström, E.; de Castro, M.; van den Hurk, B. An intercomparison of regional climate simulations for Europe: Assessing uncertainties in model projections. Clim. Chang. 2007, 81, 53–70. [Google Scholar] [CrossRef]
- Menzel, L.; Thieken, A.H.; Schwandt, D.; Bürger, G. Impact of climate change on the Regional hydrology—Scenario-based modelling studies in the German Rhine catchment. Nat. Hazards 2006, 38, 45–61. [Google Scholar] [CrossRef]
- Minville, M.; Brissette, F.; Leconte, R. Uncertainty of the impact of climate change on the hydrology of a Nordic watershed. J. Hydrol. 2008, 358, 70–83. [Google Scholar] [CrossRef]
- Prudhomme, C.; Davies, H. Assessing uncertainties in climate change impact analyses on the river flow regimes in the UK. Part 2: Future climate. Clim. Chang. 2008, 93, 177–195. [Google Scholar] [CrossRef]
- Akhtar, M.; Ahmad, N.; Booij, M.J. The impact of climate change on water resources of Hindukush–Karakorum-Himalaya region under different glacier coverage scenarios. J. Hydrol. 2008, 355, 148–163. [Google Scholar] [CrossRef]
- Arnell, N.W.; Gosling, S.N. The impacts of climate change on river flow regimes at the global scale. J. Hydrol. 2013, 486, 351–364. [Google Scholar] [CrossRef]
- Guo, S.L.; Wang, J.X.; Xiong, L.H.; Ying, A.W.; Li, D.F. A macro-scale and semi-distributed monthly water balance model to predict climate change impacts in China. J. Hydrol. 2002, 268, 1–15. [Google Scholar] [CrossRef]
- Kling, H.; Stanzel, P.; Preishuber, M. Impact modelling of water resources development and climate scenarios on Zambezi River discharge. J. Hydrol. Reg. Stud. 2014, 1, 17–43. [Google Scholar] [CrossRef]
- Easterling, D.R.; Meehl, G.A.; Parmesan, C.; Changnon, S.A.; Karl, T.R.; Mearns, L.O. Climate extremes: Observations, modeling, and impacts. Science 2000, 289, 2068–2074. [Google Scholar] [CrossRef] [PubMed]
- Hay, L.E.; Markstrom, S.L.; Ward-Garrison, C. Watershed-scale response to climate change through the twenty-first century for selected basins across the United States. Earth Interact. 2011, 15, 1–37. [Google Scholar] [CrossRef]
- Hovenga, P.A.; Wang, D.; Medeiros, S.C.; Hagen, S.C.; Alizad, K.A. The response of runoff and sediment loading in the Apalachicola River, Florida to climate and land use land cover change. Earths Future 2016, 4, 124–142. [Google Scholar] [CrossRef]
- Acreman, M.; Sinclair, C. Classification of drainage basins according to their physical characteristics; and application for flood frequency analysis in Scotland. J. Hydrol. 1986, 84, 365–380. [Google Scholar] [CrossRef]
- Beven, K.; Wood, E.; Sivapalan, M. On hydrological heterogeneity—Catchment morphology and catchment response. J. Hydrol. 1988, 100, 353–375. [Google Scholar] [CrossRef]
- Veijalainen, H.; Lotsari, E.; Alho, P.; Vehviläinen, B.; Käyhkö, J. National scale assessment ofclimatechangeimpacts onfloodingin Finland. J. Hydrol. 2010, 391, 333–350. [Google Scholar] [CrossRef]
- Yan, D.; Werners, S.E.; Ludwig, F.; Huang, H.Q. Hydrological response to climate change: The Pearl River, China under different RCP scenarios. J. Hydrol. 2015, 4, 228–245. [Google Scholar] [CrossRef]
- Cayan, D.R.; Bromirski, P.D.; Hayhoe, K.; Tyree, M.; Dettinger, M.D.; Flick, R.E. Climate change projections of sea level extremes along the California coast. Clim. Chang. 2008, 87, S57–S73. [Google Scholar] [CrossRef]
- Mastrandrea, M.D.; Luers, A.L. Climate change in California: Scenarios and approaches for adaptation. Clim. Chang. 2012, 111, 5–16. [Google Scholar] [CrossRef]
- Rahmstorf, S. A Semi-Empirical Approach to Projecting Future Sea-Level Rise. Science 2007, 315, 368–370. [Google Scholar] [CrossRef] [PubMed]
- Scavia, D.; Field, J.C.; Boesch, D.F.; Buddemeier, R.W.; Burkett, V.; Cayan, D.R.; Fogarty, M.; Harwell, M.A.; Howarth, R.W.; Mason, C.; et al. Climate Change Impacts on US Coastal and Marine Ecosystems. Estuaries 2002, 25, 149–164. [Google Scholar] [CrossRef]
- Bilskie, M.V.; Hagen, S.C.; Medeiros, S.C.; Passeri, D.L. Dynamics of sea level rise and coastal flooding on a changing landscape. Geophys. Res. Lett. 2014, 41, 1–8. [Google Scholar] [CrossRef]
- Bilskie, M.V.; Hagen, S.C.; Alizad, K.; Medeiros, S.C.; Passeri, D.L.; Needham, H.; Cox, A. Dynamic simulation of numerical analysis of hurricane storm surge under sea level rise along the northern Gulf of Mexico. Earths Future 2016, 4, 177–193. [Google Scholar] [CrossRef]
- Passeri, D.L.; Hagen, S.C.; Medeiros, S.C.; Bilskie, M.V.; Alizad, K.; Wang, D. The dynamic effects of sea level rise on low-gradient coastal landscapes: A review. Earths Future 2015, 3, 159–181. [Google Scholar] [CrossRef]
- Passeri, D.L.; Hagen, S.C.; Plant, N.G.; Bilskie, M.V.; Medeiros, S.C.; Alizad, K. Tidal hydrodynamics under future sea level rise and coastal morphology in the Northern Gulf of Mexico. Earths Future 2016, 4, 159–176. [Google Scholar] [CrossRef]
- Nicholls, R.J. Analysis of global impacts of sea-level rise: A case study of flooding. Phys. Chem. Earth 2002, 27, 1455–1466. [Google Scholar] [CrossRef]
- Chen, X.; Alizad, K.; Wang, D.; Hagen, S.C. Climate change impact on runoff and sediment loads to the Apalachicola River at seasonal and event scales. J. Coast. Res. 2014, 68, 35–42. [Google Scholar] [CrossRef]
- Beckley, B.D.; Lemoine, F.G.; Luthcke, S.B.; Ray, R.D.; Zelensky, N.P. A reassessment of global and regional mean sea level trends from TOPEX and Jason-1 altimetry based on revised reference frame and orbits. Geophys. Res. Lett. 2007, 34, L14608. [Google Scholar] [CrossRef]
- Wu, L.C.; Kao, C.C.; Hsu, T.W.; Jao, K.C.; Wang, Y.F. Ensemble empirical mode decomposition on storm surge separation from sea level data. Coast. Eng. J. 2011, 53, 223–243. [Google Scholar] [CrossRef]
- Hsu, T.W.; Shih, D.S.; Chen, W.J. Destructive Flooding Induced by Broken Embankments along Linbian Creek, Taiwan, during Typhoon Morakot. J. Hydrol. Eng. ASCE 2015, 20, 05014025. [Google Scholar] [CrossRef]
- Stefanidis, S.; Stathis, D. Assessment of flood hazard based on natural and anthropogenic factors using analytic hierarchy process (AHP). Nat. Hazards 2013, 68, 569–585. [Google Scholar] [CrossRef]
- Tehrany, M.S.; Pradhan, B.; Jebur, M.N. Flood susceptibility mapping using a novel ensemble weights-of-evidence and support vector machine models in GIS. J. Hydrol. 2014, 512, 332–343. [Google Scholar] [CrossRef]
- Small, C.; Nicholls, R.J. A global analysis of human settlement in coastal zones. J. Coast. Res. 2003, 19, 584–599. [Google Scholar]
- Small, C.; Gornitz, V.; Cohen, J.E. Coastal hazards and the global distribution of human population. Environ. Geosci. 2000, 7, 3–12. [Google Scholar] [CrossRef]
- Nicholls, R.J. Coastal flooding and wetland loss in the 21st century: Changes under the SRES climate and socio-economic scenarios. Glob. Environ. Chang. 2004, 14, 69–86. [Google Scholar] [CrossRef]
- Veleda, V.; Martínez-Graña, A.M.; Santos-Francés, F.; Sánchez-San Roman, J.; Criado, M. Analysis of the Hazard, Vulnerability, and Exposure to the Risk of Flooding (Alba de Yeltes, Salamanca, Spain). Appl. Sci. 2017, 7, 157. [Google Scholar] [CrossRef]
- Nicholls, R.J.; Hoozemans, F.M.J.; Marchand, M. Increasing flood risk and wetland losses due to global sea-level rise: Regional and global analyses. Glob. Environ. Chang. 1999, 9, S69–S87. [Google Scholar] [CrossRef]
- United Nations Disaster Relief Co-ordinator (UNDRO). Natural Disasters and Vulnerability Analysis: Report of Expert Group Meeting (9–12 July 1979); United Nations Disaster Relief Co-ordinator: Geneva, Switzerland, 1980. [Google Scholar]
- Saaty, T.L. The Analytic Hierarchy Process; McGraw-Hill: New York, NY, USA, 1980. [Google Scholar]
- Lin, S.C.; Tang, T.Y. Factor Assessment of the Environmental Impact for Tainan Technology Industry Area in Taiwan. In Ecosystems and Sustainable Development; Tiezzi, E., Brebbia, C.A., Uso, J.L., Eds.; WIT Press: Boston, MA, USA, 2003; Volume I, pp. 219–229. [Google Scholar]
- Lan, Y.J.; Hsu, T.W.; Lin, Y.C.; Huang, C.J. An Adaptation Due to Climate Change in Southwest Coast of Taiwan. Coast. Manag. 2013, 41, 172–189. [Google Scholar] [CrossRef]
- IPPC-CZM. The Seven Steps to the Vulnerability Assessment of Coastal Areas to Sea-Level Rise—Guideline for Case Studies; IPCC: Hague, The Netherlands, 1991; p. 46. [Google Scholar]
- Doukakis, E. Coastal vulnerability and risk parameters. Eur. Water 2005, 11, 3–7. [Google Scholar]
- United Nations Environment Programme Report (UNEP). Assessing Coastal Vulnerability: Developing a Global Index for Measuring Risk. Available online: http://www.unep.org/ (accessed on 20 May 2016).
- Hong, H.; Cui, S.; Zhang, L. A coastal vulnerability index and its application in Xiamen, China. Aquat. Ecosyst. Health Manag. 2006, 9, 333–337. [Google Scholar] [CrossRef]
- Kavi Kumar, K.S.; Tholkappian, S. Relative vulnerability of Indian coastal districts to sea-level rise and climate extremes. Int. Rev. Environ. Strateg. 2006, 6, 3–22. [Google Scholar]
- Holland, G.J. An analytical model of the wind and pressure profiles in hurricanes. Mon. Weather Rev. 1980, 108, 1212–1218. [Google Scholar] [CrossRef]
- Hsu, T.W.; Ou, S.H.; Liau, J.M. Hindcasting nearshore wind waves using a FEM code for SWAN. Coast. Eng. 2005, 52, 177–195. [Google Scholar] [CrossRef]
- Shih, D.S.; Hsu, T.W.; Chang, K.C.; Juan, H.L. Implementing Coastal Inundation Data with an Integrated Wind Wave Model and Hydrological Watershed Simulations. Terr. Atmos. Ocean. Sci. 2012, 23, 513–525. [Google Scholar] [CrossRef]
- Blumberg, A.F.; Mellor, G.L. A description of a three-dimensional coastal ocean circulation model. In Three-Dimensional Coastal Ocean Models; Heaps, N., Ed.; American Geophysical Union: Washington, DC, USA, 1987; Volume 4, p. 208. [Google Scholar]
- Mellor, G.L. Users Guide for a Three-Dimensional, Primitive Equation, Numerical Ocean Model; Princeton University: Princeton, NJ, USA, 1998. [Google Scholar]
- Hsu, T.W.; Liau, K.M.; Lin, J.G.; Zheng, J.; Ou, S.H. Sequential assimilation in the wind wave model for simulations of typhoon events around Taiwan Island. Ocean Eng. 2011, 38, 456–467. [Google Scholar] [CrossRef]
- Yeh, G.T.; Huang, G.B.; Zhang, F.; Cheng, H.P.; Lin, H.C. WASH123D: A Numerical Model of Flow, Thermal Transport, and Salinity, Sediment, and Water Quality Transport in WAterSHed Systems of 1-D Stream-River Network, 2-D Overland Regime, and 3-D Subsurface Media. In Technical Report Submitted to EPA; Department of Civil and Environmental Engineering, University of Central Florida: Orlando, FL, USA, 2006. [Google Scholar]
- Yeh, G.T.; Shih, D.S.; Cheng, J.R.C. An Integrated Media, Integrated Processes Watershed Model. Comput. Fluids 2011, 45, 2–13. [Google Scholar] [CrossRef]
- Taiwan Climate Change Projection and Information Platform Project (TCCIP). Available online: http://tccip.ncdr.nat.gov.tw/v2/index_en.aspx (accessed on 24 June 2015).
- Harbor and Marine Technology Center, Ministry of Transportation and Communications. Long-Term Marine Meteorological Observations of Taiwan’s Major Harbor Sea Areas and Application of the Data Characteristics ¼; Harbor and Marine Technology Center, Ministry of Transportation and Communications: Taipei, Taiwan, 2010. (In Chinese) [Google Scholar]
- National Center for Atmospheric Research Staff (Ed.) The Climate Data Guide: AVISO: Satellite derived Sea Surface Height above Geoid. Available online: https://climatedataguide.ucar.edu/climate-data/aviso-satellite-derived-sea-surface-height-above-geoid (accessed on 21 March 2016).
© 2017 by the authors. Licensee MDPI, Basel, Switzerland. This article is an open access article distributed under the terms and conditions of the Creative Commons Attribution (CC BY) license (http://creativecommons.org/licenses/by/4.0/).