Water Policy of Korea for Supplying Safe Groundwater in Rural Areas
by
Chung-Mo Lee
1, 
Se-Yeong Hamm
1,*, 
Hang-Tak Jeon
1,
MoonSu Kim
2,
Hyun-Koo Kim
2 and
Kangjoo Kim
3 1
Department of Geological Sciences, Pusan National University, Busan 46241, Korea
2
National Institute of Environmental Research, Incheon 22689, Korea
3
Department of Environmental Engineering, Kunsan National University, Gunsan 54150, Korea
*
Author to whom correspondence should be addressed.
Water 2017, 9(7), 508; https://doi.org/10.3390/w9070508
Submission received: 29 May 2017
/
Revised: 5 July 2017
/
Accepted: 7 July 2017
/
Published: 12 July 2017
Abstract
:According to a 2015 study conducted by the Ministry of Environment of Korea, municipal water is supplied to 96.1% of the total Korean population, but 3.9% of the total population (~2.14 million people) in rural myeon or villages, drink groundwater from old and/or unregistered wells that are not a part of the municipal water system. Additionally, accurate statistics are not reported without regular water quality tests, so safety measures alone are insufficient to improve water quality. In this situation, the Korean government is responsible for verifying the quality of groundwater and identifying the cause of groundwater contamination in areas with no municipal water supply. The National Institute of Environmental Research (NIER) under the Ministry of Environment of Korea, conducted the ‘Safe Groundwater Supply Project (SGSP)’ between 2012 and 2016 to secure groundwater quality stability in areas without the benefit of municipal water. This survey identified groundwater quality using a detailed water quality survey and gave recommendations for supplying safe groundwater and providing future improvements and countermeasures in cases of groundwater pollution. This paper presents the SGSP and consists of water quality analysis, the exploration and exploitation of drinking water facilities, the selection of a pilot project area among high-pollution areas, and improvement measures for water quality in the pilot project area.
1. Introduction
Korea’s municipal waterworks statistics from 2015 show that 96.1% of the total Korean population is supplied by municipal water; however, this leaves ~2.14 million people without [1]. Even factoring in the inclusion of village water supply and small water supply facilities (public water reservoir, village wells, etc.), 98.6% of the total population is served by public water supply. Approximately 730,000 people live in rural areas with no drinking water supply and predominantly use groundwater from old, unregistered wells without regular water quality tests due to cost, even though groundwater meant for drinking should be regularly inspected with a quality test twice yearly (the first term test in April–May and the second term test in September–October) under the Groundwater Act (enforcement date: 23 December 2015) [2]. In most areas without public supply (rural myeon or smaller administrative areas), groundwater is at high risk of being contaminated by NO3-N and total coliform bacteria due to multiple pollution sources from agricultural activities (fertilizer, manure spreading) and livestock activities (manure, wastewater). Consequently, clear and urgent surveys are needed for old, un-registered wells that have not been tested regularly.
In the United States (U.S.), NO3-N is one of the main contaminants in groundwater. Spalding and Exner [3] found that NO3-N concentration has significantly increased due to the poor construction of wells by using over 200,000 pieces of NO3-N data. According to Hudak [4], more than 50% of the studied wells exceeded the maximum contaminant level (44.27 mg/L) of nitrate in six aquifers in Texas, showing a highly inverse relationship between nitrate concentration and well depth. In 2005, over 40 million (14% of the U.S. population) primarily used residential water from private groundwater systems [5]. Previously, each state in the U.S. had groundwater regulations [6] and groundwater governance was decentralized in the U.S., reflecting state-by-state or region-by-region circumstances [7]. The survey conducted by fifty-one states in the U.S. found that most states have formal or informal groundwater law, water quality and conservation, and groundwater oversight and enforcement authorities in each state. Also, the groundwater governance priorities selected by survey respondents were water quality or contamination, conflicts between water users, and declining groundwater levels, etc. [7].
In 1974, the U.S. Congress passed the Safe Drinking Water Act (SDWA) to protect the nation’s public health. Subsequently, the United States Environmental Protection Agency [8] established the National Primary Drinking Water Regulation (NPDWR), which recognizes a total of 87 contaminants in six divisions (microorganisms, disinfectants, disinfection byproducts, inorganic chemicals, organic chemicals, and radionuclides). The standards in the NPDWR [9] are mostly the same as those of Korea.
According to the ‘Survey on the background and pollution of groundwater in livestock areas in 2014’ by the National Institute of Environmental Research (NIER) of Korea, the water quality standards of drinking water exceeded 42.8% (269 wells) in the first term test and 52.9% (332 wells) in the second term test among a total of 628 wells in the selected rural areas, demonstrating the urgent requirement of the management of NO3-N in rural areas [10]. Kim et al. [11] reported that dense livestock farming in rural areas is one of the main causes of nitrate pollution in shallow groundwater areas; the barns of domestic animals affect groundwater quality for a long time. Hyun [12] revealed that highly polluted groundwater originates from domestic sewage and livestock manure based on the groundwater quality in the dense livestock area on Jeju Island. Ham [13] estimated the natural background (3.2 mg/L) of nitrate concentration in groundwater in Korea using the cumulative probability distribution and concluded that nitrate concentration was greatly influenced by aquifer depth and land use. According to Woo [14], the 30 wells that were influenced by livestock wastewater in the Daejeong watershed located in the southwestern Jeju Island displayed NO3-N and δ15N concentration values greater than 5‰. Cheong et al. [15] characterized the nitrate of groundwater in the Gimpo agricultural area, South Korea, based on nitrate concentration and nitrogen-isotope analysis and conducted a risk assessment using the risk-based corrective action (RBCA) tool kit for chemical releases v.2.5.
Following Article 2 of the Water Supply and Waterworks Installation Act (enforcement date: 28 July 2016) [16], which specifies ‘the State has an obligation to supply good quality water to the people’, the Safe Groundwater Supply Project (SGSP) seeks to provide free water quality inspections in regions without a municipal drinking water supply and to improve water welfare. Drinking groundwater should meet the NO3-N standard (Table 1) according to Sub-article 3 of Article 5 in the ‘Drinking Water Management Act’ (enforcement date: 28 March 2017) [17] and Sub-article 2 of Article 26 in the ‘Water Supply and Waterworks Installation Act’ (enforcement date: 28 July 2016) [16]. In contrast, non-drinking groundwater meant for domestic, agricultural, fish-raising, and industrial uses must comply with Article 11 (enforcement date: 16 February 2010) of ‘The Rules on Groundwater Quality Conservation, etc.’ (enforcement date: 29 March 2017) [18]. According to the laws, the Korean government will execute groundwater quality tests for 2579 wells in a national groundwater quality monitoring network twice each year to monitor NO3-N concentration.
The SGSP began with the ‘Pilot project for free water quality inspection of groundwater use’ of the National Institute of Environmental Research (NIER) under the Ministry of Environment in 2012 [19] and continued in the form of the ‘Research on the safe groundwater supply project’ in 2016 [20]. In addition, the roadmap for safe groundwater quality in 2014 and the benefit/cost analysis of the SGSP were created. This study presents the SGSP’s two purposes of providing safe groundwater in villages without a municipal drinking water supply and instructing residents on how to use groundwater, thus enabling them to react promptly to the consequences of the water quality survey.
2. Materials and Methods
The SGSP is performed in four stages; (1) water quality analysis; (2) the exploration and exploitation of drinking water facilities; (3) the selection of a pilot project area among high-pollution areas; and (4) a pilot project for improving water quality in the high-pollution area.
2.1. Water Quality Analysis
Water quality analysis was performed both for the areas with existing data and the areas without data (Table 2). In 2014, using simple water quality surveys, laboratory water quality analyses were performed on a total of 14,494 points in 17 cities and counties that exceeded the quality standard of NO3-N, total coliform bacteria, and coliform bacteria (Figure 1, Table 2) [19]. In 2015, laboratory water quality analyses were conducted for a total of 25,900 points in 21 more cities and counties, and the existing points in 14 cities and counties showed higher concentrations than water quality standards allow [21]. In 2016, laboratory water quality analyses were conducted for a total of 25,914 points in 34 additional cities and counties, 4784 wells existing in 22 cities and counties, and 353 wells carcass disposal sites in 36 cities and counties [20].
Water quality analyses were conducted on drinking water wells in areas where waterworks are unavailable. The NO3-N and total coliform tests in the field were carried out by three to four persons per team. For the wells that showed values over the water quality standard, precise water quality tests were carried out for 20 items (NO3-N, chlorine ions, total coliforms, Escherichia coli, aluminum, fluorine, manganese, turbidity, pH, lead, zinc, iron, arsenic, copper, sulfate, ammonia nitrogen, cadmium, mercury, hexavalent chromium, and cyanide) in 2014 and 15 items (NO3-N, chlorine ions, total coliforms, Escherichia coli, aluminum, fluorine, manganese, turbidity, pH, lead, zinc, iron, arsenic, copper, and sulfate) in 2015 and 2016 (Table 3). Table 4 shows the drinking water standards of the items according to the ‘Drinking Water Management Act’ [17] with the detection limit of the instruments used in the SGSP.
2.2. Exploration and Exploitation of Drinking Water Facilities
Drinking water wells are investigated to detect contamination in the water well interior and pollutant inflow from households that use groundwater as drinking water. The wells used for agriculture and/or households in most survey areas are at high risk of contamination due to their lack of underground protection walls and sanitary well caps. After groundwater contamination was confirmed by the field water quality test, the first survey was conducted in order to visually confirm the inflow of pollutants and to judge whether the groundwater was polluted or not. This was done using a borehole camera, which effectively detects interior pollution of wells by contaminants from their surroundings such as insects, surface water flow, and corrosion of the casing but is difficult to detect with the naked eye. Measures can then be built to remedy the pollution of the well interior. In 2014, a well interior survey on 61 wells and 438 sites was conducted. In 2015 and 2016, the well interior surveys were executed on 68 wells and 247 sites and 60 wells and 148 sites, respectively.
In areas where public water supply is unavailable, public drinking water wells have been drilled into the bedrock to assure good water quality because bedrock aquifers are safe in terms of water quality. In selecting a candidate for well installation, it is necessary to review the data on the accessibility/convenience for residents and the existing ground water quality, discuss this with the residents, and get permission to drill the well from the local government. These public wells must have a production capacity of ~50 m3/d from the bedrock aquifer in order to supply drinking water to the village inhabitants. Table 5 presents the criteria for determining the suitability of a well installation site for developing drinking water.
2.3. Selection of Pilot Project Area among High-Pollution Areas
Based on the results of the water quality analysis and the numbers of highly contaminated wells, five pilot project areas in the ‘Ri’ administrative district will be selected. The ‘Ri’ administrative district was chosen because it is geographically bounded by mountains, streams, and rivers and acts as the boundary of groundwater systems (Table 6).
Surveys on pollution status, onsite water quality analysis, and laboratory water quality analysis were executed for the selected pilot project area. All pollution sources in the selected pilot project area were surveyed based on satellite image data, land use data, statewide groundwater pollution data, etc. Point pollution sources originating from humans and industry were examined by population, wastewater treatment status, municipal sewerage status, factories, and wastewater discharge. However, non-point pollution sources such as land use and animal husbandry rely on livestock types, location of the pollution sources, livestock manures, compost types, land use status, cultivation status, and fertilizer application rates. In particular, it is essential to ask farmers about raising livestock and their agricultural activity. A total of eight items (temperature, pH, oxidation-reduction potential (ORP), dissolved oxygen (DO), electrical conductivity (EC), total dissolved solids (TDS), alkalinity, and salinity) were analyzed by the field water quality test by collecting water samples for laboratory analysis.
2.4. Pilot Project for Improving Water Quality in the High-Pollution Area
A pilot project area was determined from among the five candidate areas that had been chosen in the previous year. Groundwater monitoring systems were then built based on the installation conditions around the monitoring well, the characteristics of the surrounding pollution sources, the groundwater flow direction in the watershed, and the concentration and areal extent of major pollutants. Groundwater monitoring systems were also implemented in highly polluted areas by considering regional groundwater flow to nearby streams. Multi-depth monitoring wells were installed at three or four depths with 5-m intervals based on the water quality, considering depth and the groundwater level, as well as depending on the alluvium thickness. Two-inch diameter pipes and pipes with no holes inside 10-inch wells were installed with bentonite walls at a minimum of 1-m intervals to exclude the interference between monitoring wells. The physical characteristics (such as weathering degree and grain size) of the alluvial layers and rocks along the depth were identified by drill log. During the drilling, a casing was inserted in order to prevent external grains/gravels entering as well as to prevent the collapse of the wall, and a standard penetration test (SPT) was carried out in parallel with the drilling operation. Based on the drilling rate at each well, slime status, samples taken by the SPT, and the N value, the properties of the geological beds were established along with the thickness of the beds. Groundwater solute transport modeling was carried out using the collected data, and we analyzed the groundwater flow, water quality, solute transport, and natural attenuation in the pilot project area.
2.5. Benefit/Cost Analysis of Groundwater Quality Improvement vs. Public Water Supply
In the SGSP in 2015, benefit/cost analyses for 10- and 50-year periods were conducted to compare the costs of surface water supply and groundwater supply. The comparison included the cost of surface water supply, including the costs of labor, general management, electricity, membrane filtration facility construction, microfiltration facility construction, ozone usage, activated carbon replacement, water purification chemicals, and sludge disposal. The costs associated with drinking groundwater supply included the costs of well construction, submersible pump installation, reverse osmosis facilities, monitoring the well installation, and maintenance costs such as well replacement, electricity use, water quality testing, pollution prevention facilities, and well closing.
3. Application Examples
3.1. Water Quality Analysis
In 2013, the SGSP was executed to investigate the water quality inspection services and the treatment of wells being used for drinking water in eight cities and counties in the northeastern Gyeonggi province. The first stage water quality test using a diagnostic kit for NO3-N and total coliforms was conducted on the wells. The second stage water quality test was conducted for wells that exceeded the water quality standard (NO3-N concentration > 9 mg/L and total coliform detection) and looked for 20 factors (total nitrogen, total coliforms, coliform, chlorine, ammonia, aluminum, fluorine, manganese, turbidity, pH, lead, zinc, iron, arsenic, mercury, hexavalent chromium, cadmium, copper, cyanide, and sulfate). Among the 11,861 wells, 4441 (37.4%) exceeded the water quality standard.
The 2014 study, ‘Research on Detailed Survey and Institutionalization of Safe Groundwater (RSISG)’ was performed in different regions (rural, rural/urban, coastal, and mountain areas) based on the results of the SGSP in 2013. In addition, the RSISG comprised a survey of well interiors using a borehole camera, a pilot survey of the groundwater quality in highly contaminated areas, the construction of public wells for drinking usage, the institutionalization of safe groundwater, and a roadmap for water quality conservation. In total, the 14,494 wells that exhibited a higher concentration than the water quality standard were investigated for 20 constituents, and 49.51% (7032 wells) exceeded the total coliform standard and 46.79% (6644 wells) exceeded the NO3-N standard. Among the 76.01% (11,017) wells that exceeded the water quality standard, over 97% also exceeded the total coliform and NO3-N standards (Table 7).
In the 2015 study, ‘A Study of Optimal Management Measures for Securing Safe Groundwater’, in new survey areas, groundwater samples from 17,801 wells were analyzed for 15 items (NO3-N, total coliforms, Escherichia coli, chlorine, aluminum, fluorine, manganese, turbidity, pH, lead, zinc, iron, arsenic, copper, and sulfate). The excess rate of all items was 46.83% (8337 wells), of which 40.31% (7175 wells) had total coliforms, 15.05% (2679 wells) had NO3-N, and 14.07% (2505 wells) had Escherichia coli in excess of the drinking water quality standard. Analyses of water quality in highly contaminated areas as of 2013 to 2014 were performed for 15 items of 7196 wells. Of these, 55.43% (3989 wells) exceeded the water quality standards, with 42.88% (3086 wells) exceeding them for NO3-N, 40.19% (2892 wells) for total coliforms, and 7.77% (559 wells) for Escherichia coli (Table 8). In the area of groundwater contamination vulnerability, the total excess rate was 53.93% (487 wells), 35.11% (317 wells) for total coliforms, 24.58% (222 wells) for NO3-N, and 8.53% (77 wells) for Escherichia coli (Table 8). In 2015, 49.47% (12,813) of the total wells exceeded the water quality standard for 15 constituents (Table 8).
According to the ‘Study on safe groundwater supply project (SGSP)’ for the areas without the municipal water supply, which was carried out in 2016, 13,689 wells among the total of 25,914 wells exceeded the water quality standard, with a 52.82% overall excess rate (Table 9). The total excess rate was 50.10% (10,332 wells) for the new survey areas, with 43.70% (9011 wells) containing excess total coliforms, 14.49% (2989 wells) NO3-N, and 8.74% (1803 wells) Escherichia coli. The water quality analysis results showed that in 70.97% (3395 wells) of the 4784 wells in the area of previous water quality tests and 61.76% (218 wells) of the 353 wells at carcass disposal sites exceeded the water quality standards. The results of the water quality analysis in vulnerable areas (kindergartens) showed that 6.25% (13 wells) of 208 wells exceeded the water quality standards, showing relatively good water quality. Among them, seven wells exceeded the water quality standards for NO3-N and three wells for fluorine and arsenic each.
According to the results of the water quality analysis, approximately 50% of the surveyed areas exceeded the drinking water standards, and most of the excessive components were NO3-N and total coliforms (Figure 2).
3.2. Exploration and Exploitation of Drinking Water Facilities
The detection of the well interior water quality was conducted on 61 wells in 2014, 68 wells in 2015, and 60 wells in 2016; this aimed to investigate the wells with poor water quality to guarantee safe groundwater through a remediation program for contaminated groundwater and to ask for the proper utilization of groundwater. According to the field survey in rural areas, most wells are shallow and are vulnerable to surface pollutants such as NO3-N and total coliforms due to agricultural activities such as cultivation and livestock production. Wells are often located adjacent to streams, agricultural fields, and barns that may be high sources of pollution. Overall, wells are in the situation of lacking or having an improper sanitary well cap when the groundwater is contaminated by the inflow of contaminated surface water. A field survey of 438 wells in 2014 showed that 13% (57 wells) were younger than 10 years old, 25% (111 wells) were 10 to 20 years old, 26% (115 wells) were over 20 years old, and the age of 35% (155 wells) was unidentifiable by their owners. The average age of the wells was ~36 years. In addition, improperly managed wells younger than five years were severely exposed to pollution because pollutants from barns, waste deposits, greenhouses, rainwater drains, and cultivated lands inevitably infiltrated into wells in both the rainy and dry seasons. Most wells are used for both agriculture and drinking. Alluvial water wells comprised 93% of all wells, with 93% of small wells having diameters less than 100 mm.
As a result of interior detection in wells, most wells are shallowly drilled alluvium with shallow casings and have no installed underground protection wall. Some well casings were corroded due to iron material or intentionally incised to increased productivity by introducing alluvial groundwater. In 2014, 46% (28 wells) of 61 wells had serious pollution issues due to contaminated surface water inflow, damaged casing, and leaching of surrounding matter into the well.
The location of the drinking water wells was determined by considering the criteria for selecting high-pollution pilot project areas, including hydrogeological factors, groundwater pollution rates, the wells’ vulnerability to pollution, and social/administrative factors. In 2014, 2015, and 2016, public drinking water wells were installed at three sites to supply bedrock groundwater to residents (Figure 3).
3.3. Selection for Pilot Project among High-Pollution Areas
The five candidate areas for the pilot project were selected annually over three years. The selection criteria for the candidate areas were as shown in Table 10. Table 11 shows the pollution loadings of high-pollution areas by human life, agriculture, livestock, industry, and fertilizer use in 2016. The cause of groundwater pollution was identified through a pollution load survey. And the residents were notified of necessary measures to improve water quality. The management plan for the contamination of site 3, where pollution loading by humans was highest, was proposed to prevent the influx of domestic sewage from a septic tank. The suggested contamination management method for site 4, where animal waste was the highest loading on the environment, is using compost fertilizer instead of pre-matured manure compost and a proper spreading rate for manure compost on agricultural land for growing cucumbers, tomatoes, and watermelon. For sites 1, 2, and 5, which were highly loaded with pollution from the land, it is suggested that a top cap should be installed on groundwater wells to prevent the composts and fertilizers applied to the farmland around the houses from entering the wells. Most of the groundwater in highly polluted areas was located in agricultural areas and around livestock breeding farms that poorly managed their livestock’s manure and the composting of livestock manure. Therefore, it was necessary to establish a policy to protect groundwater contamination via the proper management of manure around farmland, to use compost fertilizer instead of pre-matured manure compost, to institute a proper spreading rate of manure compost on agricultural land, and to prevent leakage from septic tanks.
3.4. Pilot Project for Improving Water Quality in the High-Pollution Area
After the areas were surveyed through the 2014 and 2015 SGSP, they were examined by means of a questionnaire survey, field survey, municipal water supply plan, hydrogeological characteristics, groundwater pollution, and the action of local government and residents, and one area for the pilot project was decided every year. Next, the monitoring wells were installed to identify the cause of groundwater pollution and countermeasures for supplying safe drinking groundwater. In 2015, nine single-depth monitoring wells and three multi-depth monitoring wells were installed to identify water qualities and hydraulic heads along the depth in the first pilot area. In 2016, 12 single-depth and three multi-depth monitoring wells were installed in the second pilot area.
The single-depth monitoring well was drilled to the top of the bedrock and was 75 mm in diameter (Figure 4a). The multi-monitoring wells were drilled with three depths with a 5- or 7-m interval, and the upper and lower parts of each well were then filled with bentonite to measure the hydraulic head at different depths (Figure 4b). Through drilling monitoring wells, geologic columns were made to identify geological formations and hydrogeological characteristics. A topographical survey was then conducted to accurately obtain the altitude and location of the monitoring well and information on the groundwater flow direction. Slug tests were also conducted to estimate the aquifer’s hydraulic conductivity. These hydraulic head distributions and hydraulic conductivity data were inputted to model the groundwater.
The groundwater flow and nitrate transport modeling of the pilot project areas for water quality improvement in 2015 and 2016 were performed using the MT3DMS module of Visual MODFLOW flex v.2011.1. Through the drilling survey, the geology of the pilot project area in 2015 consisted of reclaimed bed (silty sand), alluvium (silty sand, silt, clay silt, and silty clay), and a weathered layer, and the geology of the pilot project area in 2016 was composed of alluvium, a weathered layer, and bedrock. The groundwater level was measured in both a single well and a multi-well for the groundwater model input (Table 12).
The hydraulic conductivity values range from 8.28 × 10⁻⁶ to 2.41 × 10⁻³ cm/sec with an average of 3.17 × 10⁻⁴ cm/sec through the 18 time slug tests at 12 observation wells in 2015 and range from 3.34 × 10⁻⁵ to 2.01 × 10⁻³ cm/sec with an average of 3.79 × 10⁻⁴ cm/sec through the 12 time slug tests at 15 observation wells in 2016 (Table 13).
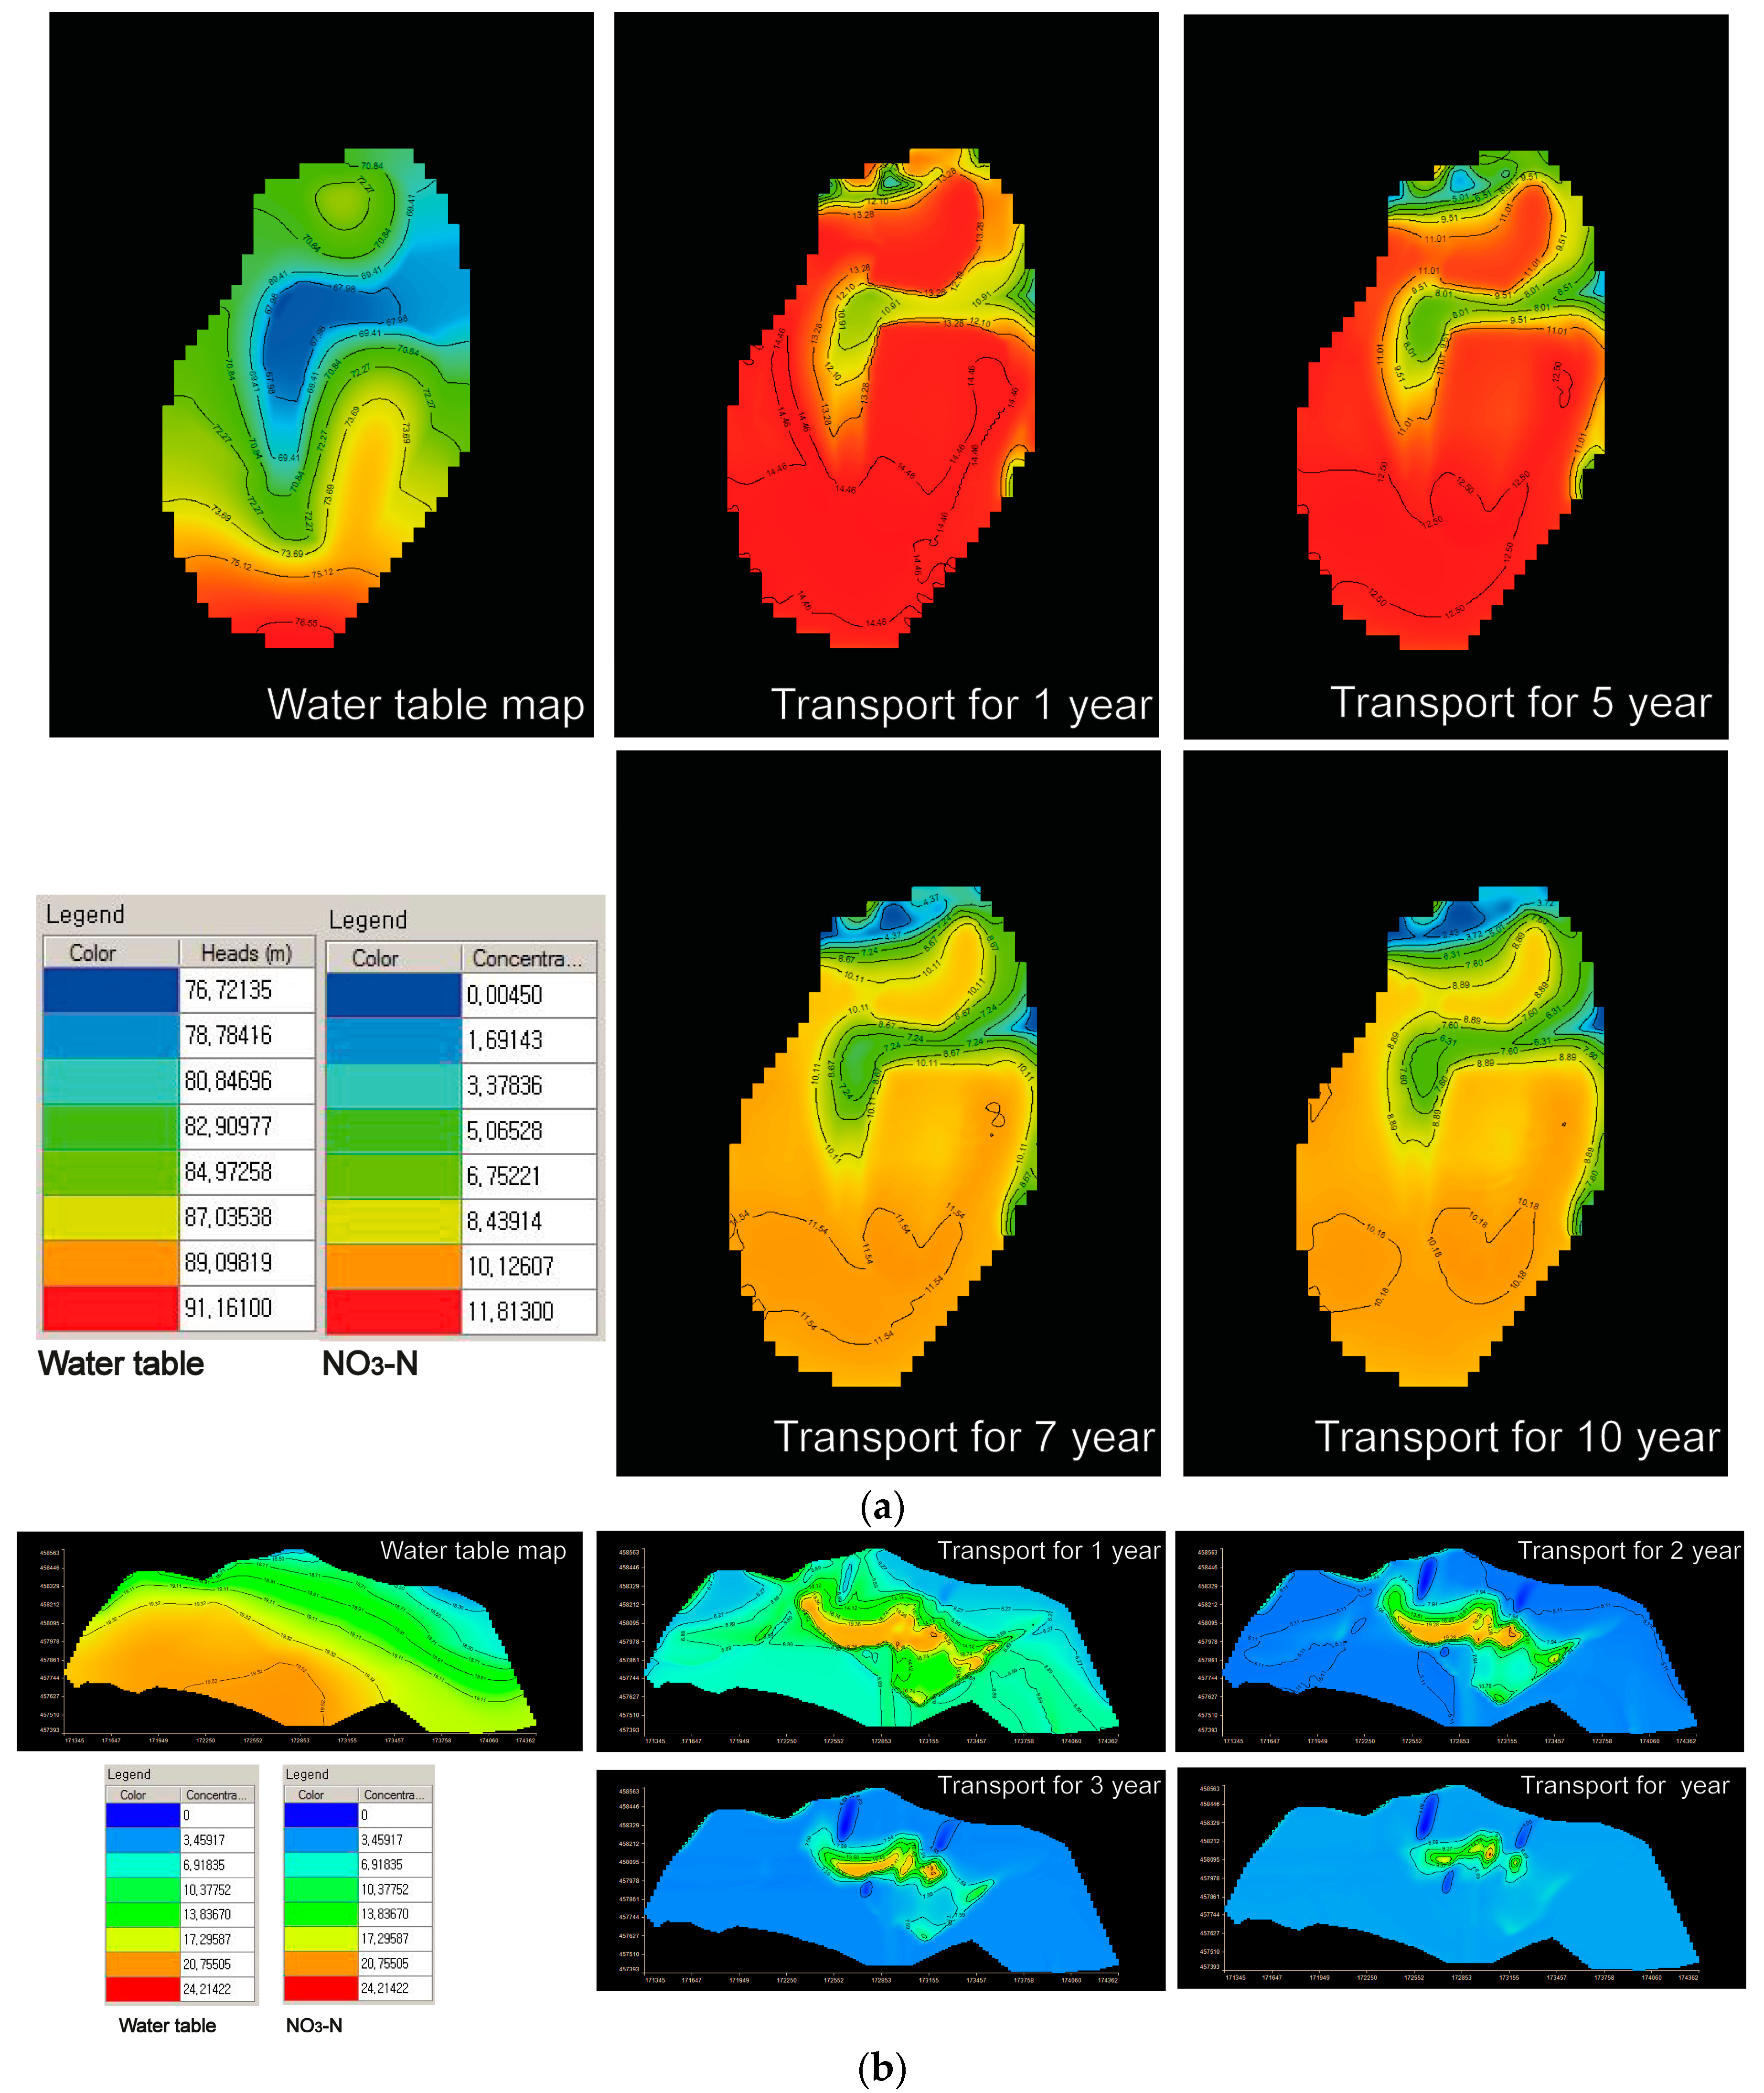
The results of simulating groundwater flow and nitrate concentration changes over the 10-year period showed that nitrate that mainly originated from land-based pollution sources and moved with the groundwater flow. For the 2015 project area, if the current background concentration (12.4 mg/L) of NO3-N were maintained, the nitrate concentration in the groundwater will be reduced to below the water quality standard (10 mg/L) in approximately five years (Figure 5a). For the 2016 project area, if the background concentration (22.35 mg/L) of NO3-N is maintained, the nitrate concentration in the groundwater will be reduced to below the water quality standard (10 mg/L) in approximately three years (Figure 5b). Accordingly, if the nitrate is continuously increased by contamination sources, the period for nitrate concentration reduction below the water quality standard will be increased. Additionally, long-term monitoring is essential for verifying the model.
The pilot project for improving the groundwater quality was performed for wells requiring water quality improvement in excess of the water quality standards (10 mg/L) for NO3-N and wells below the water quality standards for the risk of pollution. The pilot project was preceded by briefing residents and by the subsequent the agreement of the residents after fully explaining the project’s purpose. Most remediation measures for the pilot project area included the re-installation or new installation of wells and the cleaning/disinfection or closing of certain wells. Sanitary well caps have been installed on wells that lacked them. In addition, wells that met the water quality standards were recommended to ensure the prevention of pollutant inflow and safe drinking methods. For houses that had difficulty installing a new well or sanitary well cap, it was recommended that they install a small-scale water purifier for reverse osmosis.
3.5. Benefit/cost Analysis of Groundwater Quality Improvement vs. Public Water Supply
In the comparative analysis of the costs of waterworks and safe groundwater, the costs for the waterworks were estimated at 5740 million Korean won for ten years and 14,580 million won for 50 years, with a 112.7 million won/km water supply cost (Table 14). In contrast, the cost for the SGSP project was estimated at two billion Korean won for 10 years and 3.5 billion won for 50 years. The benefits of safe groundwater were evident in the results of the cost comparison between waterworks and safe groundwater; 2.83 versus one over 10 years (or 5.74 billion won for waterworks versus 2.02 billion won for safe groundwater) and 4.11 versus one over 50 years (or 14.5 billion won for the waterworks versus 3.54 billion won for safe groundwater).
4. Groundwater Quality Management Roadmap
The majority of areas that lack a public water supply in Korea are in rural provinces in which NO3-N in groundwater is a representative pollutant. The major sources of NO3-N include pesticides, fertilizers, and livestock wastewater. Accordingly, reducing the NO3-N concentration and securing a safe groundwater supply requires building a water quality management system in recognition of the contaminated districts in these areas. The primary purpose of the groundwater quality management roadmap is to establish preliminary pollution prevention and post-treatment measures such as pollution source management measures and water treatment plans. This roadmap suggests an investigation procedure, a method for nationwide groundwater pollution sources, and a condition survey using basic scientific data for the groundwater quality management policy.
A water quality management roadmap for Korea is proposed with four stages, considering Korea’s NO3-N pollution situation (Table 15). The main subjects of the roadmap are the survey on contamination status, the survey on groundwater contamination, the development of pollution reduction techniques, and the establishment of the groundwater quality management system.
5. Conclusions
This study summarized the Safe Groundwater Supply Project (SGSP) from 2014 to 2016, which provided free water quality inspections for people in rural areas without a municipal drinking water supply who use groundwater from old, unregistered wells without regular water quality tests due to cost. The SGSP largely consisted of water quality analysis, the detection of water well interiors, the installation of public drinking water wells, the selection of pilot project area among high-pollution areas, and pilot projects that sought to improve the water quality in high-pollution areas.
According to the results of the water quality analysis, approximately 50% of the surveyed areas exceeded the drinking water standards, and most of the excessive components were NO3-N and total coliforms, which are typical contaminants in rural areas. Therefore, national policy and welfare regulations regarding NO3-N and total coliforms are needed to ensure the quality safety of drinking groundwater in rural areas without municipal drinking water.
Five detailed survey areas were selected every year through water quality analysis, well interior detection, and environmental surveys around the wells, and then one of the survey areas was selected for a pilot water quality improvement project. Through well interior detection and environmental surveys, suggestions were made regarding the prevention of well pollutant inflow, the improvement of facilities, and educating the residents to improve the groundwater quality. Furthermore, safe groundwater can be supplied to the residents by installing public drinking water wells in the pilot project areas.
Additionally, the benefit/cost analysis between waterworks and safe groundwater found that safe groundwater is more efficient than waterworks by about four times. The groundwater quality management roadmap was also proposed for the survey on contamination status, the survey on groundwater contamination, the development of pollution reduction techniques, and the establishment of a groundwater quality management system.
The SGSP determined regional groundwater pollution characteristics to improve water quality and then suggested an appropriate groundwater management plan for each region. As a result, in most rural areas without a municipal water supply in Korea, groundwater quality can be properly managed by reducing NO3-N concentration, enhancing the water quality, and supplying safe groundwater.
Acknowledgments
We thank two anonymous reviewers, who provided helpful comments on a previous draft of this paper. This research was financially supported by the National Research Foundation of Korea (NRF) and funded by the Ministry of Education (NRF-2017R1A2B2009033) as well as by the research project, ‘A study on safe groundwater supply project for municipal water unsupplied area in 2016’ of the National Institute of Environmental Research of Korea.
Author Contributions
This manuscript was mainly written by both C.-M. Lee and S.-Y. Hamm with partial contributions from the other coauthors. H.-T. Jeon conducted data processing. M. Kim and H.-K. Kim reviewed water quality analysis. K. Kim reviewed transport modeling. All co-authors read and explicitly approved the final manuscript.
Conflicts of Interest
The authors declare no conflict of interest.
References
- Ministry of Environment. Statistics of Waterworks in 2015; Ministry of Environment: Sejong, Korea, 2015; pp. 38–42.
- Ministry of Environment. Groundwater Act. Ministry of Environment: Sejong, Korea. 2015. Available online: http://law.go.kr/englssc.do?menuid=0&submenu=5&query=#libgcolor0 (accessed on 22 December 2015).
- Spalding, R.F.; Exner, M.E. Occurrence of nitrate in groundwater: A review. J. Environ. Qual. 1993, 22, 392–402. [Google Scholar] [CrossRef]
- Hudak, P.F. Regional trends in nitrate content of Texas groundwater. J. Hydrol. 2000, 228, 37–47. [Google Scholar] [CrossRef]
- Reimer, A. U.S. Water Policy: Trends and Future Directions; National Agricultural and Rural Development Policy Center (NARDeP), NARDeP Working Paper. 2013, pp. 1–37. Available online: http://www.nardep.info/uploads/WaterPolicy_Reimer.pdf (accessed on October 2013).
- Gerlak, A.K.; Megdal, S.B.; Varady, R.G.; Richards, H. Groundwater Governance in the U.S. Summary of Initial Survey Results; The University of Arizona: Tucson, AZ, USA, 2013; pp. 1–24. Available online: https://wrrc.arizona.edu/sites/wrrc.arizona.edu/files/pdfs/GroundwaterGovernanceReport-FINALMay2013.pdf (accessed on 6 July 2017).
- Megdal, S.B.; Gerlak, A.K.; Varady, R.G.; Huang, L. Groundwater Governance in the United States: Common Priorities and Challenges. Groundwater 2015, 53, 677–684. [Google Scholar] [CrossRef] [PubMed]
- U.S. Environmental Protection Agency. Understanding the Safe Drinking Water Act; U.S. Environmental Protection Agency, Office of Water: Washington, DC, USA, 2004; pp. 1–4.
- U.S. Environmental Protection Agency. National Primary Drinking Water Regulations; U.S. Environmental Protection Agency, Office of Water: Washington, DC, USA, 2009; pp. 1–6.
- National Institute of Environmental Research. Survey on the Background and Pollution of Groundwater in Livestock Areas (14); National Institute of Environmental Research: Incheon, Korea, 2014; pp. 1–524.
- Kim, Y.T.; Woo, N.C. Nitrate contamination of shallow groundwater in an agricultural area having intensive livestock facilities. J. Soil Groundw. Environ. 2003, 8, 57–67. [Google Scholar]
- Hyun, G.T. Studies on the Contamination Properties of Soil and Groundwater in a Densely Populated Livestock Areas in Jeju Island. Ph.D. Dissertation, Jeju National University, Jeju Island, Korea, 2011. [Google Scholar]
- Hamm, J.G. Selection of Natural Background Value of Nitrate Concentration in Domestic Groundwater using Cumulative Probability Distribution Graph. Master’s Thesis, Korea University, Seoul, Korea, 2008. [Google Scholar]
- Woo, N.C.; Kim, H.D.; Lee, K.S.; Park, W.B.; Koh, G.W.; Moon, Y.S. Interpretation of groundwater system and contamination by water-quality monitoring in the Daejung watershed, Jeju Island. Econ. Environ. Geol. 2001, 34, 485–498. [Google Scholar]
- Cheong, J.Y.; Hamm, S.Y.; Lee, J.H.; Lee, K.S.; Woo, N.C. Groundwater nitrate contamination and risk assessment in an agricultural area, South Korea. Environ. Earth. Sci. 2012, 66, 1127–1136. [Google Scholar] [CrossRef]
- Ministry of Environment. Water Supply and Waterworks Installation Act. Ministry of Environment: Sejong, Korea. 2016. Available online: http://law.go.kr/engLsSc.do?menuId=0&subMenu=5&query=#liBgcolor0 (accessed on 27 January 2016).
- Ministry of Environment. Drinking Water Management Act; Ministry of Environment: Sejong, Korea. 2017. Available online: http://law.go.kr/engLsSc.do?menuId=0&subMenu=5&query=#AJAX (accessed on 27 December 2016).
- Ministry of Environment. The Rules on Groundwater Quality Conservation, etc. Ministry of Environment: Sejong, Korea. 2017. Available online: http://www.law.go.kr/lsSc.do?menuId=0&p1=&subMenu=1&nwYn=1§ion=&tabNo=&query=%EC%88%98%EB%8F%84%EB%B2%95#AJAX (accessed on 29 March 2017).
- National Institute of Environmental Research. Drinking Groundwater Quality Survey and Its Management Policy for the Unserved Areas of Public Water Supply; National Institute of Environmental Research: Incheon, Korea, 2014; pp. 1–179.
- National Institute of Environmental Research. A Study on Safe Groundwater Supply Project for Municipal Water Unsupplied Area in 2016; National Institute of Environmental Research: Incheon, Korea, 2016; pp. 1–236.
- National Institute of Environmental Research. A Study of Optimal Management Measures for Securing Safe Groundwater; National Institute of Environmental Research: Incheon, Korea, 2015; pp. 1–302.
Figure 1.
Study areas in (a) 2014; (b) 2015; (c) 2016.
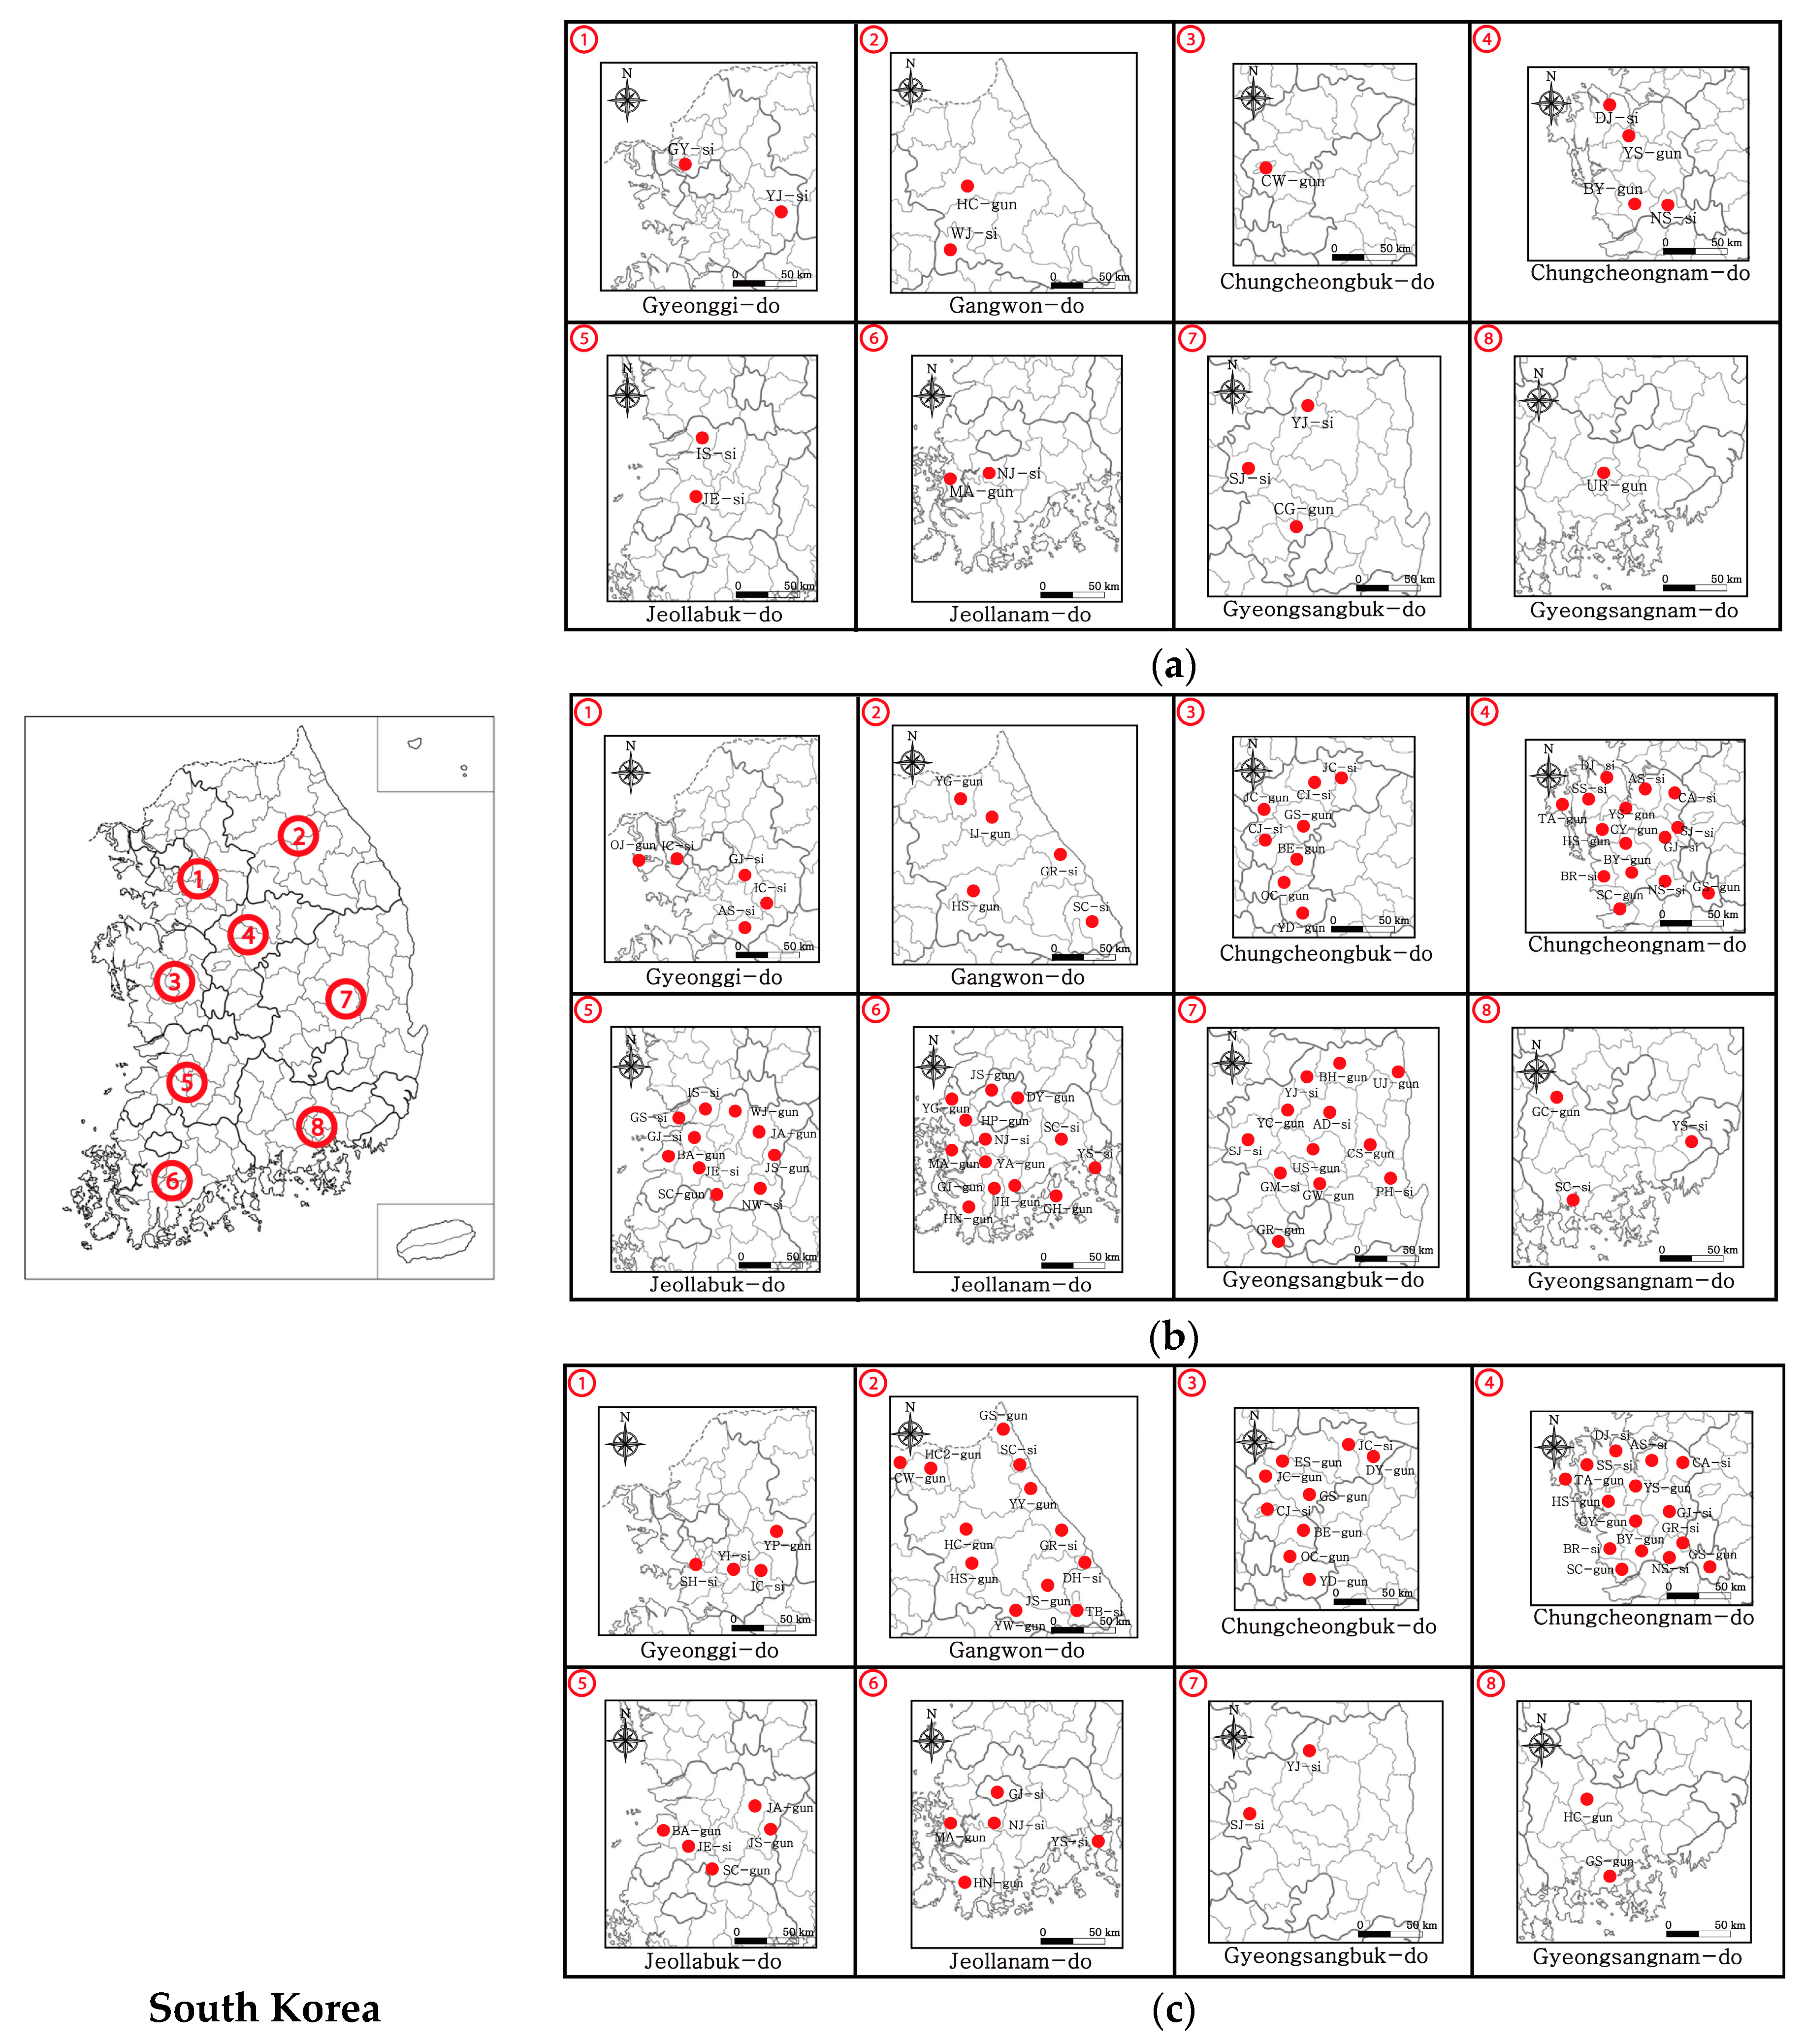
Figure 2.
Excess rate of water quality analysis.
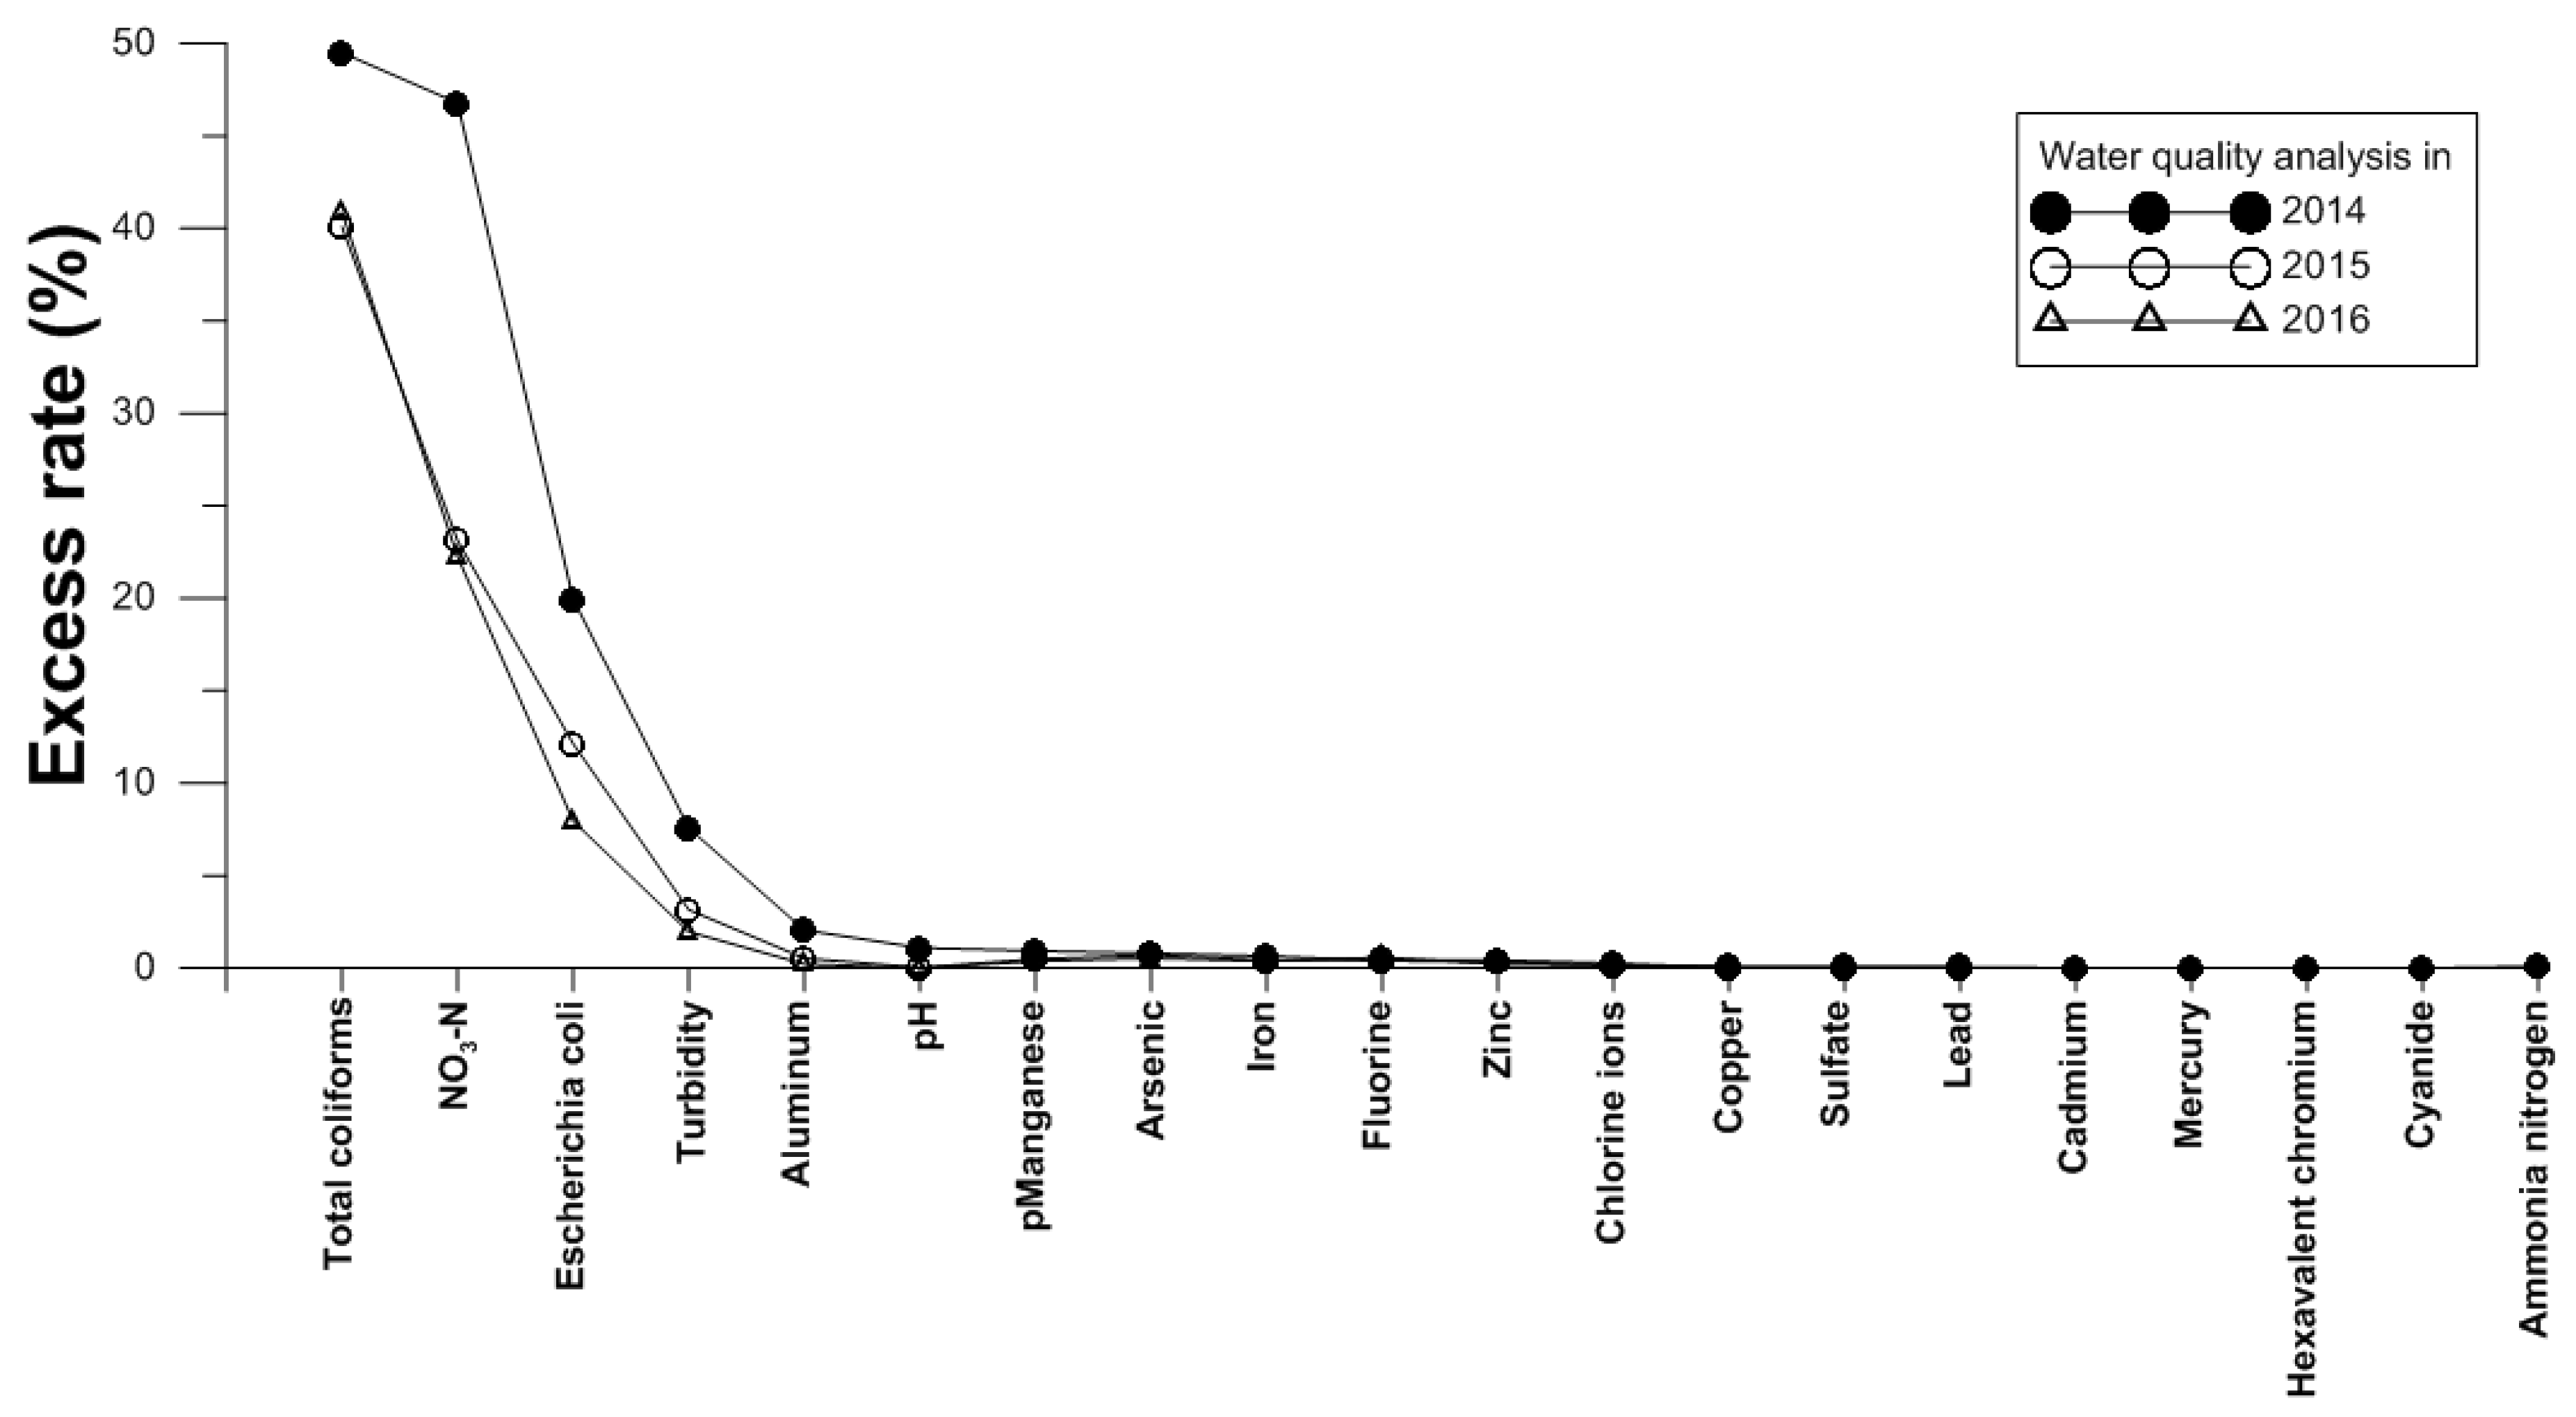
Figure 3.
Installation of public drinking water wells.
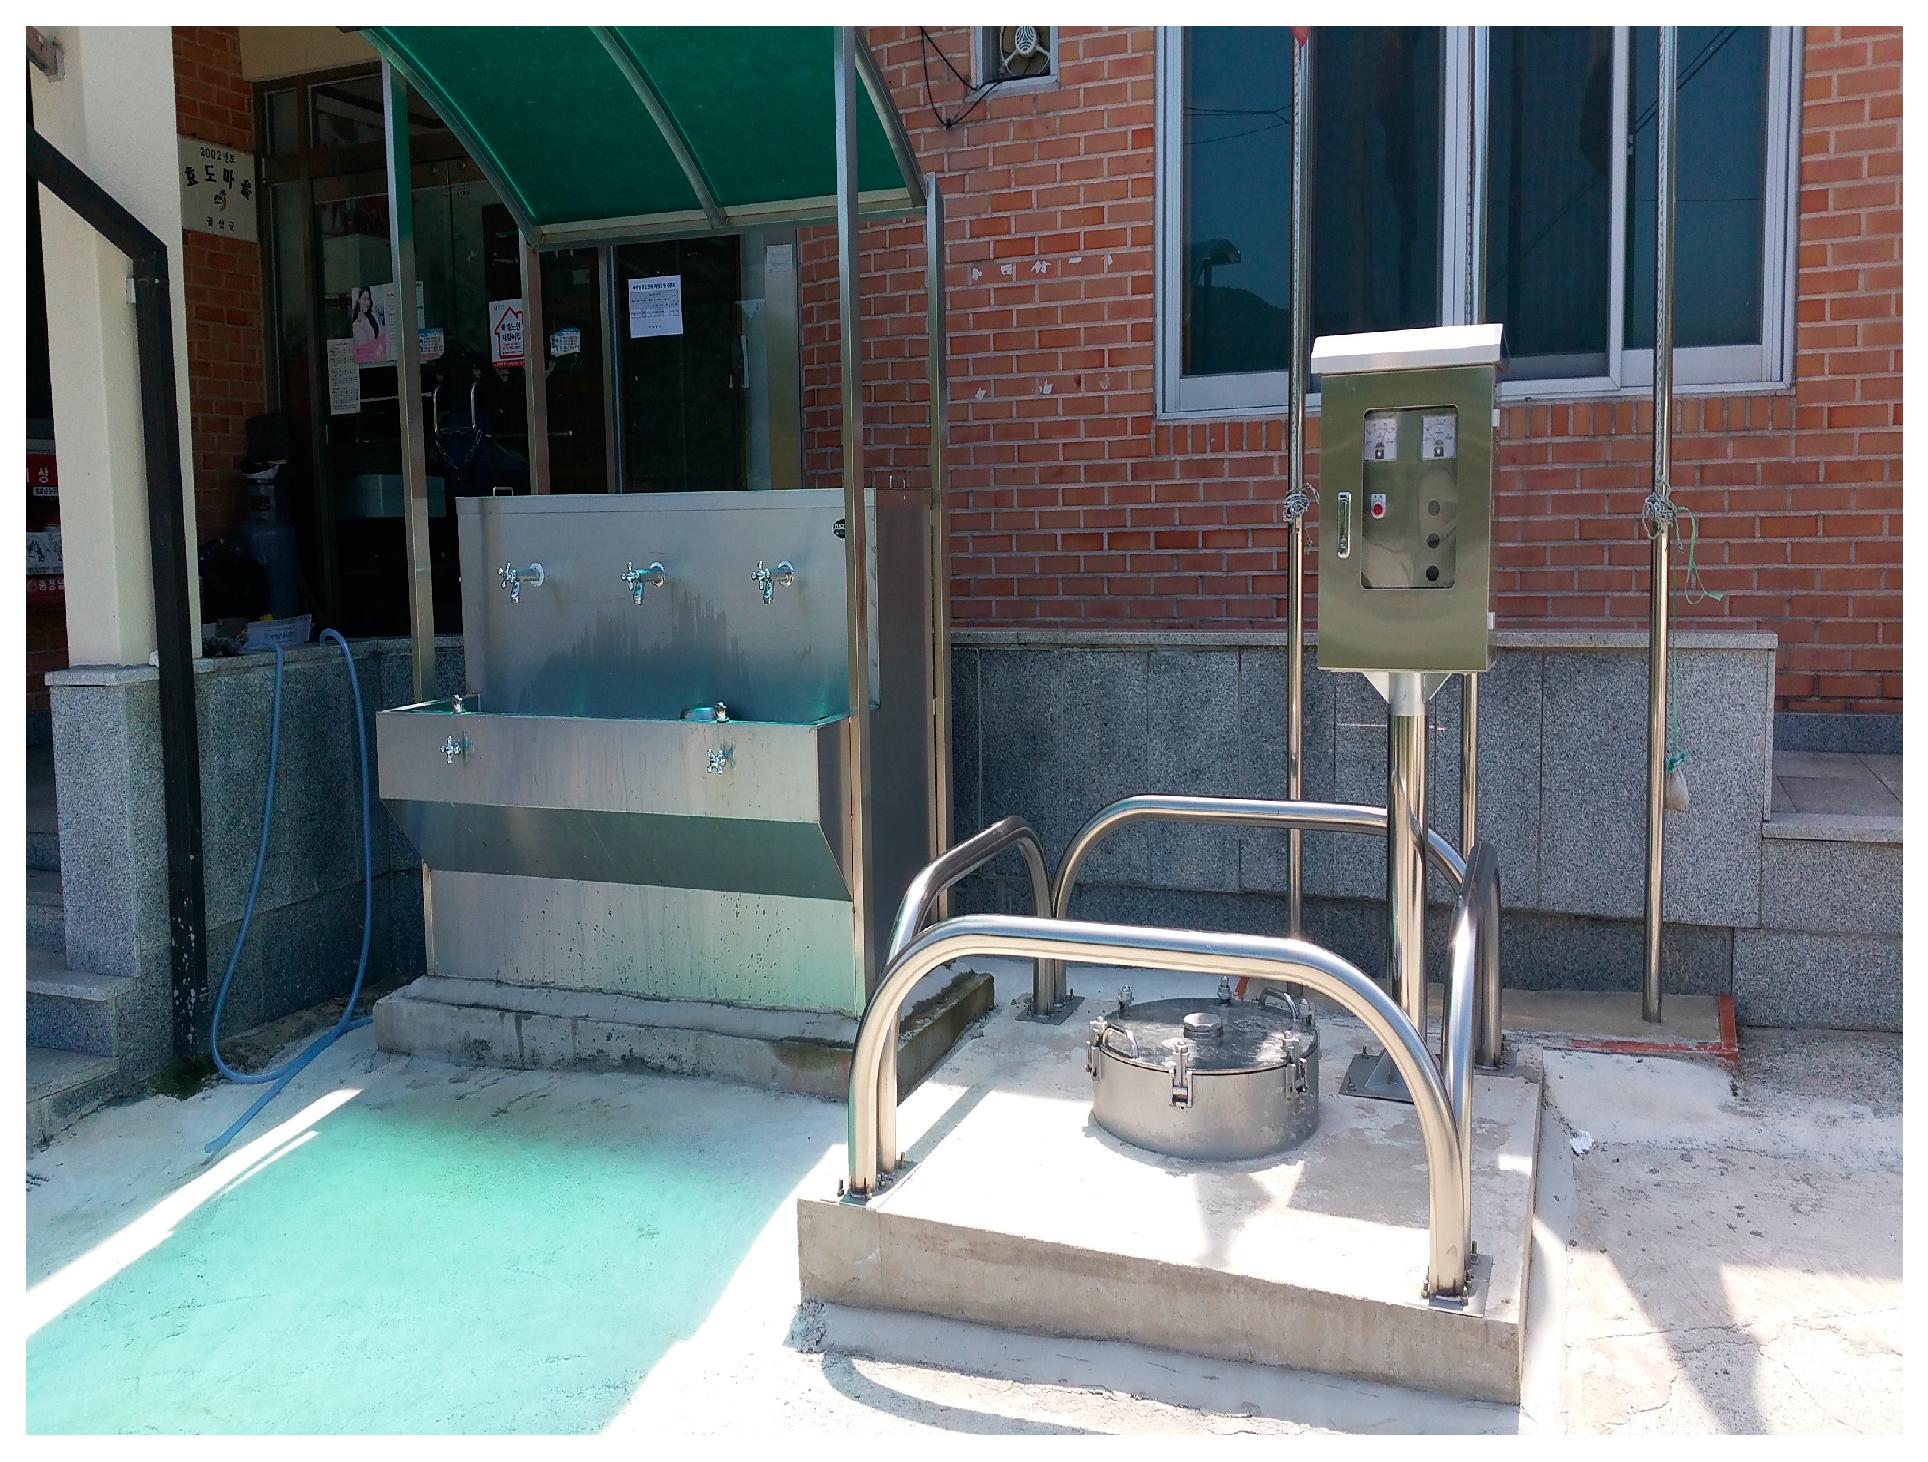
Figure 4.
Design of observation wells; (a) single well and (b) multi-well.
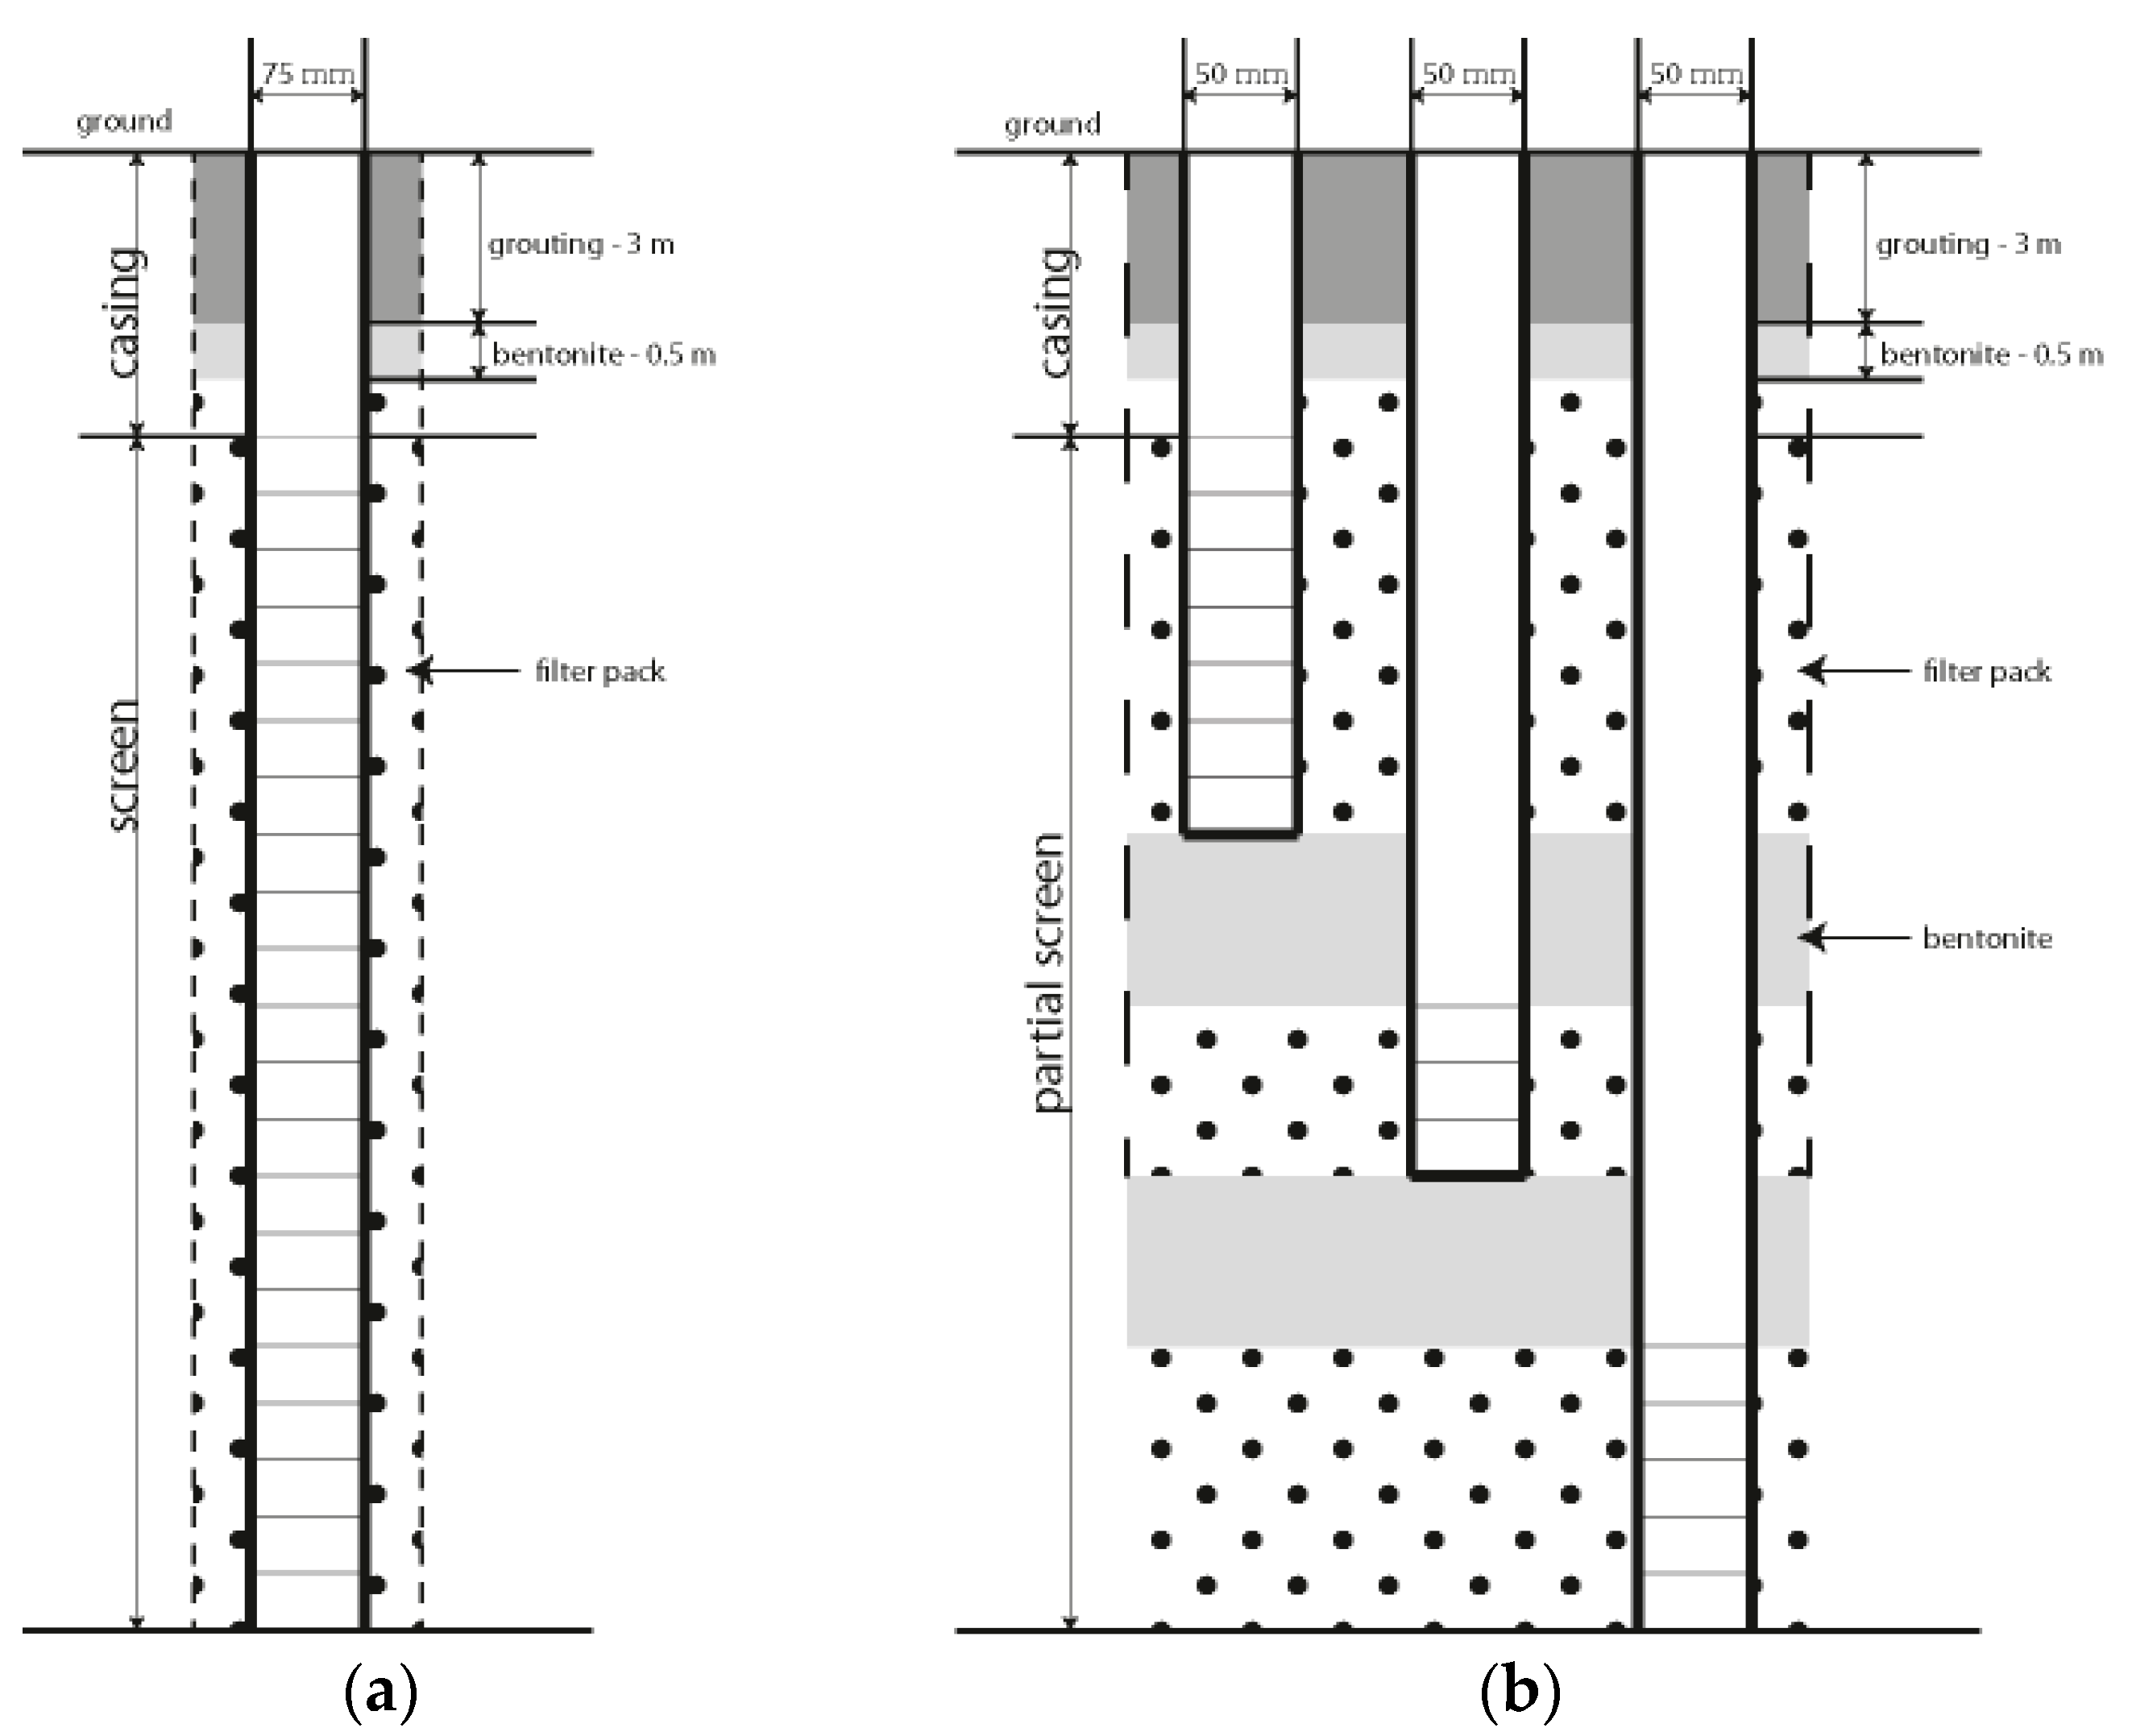
Figure 5.
Results of the NO3-N transport modeling in (a) 2015 and (b) 2016.

Table 1.
Korea’s NO3-N groundwater standard.
| Constituent | Drinking Water | Domestic Water | Water for Agriculture and Fishing | Water for Industry |
|---|---|---|---|---|
| NO3-N (mg/L) | ≤10 | ≤20 | ≤20 | ≤40 |
| Total coliforms | No detection at 100 mL | Detected from 100 mL to below 5000 mL | Detected from 100 mL to below 5000 mL | Detected from 100 mL to below 5000 mL |
| Escherichia coli | No detection at 100 mL | No regulation | No regulation | No regulation |
Table 2.
Number of samples for water quality analysis.
| Year | 2014 | 2015 | 2016 | |
|---|---|---|---|---|
| Area | ||||
| New test area | - | 17,801 | 20,621 | |
| Contaminated area among existing water quality data | 14,494 | 7196 | 4784 | |
| Vulnerable area | - | 903 | 156 | |
| Carcass disposal site | - | - | 353 | |
| Total | 14,494 | 25,900 | 25,914 | |
Table 3.
Items and methods of groundwater quality tests.
| Test | Item | Method and Instrument |
|---|---|---|
| Field test | NO3-N | NO3-N portable unit |
| pH | Glass electrode | |
| Laboratory test | pH | Glass electrode |
| NO3-N, Chlorine ions, Fluorine, Sulfate, Cadmium, Mercury | Ion chromatography | |
| Aluminum, Manganese, Lead, Zinc, Iron, Arsenic, Copper | Inductively coupled plasma-mass spectroscopy | |
| Turbidity | Turbidity meter (Hach) | |
| Total coliforms, Escherichia coli | Enzyme substrate | |
| Ammonia nitrogen, Hexavalent chromium | Ultraviolet-visible spectroscopy | |
| Cyanide | Continuous flow method |
Table 4.
Drinking water standards and detection limits.
| Item | Drinking Water Standard | Detection Limit |
|---|---|---|
| NO3-N | <10 mg/L | 0.1 mg/L |
| Total coliforms | Non-detection/100 mg | Detection or Non-detection |
| Escherichia coli | Non-detection/100 mg | Detection or Non-detection |
| Turbidity | <1 NTU | 0.02 NTU |
| Aluminum | <0.2 mg/L | 0.02 mg/L |
| pH | 5.8–8.5 | 0.1 |
| Manganese | <0.3 mg/L | 0.004 mg/L |
| Arsenic | <0.01 mg/L | 0.005 mg/L |
| Iron | <0.3 mg/L | 0.05 mg/L |
| Fluorine | <1.5 mg/L | 0.15 mg/L |
| Zinc | <3 mg/L | 0.002 mg/L |
| Chlorine ions | <250 mg/L | 0.4 mg/L |
| Ammonia nitrogen | <0.5 mg/L | 0.01 mg/L |
| Copper | <1 mg/L | 0.008 mg/L |
| Sulfate | <250 mg/L | 2 mg/L |
| Lead | <0.01 mg/L | 0.005 mg/L |
| Cadmium | <0.005 mg/L | 0.002 mg/L |
| Mercury | <0.001 mg/L | 0.001 mg/L |
| Hexavalent chromium | <0.05 mg/L | 0.02 mg/L |
| Cyanide | <0.01 mg/L | 0.01 mg/L |
Table 5.
Criteria for determining the suitability of the well installation area for drinking purpose.
Table 5.
Criteria for determining the suitability of the well installation area for drinking purpose.
| Review Item | Checklist | Pass/Fail Points | |
|---|---|---|---|
| Water service Plan | Within 2 years | 0 | |
| Within 2–5 years | 1 | ||
| Without 5 years | 2 | ||
| Unplanned | 3 | ||
| Expected water supply households | 10 or more households/20 or more residents within target candidate area (radius 500 m) | 3 | |
| 10 or fewer households/20 or less residents within target candidate area (radius 500 m) | 1 | ||
| Nearby Facilities | Less than five commercial facilities within candidate area (radius 500 m) | 3 | |
| More than five commercial facilities within candidate area (radius 500 m) | 1 | ||
| Nearby pollution source | Absence | 3 | |
| Existence (livestock, factory) | 1 | ||
| Resident response | Positive | 3 | |
| Negative | Fail | ||
| Planned site conditions | Public/private | Private property | Fail |
| Owned by the village or government | 3 | ||
| Possibility of construction | Incongruity | 0 | |
| Congruity | 3 | ||
| Accessibility | Incongruity | 0 | |
| Congruity | 3 | ||
Table 6.
Criteria for pilot project areas.
| Factor | Item |
|---|---|
| Hydrogeology | Groundwater abundance |
| Permeability | |
| Watershed size conformity | |
| Groundwater vulnerability to contamination | Contaminant concentration/excess rate |
| Potential pollution distribution/type | |
| Well usage situation | |
| Administration | Activeness of the local governments |
| Resident response/necessity | |
| Water supply plan |
Table 7.
Results of water quality analysis with 20 items for the total number of wells in 2014.
| Item | Number of Samples | Wells in Excess of Water Quality Standard | Excess Rate (%) | Concentration (N-D: Non-Detection) | ||
|---|---|---|---|---|---|---|
| Standard | Mean | Max | ||||
| Contaminated areas among existing water quality data | ||||||
| Total coliforms | 14,204 | 7032 | 49.51 | N-D | - | Detection |
| NO3-N | 14,201 | 6644 | 46.79 | 10.0 mg/L | 12.2 | 157.7 |
| Escherichia coli | 14,204 | 2833 | 19.95 | N-D | - | Detection |
| Turbidity | 13,917 | 1053 | 7.57 | 1.0 NTU | 0.60 | 398.00 |
| Aluminum | 285 | 2.05 | 0.2 mg/L | 0.02 | 7.52 | |
| pH | 13,915 | 152 | 1.09 | 5.8–8.5 | 6.8 | 10.0 |
| Manganese | 13,917 | 130 | 0.93 | 0.3 mg/L | 0.015 | 14.870 |
| Arsenic | 112 | 0.80 | 0.01 mg/L | 0.000 | 0.087 | |
| Iron | 90 | 0.65 | 0.3 mg/L | 0.01 | 3.70 | |
| Fluorine | 56 | 0.40 | 1.5 mg/L | 0.06 | 9.79 | |
| Zinc | 46 | 0.33 | 3 mg/L | 0.131 | 18.648 | |
| Chlorine ions | 22 | 0.16 | 250 mg/L | 30 | 791 | |
| Ammonia nitrogen | 13,916 | 12 | 0.09 | 0.5 mg/L | 0.00 | 3.18 |
| Copper | 13,917 | 11 | 0.08 | 1 mg/L | 0.018 | 47.000 |
| Sulfate | 11 | 0.08 | 200 mg/L | 13 | 461 | |
| Lead | 6 | 0.04 | 0.01 mg/L | 0.000 | 0.020 | |
| Cadmium | 3 | 0.02 | 0.005 mg/L | 0.000 | 0.026 | |
| Mercury | 1 | 0.01 | 0.001 mg/L | 0.000 | 0.006 | |
| Hexavalent chromium | 0 | 0.00 | 0.05 mg/L | 0.00 | 0.03 | |
| Cyanide | 13,916 | 0 | 0.00 | 0.01 mg/L | 0.00 | 0.00 |
| Total | 14,494 | 11,017 | 76.01 | - | - | - |
Table 8.
Results of water quality analysis with 15 items in new survey areas in 2015.
| Item | Number of Samples | Wells in Excess of Water Quality Standard | Excess Rate (%) | Concentration (N-D: Non-Detection) | ||
|---|---|---|---|---|---|---|
| Standard | Mean | Max | ||||
| All areas | 25,900 | 12,813 | 49.47 | |||
| New survey areas | ||||||
| Total coliforms | 17,801 | 7175 | 40.31 | N-D | - | Detection |
| NO3-N | 2679 | 15.05 | 10.0 mg/L | 7.2 | 45.6 | |
| Escherichia coli | 2505 | 14.07 | N-D | - | Detection | |
| Turbidity | 641 | 3.60 | 1.0 NTU | 0.5 | 49.3 | |
| Aluminum | 113 | 0.63 | 0.2 mg/L | 0.02 | 6.81 | |
| pH | 4 | 0.02 | 5.8–8.5 | 6.9 | 9.8 | |
| Manganese | 102 | 0.57 | 0.3 mg/L | 0.01 | 4.47 | |
| Arsenic | 170 | 0.96 | 0.01 mg/L | 0.00 | 0.13 | |
| Iron | 87 | 0.49 | 0.3 mg/L | 0.02 | 2.21 | |
| Fluorine | 92 | 0.52 | 1.5 mg/L | 0.15 | 15.00 | |
| Zinc | 66 | 0.37 | 3 mg/L | 0.1 | 12.03 | |
| Chlorine ions | 50 | 0.28 | 250 mg/L | 28 | 6091 | |
| Copper | 5 | 0.03 | 1 mg/L | 0.01 | 2.61 | |
| Sulfate | 10 | 0.06 | 200 mg/L | 15 | 1663 | |
| Lead | 13 | 0.07 | 0.01 mg/L | 0.00 | 0.05 | |
| Total | 17,801 | 8337 | 46.83 | - | - | - |
| Contaminated areas among existing water quality data | ||||||
| Total coliforms | 7196 | 2892 | 40.19 | N-D | - | Detection |
| NO3-N | 3086 | 42.88 | 10.0 mg/L | 15.4 | 184.1 | |
| Escherichia coli | 559 | 7.77 | N-D | - | Detection | |
| Turbidity | 116 | 1.61 | 1.0 NTU | 0.5 | 74.3 | |
| Aluminum | 20 | 0.28 | 0.2 mg/L | 0.00 | 2.70 | |
| pH | 2 | 0.03 | 5.8–8.5 | 6.8 | 10.1 | |
| Manganese | 24 | 0.33 | 0.3 mg/L | 0.00 | 1.24 | |
| Arsenic | 14 | 0.19 | 0.01 mg/L | 0.00 | 0.03 | |
| Iron | 16 | 0.22 | 0.3 mg/L | 0.00 | 3.00 | |
| Fluorine | 23 | 0.32 | 1.5 mg/L | 0.00 | 4.75 | |
| Zinc | 38 | 0.53 | 3 mg/L | 0.05 | 18.53 | |
| Chlorine ions | 17 | 0.24 | 250 mg/L | 36 | 441 | |
| Copper | 3 | 0.04 | 1 mg/L | 0.01 | 2.85 | |
| Sulfate | 0 | 0.00 | 200 mg/L | 5.95 | 162.00 | |
| Lead | 5 | 0.07 | 0.01 mg/L | 0.00 | 0.05 | |
| Total | 7196 | 3989 | 55.43 | - | - | - |
| Vulnerability areas | ||||||
| Total coliforms | 903 | 317 | 35.11 | N-D | - | Detection |
| NO3-N | 222 | 24.58 | 10.0 mg/L | 7.1 | 55.2 | |
| Escherichia coli | 77 | 8.53 | N-D | - | Detection | |
| Turbidity | 59 | 6.53 | 1.0 NTU | 0.4 | 7.8 | |
| Aluminum | 5 | 0.55 | 0.2 mg/L | 0.01 | 0.47 | |
| pH | 0 | 0.00 | 5.8–8.5 | 6.7 | 8.1 | |
| Manganese | 2 | 0.22 | 0.3 mg/L | 0.01 | 1.57 | |
| Arsenic | 1 | 0.11 | 0.01 mg/L | 0.00 | 0.01 | |
| Iron | 9 | 1.00 | 0.3 mg/L | 0.02 | 1.12 | |
| Fluorine | 1 | 0.11 | 1.5 mg/L | 0.07 | 1.66 | |
| Zinc | 7 | 0.78 | 3 mg/L | 0.18 | 8.84 | |
| Chlorine ions | 1 | 0.11 | 250 mg/L | 23 | 558 | |
| Copper | 0 | 0.00 | 1 mg/L | 0.02 | 0.02 | |
| Sulfate | 0 | 0.00 | 200 mg/L | 12 | 169 | |
| Lead | 1 | 0.11 | 0.01 mg/L | 0.00 | 0.03 | |
| Total | 903 | 487 | 53.93 | - | - | - |
Table 9.
Results of water quality analysis with 15 items in 2016.
| Item | Number of Samples | Wells in Excess of Water Quality Standard | Excess Rate (%) | Concentration (N-D: Non-Detection) | ||
|---|---|---|---|---|---|---|
| Standard | Mean | Max | ||||
| All areas | 25,914 | 13,689 | 52.82 | |||
| New survey areas | ||||||
| Total coliforms | 20,621 | 9011 | 43.70 | N-D | - | Detection |
| NO3-N | 2989 | 14.49 | 10.0 mg/L | 7.1 | 131.3 | |
| Escherichia coli | 1803 | 8.74 | N-D | - | Detection | |
| Turbidity | 377 | 1.83 | 1.0 NTU | 0.4 | 136.0 | |
| Aluminum | 45 | 0.22 | 0.2 mg/L | 0.1 | 2.2 | |
| pH | 1 | 0.00 | 5.8–8.5 | 6.9 | 10.2 | |
| Manganese | 63 | 0.31 | 0.3 mg/L | 0.1 | 5.6 | |
| Arsenic | 112 | 0.54 | 0.01 mg/L | 0.01 | 0.15 | |
| Iron | 79 | 0.38 | 0.3 mg/L | 0.1 | 2.1 | |
| Fluorine | 140 | 0.68 | 1.5 mg/L | 0.5 | 16.2 | |
| Zinc | 28 | 0.14 | 3 mg/L | 0.1 | 16.7 | |
| Chlorine ions | 21 | 0.10 | 250 mg/L | 21.00 | 662 | |
| Copper | 1 | 0.00 | 1 mg/L | 0.03 | 3.81 | |
| Sulfate | 4 | 0.02 | 200 mg/L | 13 | 620 | |
| Lead | 6 | 0.03 | 0.01 mg/L | 0.01 | 0.02 | |
| Total | 20,621 | 10,332 | 50.10 | - | - | - |
| Contaminated areas among existing water quality data | ||||||
| Total coliforms | 4784 | 1453 | 30.37 | N-D | - | Detection |
| NO3-N | 2652 | 55.43 | 10.0 mg/L | 14.6 | 128.2 | |
| Escherichia coli | 231 | 4.83 | N-D | - | Detection | |
| Turbidity | 124 | 2.59 | 1.0 NTU | 0.4 | 32.1 | |
| Aluminum | 9 | 0.19 | 0.2 mg/L | 0.1 | 1.4 | |
| pH | 0 | 0.00 | 5.8–8.5 | 6.7 | 9.2 | |
| Manganese | 23 | 0.48 | 0.3 mg/L | 0.0 | 5.1 | |
| Arsenic | 16 | 0.33 | 0.01 mg/L | 0.02 | 0.07 | |
| Iron | 15 | 0.31 | 0.3 mg/L | 0.1 | 0.9 | |
| Fluorine | 5 | 0.10 | 1.5 mg/L | 0.3 | 2.7 | |
| Zinc | 31 | 0.65 | 3 mg/L | 0.2 | 19.9 | |
| Chlorine ions | 14 | 0.29 | 250 mg/L | 43 | 1070 | |
| Copper | 2 | 0.04 | 1 mg/L | 0 | 1.8 | |
| Sulfate | 0 | 0.00 | 200 mg/L | 16 | 181 | |
| Lead | 2 | 0.04 | 0.01 mg/L | 0.01 | 0.02 | |
| Total | 4784 | 3395 | 70.97 | - | - | - |
| Carcass disposal site | ||||||
| Total coliforms | 353 | 128 | 36.26 | N-D | - | Detection |
| NO3-N | 119 | 33.71 | 10.0 mg/L | 9.7 | 75.8 | |
| Escherichia coli | 25 | 7.08 | N-D | - | Detection | |
| Turbidity | 8 | 2.27 | 1.0 NTU | 0.4 | 7.7 | |
| Aluminum | 1 | 0.28 | 0.2 mg/L | 0.1 | 1.1 | |
| pH | 0 | 0.00 | 5.8–8.5 | 6.5 | 7.6 | |
| Manganese | 9 | 2.55 | 0.3 mg/L | 0.1 | 1.4 | |
| Arsenic | 7 | 1.98 | 0.01 mg/L | 0.01 | 0.04 | |
| Iron | 2 | 0.57 | 0.3 mg/L | 0.1 | 0.6 | |
| Fluorine | 2 | 0.57 | 1.5 mg/L | 0.3 | 2.7 | |
| Zinc | 1 | 0.28 | 3 mg/L | 0.1 | 4 | |
| Chlorine ions | 1 | 0.28 | 250 mg/L | 25 | 282 | |
| Copper | 0 | 0.00 | 1 mg/L | 0 | 0.9 | |
| Sulfate | 1 | 0.28 | 200 mg/L | 16 | 409 | |
| Lead | 0 | 0.00 | 0.01 mg/L | N-D | N-D | |
| Total | 353 | 218 | 61.76 | - | - | - |
| Vulnerable areas | ||||||
| Total coliforms | 208 | 0 | 0.00 | N-D | - | N-D |
| NO3-N | 7 | 3.37 | 10.0 mg/L | 4.0 | 28.0 | |
| Escherichia coli | 0 | 0.00 | N-D | - | N-D | |
| Turbidity | 0 | 0.00 | 1.0 NTU | 0.4 | 0.8 | |
| Aluminum | 0 | 0.00 | 0.2 mg/L | 0.06 | 0.06 | |
| pH | 0 | 0.00 | 5.8–8.5 | 6.5 | 6.9 | |
| Manganese | 0 | 0.00 | 0.3 mg/L | 0.02 | 0.16 | |
| Arsenic | 3 | 1.44 | 0.01 mg/L | 0.01 | 0.04 | |
| Iron | 0 | 0.00 | 0.3 mg/L | 0.06 | 0.07 | |
| Fluorine | 3 | 1.44 | 1.5 mg/L | 0.4 | 4 | |
| Zinc | 0 | 0.00 | 3 mg/L | 0.1 | 1 | |
| Chlorine ions | 0 | 0.00 | 250 mg/L | 22 | 122 | |
| Copper | 0 | 0.00 | 1 mg/L | 0.03 | 0.15 | |
| Sulfate | 0 | 0.00 | 200 mg/L | 14 | 52 | |
| Lead | 0 | 0.00 | 0.01 mg/L | 0.01 | 0.01 | |
| Total | 208 | 13 | 6.25 | - | - | - |
Table 10.
Criteria for selecting the candidate areas in 2016.
| Stage | Criteria of the Candidate Areas |
|---|---|
| 1 | Site of results in the 2016 project: 1268 |
| 2 | Had more than 12 households in the village: 564 |
| 3 | Had more than six wells of water quality exceeded: 146 |
| 4 | Had more than 20% water quality exceeded: 140 |
| 5 | Had more than 50% altitude distribution over 200 m: 18 |
| 6 | Except in the water supply area: 8 |
| 7 | Selected five candidate sites |
Table 11.
Pollution loading results of high-pollution areas.
| Site | Watershed Area (m2) | Agricultural Area (m2) | Nitrogen Content (kg/Year) | Usage Per Unit Area (kg/Year/m2) | |||
|---|---|---|---|---|---|---|---|
| Total | House | Animal Compost | Land Fertilization | ||||
| Site 1 | 310,343 | 70,613 | 1362 | 103 | 103 | 1156 | 0.019 |
| Site 2 | 508,100 | 119,872 | 1964 | 0 | 724 | 1239 | 0.016 |
| Site 3 | 569,227 | 122,479 | 1599 | 206 | 0 | 1392 | 0.013 |
| Site 4 | 3,099,435 | 190,564 | 7105 | 0 | 4481 | 2624 | 0.037 |
| Site 5 | 313,673 | 30,645 | 416 | 97 | 0 | 318 | 0.014 |
| Total | 4,800,778 | 534,173 | 12,445 | 407 | 5308 | 6730 | 0.023 |
Table 12.
Groundwater level data input for groundwater modeling (GL-, m).
| Pilot Project Area in 2015 | Pilot Project Area in 2016 | ||
|---|---|---|---|
| Well | Groundwater Level | Well | Groundwater Level |
| BS-1 | 5.270 | M01 | 15.629 |
| BS-2 | 7.230 | M02 | 13.348 |
| BS-3 | 4.505 | M03 | 14.366 |
| BS-4 | 8.065 | M04 | 12.399 |
| BS-5 | 6.655 | M05 | 12.449 |
| BS-6 | 1.575 | M06 | 12.808 |
| BS-7 | 7.260 | M07 | 12.420 |
| BS-8 | 1.840 | M08 | 12.379 |
| BS-9 | 4.775 | M09 | 12.089 |
| BS-M1 | 1.870 | M10 | 12.282 |
| BS-M2 | 3.450 | M11 | 11.643 |
| BS-M3 | 1.705 | M12 | 11.784 |
| MM-1 | 13.181 | ||
| MM-2 | 12.877 | ||
| MM-3 | 12.378 | ||
Table 13.
Results of slug test at pilot project areas.
| Single Well | Solution Method | Geometric Mean | Multi Well | Solution Method | Geometric Mean | ||
|---|---|---|---|---|---|---|---|
| Bouwer–Rice | Hvorslev | Bouwer–Rice | Hvorslev | ||||
| Pilot project area in 2015 | |||||||
| BS-1 | 6.04 × 10⁻⁴ | 8.52 × 10⁻⁴ | 7.19 × 10⁻⁴ | BS-M1-D | 6.68 × 10⁻⁶ | 1.03 × 10⁻⁵ | 8.28 × 10⁻⁶ |
| BS-2 | 6.47 × 10⁻⁴ | 9.26 × 10⁻⁴ | 7.74 × 10⁻⁴ | BS-M1-M | 1.01 × 10⁻⁵ | 1.50 × 10⁻⁵ | 1.23 × 10⁻⁵ |
| BS-3 | 7.63 × 10⁻⁴ | 1.06 × 10⁻³ | 8.99 × 10⁻⁴ | BS-M1-S | 6.41 × 10⁻⁴ | 8.70 × 10⁻⁴ | 7.47 × 10⁻⁴ |
| BS-4 | 6.82 × 10⁻⁴ | 9.70 × 10⁻⁴ | 8.13 × 10⁻⁴ | BS-M2-D | 1.39 × 10⁻³ | 1.88 × 10⁻³ | 1.62 × 10⁻³ |
| BS-5 | 9.81 × 10⁻⁴ | 1.39 × 10⁻³ | 1.17 × 10⁻³ | BS-M2-M | 1.40 × 10⁻³ | 1.83 × 10⁻³ | 1.60 × 10⁻³ |
| BS-6 | 1.99 × 10⁻³ | 2.91 × 10⁻³ | 2.41 × 10⁻³ | BS-M2-S | 9.07 × 10⁻⁴ | 1.23 × 10⁻³ | 1.06 × 10⁻³ |
| BS-7 | 1.51 × 10⁻⁴ | 2.10 × 10⁻⁴ | 1.78 × 10⁻⁴ | BS-M3-D | 5.99 × 10⁻⁵ | 8.17 × 10⁻⁵ | 7.00 × 10⁻⁵ |
| BS-8 | 2.51 × 10⁻⁴ | 3.58 × 10⁻⁴ | 2.99 × 10⁻⁴ | BS-M3-M | 1.03 × 10⁻⁴ | 1.44 × 10⁻⁴ | 1.21 × 10⁻⁴ |
| BS-9 | 2.08 × 10⁻⁴ | 2.92 × 10⁻⁴ | 2.46 × 10⁻⁴ | BS-M3-S | 3.36 × 10⁻⁵ | 4.69 × 10⁻⁵ | 3.97 × 10⁻⁵ |
| Total | 3.17 × 10⁻⁴ | ||||||
| Pilot project area in 2016 | |||||||
| M01 | 3.39 × 10⁻⁴ | 3.18 × 10⁻⁴ | 3.28 × 10⁻⁴ | MM1-D | 2.00 × 10⁻³ | 2.02 × 10⁻³ | 2.01 × 10⁻³ |
| M02 | 4.44 × 10⁻⁴ | 4.89 × 10⁻⁴ | 4.66 × 10⁻⁴ | MM1-M | 3.90 × 10⁻⁴ | 4.14 × 10⁻⁴ | 4.02 × 10⁻⁴ |
| M03 | 4.26 × 10⁻⁴ | 4.65 × 10⁻⁴ | 4.45 × 10⁻⁴ | MM1-S | 2.16 × 10⁻⁴ | 2.33 × 10⁻⁴ | 2.25 × 10⁻⁴ |
| M04 | 4.84 × 10⁻⁴ | 4.87 × 10⁻⁴ | 4.86 × 10⁻⁴ | MM2-D | 6.98 × 10⁻⁴ | 8.55 × 10⁻⁴ | 7.73 × 10⁻⁴ |
| M05 | 8.19 × 10⁻⁴ | 8.92 × 10⁻⁴ | 8.55 × 10⁻⁴ | MM2-M | 4.09 × 10⁻⁵ | 2.73 × 10⁻⁵ | 3.34 × 10⁻⁵ |
| M06 | 5.05 × 10⁻⁴ | 5.03 × 10⁻⁴ | 5.04 × 10⁻⁴ | MM2-S | 9.91 × 10⁻⁵ | 8.74 × 10⁻⁵ | 9.31 × 10⁻⁵ |
| M07 | 1.66 × 10⁻⁴ | 1.68 × 10⁻⁴ | 1.67 × 10⁻⁴ | MM3-D | 3.83 × 10⁻⁴ | 4.44 × 10⁻⁴ | 4.12 × 10⁻⁴ |
| M08 | 3.73 × 10⁻⁴ | 4.06 × 10⁻⁴ | 3.90 × 10⁻⁴ | MM3-M | 5.98 × 10⁻⁴ | 6.97 × 10⁻⁴ | 6.46 × 10⁻⁴ |
| M09 | 7.45 × 10⁻⁴ | 8.77 × 10⁻⁴ | 8.08 × 10⁻⁴ | MM3-S | 1.80 × 10⁻⁴ | 1.73 × 10⁻⁴ | 1.76 × 10⁻⁴ |
| M10 | 6.57 × 10⁻⁴ | 6.54 × 10⁻⁴ | 6.56 × 10⁻⁴ | (S: Shallow, M: Medium, D: Deep) | |||
| M11 | 3.29 × 10⁻⁴ | 3.70 × 10⁻⁴ | 3.49 × 10⁻⁴ | ||||
| M12 | 3.83 × 10⁻⁴ | 4.10 × 10⁻⁴ | 3.97 × 10⁻⁴ | ||||
| Total | 3.79 × 10⁻⁴ | ||||||
Table 14.
Benefit/cost analysis of public water supply versus safe groundwater (unit: 1000 won).
| Public water supply | Item | 10 Years | 50 Years | Safe groundwater | Item | 10 Years | 50 Years |
| Maintenance | 5,300,826 | 13,751,483 | Maintenance | 1,211,277 | 2,468,519 | ||
| Installation | 439,463 | 439,463 | Installation | 810,840 | 1,073,451 | ||
| Total | 5,740,289 | 14,584,159 | Total | 2,022,117 | 3,541,970 |
Table 15.
Roadmap for stepwise water quality conservation for safe groundwater quality management.
| Main Subject | Stage 1 | Stage 2 | Stage 3 | Stage 4 |
|---|---|---|---|---|
| Survey on contamination status | Identify the survey areas and scope | Pollution survey: Status and field survey | Results analysis: Preparing management plan | Report on results and improving management plan |
| Survey on groundwater contamination | Establish an investigation plan: Areas and analysis items for groundwater contamination | Carrying out the survey: Sampling, water quality analysis, etc. | Correlation analysis between contamination source and groundwater | Analysis of pollution change trend through statistical analysis |
| Development of pollution reduction techniques | Determination of pollution distribution, treatment level according to local characteristics with inflow pollutant concentration | Identification and selection of applicable technology: Considering the cost/efficiency and number of households supplied. | Research and development of selection technology: Suitable for safe groundwater supply purpose | Selection of technology and start of pilot project |
| Establishment of groundwater quality management system | Summary of survey results, NO3-N distribution by monitoring | Establishment of pollution-vulnerable districts: Overconcentration, trend analysis, pollution impact factor, etc. Providing relevant guidelines and management plan: Management of pollution-vulnerable districts and NO3-N usage report, etc. | Report on pilot project results and apply to other regions | |
© 2017 by the authors. Licensee MDPI, Basel, Switzerland. This article is an open access article distributed under the terms and conditions of the Creative Commons Attribution (CC BY) license (http://creativecommons.org/licenses/by/4.0/).
Share and Cite
MDPI and ACS Style
Lee, C.-M.; Hamm, S.-Y.; Jeon, H.-T.; Kim, M.; Kim, H.-K.; Kim, K. Water Policy of Korea for Supplying Safe Groundwater in Rural Areas. Water 2017, 9, 508. https://doi.org/10.3390/w9070508
AMA Style
Lee C-M, Hamm S-Y, Jeon H-T, Kim M, Kim H-K, Kim K. Water Policy of Korea for Supplying Safe Groundwater in Rural Areas. Water. 2017; 9(7):508. https://doi.org/10.3390/w9070508
Chicago/Turabian StyleLee, Chung-Mo, Se-Yeong Hamm, Hang-Tak Jeon, MoonSu Kim, Hyun-Koo Kim, and Kangjoo Kim. 2017. "Water Policy of Korea for Supplying Safe Groundwater in Rural Areas" Water 9, no. 7: 508. https://doi.org/10.3390/w9070508
Note that from the first issue of 2016, this journal uses article numbers instead of page numbers. See further details here.