Effectiveness of ABC Waters Design Features for Runoff Quantity Control in Urban Singapore
by
 ,
,
Wing Ken Yau
1, 
Mohanasundar Radhakrishnan
2,*,
Shie-Yui Liong
3,
Chris Zevenbergen
2 and
Assela Pathirana
2 1
PUB Singapore’s national water agency, Singapore 228231, Singapore
2
Water Science and Engineering Department, IHE Delft Institute for Water Education, 2611 AX Delft, The Netherlands
3
Tropical Marine Science Institute, National University of Singapore, Singapore 119227, Singapore
*
Author to whom correspondence should be addressed.
Water 2017, 9(8), 577; https://doi.org/10.3390/w9080577
Submission received: 6 June 2017
/
Revised: 7 July 2017
/
Accepted: 31 July 2017
/
Published: 3 August 2017
(This article belongs to the Special Issue Sponge Cities: Emerging Approaches, Challenges and Opportunities)
Abstract
:Active, Beautiful, Clean Waters (ABC Waters) design features—natural systems consisting of plants and soil that detain and treat rainwater runoff—comprise a major part of Sustainable urban Drainage Systems (SuDS) in Singapore. Although it is generally accepted that ABC Waters design features are able to detain runoff and reduce peak flow, their effectiveness in doing so has not been studied or documented locally. This research aims to determine their effectiveness in reducing peak flow based on a newly constructed pilot precinct named Waterway Ridges. Four types of ABC Waters features have been integrated holistically within the development, and designed innovatively to allow the precinct to achieve an effective C-value of 0.55 for the 10-year design storm; the precinct-wide integration and implemented design with the aim of substantially reducing peak flow are firsts in Singapore. The study is based on results from an uncalibrated 1D hydraulic model developed using the Storm Water Management Model (SWMM). Identification of key design elements and performance enhancement of the features via optimisation were also studied. Results show that the features are effective in reducing peak flow for the 10-year design storm, by 33%, and allowed the precinct to achieve an effective C-value of 0.60.
1. Introduction
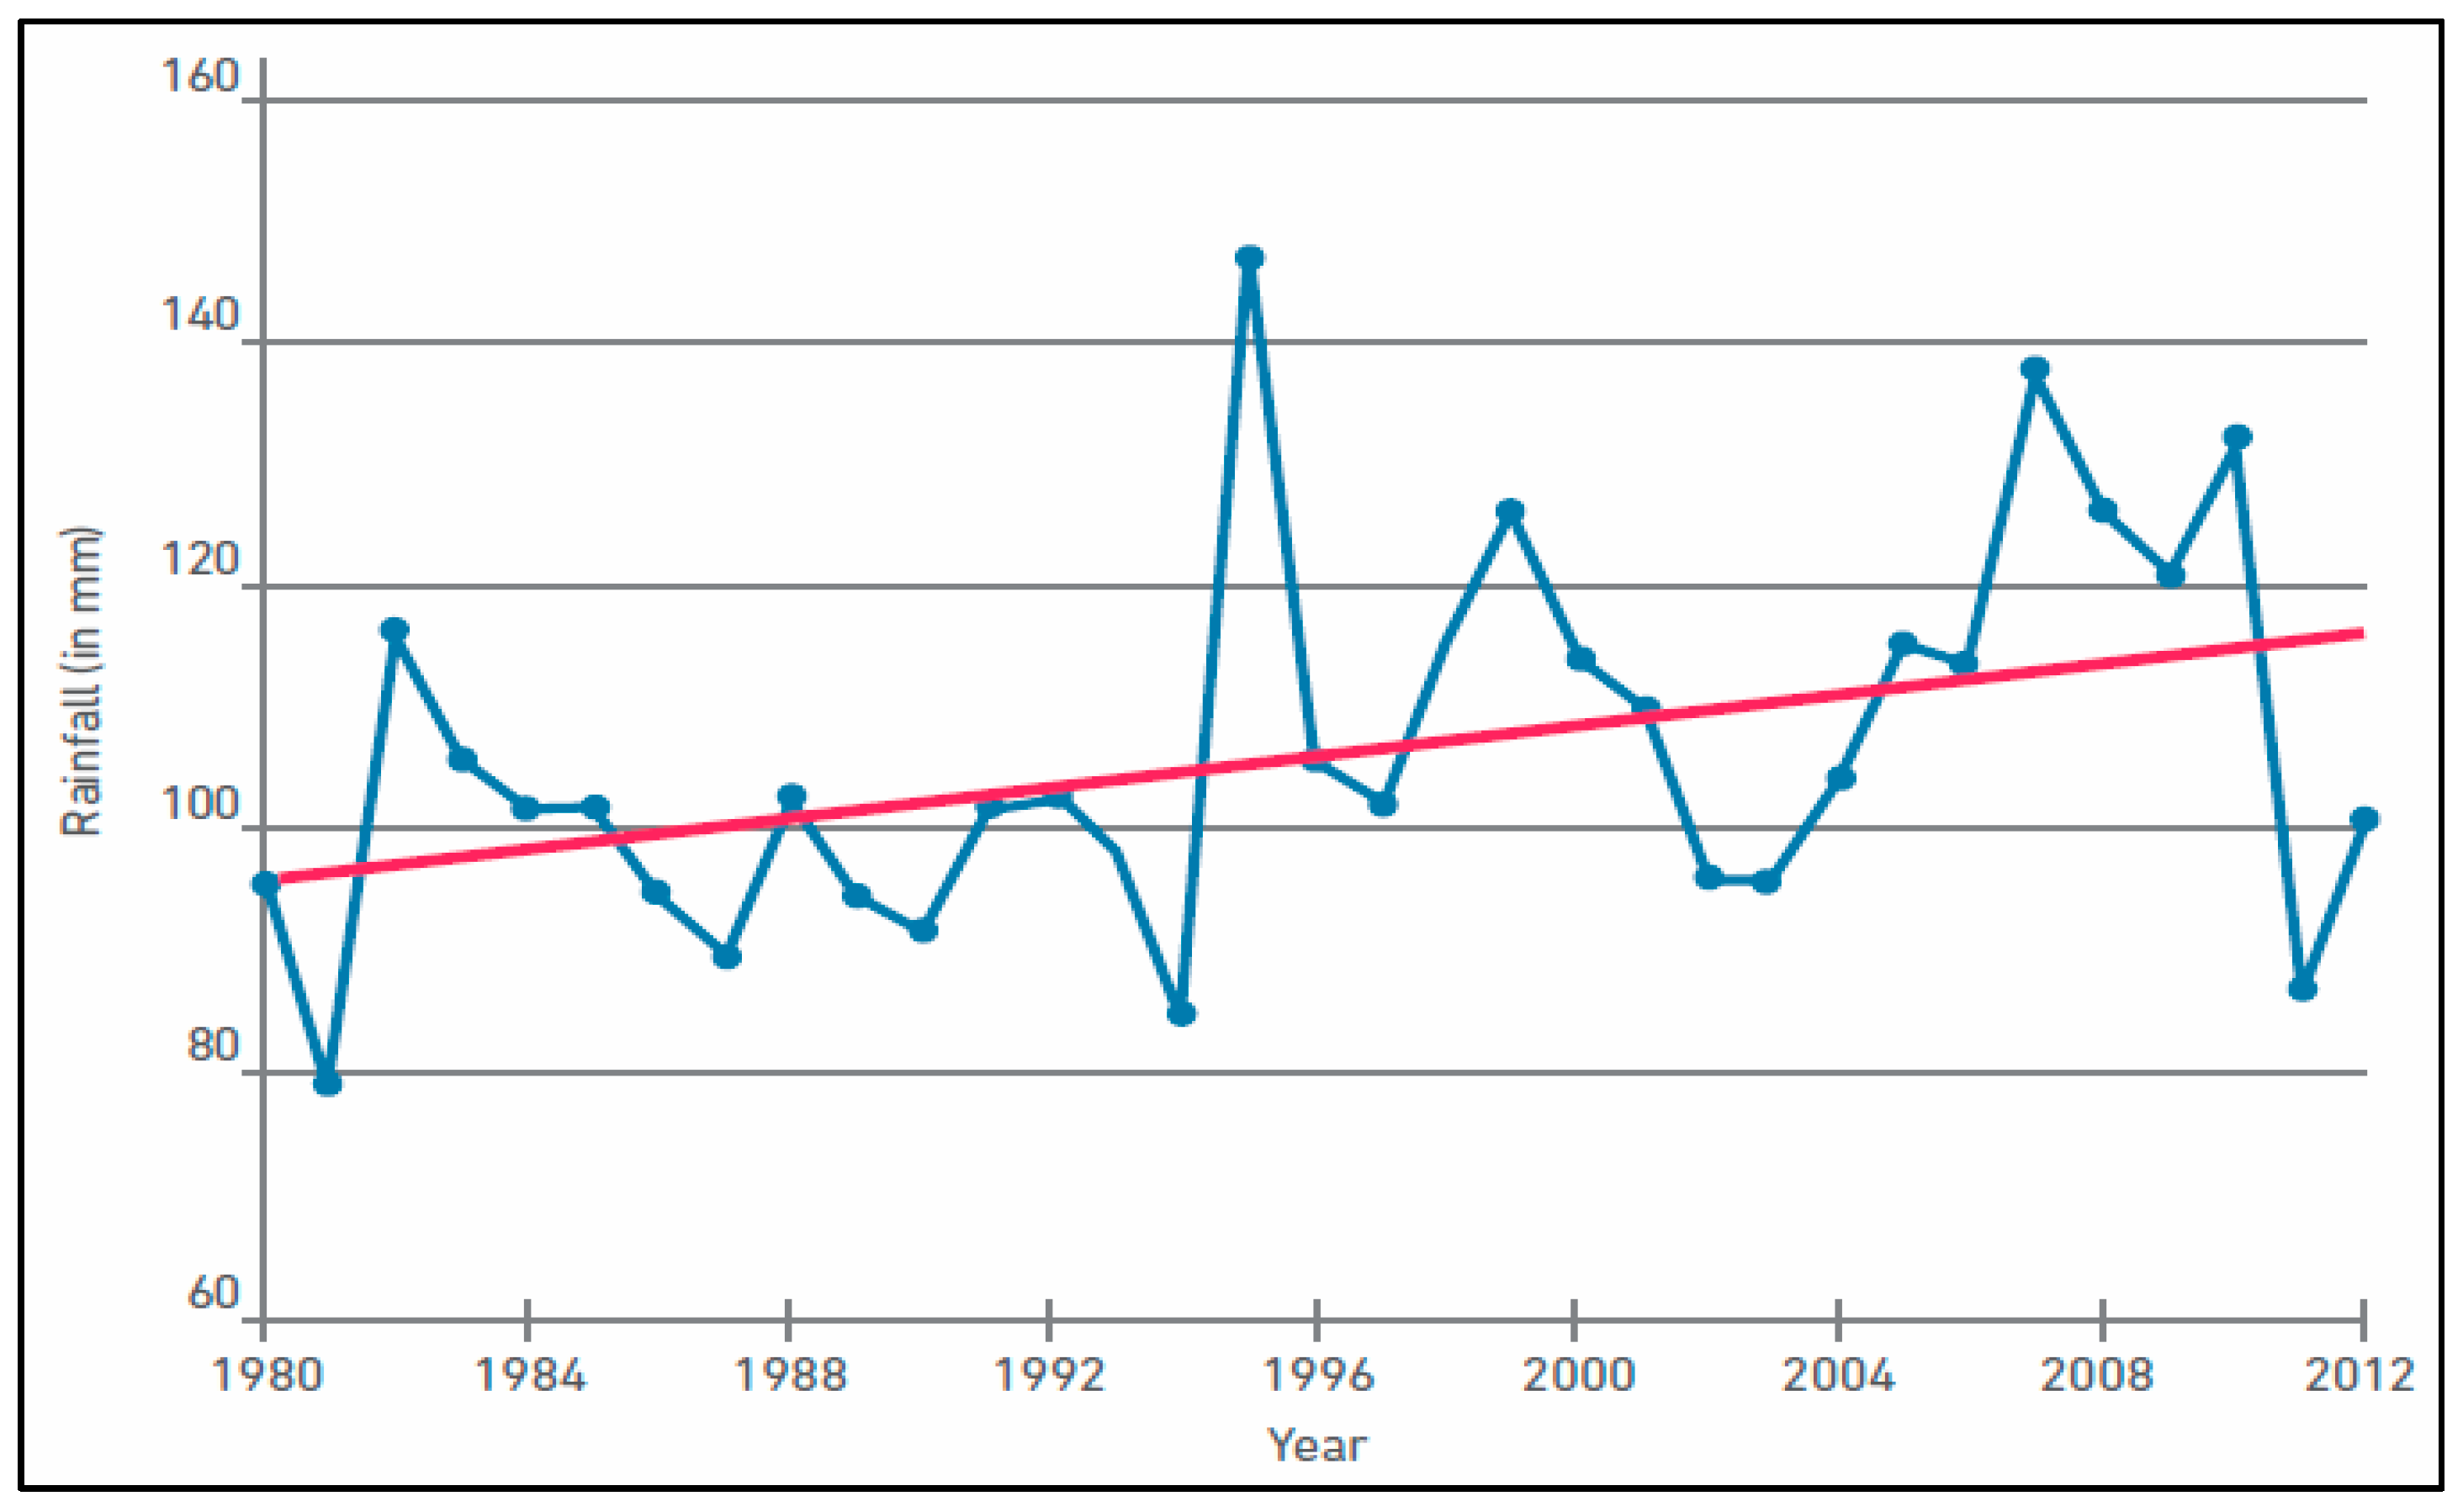
Cities are being exposed to the threat of increasing flood risk due to climate-change-induced sea level rise and the increased frequency of extreme rain events, as well as increased urbanisation resulting in more impervious areas and runoff [1]. This is especially true of Singapore, a tropical island that has undergone rapid urbanisation over the past few decades despite its land constraints; the city state has an area of about 719 km2, is the third most densely populated country in the world, and has an urban population of 100% [2,3]. The historical rainfall data from 1980 to 2012 also indicate a trend of higher rainfall intensities (Figure 1). The conventional approach of building wider and deeper drains to quickly collect and channel rainwater runoff away from the urban catchments has been accepted to be no longer adequate or sustainable to cope with the challenge of climate change, limited land and increasing urbanisation in Singapore. There was a paradigm shift on storm water management in 2006 when PUB Singapore’s national water agency, launched the Active, Beautiful, Clean Waters (ABC Waters) Programme [4]. The ABC Waters Programme is an initiative to transform Singapore’s drains, canals and reservoirs beyond their traditional functions of drainage, flood control and water supply storage into beautiful streams, rivers and lakes that are well integrated with the surrounding landscapes. The programme is part of PUB’s strategic objective to bring Singaporeans closer to water so that they can better appreciate and cherish this precious resource, and in turn keep the waters of Singapore clean and free of litter.
Under the programme, storm water runoff is proposed to be managed in a more sustainable manner via the implementation of ABC Waters design features, natural systems consisting of plants and soil that are able to detain and treat rainwater runoff before discharging the cleansed runoff into the downstream drainage system [4]. There are various types of ABC Waters design features including the bioretention basins or rain gardens, bioretention swales, vegetated swales, constructed wetlands (whose types consist of surface flow, floating and subsurface) and sedimentation basins. While ABC Waters design features are similar to Sustainable urban Drainage Systems (SuDS), Water sensitive Urban Design (WSUD), Low Impact Development (LID) and Green Infrastructure (GI) that are prevalent in other countries [5], ABC Waters design features generally have a stronger focus on the cleansing function and represent a subset of the features represented by the other terms; there are features such as green roofs, detention tanks and pervious pavement which are not considered as ABC Waters design features but are part of the features under SuDS/WSUD/LID/GI.
The Source-Pathway-Receptor approach in drainage management is also advocated in Singapore and ABC Waters design features are recommended as one of the source control measures to manage storm water runoff [6]. A runoff control legislation, imposed from 2014 onwards via an addendum to the Code of Practice (COP) on Surface Water Drainage, requires “industrial, commercial, institutional and residential developments greater than or equal to 0.2 ha in size” to “control the peak runoff discharged from the development sites” [7]. It is stated that “the maximum allowable peak runoff to be discharged to the public drains will be calculated based on a runoff coefficient of 0.55, and for design storms with a return period of 10 years and for various storm durations of up to 4 h (inclusive)”. In addition to detention tanks, ABC Waters design features are also among the measures recommended in the COP on Surface Water Drainage to achieve the peak runoff reduction [7].
Although it is generally accepted that ABC Waters design features are able to detain runoff and help to reduce peak flow, their effectiveness in doing so has not been studied or documented locally in Singapore. Modelling of the runoff control performance of ABC Waters design features is almost non-existent in Singapore and while modelling is carried out, they are done to assess the performance of the features in terms of water quality improvement [8]. This could be inherently due to the fact that ABC Waters design features are not widely used for runoff control in Singapore at the time of writing, as the general perception is that ABC Waters design features are not effective enough to lower peak flow to the standards (C = 0.55) stipulated by the runoff control legislation in Singapore. Instead, the features are normally implemented in Singapore for improving water quality and other ecosystem services such as providing social and recreational spaces for the public or residents in a development [4]. This research thus aims to address the gap of a lack of study on the effectiveness of ABC Waters design features for runoff quantity control in Singapore by performing such a study, and to do so via a demonstration on the use of modelling and optimisation tools for such an assessment.
There are modelling as well as field monitoring studies on the effectiveness of SuDS/LID/WSUD/GI in reducing peak flow within temperate catchments internationally [9,10,11,12,13,14,15,16,17,18]. However, the studies on SuDS application in tropical climates are limited. Taking the example of bioretention systems (i.e., vegetated land depressions that are designed to detain and treat storm water runoff via sedimentation, filtration and biological uptake [4], which is a type of ABC Waters design feature), they have been reported to be able to achieve runoff peak flow reduction in the range of 24–99% in the United States of America (USA) [15,17,19,20,21] and 80–90% in Australia [22,23] based on field monitoring studies. The peak flow reductions depend on the ratio of catchment area to bioretention area, the drainage configuration and the rainfall magnitude, with smaller peak flow reductions being achieved for higher rainfall intensities as well as increased rainfall depths and longer rainfall durations [16,17,18,21]. Hence there is a need for region specific study due to the large variations in the peak flow reduction effectiveness of the bioretention systems [20].
This research directly addresses the gap of lack of study on the peak flow reduction performance of ABC Waters design features/SuDS/LID/WSUD/GI in the tropical climate setting. In addition, the research aims to identify key design elements that could help to enhance the effectiveness of ABC Waters design features in reducing peak flow. Performance enhancement of the features will also be studied via optimisation.
The relevance of the study results will not be limited to Singapore as the study results will also provide inputs towards bioretention design and practice in many other countries with similar tropical climates, such as countries in South East Asia, Sri Lanka, Uganda, Honduras, El Salvador etc. It is hoped that the study results would help to guide the design and implementation of SuDS/LID/WSUD/GI in the other countries with tropical climates.
2. Details of the Site and ABC Waters Design Features
2.1. The Study Site
The research was based on a newly constructed four hectare pilot project named Waterway Ridges, which is a joint collaboration between PUB and the Housing Development Board of Singapore. The construction of this pioneer precinct began in April 2012 and was completed in April 2017. This public residential development contains four different types of ABC Waters design features that are integrated in the design at precinct level, namely bioretention basins/rain gardens, bioretention lawns, vegetated swales and vegetated swales with gravel layer (termed as “gravel swales” in the rest of this paper). Such integrated application has been adopted at precinct level in Singapore for the first time. The ABC Waters design features are also installed with the aim of substantial peak flow reduction, which is another first in Singapore.
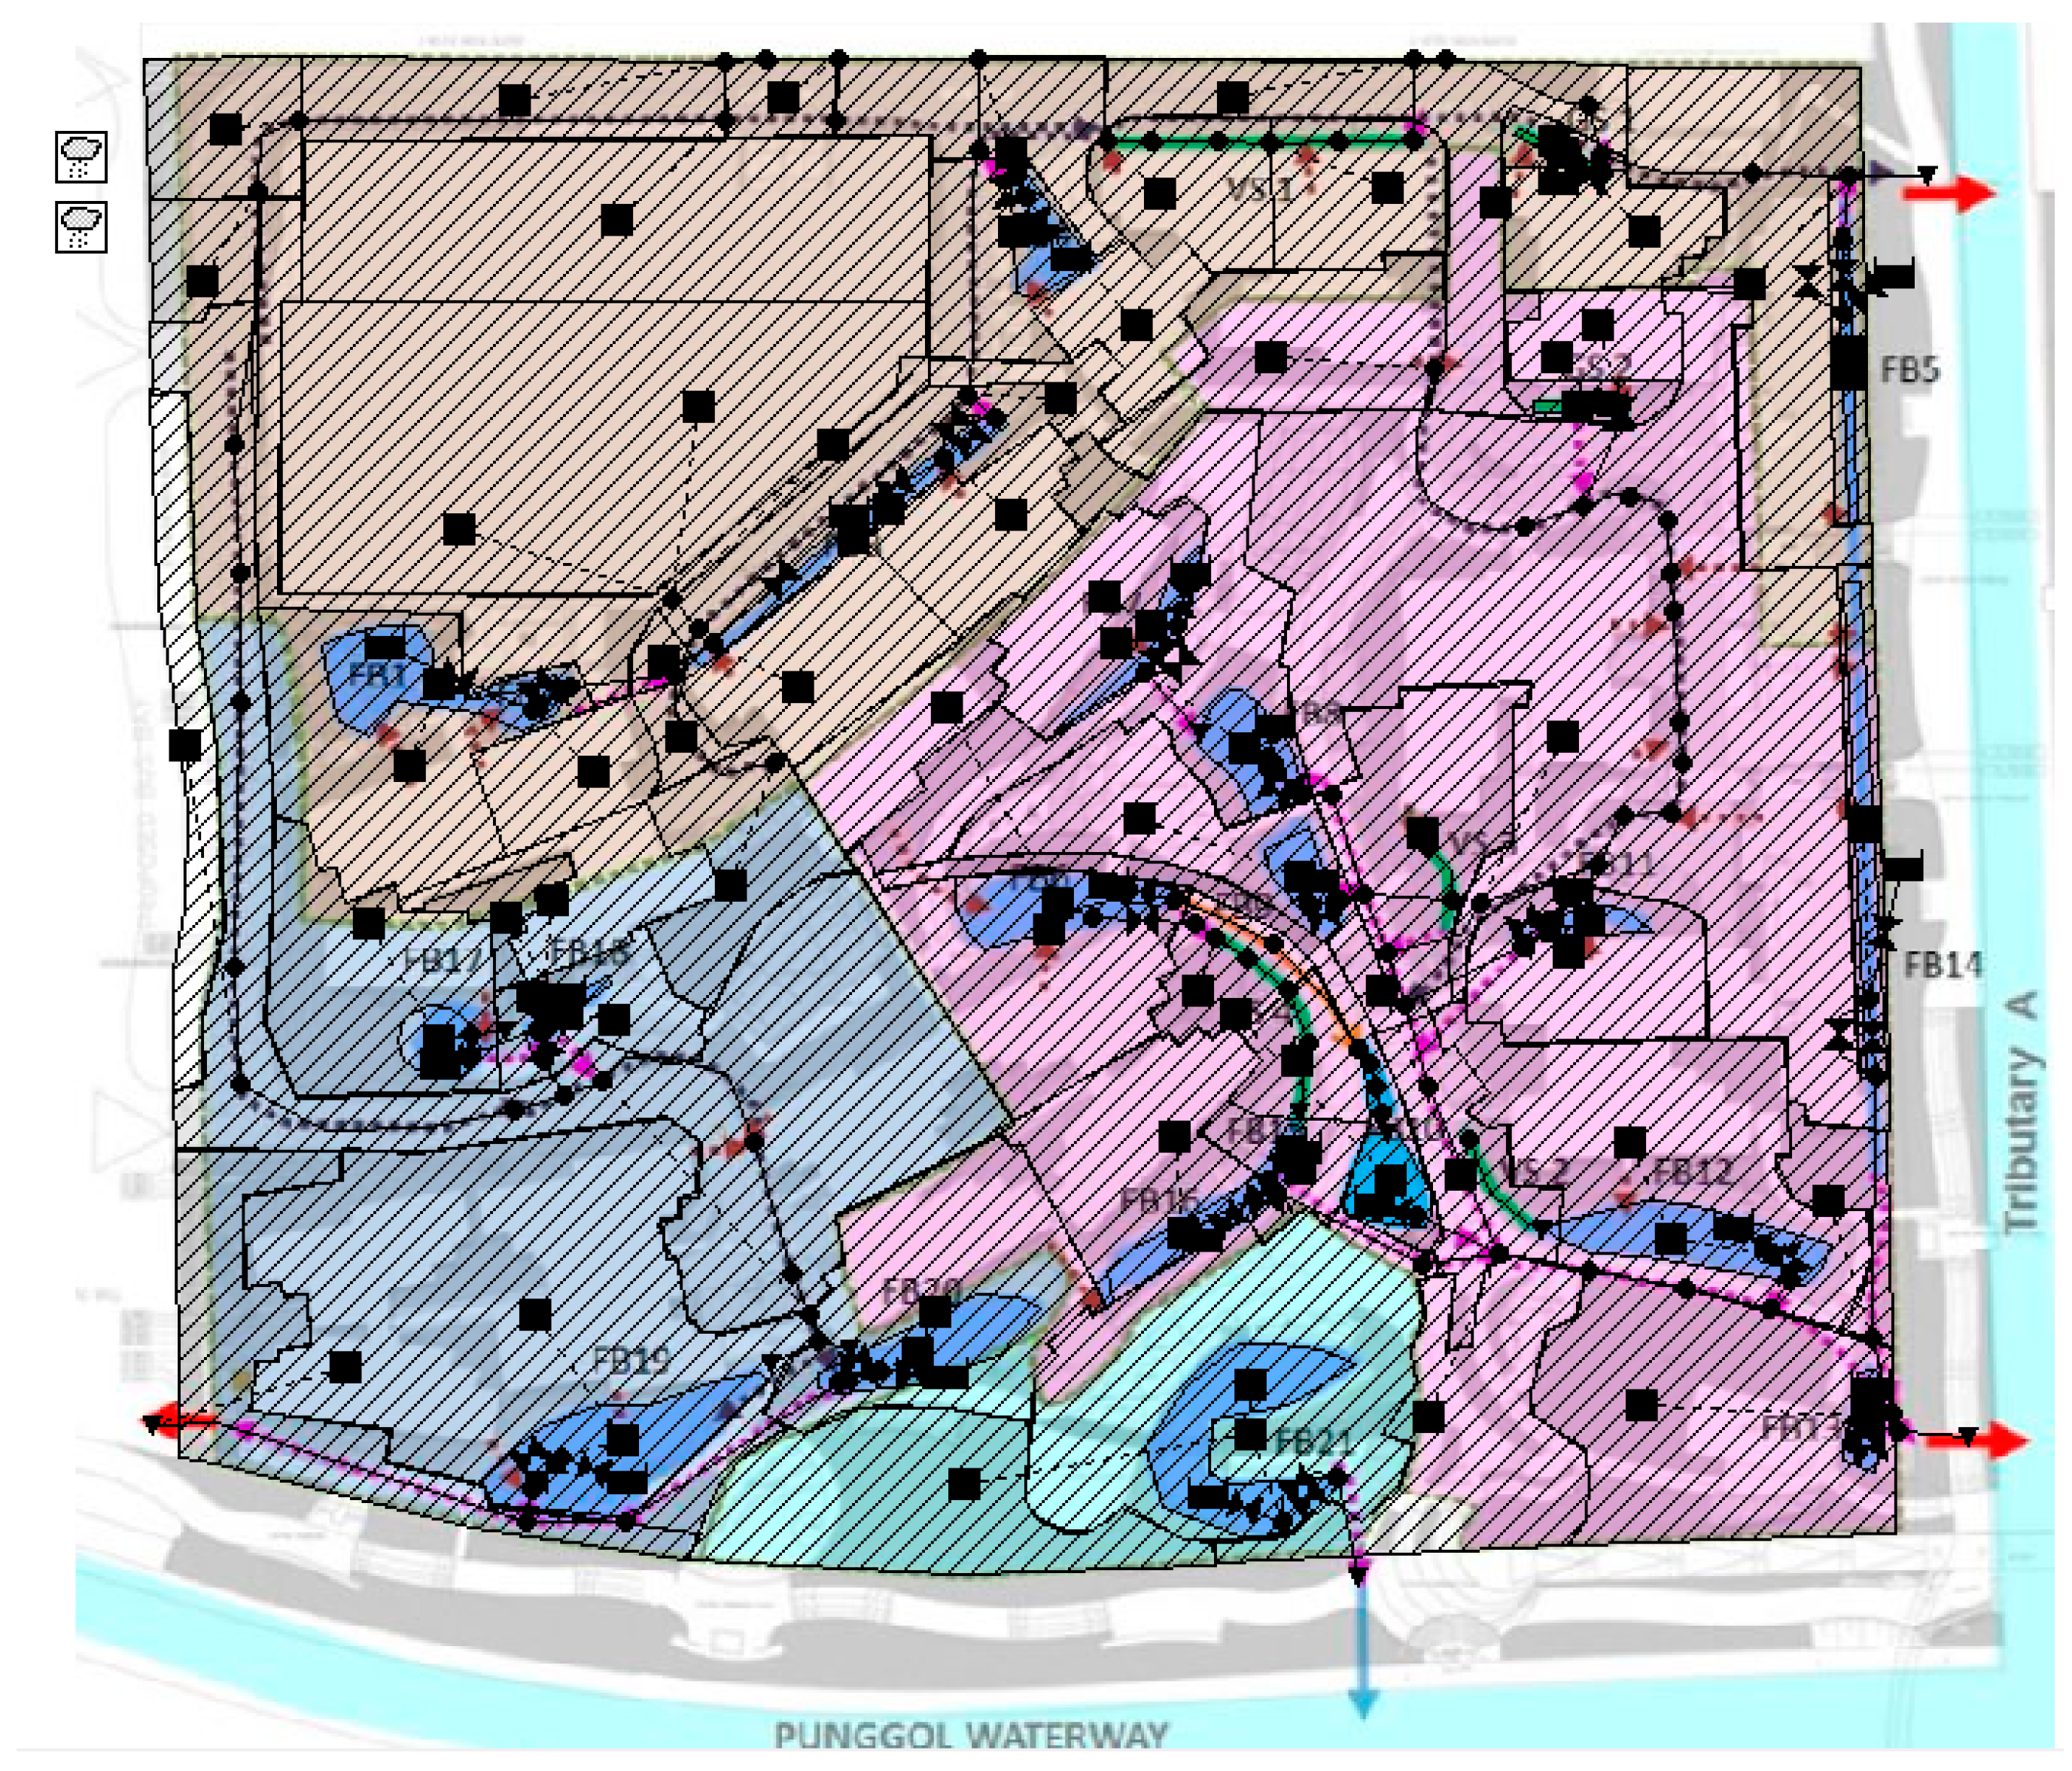
The ABC Waters design features at the site have been innovatively designed to reduce the peak flow of the precinct to correspond to a reduced runoff coefficient of 0.55 for all storm events up to the 10-year return period. The innovative design, which is implemented for the very first time in Singapore, comprises 400–750 mm thick detention gravel storage layers which are incorporated below the rain gardens and gravel swales, and orifice outlets that restrict the outflow from the features. Normally dry, the network of ABC Waters design features (Figure 2) receives runoff from about 60% of the total site area during a rain event [24].
The climate in Singapore is characterised as tropical and coastal. The country experiences high and uniform temperatures (the minimum and maximum temperatures are 23–25 °C and 31–33 °C during the night and day, respectively), high humidity (the mean annual relative humidity is 83.9%), and abundant rainfall throughout the year. The average annual rainfall is 2328.7 mm (based on long-term records from 1869 to 2016) and it rains 178 days a year on average [25]. There are two monsoon seasons in the country, namely the Northeast Monsoon occurring from December to early March, and the Southwest Monsoon from June to September. Though there are no distinct wet or dry seasons in Singapore, there is a monthly variation of rainfall in Singapore. Generally, there is increased rainfall from November to January during the Northeast Monsoon season. On average, the wettest and driest months are December (318.6 mm) and February (112.8 mm), respectively [26].
2.2. Design of ABC Waters Design Features at the Study Site
Four different types of ABC Waters design features are implemented at the precinct. There are 21 rain gardens (with codes FB1 to FB21), four vegetated swales (with codes VS1 to VS4) and two gravel swales (with codes GS1 to GS2) in the precinct.
2.2.1. Bioretention Basins/Rain Gardens
Rain gardens or bioretention basins are vegetated land depressions that are designed to detain and treat storm water runoff via sedimentation, filtration and biological uptake [4]. A typical cross section of the rain gardens implemented at Waterway Ridges is shown in Figure 3; various elements of the design are indicated by the numbers (1) to (5), and will be referred to in the rest of this paragraph. During a rain event, runoff from the subcatchment would flow into the rain garden and be allowed to pond up to a maximum depth of 200 mm on the surface. Concurrently, the runoff percolates through the filter media and is eventually collected by the subsoil perforated pipes (5). Excess runoff greater than the 200 mm surface detention depth will overflow into the overflow manhole (1) and be directed into the underground gravel layer for detention and storage via the subsoil perforated pipes (5). Meanwhile, the amount of flow leaving the feature and entering the discharge pipe (4) will be regulated through the orifice outlet (3), the opening size of which was predetermined through calculations to correspond to C = 0.55 for the 10-year design storm. When the underground gravel layer is full, the water level in the manhole will rise to the overflow standpipe opening (2) and be discharged via the discharge pipe (4) that connects to the roadside drains within the precinct.
Unlike the typical rain gardens with drainage layers that are 200–250 mm thick, the rain gardens implemented at Waterway Ridges have a much thicker gravel layer ranging from 400–750 mm, and the orifice outlets are not part of the design of typical rain gardens. The overflow manhole is also fitted with gratings and a “filter basket” to minimise debris from flowing into and choking the gravel storage layers. Literature review suggests that such a design is new not only in Singapore but also internationally. Among the designs found, one that is most similar to the rain gardens at Waterway Ridges is the “Cap-orifice Flow regulator” design [27]. In this design, a cap-orifice is proposed to be installed at the exit of the subsoil perforated pipe for the purpose of regulating the infiltration rate as well as the outflow from the rain garden [27]. However, such a design would not be effective in reducing peak flows in tropical climates with extreme rainfall like Singapore, where a large portion of the subcatchment generated runoff (from storm events greater than the 3-month return period) would overflow into the overflow manholes instead of infiltrating through the filter media of the rain gardens.
2.2.2. Bioretention Lawns
Bioretention lawns have the same design as rain gardens, but have lawns extensively as their planting as compared to shrubs in the rain gardens (Figure 4). When it is not raining, the bioretention lawns serve as recreational spaces for the residents of Waterway Ridges.
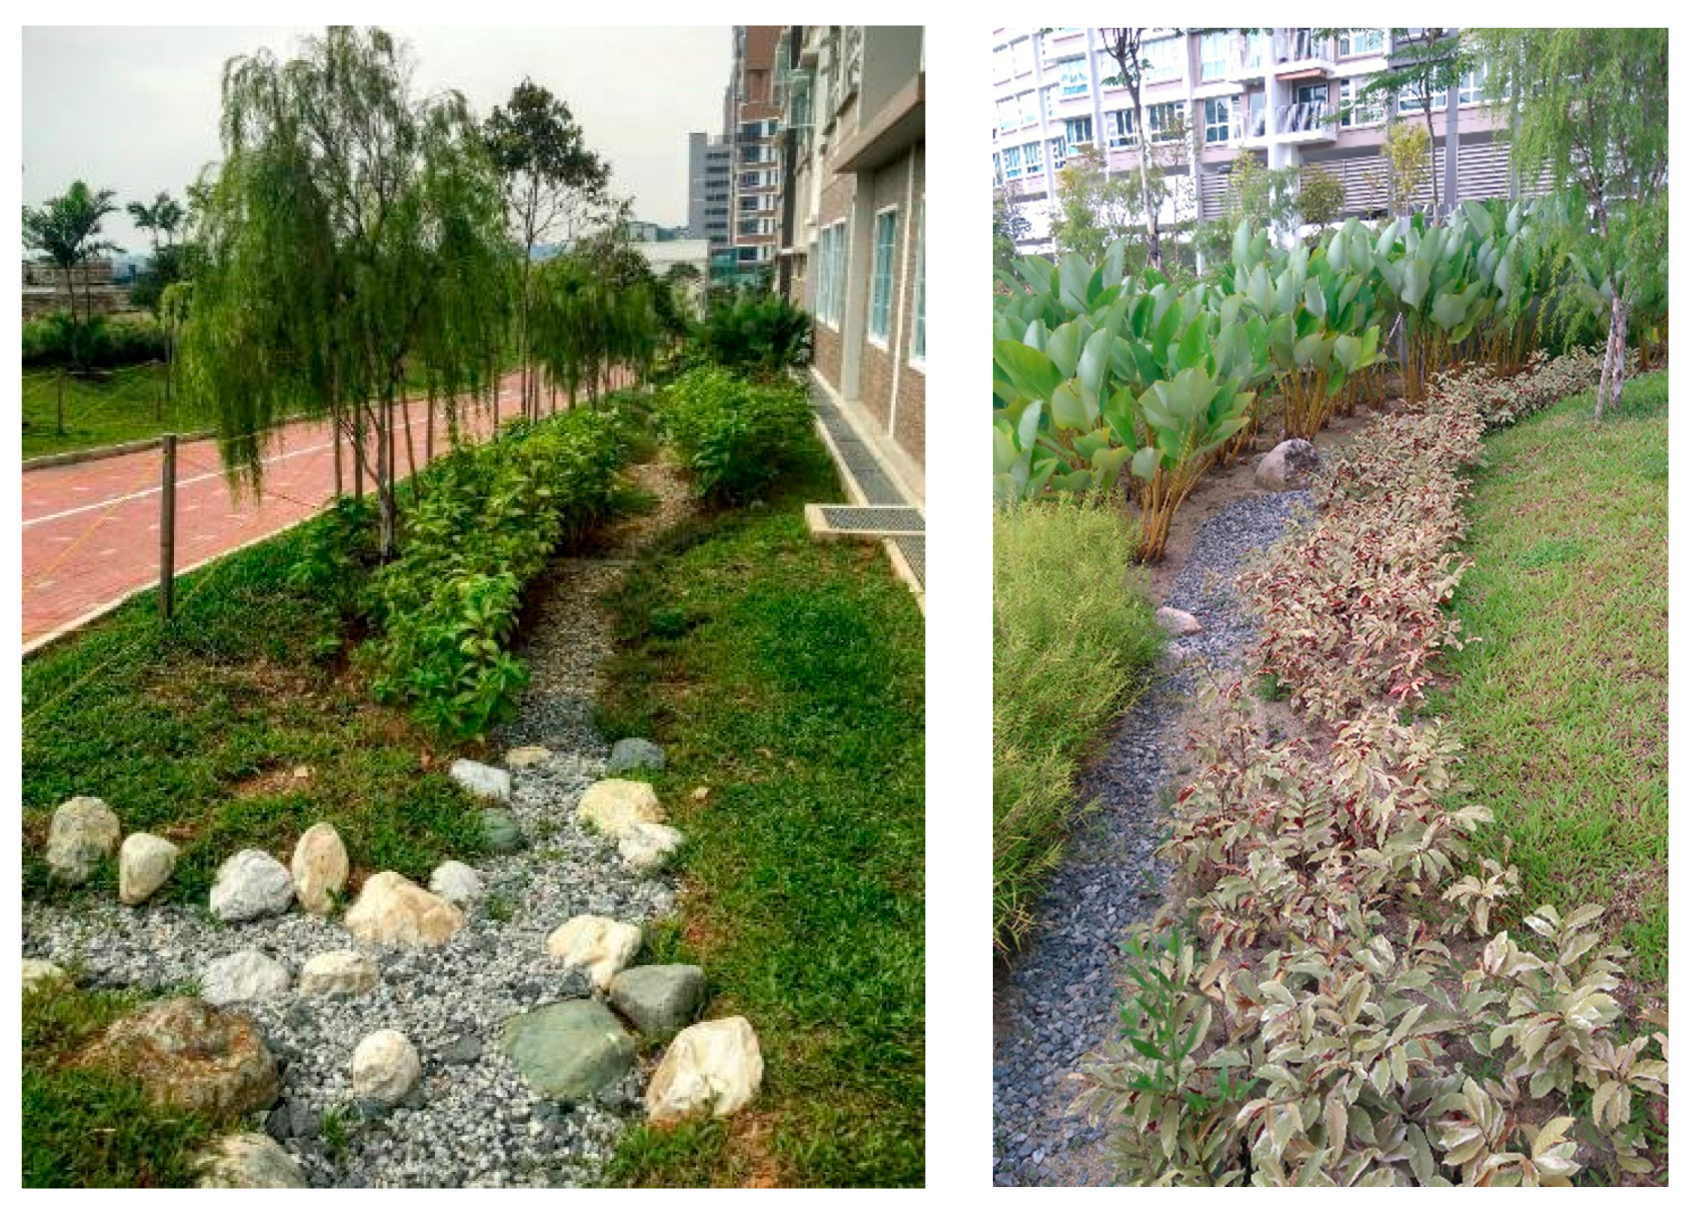
2.2.3. Vegetated Swales
Vegetated swales are essentially earth drains that convey runoff. In Waterway Ridges, they are gravel lined and vegetated with short grass (Figure 5). Due to their increased roughness, the flow of runoff is slower in the swales as compared to concrete-lined drains. The slower runoff velocities help promote sedimentation, thus resulting in cleaner runoff.
2.2.4. Gravel Swales
A typical cross section of the gravel swales implemented at Waterway Ridges is shown in Figure 6; various elements of the design are indicated by the numbers (1) to (4), and will be referred to in the rest of this paragraph. Gravel swales are essentially vegetated swales (1) that are coupled with underground gravel storage layers (2). Runoff flowing through gravel swales would be channelled directly into the gravel layers via the overflow manholes (3) and subsoil perforated pipes (4). The components in the overflow manholes of gravel swales are the same as that of the rain gardens. Similarly to the rain gardens, flow leaving the gravel swales will be regulated through an orifice outlet located within the overflow manhole.
2.3. Monitoring of the Study Site
There are plans for water quality and quantity monitoring to be carried out at the precinct. The plan includes flow monitoring at each of the four precinct discharge outlets as well as at the inlets and outlets of four specific ABC Waters design features (one for each type) to determine the flows entering and leaving each feature type.
At the time of publishing however, the monitoring has yet to commence and as such, the results presented in this manuscript will be based on uncalibrated models. It is acknowledged that the results presented will be preliminary and that model calibration will need to be performed to yield validated results. Nevertheless, the results do provide an indication on the peak flow reduction effectiveness of the ABC Waters design features (and innovative design adopted for the features) at the precinct, and in a tropical climate setting.
3. Research Methodology
The general workflow that was adopted for the research is as shown in Figure 7. More details on the specific research activities that were carried out for each task are as outlined in the following sub-sections.
3.1. Data Collection
Prior to setting up the model for the precinct and its suite of ABC Waters design features, design data and general information regarding the precinct and the features were collected. As the final as-built drawings of the precinct and features were not available during the duration of the research, the latest set of construction drawings as obtained from PUB were used for developing the model. Additional information such as rainfall intensity-duration-frequency (IDF) curves and historical rainfall data were also obtained for assessment of the model performance.
3.2. Model Selection
The Storm Water Management Model version 5.1.010 (SWMM v5.1), an open source and freely downloadable hydraulic model, with LID controls developed by the U.S. Environmental Protection Agency (USEPA) was selected and used for the 1D hydrodynamic model study [28]. For Waterway Ridges, backwater effect and reverse flow can occur within the perforated pipes (connecting the gravel storage to the overflow manhole) and orifice outlets of the rain gardens and gravel swales, thus necessitating the use of dynamic-wave hydraulic routing. Due to the small size of the subcatchment and ABC Waters design features (the smallest subcatchment and ABC Waters design feature have areas of 34 m2 and 18 m2, respectively, while the average areas for the subcatchments and ABC Waters design features are 632 m2 and 80 m2, respectively), sub-hourly time steps in the order of minutes and seconds would also apply for the variation of runoff and associated detention processes in the precinct. These requirements are met by the SWMM model used.
3.3. Preliminary Analysis, Sensitivity Analysis and Model Parameters
Prior to setting up the model for the precinct, preliminary assessment was carried out to determine the best ways to represent the various ABC Waters features in Waterway Ridges. Based on the SWMM Applications Manual [29] as reference, different ways of modelling the subcatchments and features were tested, and the outflow results from the features were compared and analysed. Sensitivity analysis was also performed to determine the sensitivity of runoff from the subcatchments to the various catchment parameters [7,29]. Figure 8 shows a screenshot of the completed 1D SWMM model for the precinct.
3.4. Hydraulic Routing Model and Time Steps
The dynamic-wave flow routing was necessary as backwater effects and reverse flow would take place within the perforated pipes and orifice outlets of the rain gardens and gravel swales. Time step recommendations as listed in the SWMM Applications Manual [29] were adhered to, and model stability was also verified for the time steps used. The time steps for dry weather flow, wet weather flow and routing were set at 1 h, 1 min, and 10 s, respectively. Typically, the wet weather time step and flow routing time step should not exceed the precipitation recording interval and wet weather time step, respectively [29]. The flow routing time step used is less than 30 s due to the dynamic-wave flow routing that is employed in the model, and was adjusted until the stability of the model was satisfactory.
3.5. Scenarios
In addition to the base scenario of the precinct model (i.e., base precinct model with its suite of ABC Waters design features that are coupled with gravel storage and orifice outlets), additional scenarios as summarised in Table 1 were also modelled and analysed. The rationale for modelling the various scenarios is also elaborated in the table.
3.6. Assessments
3.6.1. Peak Flow Reduction and Compliance with Peak Flow Reduction Objectives
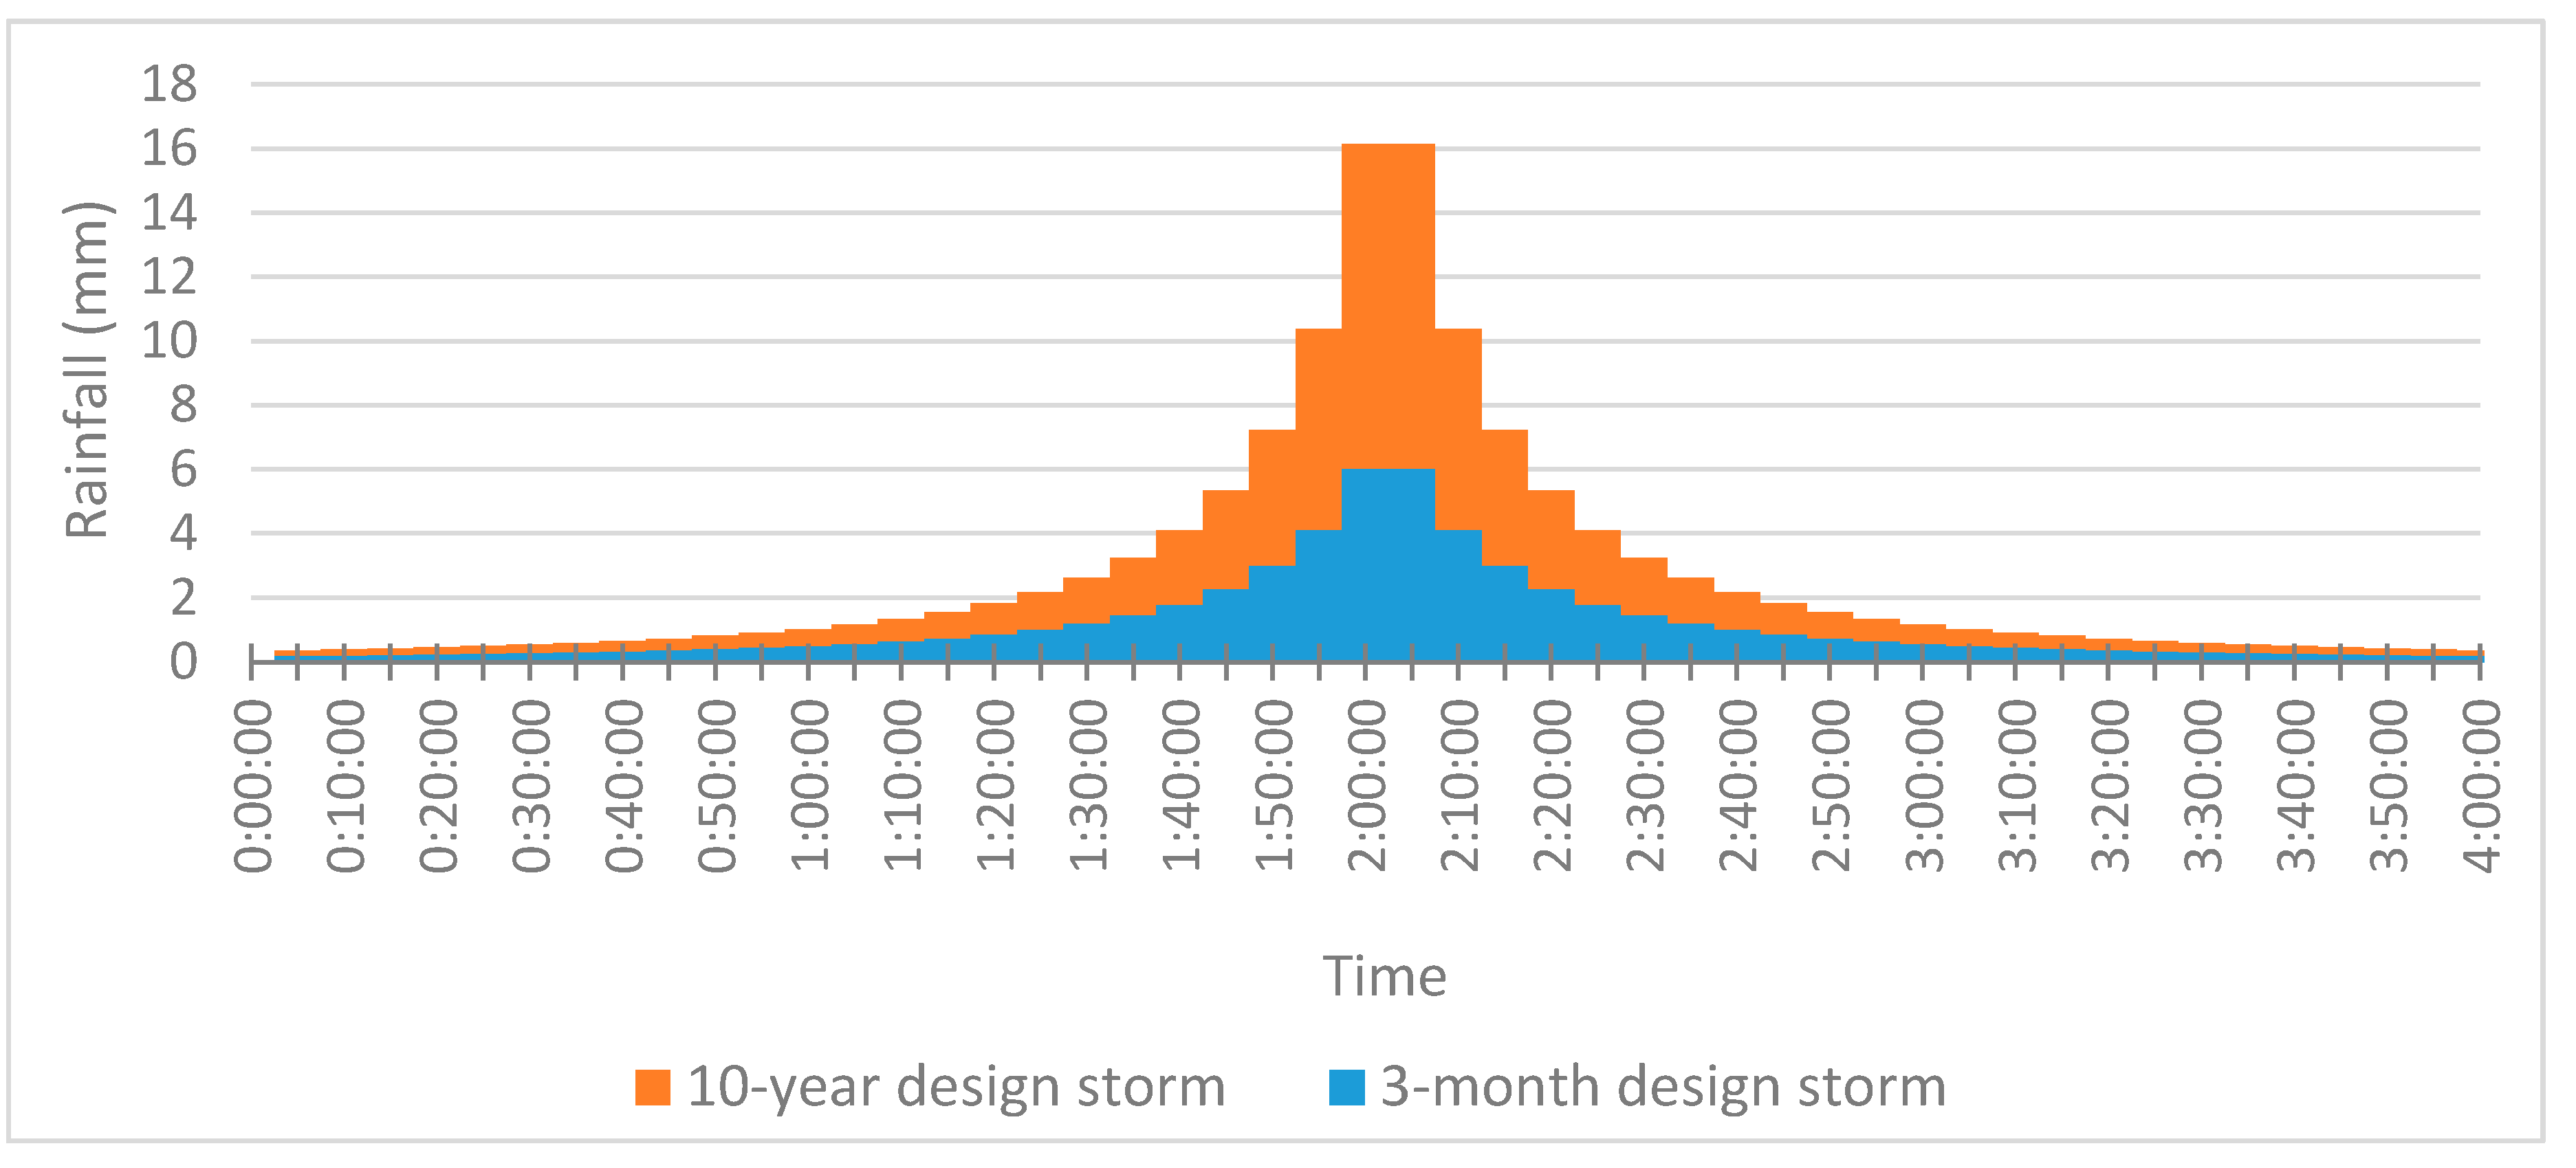
Symmetrical 4 h 10-year and 3-month design rainfall hyetographs in 5-min intervals (Figure 9) derived from Singapore’s rainfall IDF curves were routed through each of the models for the respective scenarios. The peak flow from the precinct for each of the scenarios were compared and the corresponding runoff coefficients or C-values were back-calculated using Rational Formula (Equation (1)) [30]. Specifically for the base precinct model, the C-value was compared against the design objective of having an effective runoff coefficient of 0.55. As there are four discharge outlets from the precinct, the peak flow from the precinct was obtained by taking the maximum of the sum of the time series flow results from each of the outlets.
where
- Qr = peak runoff (m3/s)
- C = runoff coefficient (dimensionless)
- I = average rainfall intensity (mm/h)
- A = catchment area (ha).
3.6.2. Effectiveness of Various ABC Waters Design Feature Types in Reducing Peak Flow
The maximum flows entering and leaving each feature were obtained from the base precinct model for the 10-year design storm, and the corresponding peak flow reductions were calculated using Equation (2). Averages of the peak flow reductions for the various design feature types were then compared to determine if any of the feature types are more effective in reducing peak flow as compared to others.
However, it was also noted that the peak flow reduction alone would not be a fair comparison across the different features and even within the same type, as the features have different catchment areas and storage volumes. As such, the peak flow reductions were adjusted using the ratio of the storage volume (both surface detention and gravel storage for the rain gardens, and gravel storage alone for the gravel swales which do not have any surface detention) to the effective impervious catchment area of each feature (using Equations (3)–(5), and then normalised (using Equation (6)). Averages of the normalised peak flow reductions for the various feature types were compared to assess their peak flow reduction effectiveness.
4. Results
4.1. Peak Flow Reduction for the 10-Year Design Storm
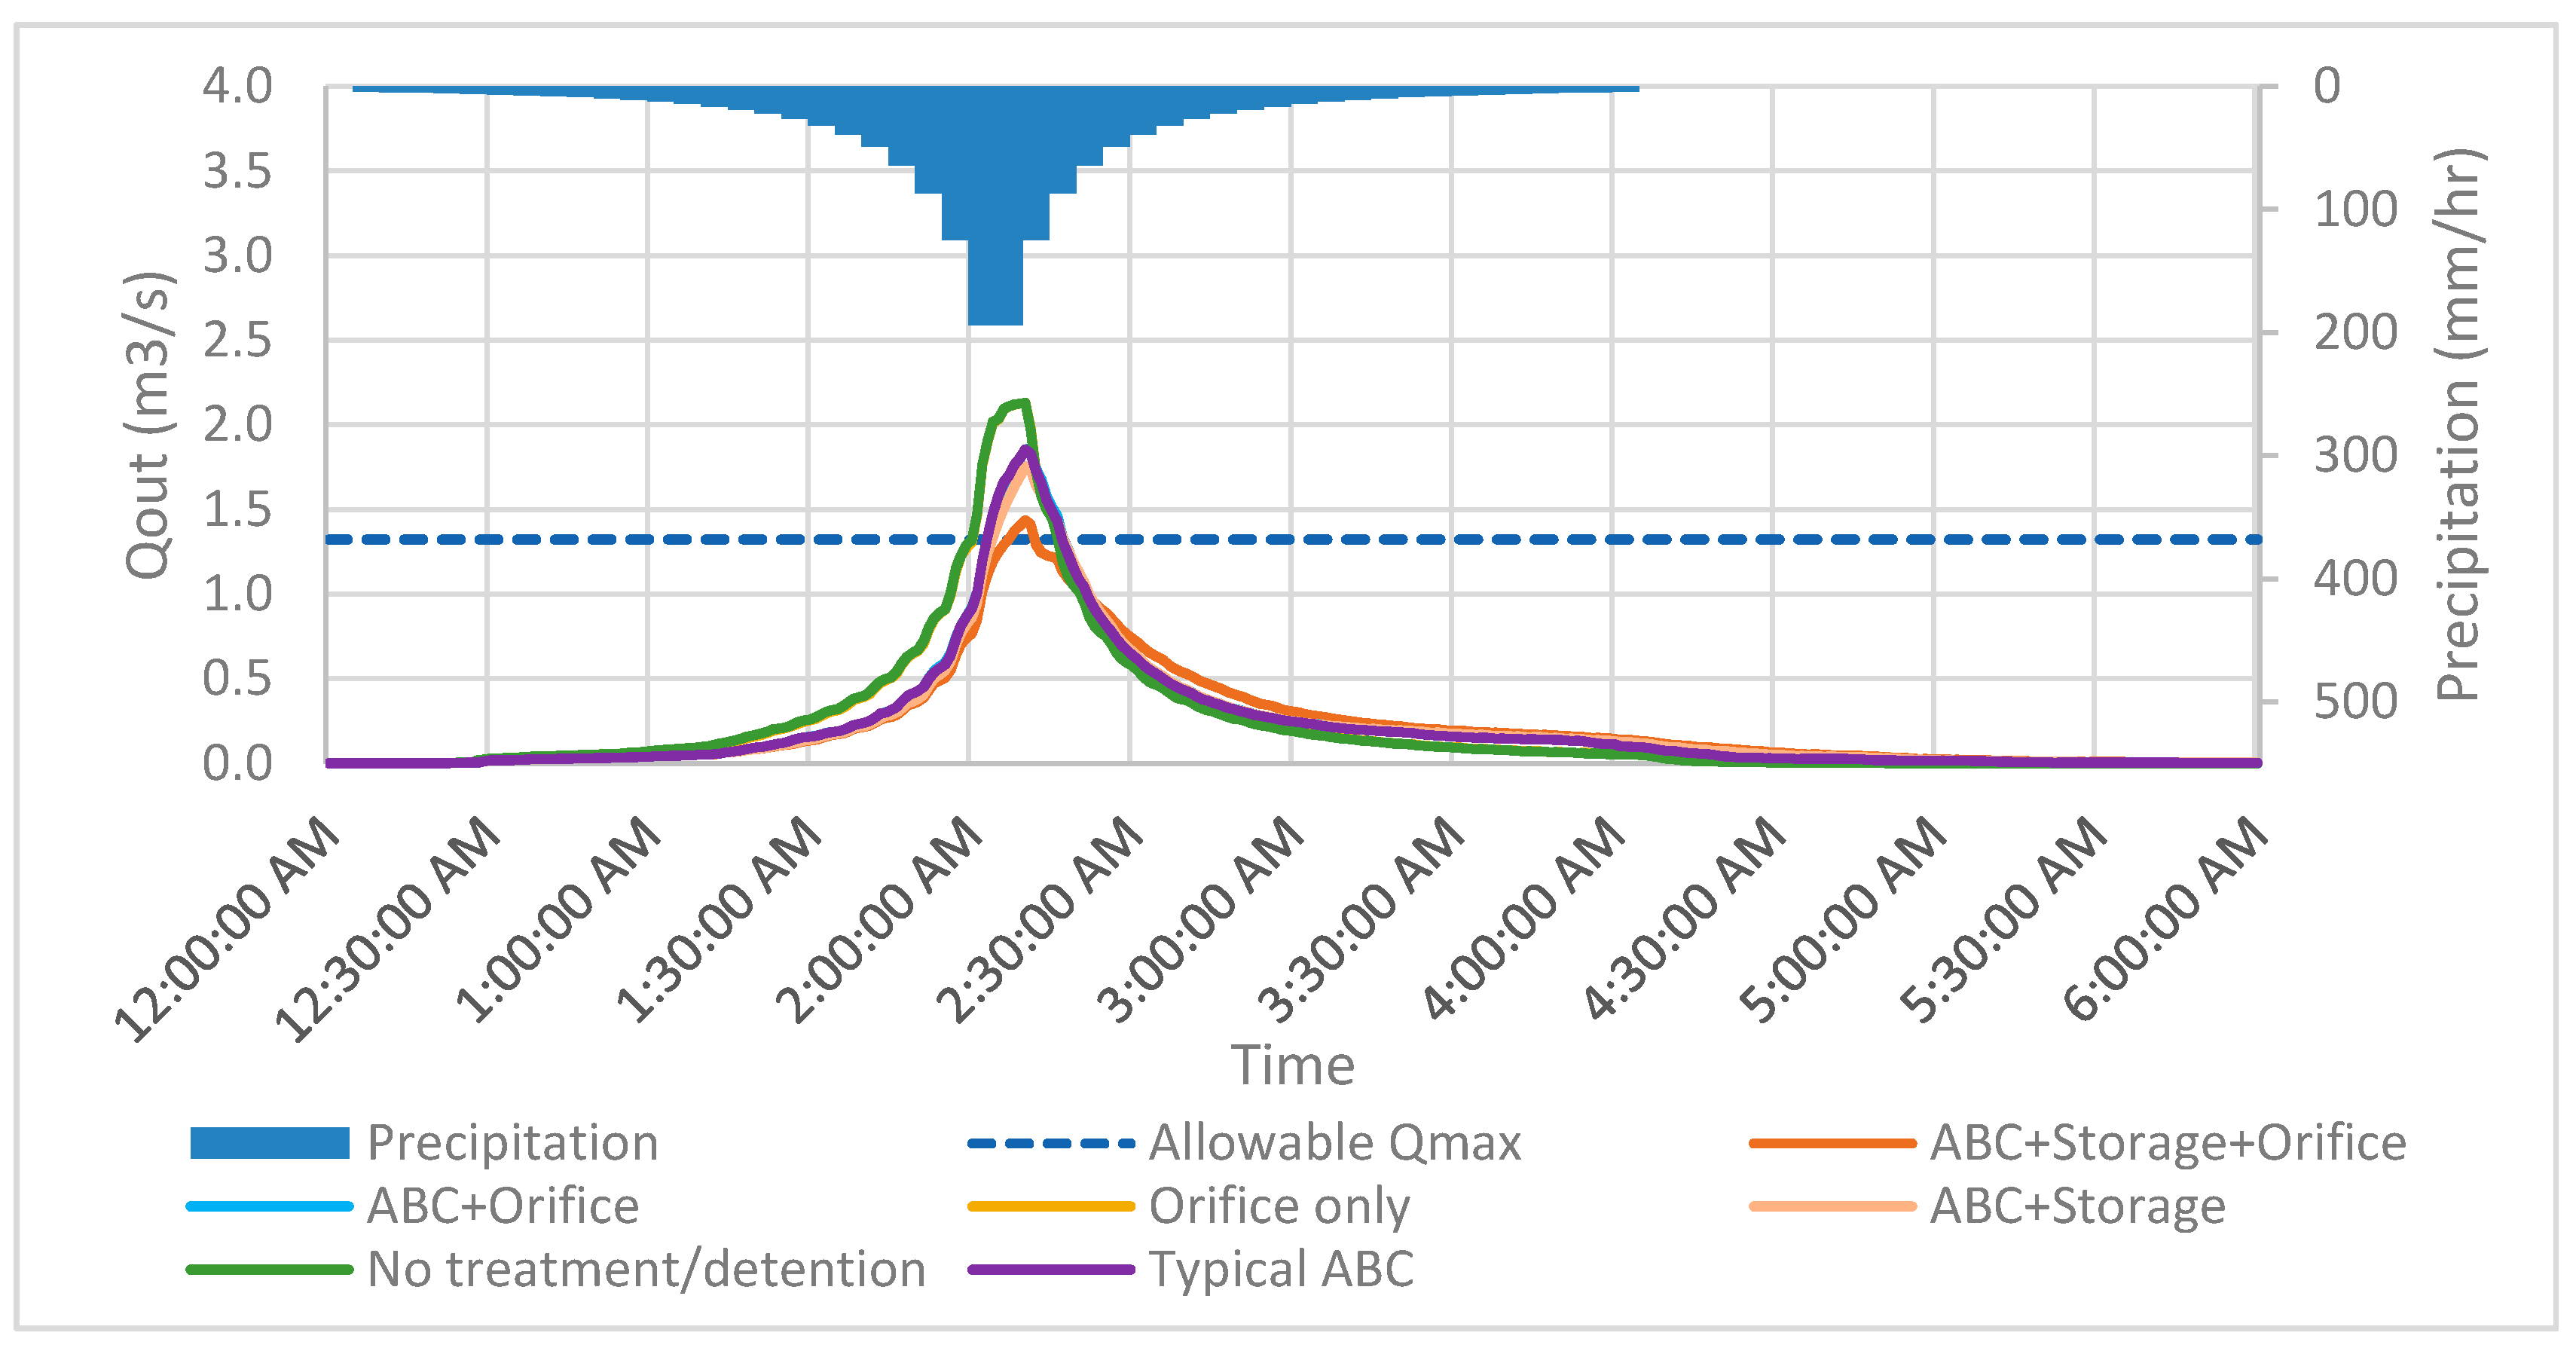
The outflows and effective C-values (of the base precinct and the various alternative scenarios) for the 10-year design storm are as shown in Figure 10 and Table 2, respectively. From the results, we can see that the best C-value of 0.60 with a corresponding reduction of 32.6% in peak runoff (compared to Scenario 1 where there are no detention or treatment present in the precinct) is obtained in Scenario 6, i.e., when the base precinct with ABC Waters features are coupled with gravel storage and orifice outlets. Although the reduced C-value and peak runoff achieved do not meet the runoff control requirements of Singapore’s COP on Surface Water Drainage, the results show that ABC Waters design features are effective in reducing peak runoff when coupled with storage and orifice outlets, and designed appropriately. It is also noted that the peak flow reduction obtained for the base precinct is generally lower as compared to the reductions obtained by the various bioretention systems that have been monitored in the USA [15,17,19,20,21] and Australia [22,23].
Meanwhile, it can be observed that the performance of Scenario 2 (precinct with orifice outlets only) is as poor as that of Scenario 1, indicating that there is no benefit in implementing orifice outlets that are not coupled with storage or any ABC Waters design feature.
While the performance of Scenario 3 (precinct with typical design of ABC Waters features implemented in Singapore) is not as good as that of Scenario 6, it still yielded a C-value of 0.77 and a peak runoff reduction of 13% (as compared to Scenario 1). This observation shows that the typical ABC Waters features implemented in Singapore (i.e., without storage and orifice outlets) could still contribute in helping to reduce peak runoff in a development even though they are not able to meet the runoff control requirements of the COP on Surface Water Drainage and will need to be implemented together with other features.
4.2. Effectiveness of the Various ABC Waters Design Feature Types in Reducing Peak Flow for the 10-Year Design Storm
Table 3 summarises the performance of the various feature types in reducing peak flow. From the results, we can see that the rain garden feature type is most effective in reducing peak flow (with average and normalised reductions of 39% and 47%, respectively), followed by the gravel swales (with average and normalised reductions of 9% and 25%, respectively). This result could be attributed to the presence of the 0.4 m thick filter media and extended surface detention in rain gardens but not the gravel swales. The results also show that the vegetated swales do not offer any reduction in peak flow, which is attributed to the lack of gravel storage or any form of surface detention due to the absence of flow regulators (such as weirs) along the vegetated swales.
However, this does not conclude that vegetated swales should not be implemented. While peak flow reduction is the focus of this study, it is noted that ABC Waters design features including vegetated swales also offer other ecosystem services such as improving runoff water quality, enhancing biodiversity [4] and regulating micro-climate via the urban heat island mitigation effect [32].
4.3. Identification of Key Design Elements
It can be observed from the peak flow reduction results from Section 4.1 that the performance of Scenario 5 (precinct with ABC Waters features and gravel storage but without orifice outlets) with a C-value of 0.73 (and peak runoff reduction of 17.7%) is slightly better than that of Scenario 4 (precinct with ABC Waters features and orifice outlets but without gravel storage) with a C-value of 0.77 (and peak runoff reduction of 12.6%). When the orifice outlets and gravel storage are coupled together however, the performance improves to yield a C-value of 0.60, which is an improvement of 18.2% and 22.9% for Scenarios 5 and 4, respectively. It can be concluded from this observation that the orifice outlets and gravel storage are important components of the ABC Waters features (specifically the rain gardens and gravel swales) that will dictate their performance in reducing peak runoff effectively.
4.4. Peak Flow Reduction for the 3-Month Design Storm
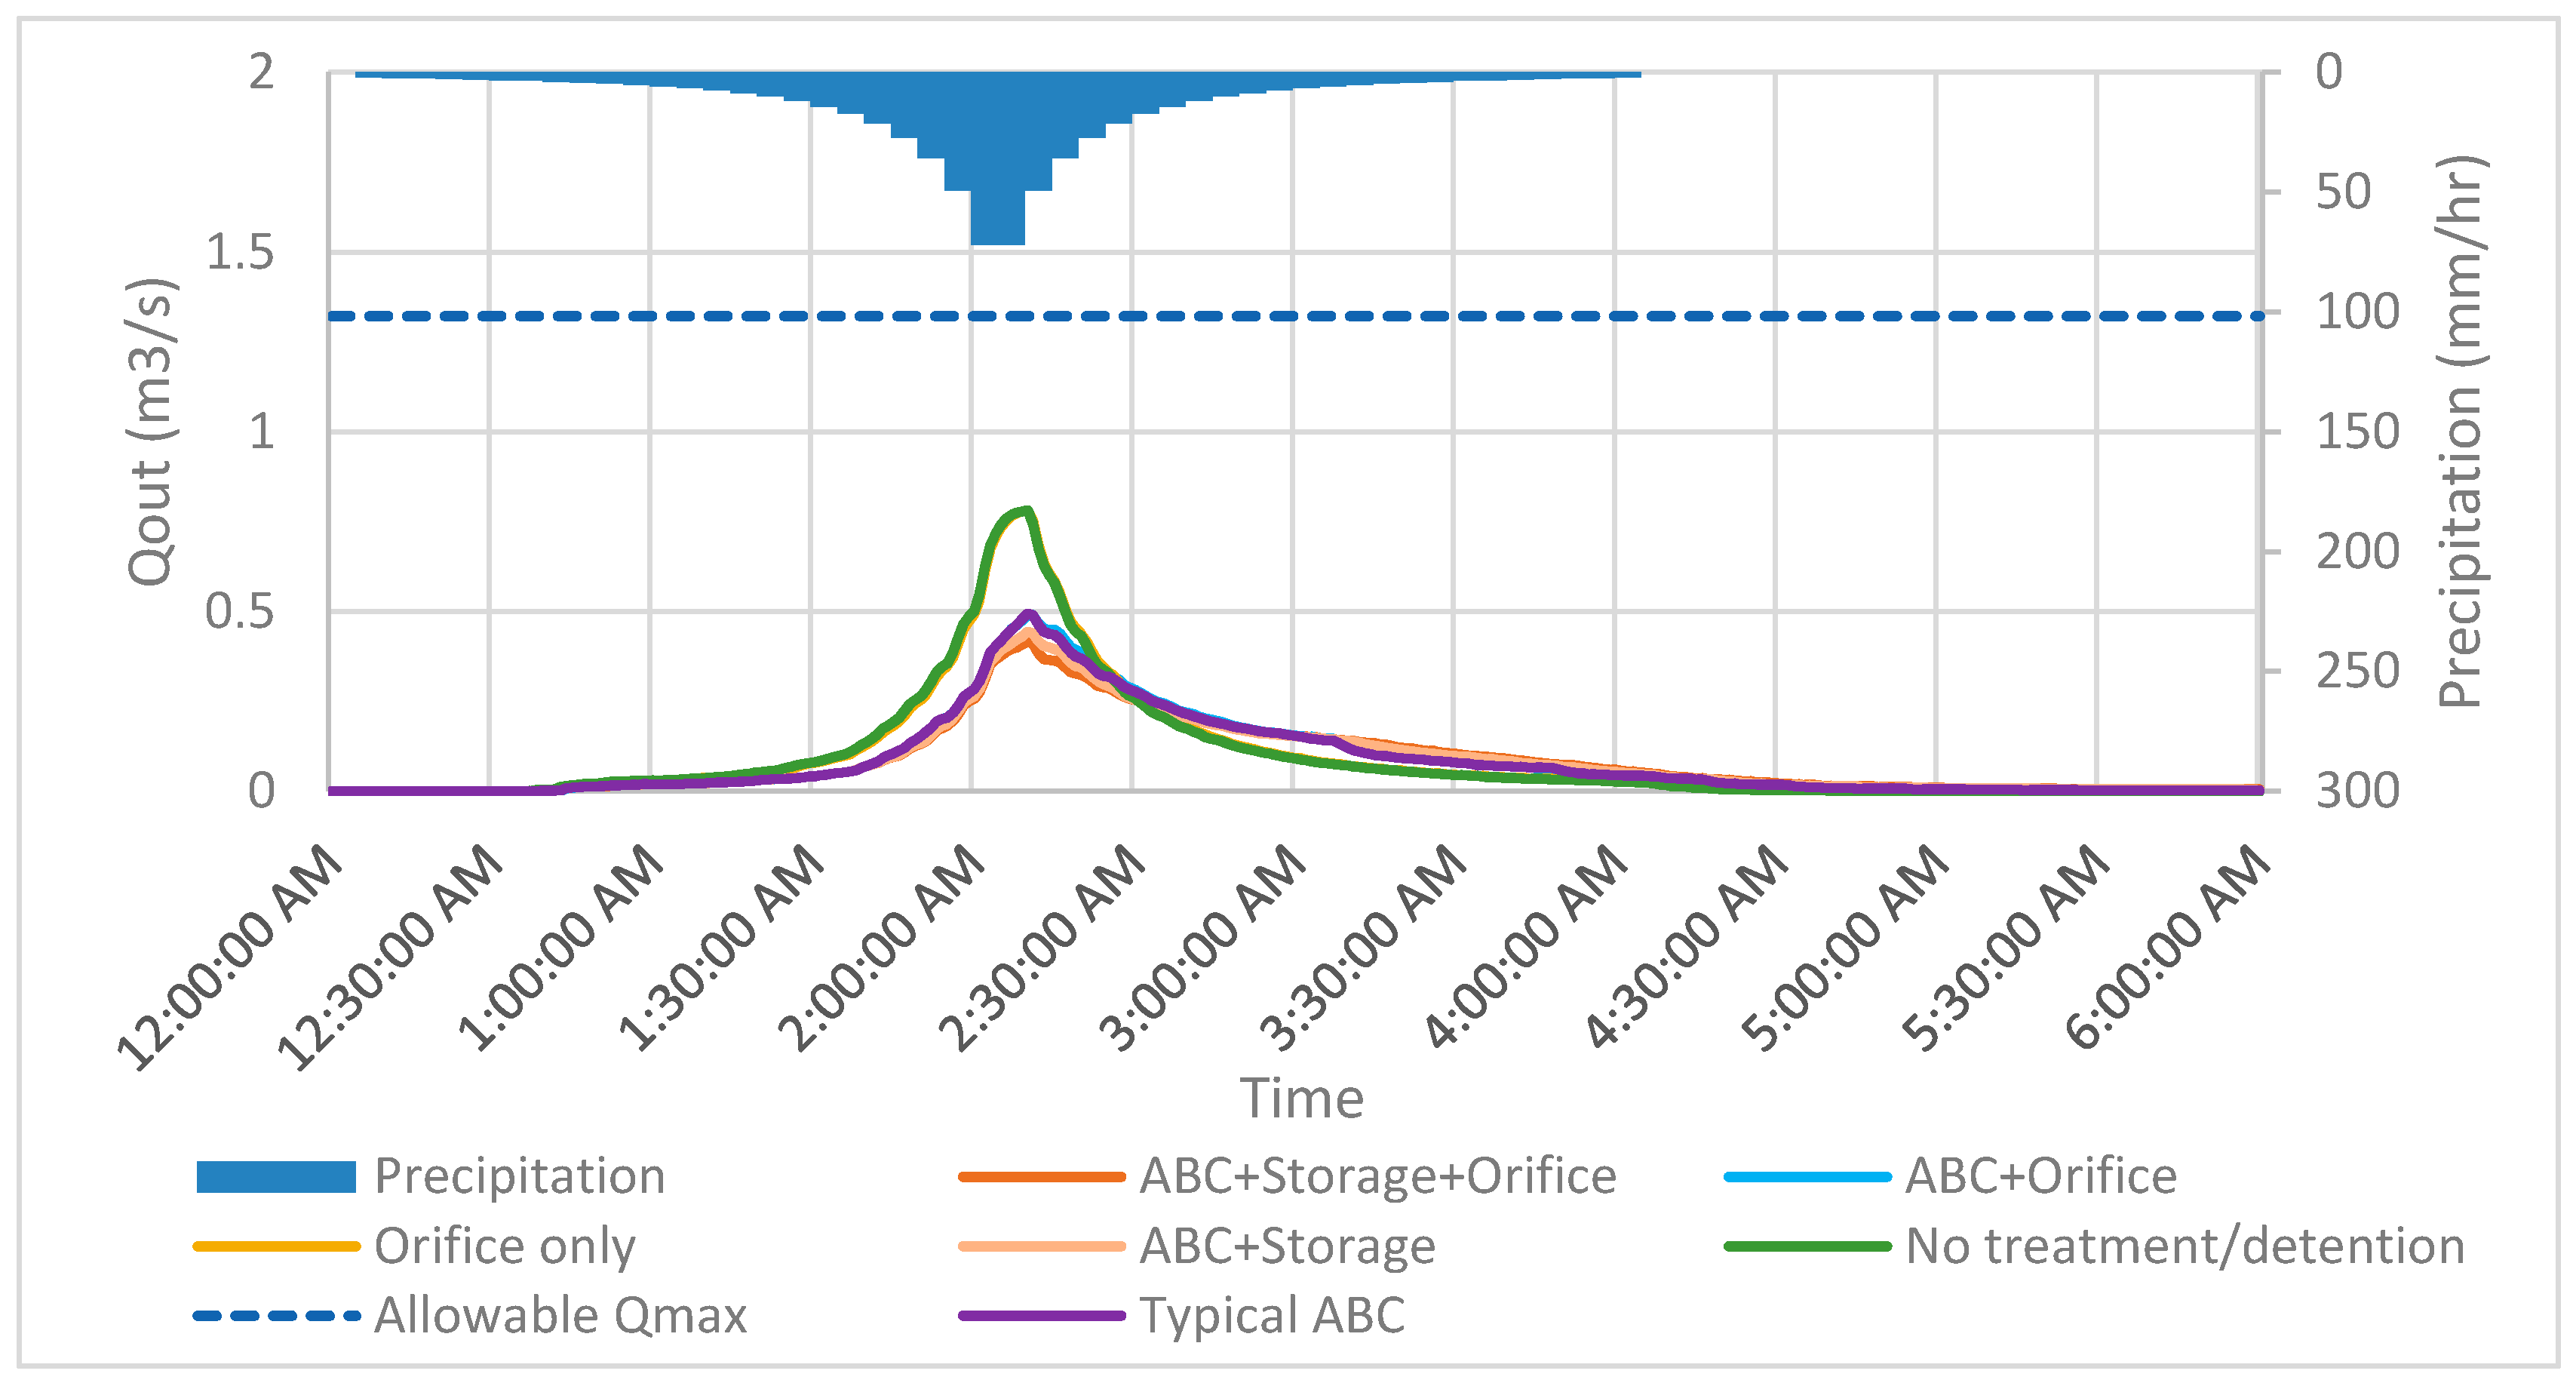
The outflows and effective C-values (of the base precinct and the various alternative scenarios) for the 3-month design storm are as shown in Figure 11 and Table 4, respectively. Table 4 also includes the results of the 10-year design storm for comparison. Similar to the results of the 10-year design storm, the constructed base precinct with ABC Waters features that are coupled with gravel storage and orifice outlets achieved the lowest C-value of 0.47. The other trends as earlier observed for the 10-year design storm also apply for the 3-month design storm. In addition (and as expected), the peak flow for all the scenarios are below that of the maximum allowable peak runoff (which is calculated based on the 10-year design storm).
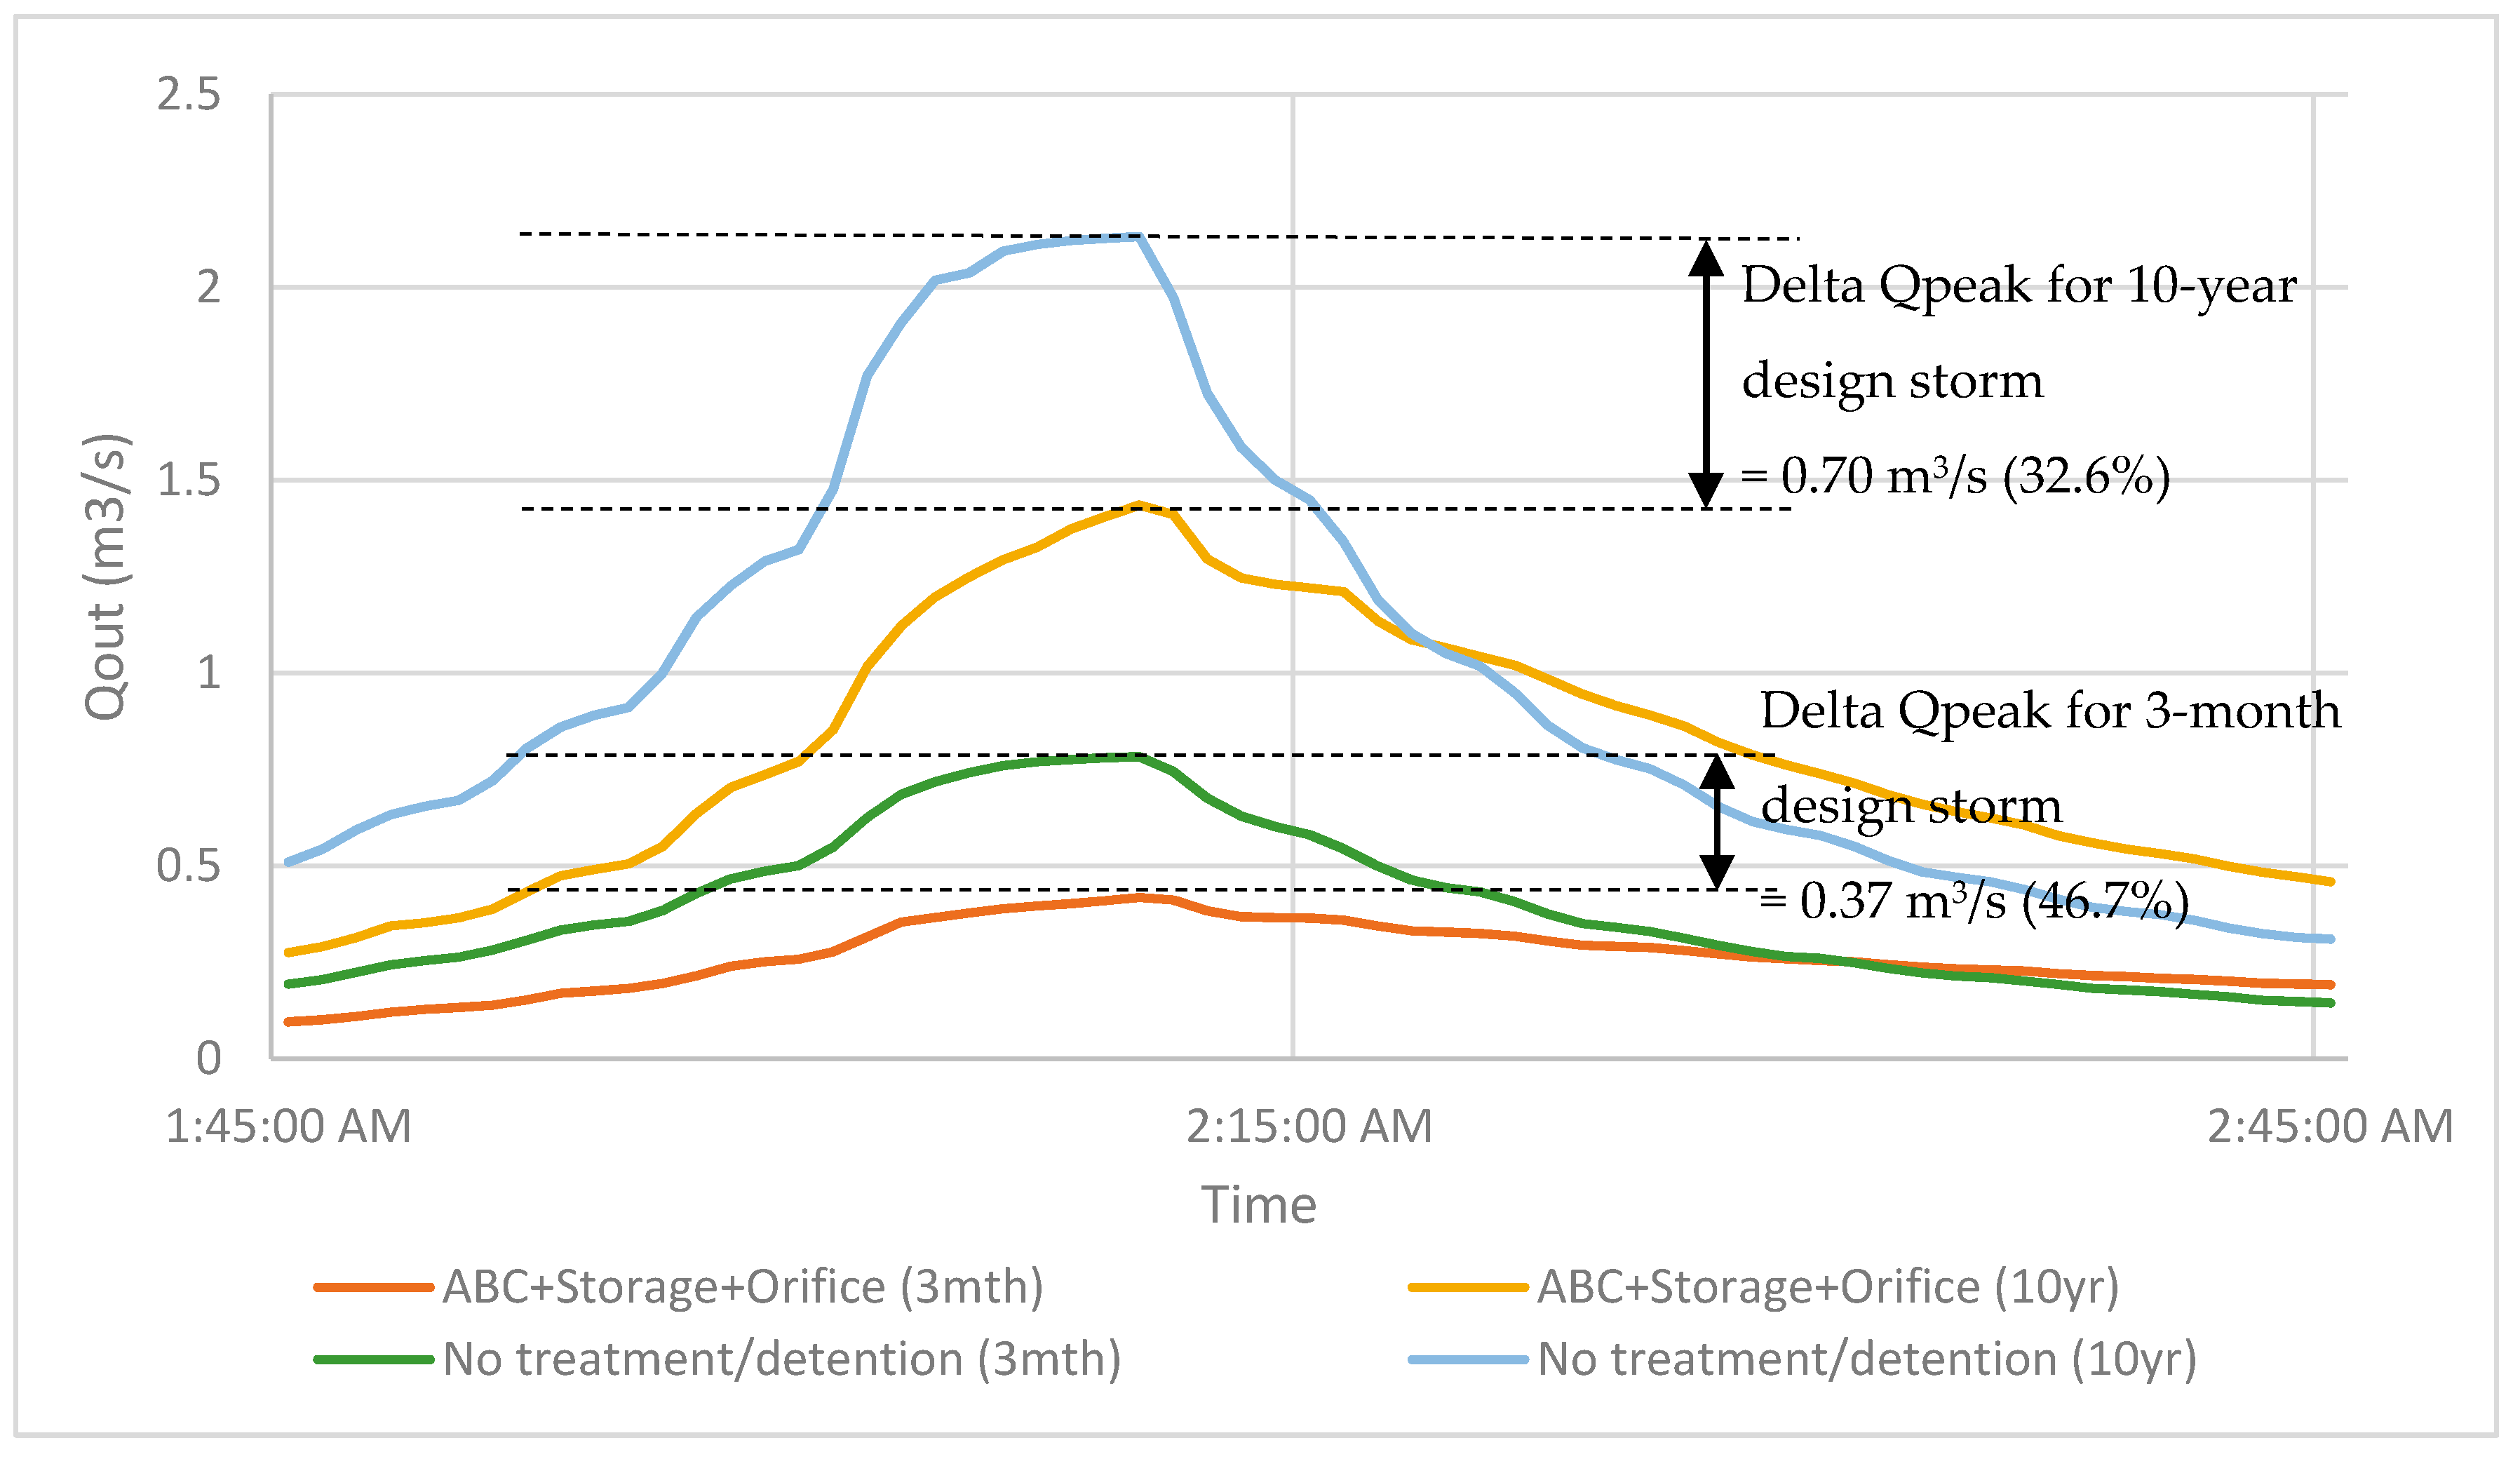
Further comparisons of the peak flow difference between the worst and best performing scenario (i.e., Scenarios 1 and 6) were also made for the 3-month and 10-year design storms in the zoomed-in plot shown in Figure 12. From the figure, we can see that the peak flow difference is larger for the 3-month design storm (at 46.7%) as compared to the 10-year design storm (at 32.6%), suggesting that the ABC Waters design features implemented are more effective in reducing peak flow for smaller storm events as compared to larger ones. Similar observations were also reported in other bioretention studies [16,17,18,22]. This is generally expected for typical rain gardens (since smaller storm events would result in less surface overflow as compared to larger storm events) and is hence a somewhat surprising observation considering the design of the rain gardens and gravel swales in the precinct which are coupled with underground gravel storage and orifice outlets.
4.5. Performance Enhancement through Optimisation
The original base precinct has an effective C-value of 0.60 and does not meet the requirements of the runoff control legislation in Singapore. This performance can be attributed to the non-optimal design of the orifice outlets in the precinct. To verify this, optimisation was performed for two scenarios, namely (1) Single-objective optimisation of the resultant C-value of the precinct by varying the diameter of the orifice outlets and (2) Multi-objective optimisation of the C-value and cost of gravel layer cum orifice outlets by varying the gravel storage layer depths and diameter of the orifice outlets. More information on the optimisation can be found in Appendix A.
The single objective optimisation showed that the effective C-value of the precinct could be improved to 0.53. The optimised C-value is 11.7% less than the non-optimised C-value of 0.60 with no increase in cost (since the gravel storage layer depths are the same), and is lower than the 0.55 that is stipulated by the runoff control legislation in Singapore. The multi-objective optimisation also resulted in a similar C-value of 0.53 at an additional cost of S$1610 (~$1180).
A separate optimisation study was also performed on an arbitrary precinct model to determine if there is an optimum rain garden area and treated catchment area (in terms of percentage of total site area) that would allow catchments to achieve C = 0.55 for the 10-year design storm. A catchment area of 4 ha was adopted for the study and three land use types were considered; residential, commercial and mixed (50% residential–50% commercial). Runoff from treated parts of the catchment is channelled into a lumped rain garden with gravel storage and orifice outlets based on the design adopted at Waterway Ridges. The study showed that there is an optimum treated catchment area that would result in the lowest possible C-value for each rain garden size, and beyond which the peak flow reduction performance would deteriorate (Figure 13). It was found that a minimum rain garden size of 6% the total site area with treated catchment areas of 45.2–47.2% (depending on land use type) was needed to meet the runoff control legislation in Singapore. More information on the study is provided in Appendix B.
5. Discussion
The results prove that the innovative design implemented for the rain gardens and gravel swales at Waterway Ridges, whereby the features are coupled with underground gravel layers for storage and orifice outlets for restricting flow, is indeed workable. These two key design elements (i.e., the gravel storage and orifice outlets) significantly improve the runoff control effectiveness of rain gardens and gravel swales, as can be seen when the precinct scenario with the typical design of ABC Waters design features implemented in Singapore (i.e., without gravel storage and orifice outlets) was only able to achieve an effective C-value of 0.77. By being able to meet the runoff control requirements in Singapore, the new design allows ABC Waters design features to be considered as another effective option in reducing peak flow, in addition to other structural measures such as underground detention tanks.
Upon comparing the performance of ABC Waters design features between smaller and bigger storm events, it was found that ABC Waters design features were more effective in reducing peak flow for the smaller storm events. This was substantiated by peak flow reduction comparisons of the precinct for the 3-month and 10-year design storms, which showed that there is a larger peak flow reduction for the 3-month design storm (at 46.7%) as compared to the 10-year design storm (at 32.6%). While this was expected for typical rain gardens (since smaller storm events would result in less surface overflow from rain gardens as compared to larger storm events), it was a somewhat surprising observation considering the design of the rain gardens and gravel swales in the precinct which are coupled with underground gravel storage and orifice outlets.
Meanwhile, the precinct optimisation results show that the effectiveness of the ABC Waters design features in reducing peak flow and in complying with the runoff control requirements for Singapore can be enhanced. The non-optimised ABC Waters design features in Waterway Ridges were able to reduce the effective C-value of the precinct to 0.60 for the 10-year design storm, a reduction of 32.6% in peak flow when compared to the scenario of the precinct without any treatment or detention features. The peak flow reduction performance of the precinct improved considerably when the orifice outlet sizes were optimised using evolutionary algorithm, resulting in an effective C-value of 0.53 which is 11.7% better than the non-optimised C-value of 0.60 obtained from the base precinct model, at no increase in cost. More importantly, this optimised C-value is lower than the 0.55 stipulated by the runoff control legislation in Singapore. The effective C-value can also be lowered slightly below 0.53 when the gravel storage layer depths were optimised together with the orifice outlet sizes, albeit at an additional cost of S$1610 (~$1180) or 3.1% more (as compared to the cost of gravel layer and orifice outlets in the original base precinct).
The study on optimum rain garden area and treated catchment area (that would allow catchments to achieve C = 0.55 for the 10-year design storm) found that a minimum rain garden size of 6% the total site area, with treated catchment areas of 45.2–47.2% depending on land use, would be required. The recommended rain garden size is only slightly higher than the 4–5% (of equivalent impervious catchment area) which is recommended by PUB [8] in order to meet the storm water quality objectives for Singapore [4]. The 6% is also comparable to the results of Waterway Ridges with optimised orifice outlets, whereby a C-value of 0.53 was obtained with an ABC Waters design feature area (excluding batter slopes for the rain gardens) of 5.4% the total precinct area.
Unlike underground detention tanks, ABC Waters design features (which are natural and sustainable) provide other ecosystem services such as the enhancement of biodiversity and improvements in runoff water quality [4]. The combined design of rain gardens and vegetated swales with underground gravel storage layers also reduces the risk of drowning and mosquito nuisance which are present in open detention systems. The incorporation of green infrastructure in urban areas further adds monetary value to a precinct as there is a willingness by the public to pay more for properties in precincts with green infrastructure; for example, a survey of Australian households reveal that buyers are willing to pay an additional $36,000–54,000 per property in streets with rain gardens [33].
The innovative design of the rain gardens and gravel swales (which are coupled with underground gravel layers for storage and orifice outlets to restrict flow) can also be modified to effectively reduce peak flow in countries beyond Singapore. This would apply in particular to countries with the same tropical climate, many of which are still developing. This design is also relevant for temperate regions in Europe, where the usage of Sustainable urban Drainage Systems (SuDS) is prevalent. The findings of this paper can be used to highlight ABC Waters design features as a viable sustainable option to governments of countries where the extensive use of such features have previously not been considered for storm water management.
6. Conclusions
This research was aimed at determining the effectiveness of Singapore’s ABC Waters design features in reducing peak flow during storm events. Hydraulic performance assessment of the innovative design of ABC Waters design features was performed using a 1D SWMM model setup of the Waterway Ridges pilot precinct. The analysis revealed that ABC Waters design features are effective in reducing peak flow and runoff coefficient of the precinct during storm events. The effectiveness is attributed to an innovative design, which comprises the coupling of rain gardens and vegetated swales with underground gravel layers for storage and orifice outlets to restrict outflow. The reduction in peak flow (and effective runoff coefficient i.e., C-value) is 33% and 47% for the 10-year and 3-month design storms, respectively, when compared to the scenario whereby no treatment or detention is performed. When compared with typical designs adopted for the ABC Waters design features, there is also an improvement in peak flow reduction by 23% and 16%, respectively, for the 10-year and 3-month design storms.
The performance of the hybrid ABC Waters design features in terms of reducing the effective C-value of the precinct can also be optimized through design parameters such as orifice outlet diameter and gravel layer thickness; such an optimisation was performed on the precinct which resulted in a further reduction of the C-value by 12%. The reduction of effective C-value via the use of ABC Waters design features can also be improved by optimising the treated catchment area channelled to the feature. In addition to the decrease in peak flow and reduction in runoff coefficient, the innovative design reduces the risk of drowning as well as mosquito breeding when compared against structural detention measures and open detention systems, and also exhibits the other benefits of ABC Waters design features such as in providing ecosystem services and enhancing biodiversity.
It is acknowledged that the results obtained are preliminary and that calibration of the models will need to be carried out to provide validated results; this will be performed when monitoring results become available. Nevertheless, the preliminary results are very encouraging in promoting the use of the modified ABC Waters design features for peak flow and C-value reduction in Singapore and other tropical countries, as well as in the temperate regions of the world where usage of SuDS/LID/WSUD are prevalent.
Acknowledgments
The authors would like to thank IHE Delft Institute for Water Education for covering the costs to publish in open access. The authors would also like to thank SURF Cooperative for providing the opportunity for part of the research to be carried out in a significantly more efficient manner on the Dutch national e-infrastructure.
Author Contributions
The paper was written by Wing Ken Yau based on the results obtained from his research, which was done for the partial fulfilment of requirements for the Master of Science degree at the IHE Delft Institute for Water Education, under the close supervision of his mentors Assela Pathirana and Shie-Yui Liong, as well as his supervisor Chris Zevenbergen. Mohanasundar Radhakrishnan provided timely feedback on the research throughout the research study. All co-authors also helped to review and improve the paper.
Conflicts of Interest
The authors declare no conflict of interest.
Appendix A. Optimisation Study on Waterway Ridges
Appendix A.1. Methodology of Optimization Study
The SWMM5-EA software that applies evolutionary algorithms to optimize drainage/sewerage networks setup in SWMM v5 [34] was used for the optimisation study of the 1D base precinct model.
From the 1D hydrodynamic model, it had been determined that the key design elements affecting the peak flow reduction performance of the precinct are the orifice outlet diameters and the gravel storage layer depths.
With this knowledge, the optimisation was performed for two scenarios, namely (1) Single objective optimisation of the resultant C-value of the precinct by varying the diameter of the orifice outlets; and (2) Multi-objective optimisation of the C-value and cost of gravel layer cum orifice outlets by varying the gravel storage layer depths and diameter of the orifice outlets. Both scenarios are minimisation problems with the constraint that there should be no flooding in the precinct. For Scenario 2, it was assumed that the invert levels of the downstream conduits and drainage channels would be able to match with those optimised gravel layer depths which are deeper than their original depths. In addition, excavation costs were assumed to be constant, and the cost of orifice outlets was assumed to be the same regardless of the orifice size.
To achieve the desired optimisation, the feature of SWMM5-EA allowing modifications to be made to the software (via the introduction of a Python script file named ‘swmm5ec_custom.py’ in the ‘customcode’ folder under the SWMM5-EA installation directory) was evoked [34]. Python is a free and open source programming language developed by Python Software Foundation, USA. In particular, customisation had to be made to the “getFitness” function (in the Python script file ‘swmm5ec.py’), which defines how the fitness for each individual or phenotype is computed.
For both cases, a population size of 10 × D as recommended by Storn [35], where D is the number of variables being optimised, was adopted. The values ranges of the orifice outlets and gravel storage depths to be optimised are as shown in Table A1. The flooding constraint was also imposed on both scenarios via a flood cost function. For Scenario 1, an arbitrary flood cost function of the total flood volume multiplied by 1012 was adopted as the penalty function, and the flooding cost was added to the C-value to define the fitness for each phenotype. Meanwhile, the flooding penalty was imposed on the calculated C-value for the respective phenotypes in Scenario 2; a value of 1 would be assigned to the C-value (instead of the actual calculated value) if flooding is present. Table A2 summarises the optimisation parameters adopted in SWMM5-EA for both scenarios.

Table A1.
Value ranges for the optimisation of the orifice outlet and gravel storage depth.
| Variable | Value Ranges | |
|---|---|---|
| Minimum | Maximum | |
| Orifice outlet | 0.01 m | Diameter of outlet conduit |
| Gravel storage depth | 0.25 m | 0.8 m |
Table A2.
Optimisation parameters for the optimisation of (A) orifice outlet diameter and (B) gravel storage depth and orifice outlet diameter.
Table A2.
Optimisation parameters for the optimisation of (A) orifice outlet diameter and (B) gravel storage depth and orifice outlet diameter.
| Parameter/Case | (A) | (B) |
|---|---|---|
| Optimisation type | Single-objective optimisation of effective C-value | Multi-objective optimisation of effective C-value and cost of gravel storage layer cum orifice outlets |
| Variable to be optimised | Orifice outlet diameters | Gravel storage depth and orifice outlet diameters |
| Number of variables | 18 | 40 |
| Flood cost function | 1012 × total flood volume | Imposed on C-value, which becomes 1 when there is flooding |
| Function for cost of gravel layer 1 and orifice outlets 2 | N.A. | S$55 × (total storage volume)/0.4 × 0.6 + 10 × (number of orifice) |
| Population size | 180 | 400 |
| Crossover rate | 0.9 | 0.9 |
| Mutation rate | 0.2 | 0.2 |
| Number of evaluations | 18,000 | 200,000 |
| Number of generations | 100 | 500 |
Notes: 1 Cost of S$55/m3 (~$40/m3) for the gravel layer was referenced from the Construction Supplementary Schedule of Rates for the Waterway Ridges project. The design void ratio of 0.4 for the gravel layer was assumed in the cost calculations. 2 Cost of S$10/orifice outlet (~$7/orifice outlet) was assumed as no cost breakdown information was available.
Appendix A.2. Results of Orifice Outlet Optimisation
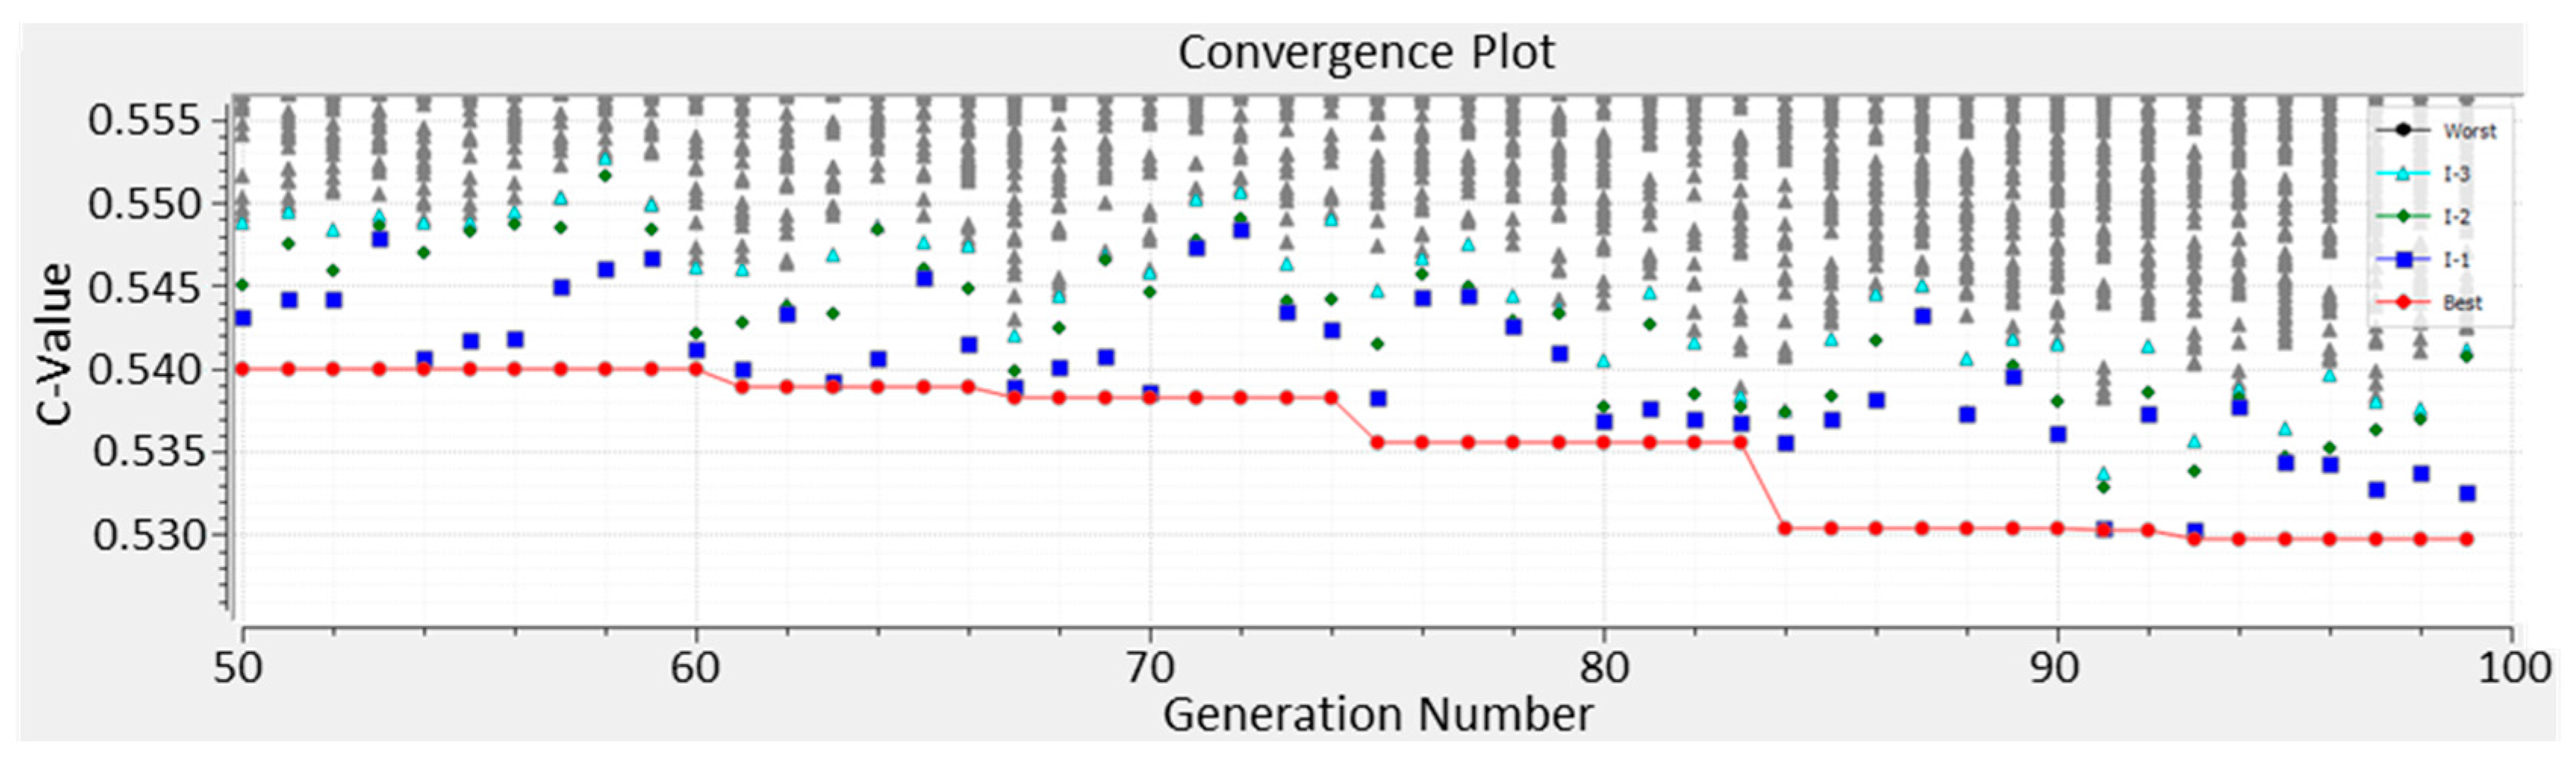
Results of the single objective optimisation of minimising the C-value of the precinct by varying the orifice outlet sizes with flooding as a constraint are as shown in Figure A1. The lowest C-value obtained after 100 iterations was 0.5298. The optimised C-value is about 11.7% better than the non-optimised C-value of 0.60 with no increase in cost (since the gravel storage layer depths are the same) but more significantly, the optimised C-value is lower than the 0.55 that is stipulated by the runoff control legislation in Singapore. This shows that ABC Waters design features that are coupled with gravel storage and orifice outlets can indeed be effective in reducing peak flow and in meeting the runoff control requirements of Singapore.
The comparisons of the gravel storage utilisation (of the various rain gardens and gravel swales) for the optimised model and the non-optimised base precinct model are as summarised in Table A3. It can be seen that the number of gravel storage units with 100% utilisation has more than doubled from five to 12 when compared to the original precinct model, with the average maximum utilisation also increasing from 65.5% to 78.1%. These results prove the earlier deduction in Section 3.4 that the gravel storage units were sized adequately but were not fully utilised due to non-optimal design of the orifice outlets.
Figure A1.
Results of the single objective optimisation of minimising C-value of the precinct by varying the orifice outlet sizes.
Figure A1.
Results of the single objective optimisation of minimising C-value of the precinct by varying the orifice outlet sizes.

Table A3.
Comparison of gravel storage utilisations for the optimised precinct model and base precinct model.
Table A3.
Comparison of gravel storage utilisations for the optimised precinct model and base precinct model.
| Scenario | No. of Gravel Storage Units With 100% Utilisation | Average Maximum Utilization for Gravel Storage Units |
|---|---|---|
| Non-optimised base precinct model | 5 | 65.5% |
| Precinct model with optimised orifice outlets | 12 | 78.1% |
Appendix A.3. Results of Orifice Outlet and Gravel Storage Optimisation
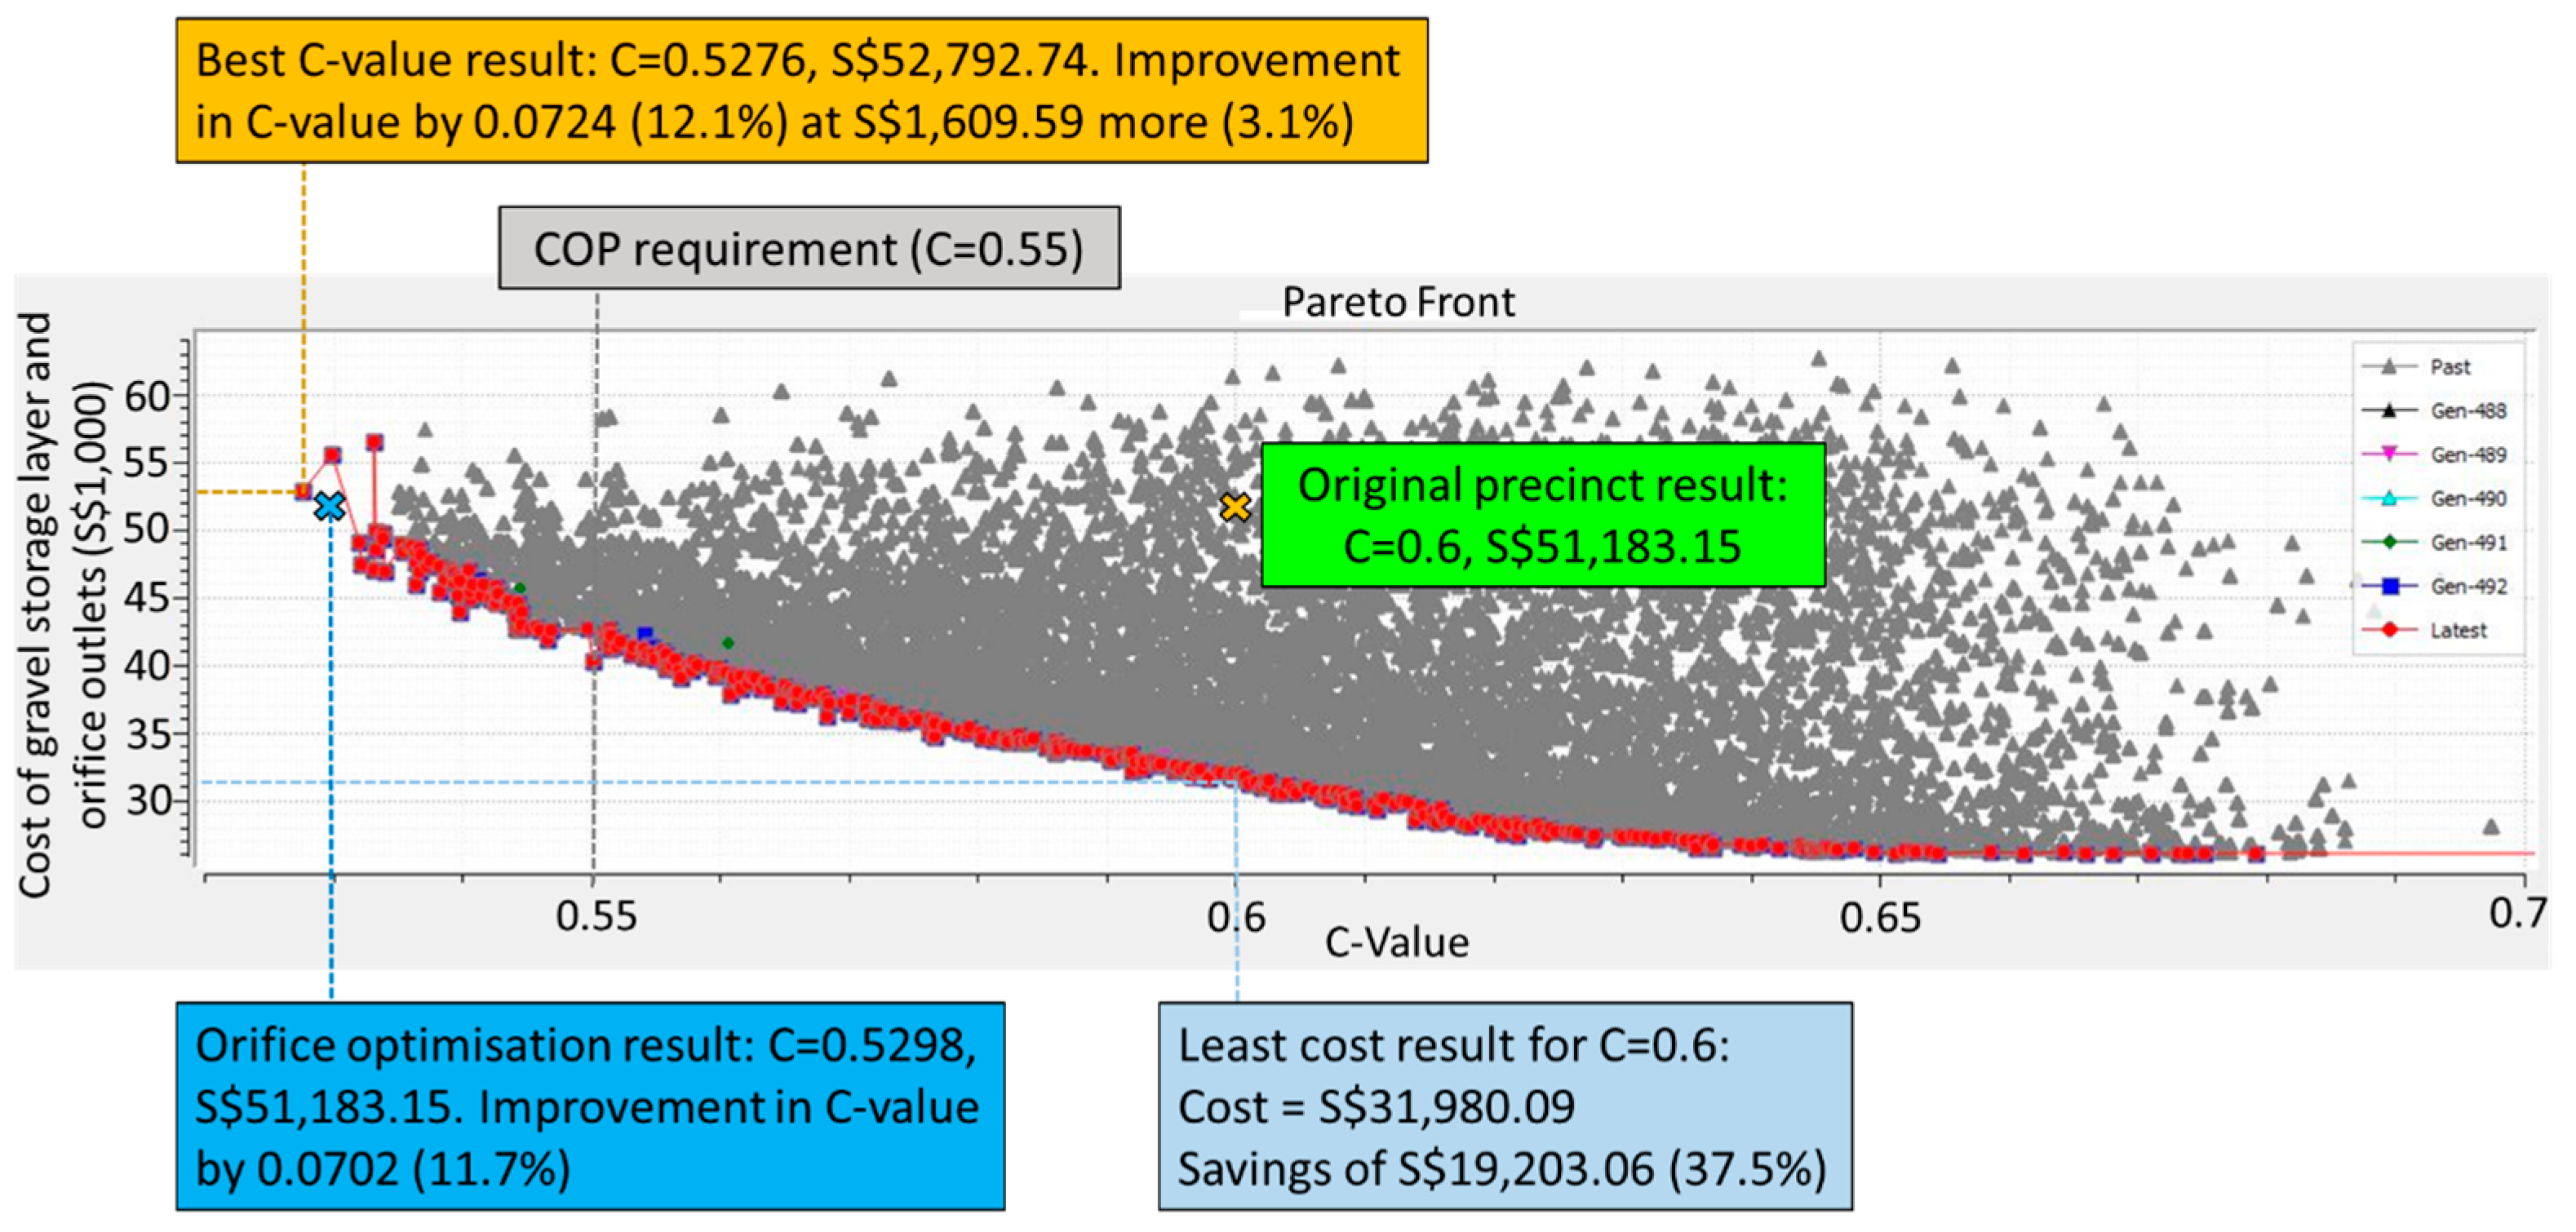
The pareto plot for the multi-objective optimisation of the cost of gravel layer cum orifice outlets and effective runoff coefficient of the precinct are as presented in Figure A2. Also included in the plot are the results of the original base precinct, and the precinct with optimised orifice outlets (which also lie on the pareto layer as the single-objective optimisation is a subset of the multi-objective one).
From the results, it can be seen that at an increased low cost of 3.1% (S$1610) (~$1180), the effective C-value can be lowered to 0.5276 which is an improvement of 12.1% as compared to the original precinct. It was noted that the lowest C-value (of 0.5276) obtained for the multi-objective optimisation (by varying both the gravel storage layer depths and orifice outlets) is only 0.4% better than the lowest C-value (of 0.5298) obtained for the single-objective optimisation (by varying the orifice outlets alone). This comparison reveals to us that the gravel storage units are more or less optimised (in terms of their sizing and cost) and reaffirms our earlier deduction that the orifice outlets in the original precinct are not sized optimally. Nevertheless, the optimisation results reveal to us that the efficiency and effectiveness of the original precinct can be very much improved to yield more cost-effective designs with lower effective runoff coefficients.
Figure A2.
Pareto plot of the multi-objective optimisation of the cost of gravel layer cum orifice outlets and effective C-value of the precinct.
Figure A2.
Pareto plot of the multi-objective optimisation of the cost of gravel layer cum orifice outlets and effective C-value of the precinct.
Appendix B. Study of Optimum Rain Garden Area and Treated Catchment Area
Appendix B.1. Scope of Study
The aim of the study was to determine if there is an optimum rain garden area and treated catchment area (in terms of percentage of total site area) that would allow catchments to achieve C = 0.55 for the 10-year design storm. As the study was intended to provide design recommendations pertaining to precinct scale catchments, a catchment area of 4 ha was adopted for the study and three land use types were considered; residential, commercial and mixed (50% residential–50% commercial).
Appendix B.2. Model Setup
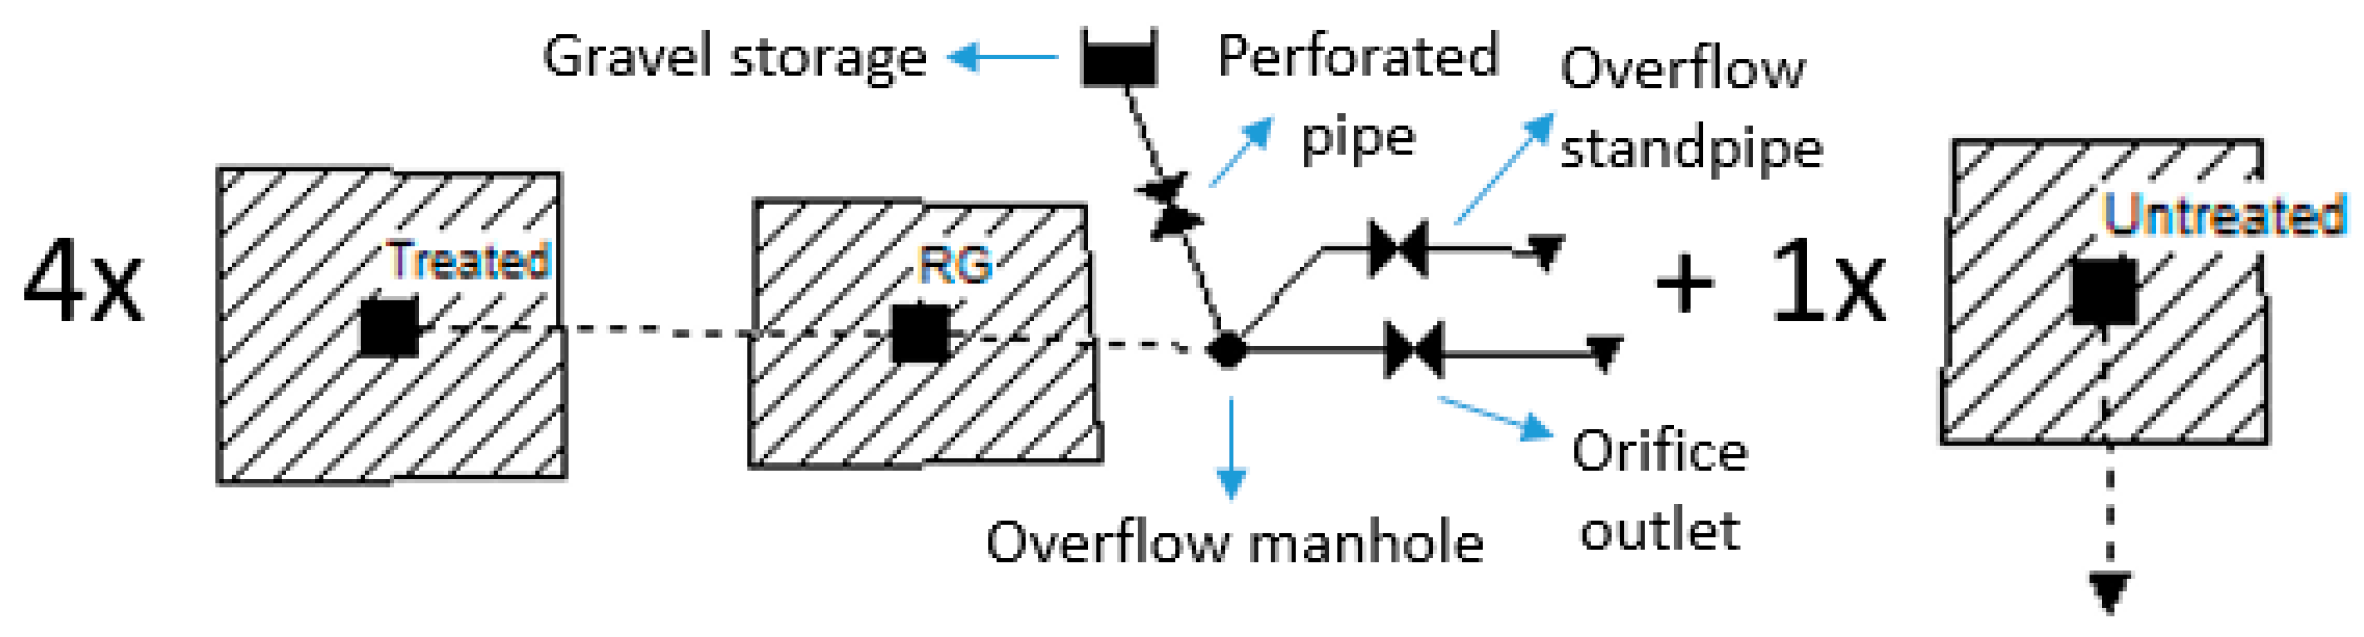
An arbitrary model comprising of the treated and untreated parts of a 4-ha catchment was set up using SWMM v5.1. As illustrated in Figure A3, runoff from the treated parts of the catchment will be channelled into a lumped rain garden, whose filtrate and overflow are then channelled into the gravel storage and overflow manhole respectively. Similarly to the design adopted in Waterway Ridges, the gravel storage is connected to the overflow manhole via a perforated pipe (represented by an orifice) and there are two outlets from the overflow manhole, namely the overflow standpipe and the orifice outlet (both of which are also represented as orifices). In the model, the treated parts of the catchment are also split into four equal parts, each of which has its own rain garden and gravel storage areas that are sized equally.
Figure A3.
Arbitrary SWMM model setup to study the optimum rain garden area and treated catchment area to achieve C = 0.55.
Figure A3.
Arbitrary SWMM model setup to study the optimum rain garden area and treated catchment area to achieve C = 0.55.

The runoff coefficients adopted for the various land uses were based on a study on the runoff coefficients for Singapore, which found that runoff coefficients are sensitive to the slope of a catchment as well as the land use [36]. The study by Goh et al. [36] improved upon the runoff coefficient recommendations for various land use types in Singapore’s COP on Surface Water Drainage [7] and developed runoff coefficients for different land use types that also took into account the slope of the catchment. The runoff coefficients and percentage imperviousness adopted for the various land uses in our study are as summarised in Table A4. It was noted that the slope of 3% adopted for the catchments in our study is in the “rolling (2–7%)” category by the Florida Department of Transportation, with the two other categories being “flat” (0–2%) and “steep” (>7%) [37].
Table A4.
Runoff coefficients and percentage imperviousness adopted for the various land uses.
| Land Use Type | Catchment Slope | C-Value | Percentage Imperviousness 1 |
|---|---|---|---|
| Residential | 3% | 0.88 | 78% |
| Commercial | 0.97 | 95% | |
| Mixed (50% residential–50% commercial) | 0.925 | 86% |
Notes: 1 Back-calculated using the Rational Formula (Equation (1)) with C-values of 1 and 0.45 being assumed for the impervious and pervious areas, respectively.
Meanwhile, Table A5 summarises the areas of the treated and untreated parts of the catchment that were studied. The areas of the rain gardens and the corresponding gravel storage volume adopted for the study are included in Table A6. An assumption made was that the percentage imperviousness of the treated catchment remains the same regardless of rain garden size. It was felt that this is a reasonable assumption given that the rain garden (which is 100% pervious) is likely to take up areas which were previously occupied by landscaping.
Table A5.
Areas of the treated and untreated parts of the catchment that were studied.
| Treated Area (% of Total Site Area) | 10% | 20% | 30% | 35% | 40% | 45% | 50% | 55% | 60% | 65% | 70% |
|---|---|---|---|---|---|---|---|---|---|---|---|
| Total treated area (ha) | 0.4 | 0.8 | 1.2 | 1.4 | 1.6 | 1.8 | 2.0 | 2.2 | 2.4 | 2.6 | 2.8 |
| Treated area for each of the four catchments (ha) | 0.10 | 0.20 | 0.30 | 0.35 | 0.40 | 0.45 | 0.50 | 0.55 | 0.60 | 0.65 | 0.70 |
| Untreated area (ha) | 3.6 | 3.2 | 2.8 | 2.6 | 2.4 | 2.2 | 2.0 | 1.8 | 1.6 | 1.4 | 1.2 |
Table A6.
Areas of the rain gardens and the corresponding gravel storage volumes adopted for the study.
Table A6.
Areas of the rain gardens and the corresponding gravel storage volumes adopted for the study.
| Rain Garden Area (% of Total Site Area) | 4% | 5% | 6% | 7% | 8% | 9% | 10% |
|---|---|---|---|---|---|---|---|
| Total rain garden area (ha) | 0.16 | 0.20 | 0.24 | 0.28 | 0.32 | 0.36 | 0.40 |
| Total gravel layer storage volume (m3) | 320 | 400 | 480 | 560 | 640 | 720 | 800 |
| Area for each of the four rain gardens (ha) | 0.04 | 0.05 | 0.06 | 0.07 | 0.08 | 0.09 | 0.1 |
| Gravel layer storage volume for each of the four rain gardens (m3) | 80 | 100 | 120 | 140 | 160 | 180 | 200 |
| Storage curve area for each of the four rain gardens (m2) | 160 | 200 | 240 | 280 | 320 | 360 | 400 |
Appendix B.3. Optimisation of Orifice Outlets and Assessment
As the optimum sizes of the orifice outlets (resulting in the lowest peak runoff from the catchments) would vary depending on the size of the treated and untreated parts of the catchment as well as the rain garden, SWMM5-EA was used to optimise the diameter of the orifice outlets under the 10-year design storm for Singapore, which was also used to assess the resultant C-value of each case. A single objective optimisation of the C-value was performed for each case with the optimisation parameters as detailed in Table A7. Similarly to the optimisation study in Appendix A, customisation had to be made to the ‘getFitness’ function in the Python script file ‘swmm5ec.py’ in SWMM5-EA [34].
Table A7.
Optimisation parameters adopted for the sizing of the orifice outlets for the study.
| Parameter | Value |
|---|---|
| Variable to be optimised | Orifice outlet diameter |
| Number of variables | 1 |
| Flood cost function | 1012 × total flood volume |
| Population size | 10 |
| Crossover rate | 0.9 |
| Mutation rate | 0.2 |
| Number of evaluations | 300 |
| Number of generations | 30 |
Appendix B.4. Results
Appendix B.4.1. Residential Precinct (C = 0.88)
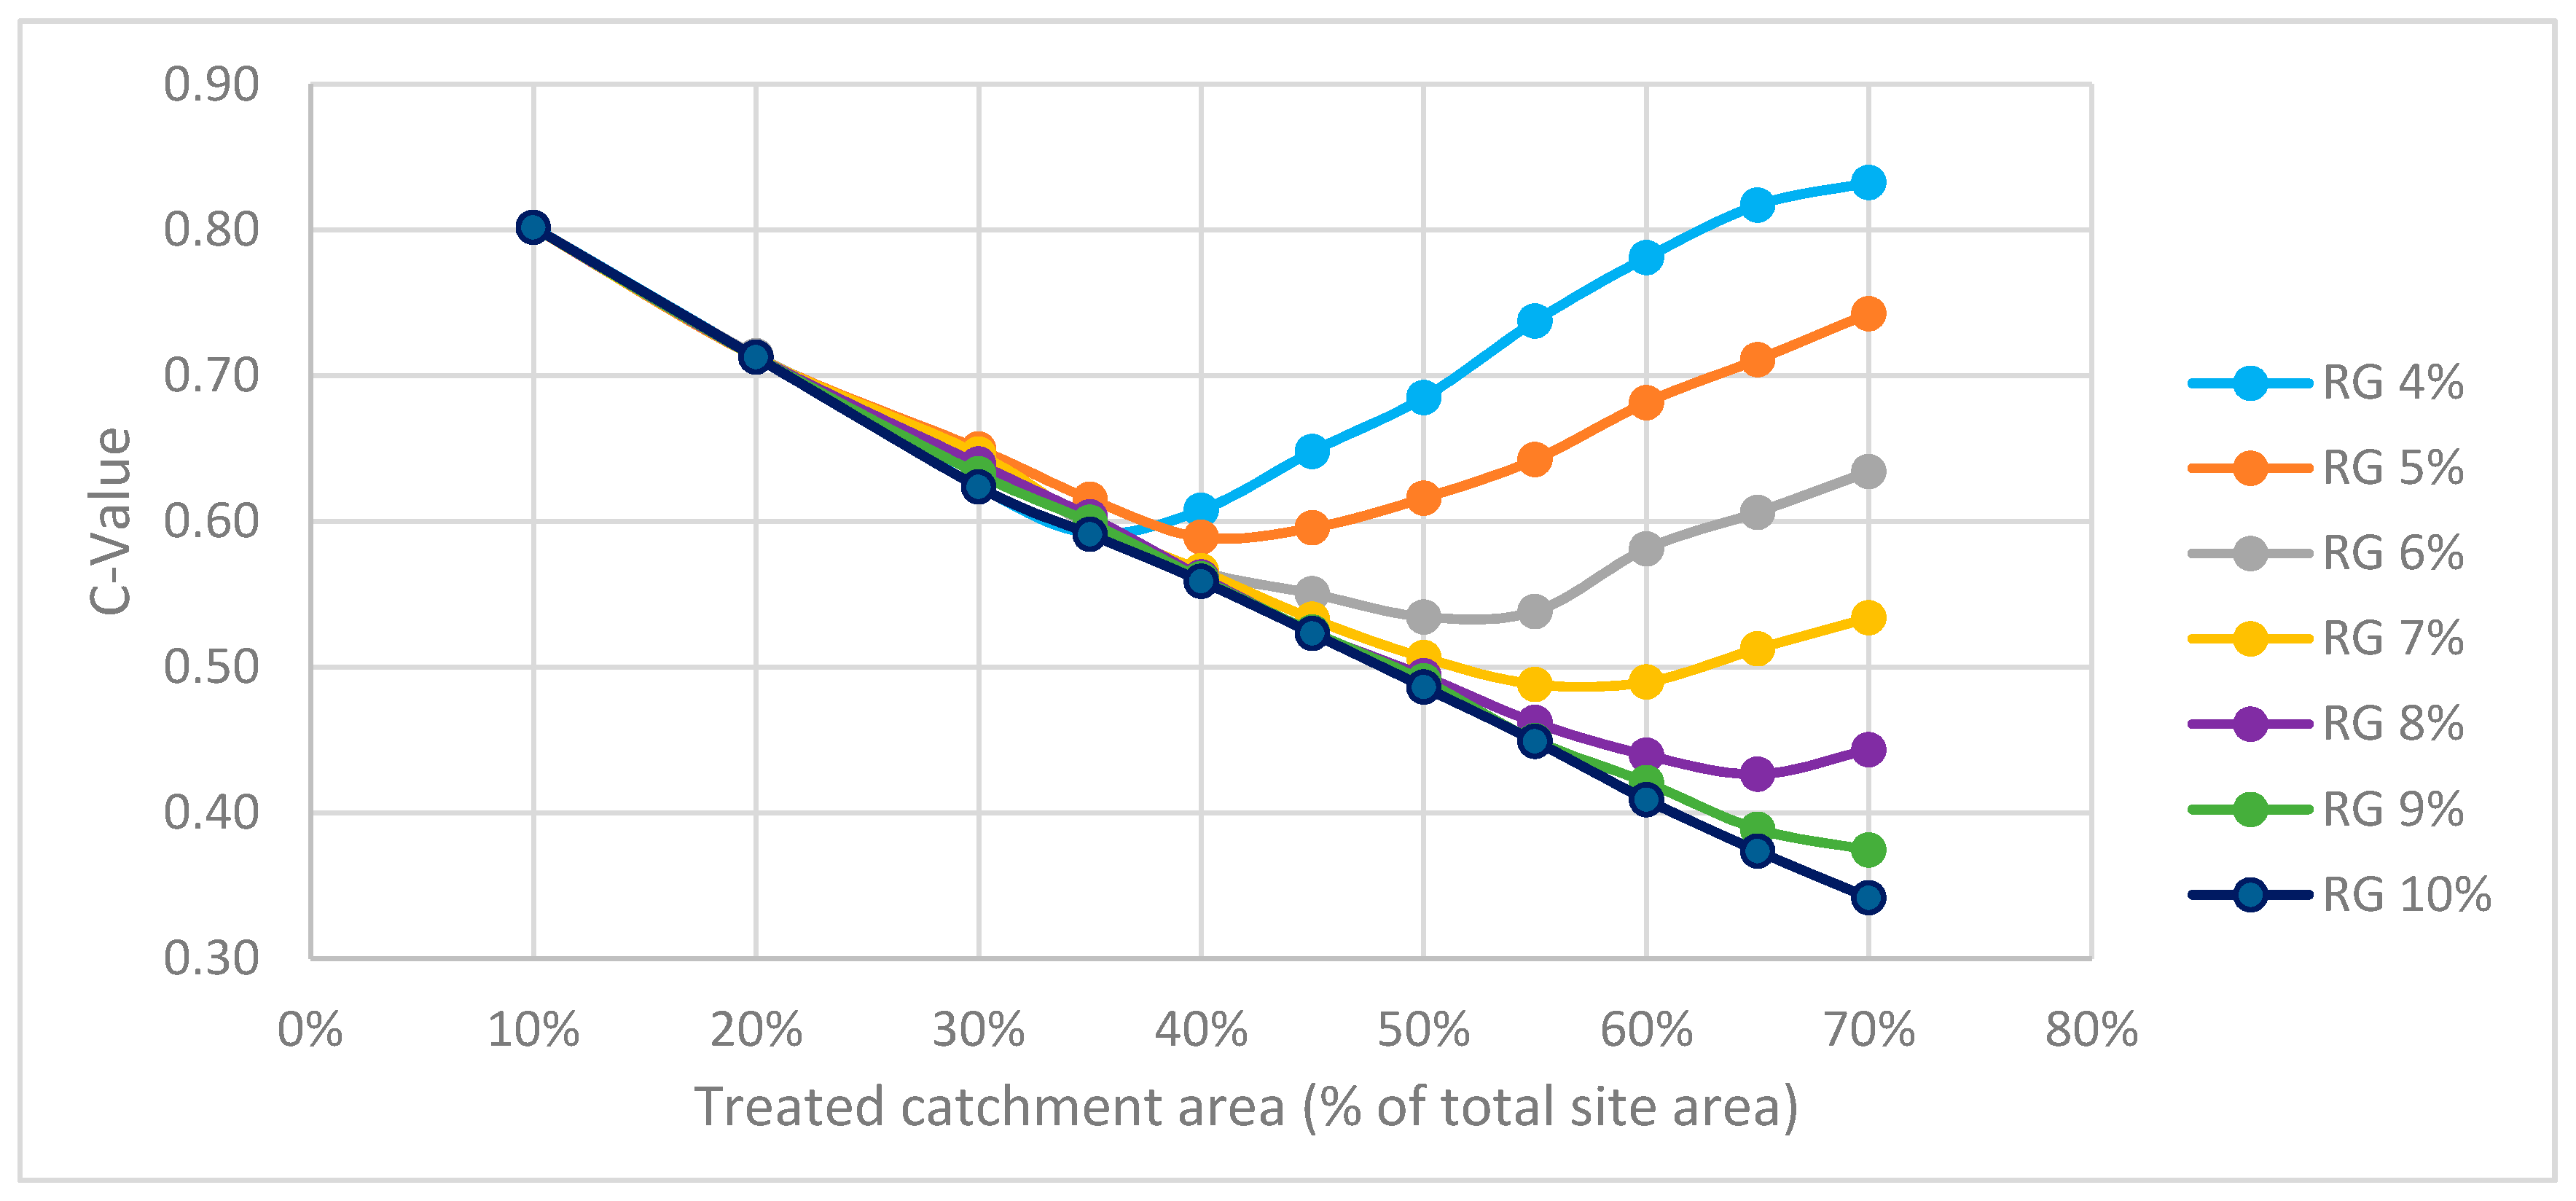
The study results for the residential precinct are as summarised in Figure A4, whereby the effective C-values are plotted against the treated catchment area for the various rain garden sizes. It can be observed that there is an optimum treated catchment area that would result in the lowest possible C-value for each rain garden size; the optimum has been attained by rain garden sizes of 4–8% but not 9–10% (within the treated catchment area range of 10–70% studied). This optimum treated area and corresponding C-value increases and decreases, respectively, as the rain garden area is increased; the optimum treated area and corresponding C-value for the various rain garden areas are as summarised in Table A8.
While increasing the treated area up to the optimum for each rain garden size would result in better peak flow reduction performance (i.e., lowering of C-values), the performance was found to deteriorate (i.e., C-value increases) when treated areas are increased beyond the optimum. From this, we can conclude that routing more runoff to a rain garden (i.e., having bigger treated catchment areas) may not always result in improved performance. This is especially true for the smaller rain garden sizes of 4–5% whose optimum treated areas are as low as 35–40%.
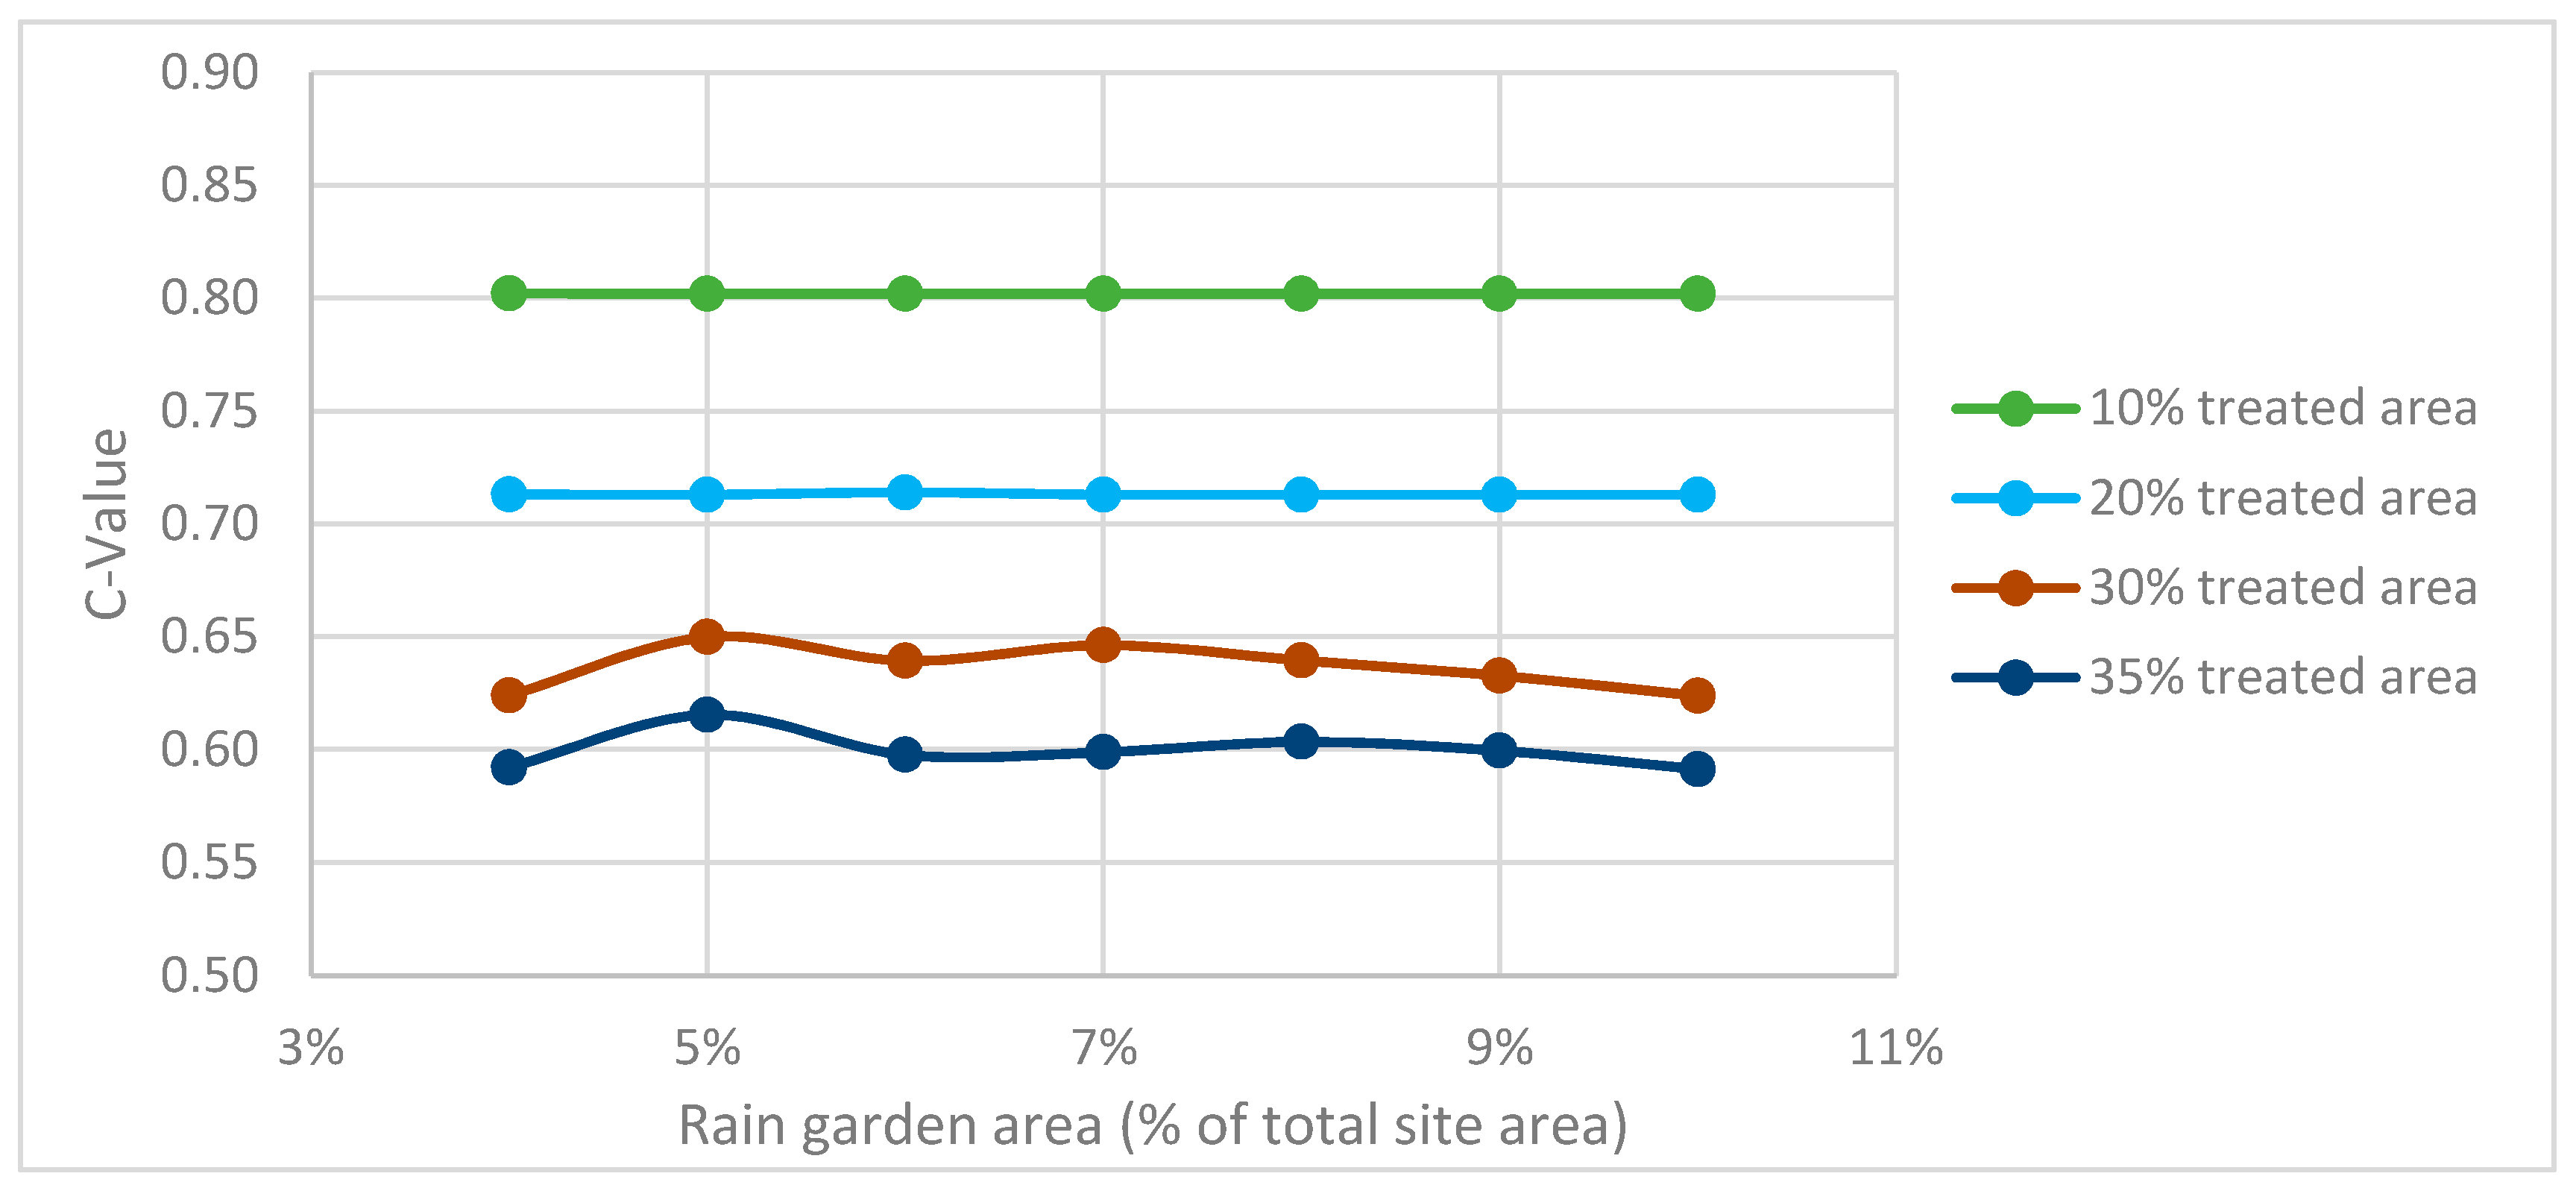
From the results, it can also be seen that at low treated catchment areas of 35% or less, increasing the rain garden size has either little or no effect on the C-values. For treated catchment areas of 30–35%, the C-values increase slightly before decreasing back to similar values as the rain garden areas are increased from 4% to 10%. These results are substantiated by an alternate representation of Figure A4, whereby C-values are plotted against rain garden sizes for the various treated catchment areas of 10–35%, as shown in Figure A5. Thus, for limited treated catchment areas of 10–35%, a small rain garden can perform as well as a bigger one and should be adopted if peak flow reduction is the only objective to be achieved by the rain garden.
Figure A4.
Residential precinct results of effective C-value versus treated catchment area for various rain garden sizes.
Figure A4.
Residential precinct results of effective C-value versus treated catchment area for various rain garden sizes.

Table A8.
Residential precinct results of optimum treated areas and C-values for various rain garden sizes.
Table A8.
Residential precinct results of optimum treated areas and C-values for various rain garden sizes.
| Rain Garden Area (% of Total Site Area) | 4% | 5% | 6% | 7% | 8% |
|---|---|---|---|---|---|
| Optimum treated area (% of total site area) | 35% | 40% | 50% | 57.5% | 65% |
| Corresponding optimum effective C-value | 0.592 | 0.589 | 0.535 | 0.488 | 0.427 |
Figure A5.
Residential precinct plot of effective runoff coefficient versus rain garden size for treated catchment areas of 10–35%.
Figure A5.
Residential precinct plot of effective runoff coefficient versus rain garden size for treated catchment areas of 10–35%.
Appendix B.4.2. Commercial Precinct (C = 0.97)
The study results for the commercial precinct are as shown in Figure A6 and Figure A7, and Table A9. From the results, it can be observed that the trends as earlier seen for the residential precinct also apply to the commercial precinct. Generally, the effective C-values for the commercial precinct for the various treated catchment areas and rain garden sizes are also larger than the corresponding C-values for the residential precinct, which is expected given that the commercial precinct has a higher runoff coefficient of 0.93, as compared to 0.88 for the residential precinct.
Figure A6.
Commercial precinct results of effective C-value versus treated catchment area for various rain garden sizes.
Figure A6.
Commercial precinct results of effective C-value versus treated catchment area for various rain garden sizes.
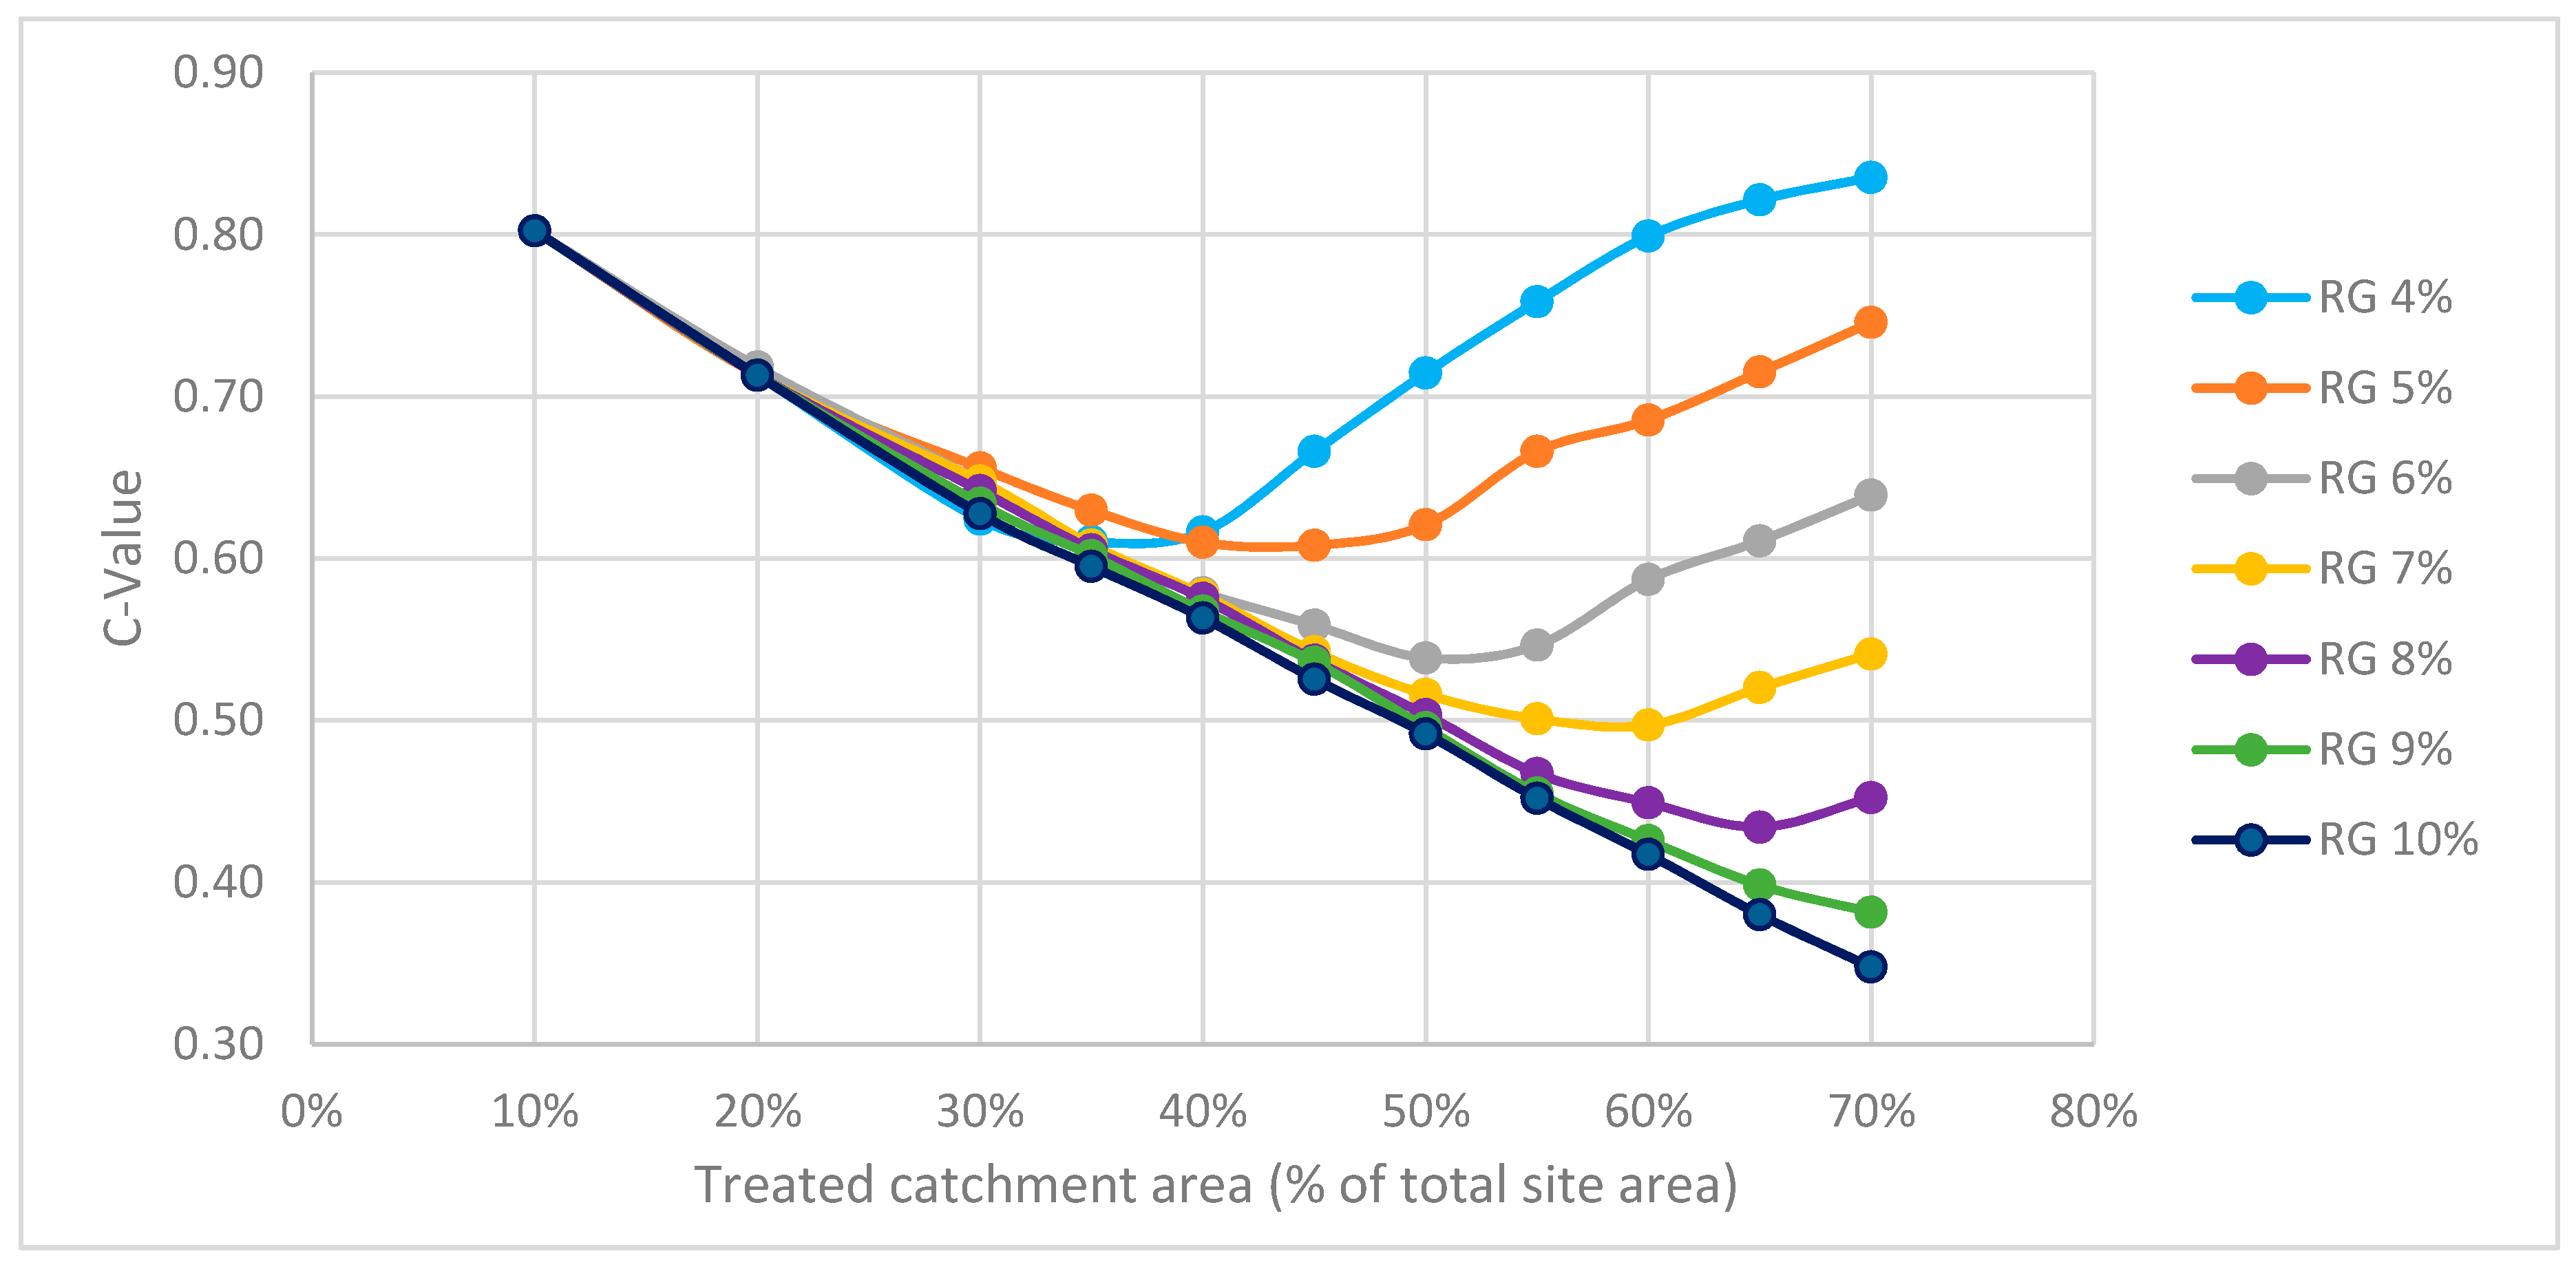
Figure A7.
Commercial precinct plot of effective runoff coefficient versus rain garden size for treated catchment areas of 10–35%.
Figure A7.
Commercial precinct plot of effective runoff coefficient versus rain garden size for treated catchment areas of 10–35%.
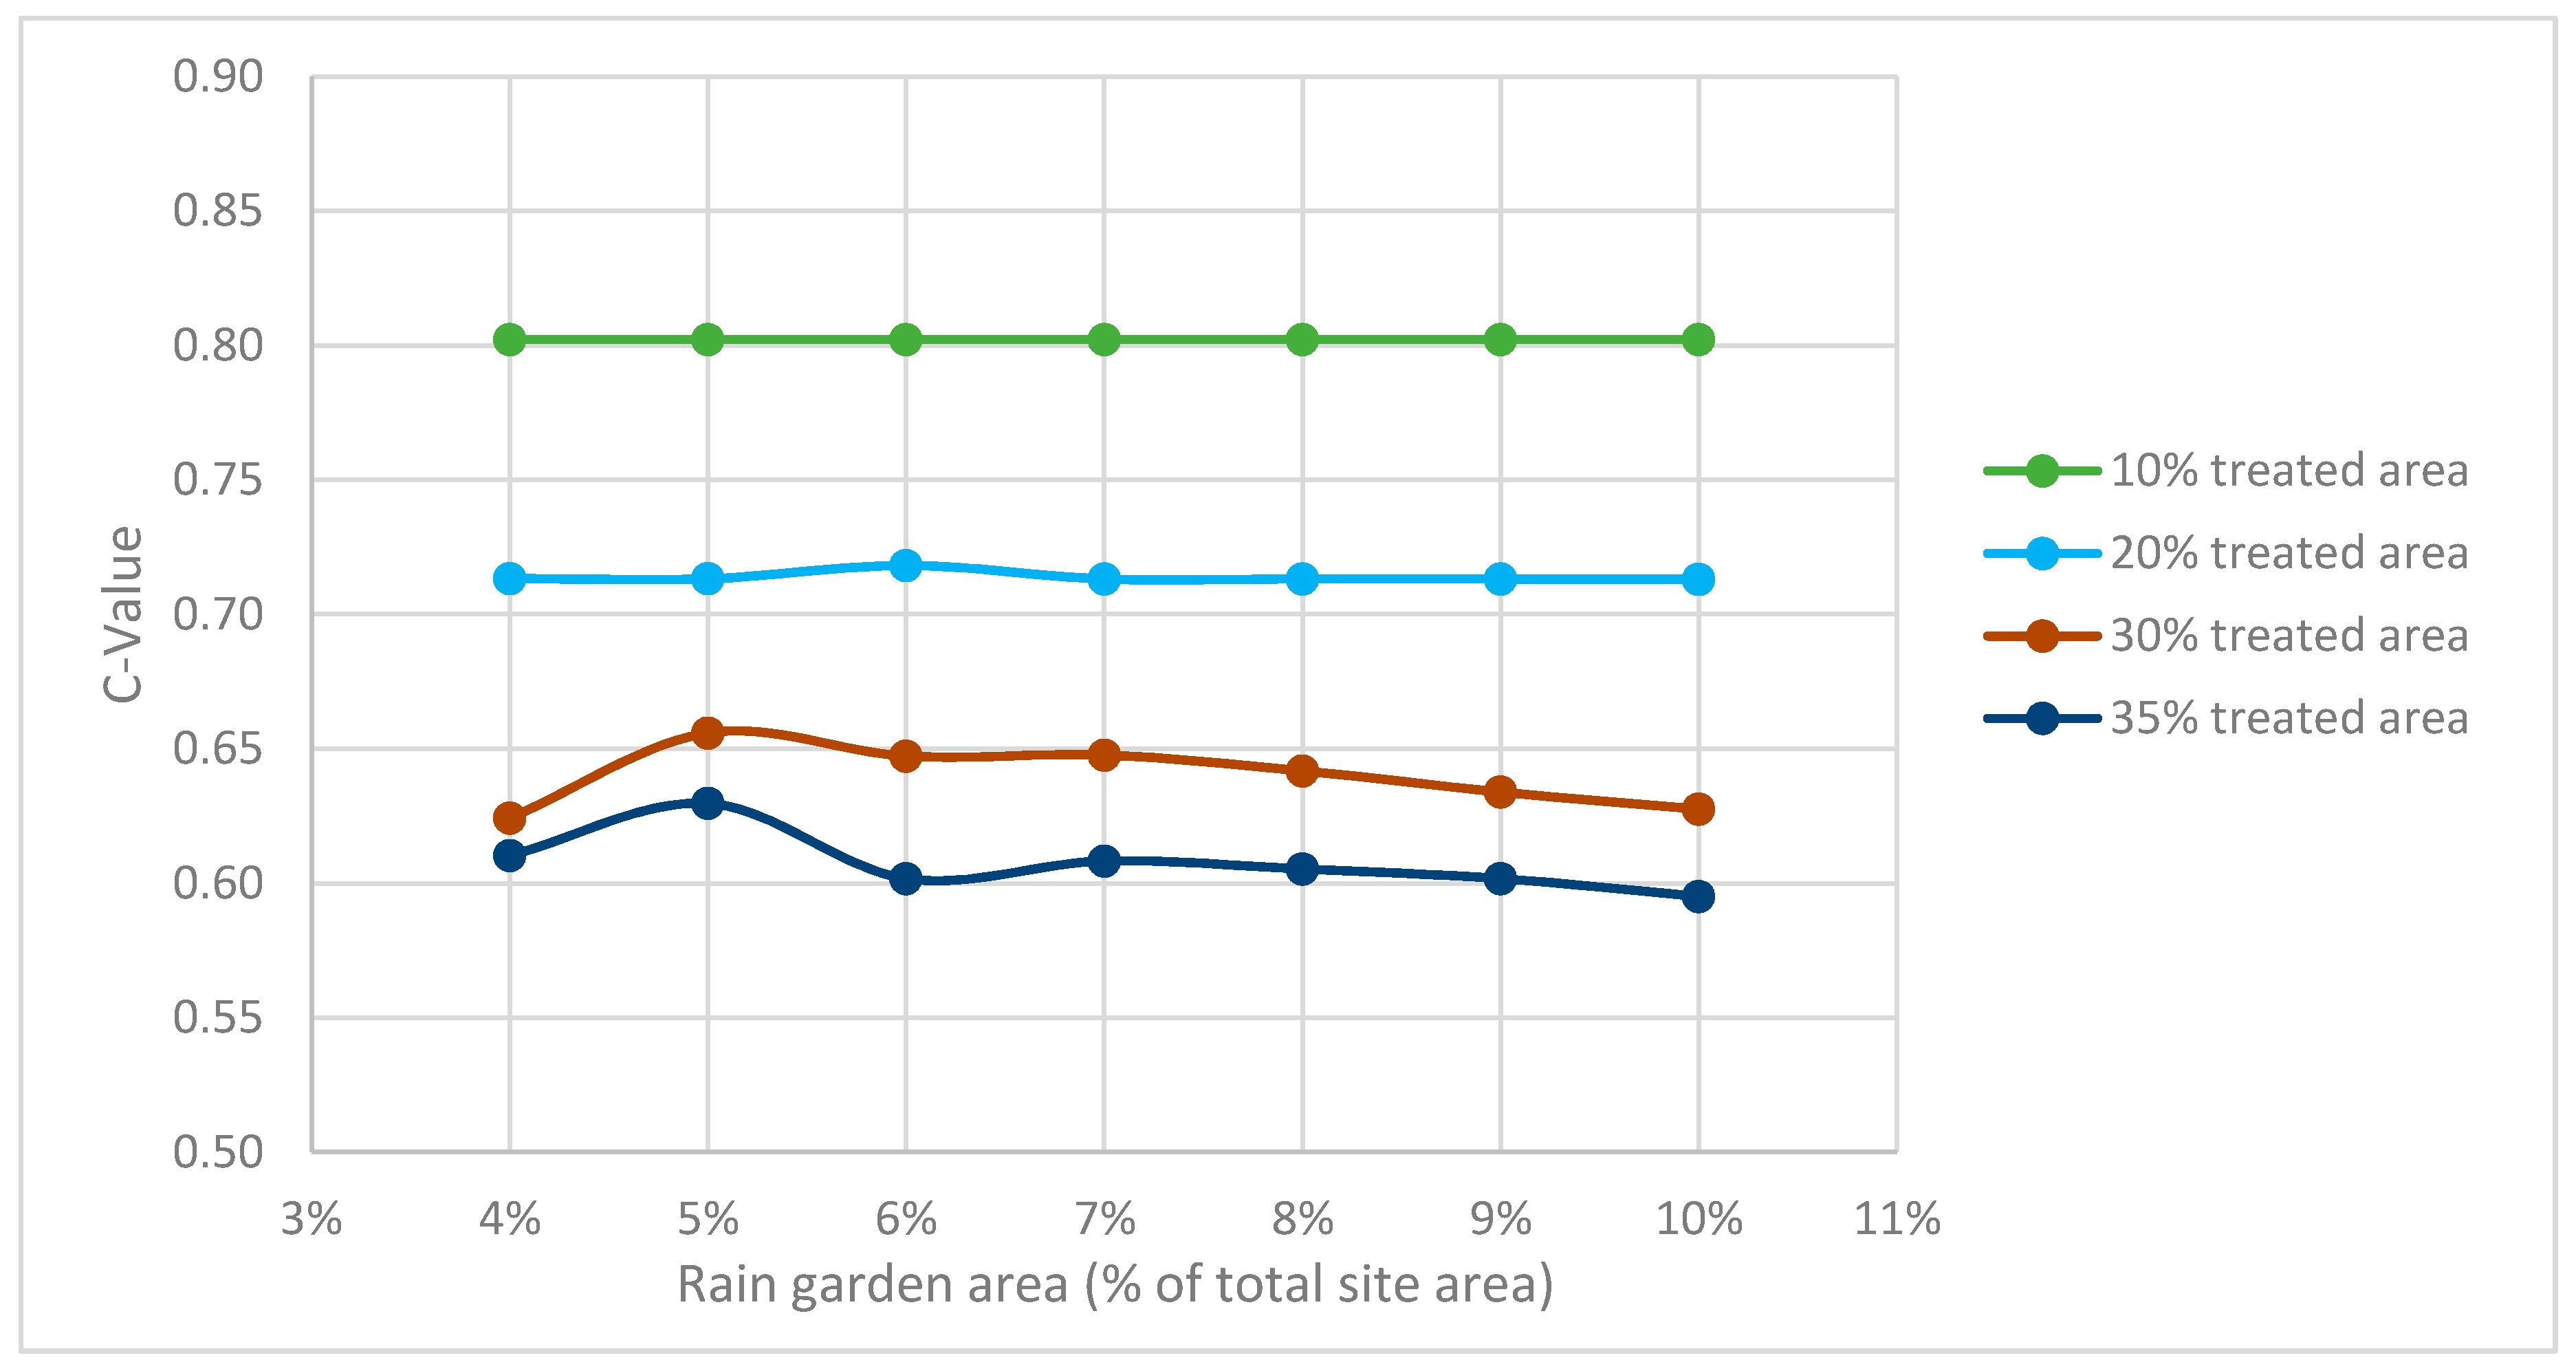
Table A9.
Commercial precinct results of optimum treated areas and C-values for various rain garden sizes.
Table A9.
Commercial precinct results of optimum treated areas and C-values for various rain garden sizes.
| Rain Garden Area (% of Total Site Area) | 4% | 5% | 6% | 7% | 8% |
|---|---|---|---|---|---|
| Optimum treated area (% of total site area) | 35% | 45% | 50% | 60% | 65% |
| Corresponding optimum effective C-value | 0.610 | 0.608 | 0.539 | 0.497 | 0.434 |
| Increase in optimum effective C-value compared to residential precinct | 0.018 | 0.019 | 0.004 | 0.009 | 0.008 |
Appendix B.4.3. Mixed Residential–Commercial Precinct (C = 0.925)
The study results for the mixed precinct with a runoff coefficient of 0.925, which is in between that of the residential and commercial precincts, are as shown in Figure A8 and Figure A9, and Table A10. The same trends as earlier observed for the residential and commercial precincts also apply to the mixed precinct. Generally, the effective C-values for the mixed precinct for the various treated catchment areas and rain garden sizes are also larger than the corresponding C-values of the residential precinct but smaller than those of the commercial precinct.
Figure A8.
Mixed precinct results of effective C-value versus treated catchment area for various rain garden sizes.
Figure A8.
Mixed precinct results of effective C-value versus treated catchment area for various rain garden sizes.

Figure A9.
Mixed precinct plot of effective runoff coefficient versus rain garden size for treated catchment areas of 10–35%.
Figure A9.
Mixed precinct plot of effective runoff coefficient versus rain garden size for treated catchment areas of 10–35%.

Table A10.
Mixed precinct results of optimum treated areas and C-values for various rain garden sizes.
Table A10.
Mixed precinct results of optimum treated areas and C-values for various rain garden sizes.
| Rain Garden Area (% of Total Site Area) | 4% | 5% | 6% | 7% | 8% |
|---|---|---|---|---|---|
| Optimum treated area (% of total site area) | 35% | 40% | 50% | 60% | 65% |
| Corresponding optimum effective C-value | 0.597 | 0.590 | 0.539 | 0.496 | 0.431 |
| Increase in optimum effective C-value compared to residential precinct | 0.005 | 0.001 | 0.004 | 0.007 | 0.004 |
Appendix B.4.4. Recommended Treated Catchment Areas and Rain Garden Sizes for Achieving Effective C = 0.55
The optimum treated catchment areas and rain garden sizes for meeting the runoff control requirements of Singapore’s COP of Surface Water Drainage are as summarised in Table A11 for the three land use types studied.
Table A11.
Required treated catchment areas and rain garden sizes to achieve C = 0.55 for the various land use types (percentages in brackets represents the upper limits beyond which the C-value would exceed 0.55 due to deteriorating performance of the rain garden).
Table A11.
Required treated catchment areas and rain garden sizes to achieve C = 0.55 for the various land use types (percentages in brackets represents the upper limits beyond which the C-value would exceed 0.55 due to deteriorating performance of the rain garden).
| Land Use Type | Rain Garden Area (% of Total Site Area) | ||||||
|---|---|---|---|---|---|---|---|
| 4% | 5% | 6% | 7% | 8% | 9% | 10% | |
| Residential (C = 0.88) | N.A. | N.A. | 45.2% (56.4%) | 42.4% (74.4%) | 41.6% (87.8%) | 41.5% (87.8%) | 41.3% (87.8%) |
| Mixed residential–commercial (C = 0.925) | N.A. | N.A. | 45.8% (55.0%) | 43.3% (72.2%) | 41.9% (87.4%) | 41.8% (87.4%) | 41.4% (87.4%) |
| Commercial (C = 0.97) | N.A. | N.A. | 47.2% (55.0%) | 43.9% (72.1%) | 43.3% (85.5%) | 42.8% (85.5%) | 41.8% (85.5%) |
From the results, it can be seen that a minimum rain garden size of 6% (of the total site area) is needed for all three land use types, with the corresponding required (lower bound) treated catchment areas of 45.2%, 45.8% and 47.2% for the residential, mixed and commercial land use types, respectively. There is thus an increase in the required treated catchment area (for a particular rain garden size) when the runoff coefficient of the land use type increases. The required treated catchment area also decreases with increasing rain garden size for all three land use types. In other words, less runoff needs to be routed to a bigger rain garden as compared to a smaller one to achieve the effective C-value of 0.55.
If there is any reason the treated catchment area needs to be increased beyond the lower bound percentage areas recommended (e.g., for runoff water quality treatment purposes), it needs to be noted that increasing the area beyond the upper limit as specified in brackets in Table A11 would cause the effective C-value to exceed 0.55 due to deteriorating runoff reduction performance; these upper limits are beyond the optimum treated catchment area for the various rain gardens. The upper limits for rain garden sizes of 7–8% were estimated using linear interpolation as they exceeded the treated catchment area range being studied. Also, the upper limits for rain garden sizes of 9–10% were not able to be determined as their optimum treated catchment area were not reached within the range of treated catchment areas studied, and were set to be equal to the upper limits of rain garden size 8% to be on the cautious side. Nevertheless, it is noted that the treated catchment area upper limits for rain garden sizes of 7% and beyond are quite high, and should typically not be exceeded by developments.
From this study, the rain garden sizes which are recommended to comply with the runoff control legislation are also deemed to be reasonable and practical. The recommended minimum rain garden size of 6% is only slightly higher than the 4–5% (of equivalent impervious catchment area) which is recommended by PUB’s Engineering Procedures for ABC Waters Design Features in order to meet the storm water quality objectives for Singapore [4]. The 6% is also comparable to the results of Waterway Ridges with optimised orifice outlets, whereby a C-value of 0.5298 was obtained with an ABC Waters design feature area (excluding batter slopes for the rain gardens) of 5.4% the total precinct area.
It is noted that the recommended treated catchment areas ranging from 41.3% to 47.2% (depending on the rain garden size and land use type) are slightly higher than the 35% (of total site area) that will yield the maximum points for the criteria on “incorporation of ABC Waters design features to treat surface runoff from site” under PUB’s ABC Water’s Certification Scheme [38], a scheme that serves to “provide recognition to public agencies and private developers who embrace the ABC Waters concept and incorporate ABC Waters design features in their developments” [39].
References
- Inter Governmental Panel on Climate Change. Summary for policymakers. In Climate Change 2013: The Physical Science Basis; Contribution of Working Group I to the Fifth Assessment Report of the Intergovernmental Panel on Climate Change; Stocker, T.F., Qin, D., Plattner, G.-K., Tignor, M., Allen, S.K., Boschung, J., Nauels, A., Xia, Y., Bex, V., Midgley, P.M., Eds.; IPCC: Geneva, Switzerland, 2013. [Google Scholar]
- World Bank Group. Climate Change Knowledge Portal. Available online: http://sdwebx.worldbank.org/climateportal/index.cfm?page=country_historical_climate&ThisRegion=Asia&ThisCCode=SGP (accessed on 6 May 2017).
- United Nations. The World’s Cities in 2016—Data Booklet; ST/ESA/SER.A/392; Department of Economic and Social Affairs, Population Division: New York, NY, USA, 2016. [Google Scholar]
- PUB Singapore’s National Water Agency. Active, Beautiful, Clean Waters Design Guidelines; PUB Singapore’s National Water Agency: Singapore, 2014.
- Fletcher, T.D.; Shuster, W.; Hunt, W.F.; Ashley, R.; Butler, D.; Arthur, S.; Trowsdale, S.; Barraud, S.; Semadeni-Davies, A.; Bertrand-Krajewski, J.-L.; et al. SUDS, LID, BMPS, WSUD and more—The evolution and application of terminology surrounding urban drainage. Urban Water J. 2015, 12, 525–542. [Google Scholar] [CrossRef]
- PUB Singapore’s National Water Agency. Managing Urban Runoff—Drainage Handbook, 1st ed.; Singapore’s National Water Agency and Institution of Engineers: Singapore, 2013.
- PUB Singapore’s National Water Agency. Code of Practice on Surface Water Drainage, 6th ed.; Addendum No. 1: Jun 2013; PUB Singapore’s National Water Agency: Singapore, 2011. Available online: http://www.pub.gov.sg/general/Documents/CP2013/COP_Final.pdf (accessed on 11 September 2014).
- PUB Singapore’s National Water Agency. Engineering Procedures for ABC Waters Design Features; PUB Singapore’s National Water Agency: Singapore, 2014.
- Zhou, Q.; Panduro, T.E.; Thorsen, B.J.; Arnbjerg-Nielsen, K. Adaption to Extreme Rainfall with Open Urban Drainage System: An Integrated Hydrological Cost-Benefit Analysis. Environ. Manag. 2013, 51, 586–601. [Google Scholar] [CrossRef] [PubMed] [Green Version]
- Wang, W.; Zhao, Z.; Qin, H. Hydrological effect assessment of low impact development for urbanized area based on SWMM. Acta Sci. Nat. Univ. Pekin. 2012, 48, 303–309. [Google Scholar]
- Jia, H.; Lu, Y.; Shaw, L.Y.; Chen, Y. Planning of LID–BMPs for urban runoff control: The case of Beijing Olympic Village. Sep. Purif. Technol. 2012, 84, 112–119. [Google Scholar] [CrossRef]
- Tang, Y. Study of urban stormwater runoff BMPs Planning with support of SUSTAIN system. In School of Environment; Tsinghua University: Beijing, China, 2010. [Google Scholar]
- Mugume, S.N.; Melville-Shreeve, P.; Gomez, D.; Butler, D. Multifunctional urban flood resilience enhancement strategies. Proc. Inst. Civ. Eng. Water Manag. 2016, 169, 115–127. [Google Scholar] [CrossRef]
- Jato-Espino, D.; Charlesworth, S.; Bayon, J.; Warwick, F. Rainfall–Runoff Simulations to Assess the Potential of SuDS for Mitigating Flooding in Highly Urbanized Catchments. Int. J. Environ. Res. Public Health 2016, 13, 149. [Google Scholar] [CrossRef] [PubMed]
- Dietz, M.E.; Clausen, J.C. A Field Evaluation of Rain Garden Flow and Pollutant Treatment. Water Air Soil Pollut. 2005, 167, 123–138. [Google Scholar] [CrossRef]
- Davis, A.P. Field Performance of Bioretention: Hydrology Impacts. J. Hydrol. Eng. 2008, 13, 90–95. [Google Scholar] [CrossRef]
- Hunt, W.F.; Smith, J.T.; Jadlocki, S.J.; Hathaway, J.M.; Eubanks, P.R. Pollutant Removal and Peak Flow Mitigation by a Bioretention Cell in Urban Charlotte, N.C. J. Environ. Eng. 2008, 134, 403–408. [Google Scholar] [CrossRef]
- Winston, R.J.; Dorsey, J.D.; Hunt, W.F. Quantifying volume reduction and peak flow mitigation for three bioretention cells in clay soils in northeast Ohio. Sci. Total Environ. 2016, 553, 83–95. [Google Scholar] [CrossRef] [PubMed]
- Davis, A.P.; Hunt, W.F.; Traver, R.G.; Clar, M. Bioretention Technology: Overview of Current Practice and Future Needs. J. Environ. Eng. 2009, 135, 109–117. [Google Scholar] [CrossRef]
- Texas A&M Agrilife Extension. Texas A&M AgriLife Ecological Engineering Program. Available online: http://agrilife.org/lid/projects/lid/rain-garden-and-detention-pond (accessed on 2 July 2017).
- Liu, J.; Sample, D.; Bell, C.; Guan, Y. Review and Research Needs of Bioretention Used for the Treatment of Urban Stormwater. Water 2014, 6, 1069–1099. [Google Scholar] [CrossRef]
- Hatt, B.E.; Fletcher, T.D.; Deletic, A. Hydrologic and pollutant removal performance of stormwater biofiltration systems at the field scale. J. Hydrol. 2009, 365, 310–321. [Google Scholar] [CrossRef]
- Lucke, T.; Nichols, P.W.B. The pollution removal and stormwater reduction performance of street-side bioretention basins after ten years in operation. Sci. Total Environ. 2015, 536, 784–792. [Google Scholar] [CrossRef] [PubMed]
- Atelier Dreiseitl Asia Pte Ltd. Hydraulic Calculation Report for Pilot ABC Waters Project at Punggol East c39 Housing Precinct and Common Green; PUB Singapore’s National Water Agency: Singapore, 2015.
- Meteorological Service Singapore. Climate of Singapore. Available online: http://www.weather.gov.sg/climate-climate-of-singapore (accessed on 3 July 2017).
- National Environment Agency. Weather Statistics. Available online: http://www.nea.gov.sg/weather-climiate./climate/weather-statistics (accessed on 3 July 2017).
- Guo, J.C.Y. Cap-Orifice as a Flow Regulator for Rain Garden Design. J. Irrig. Drain. Eng. 2012, 138, 198–202. [Google Scholar] [CrossRef]
- United States Environmental Protection Agency. Storm Water Management Model (SWMM). 2014. Available online: http://www2.epa.gov/water-research/storm-water-management-model-swmm (accessed on 3 March 2015).
- Gironás, J.; Roesner, L.A.; Davis, J.; Rossman, L.A.; Supply, W. Storm Water Management Model Applications Manual; National Risk Management Research Laboratory, Office of Research and Development, US Environmental Protection Agency: Cincinnati, OH, USA, 2009.
- Aron, G.; Kibler, D.F. Pond Sizing for Rational Formula Hydrographs. J. Am. Water Res. Assoc. 1990, 26, 255–258. [Google Scholar] [CrossRef]
- Shuy, E.B. Derivation of Hydrological Curves for ABC Waters Design Features; PUB Singapore’s National Water Agency: Singapore, 2012.
- Goh, X.P. Broader environmental impact of runoff control using SuDS in the context of urban development in Singapore. In Water Science and Engineering; UNESCO-IHE Institute for Water Education: Delft, The Netherlands, 2015. [Google Scholar]
- Australian Government. Stakeholder Annual Report; Cooperative Research Centre for Water Sensitive Cities Ltd.: Clayton, Australia, 2017.
- Pathirana, A. SWMM5-EA—A tool for learning optimization of urban drainage and sewerage systems with genetic algorithms. In Proceedings of the 11th Innternational Conference on Hydroinformatics, New York, NY, USA, 17–21 August 2014; CUNY Academic Works: New York, NY, USA, 2014. [Google Scholar]
- Storn, R. On the usage of differential evolution for function optimization. Presented at the North American Fuzzy Information Processing Society, Berkeley, CA, USA, 19–22 June 1996. [Google Scholar]
- Goh, X.P.; Radhakrishnan, M.; Pathirana, A.; Zevenbergen, C. Effectiveness of runoff control legislation and Active, Beautiful, Clean (ABC) Waters design features in Singapore. Water 2017. submitted. [Google Scholar]
- Poullain, J. Estimating Storm Water Runoff; PDH online; PDH Centre: Fairfax, VA, USA, 2012. [Google Scholar]
- PUB Singapore’s National Water Agency. Certification Critieria. 2017. Available online: https://www.pub.gov.sg/abcwaters/certification/criteria (accessed on 6 June 2017).
- PUB Singapore’s National Water Agency. Certification. 2017. Available online: https://www.pub.gov.sg/abcwaters/certification (accessed on 6 June 2017).
Figure 1.
Annual maximum hourly rainfall intensities in Singapore based on records from 28 stations from 1980 to 2012 (blue line/dots), with trend towards higher rainfall intensities (pink line) [6].
Figure 1.
Annual maximum hourly rainfall intensities in Singapore based on records from 28 stations from 1980 to 2012 (blue line/dots), with trend towards higher rainfall intensities (pink line) [6].

Figure 2.
Overview plan and indicative drainage flow paths in Waterway Ridges.
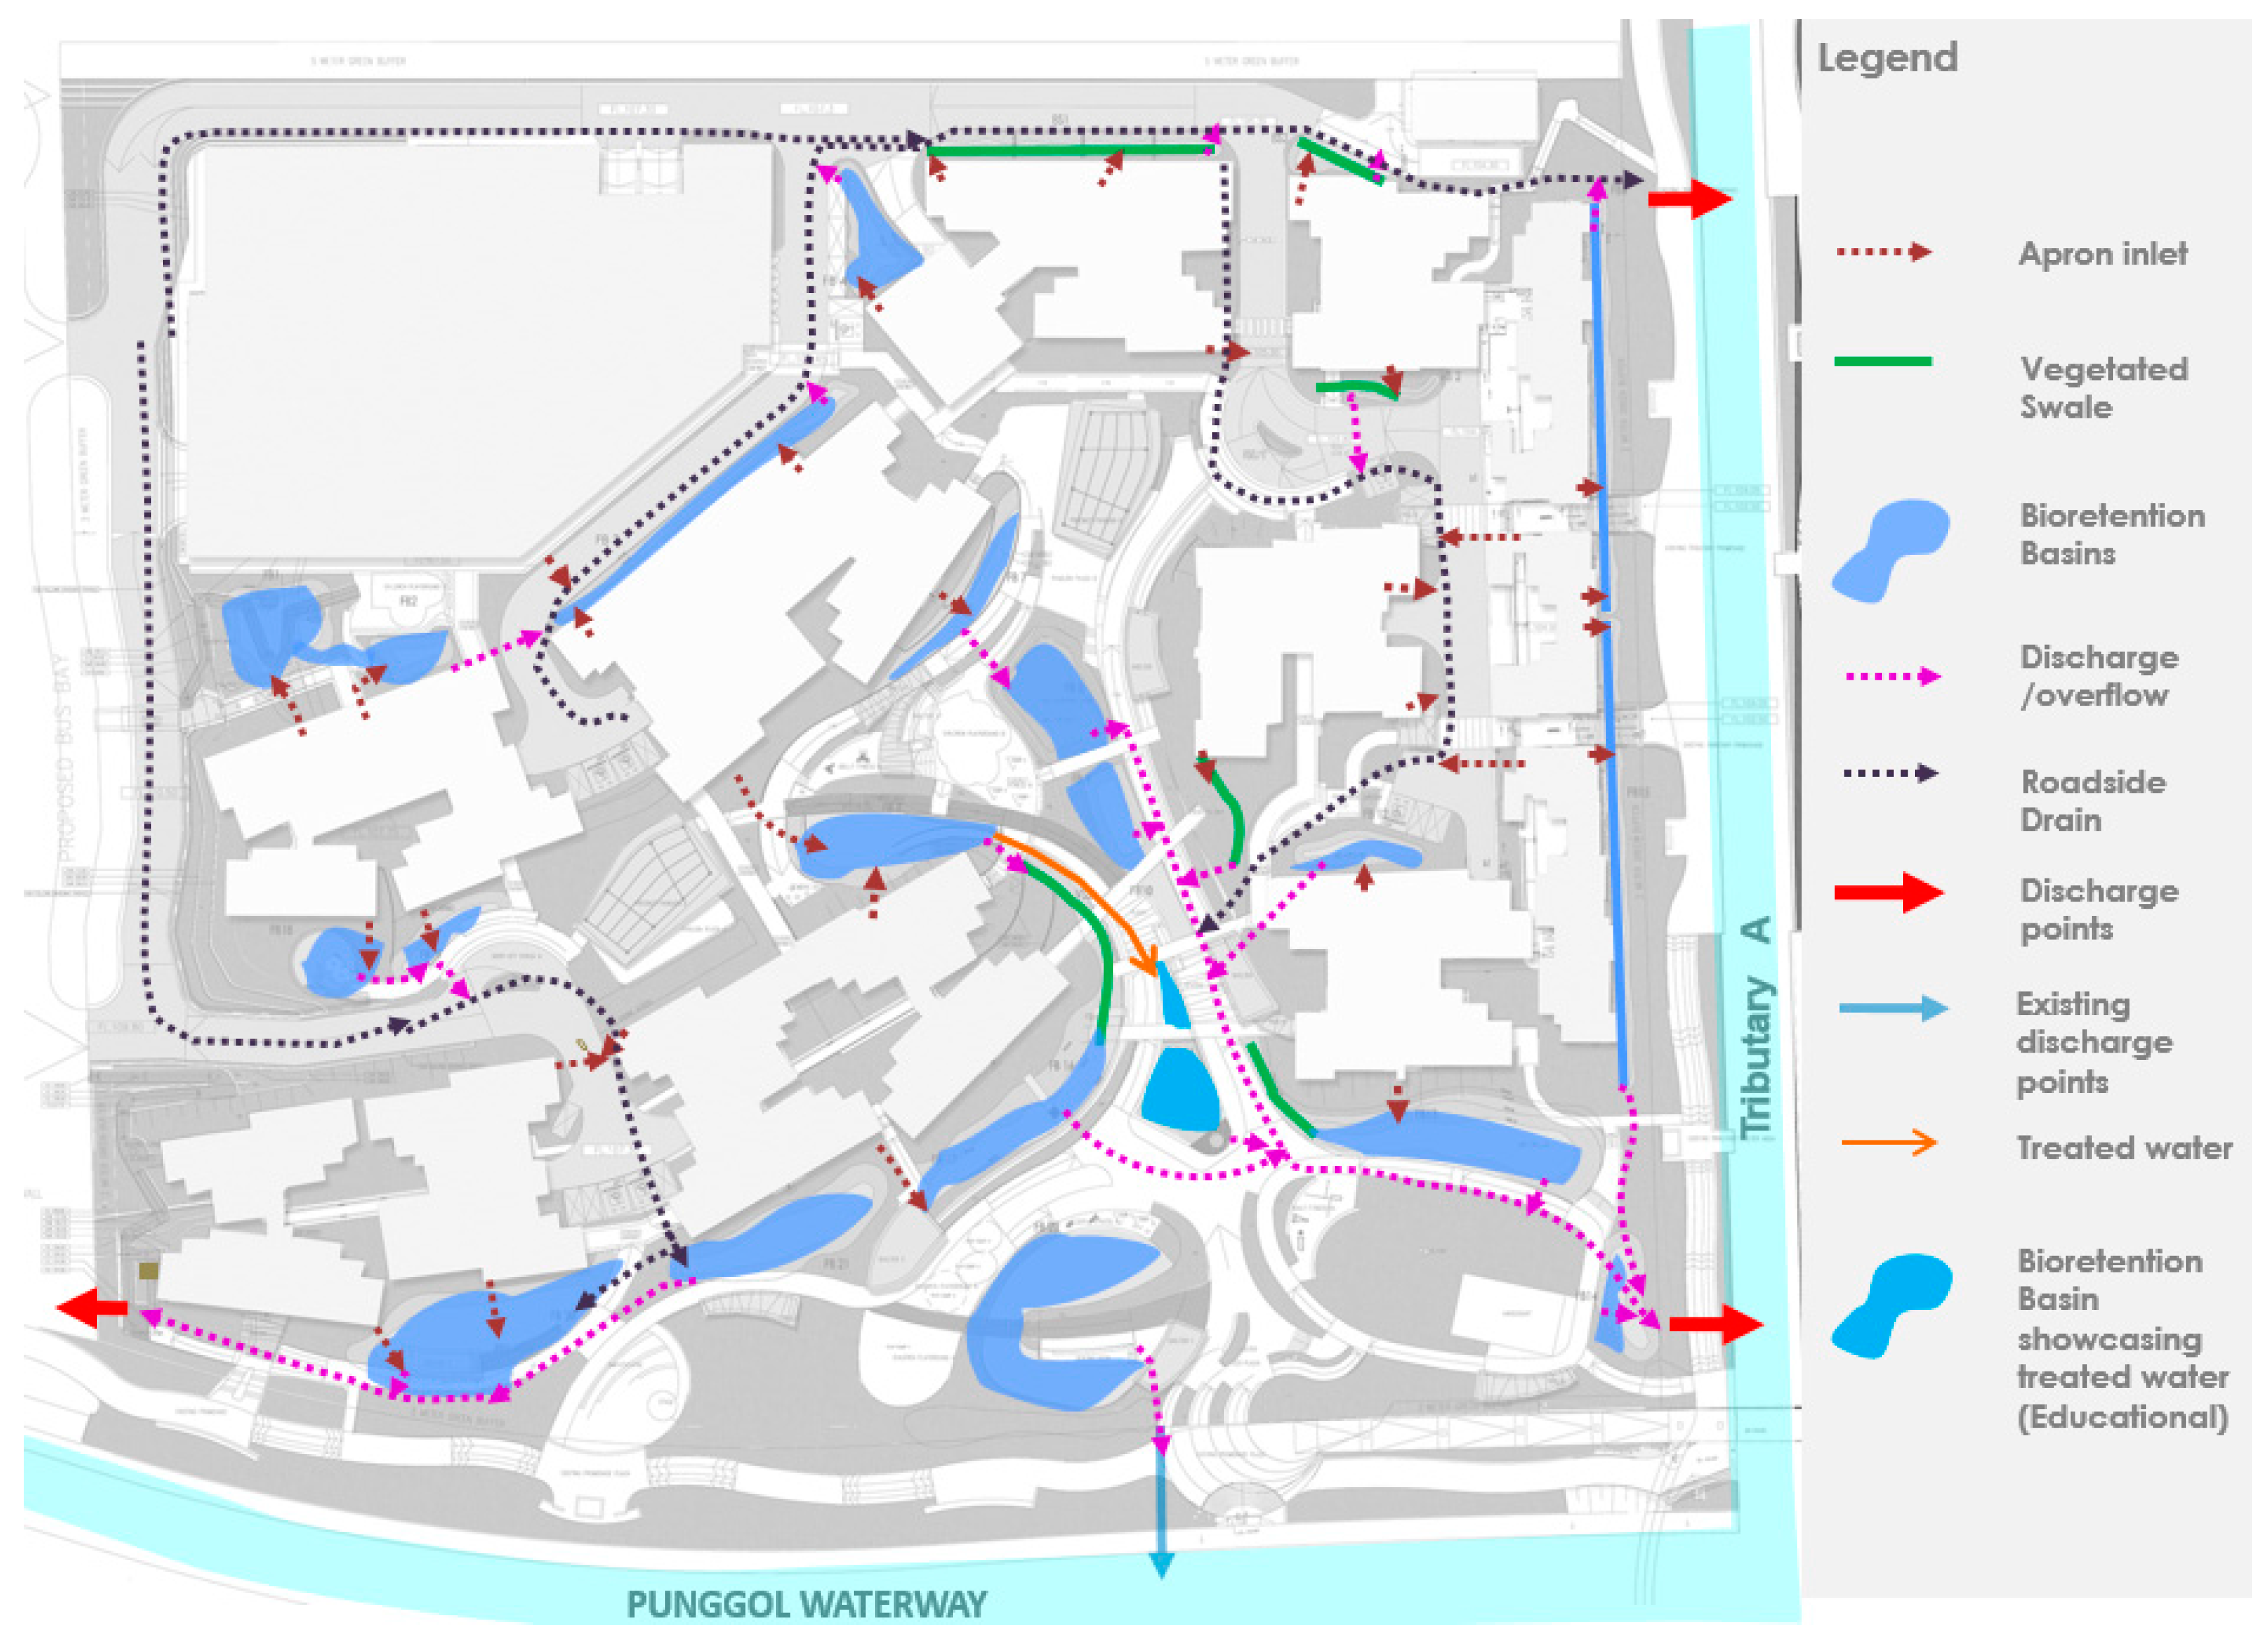
Figure 3.
Cross section of a rain garden with overflow manhole in Waterway Ridges.
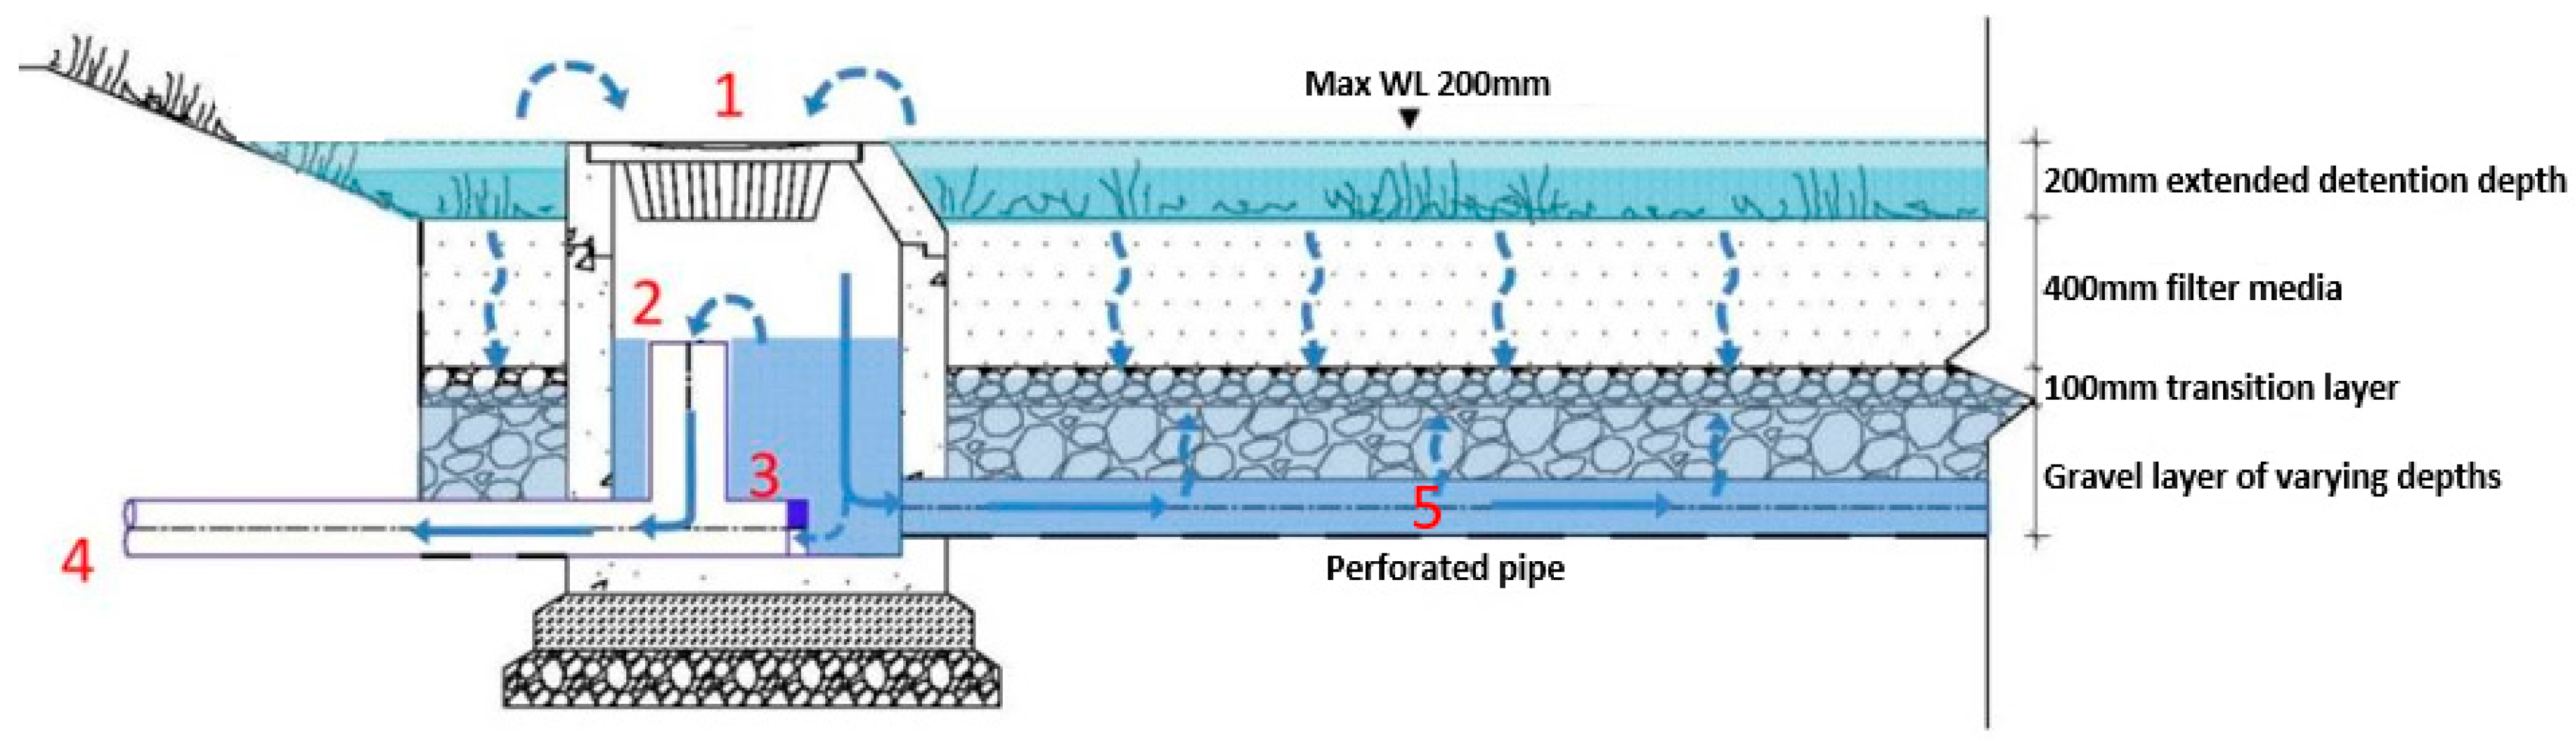
Figure 4.
Photos of bioretention lawns in Waterway Ridges.
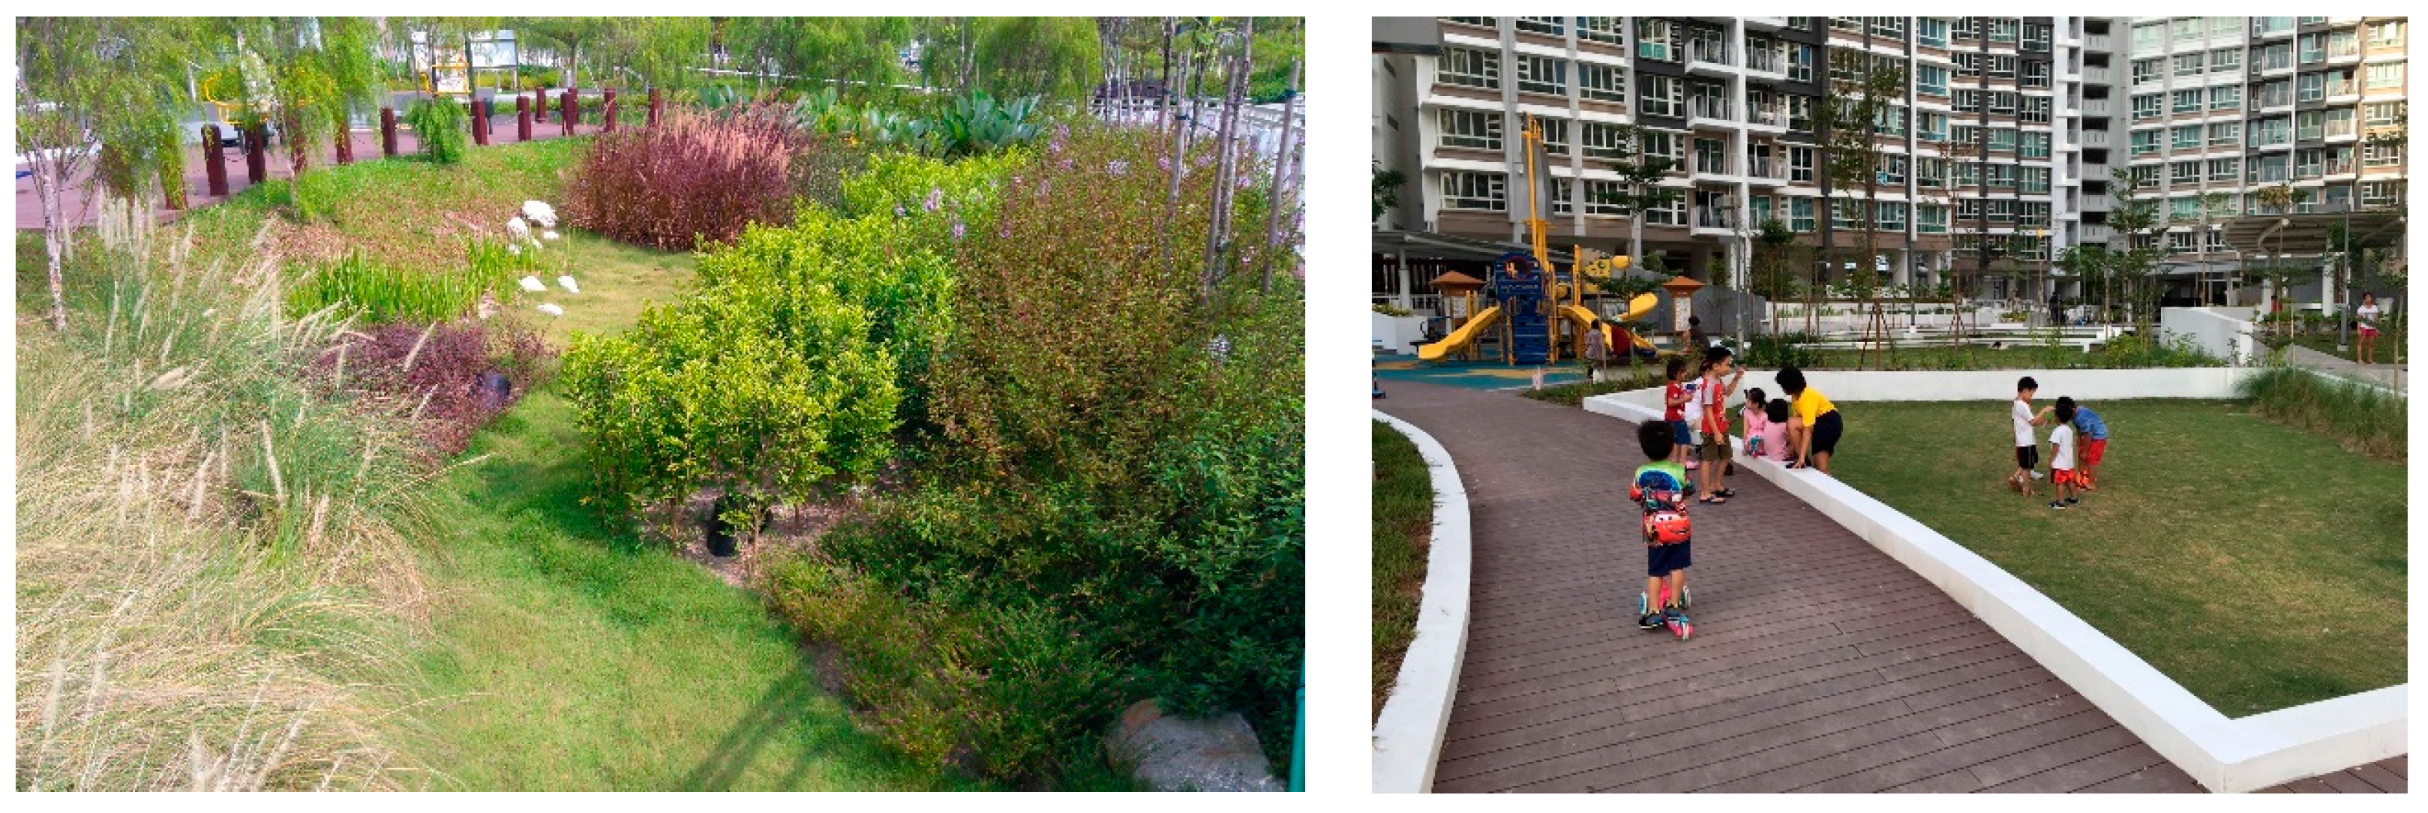
Figure 5.
Photos of vegetated swales in Waterway Ridges.

Figure 6.
Typical cross section of a gravel swale in Waterway Ridges.
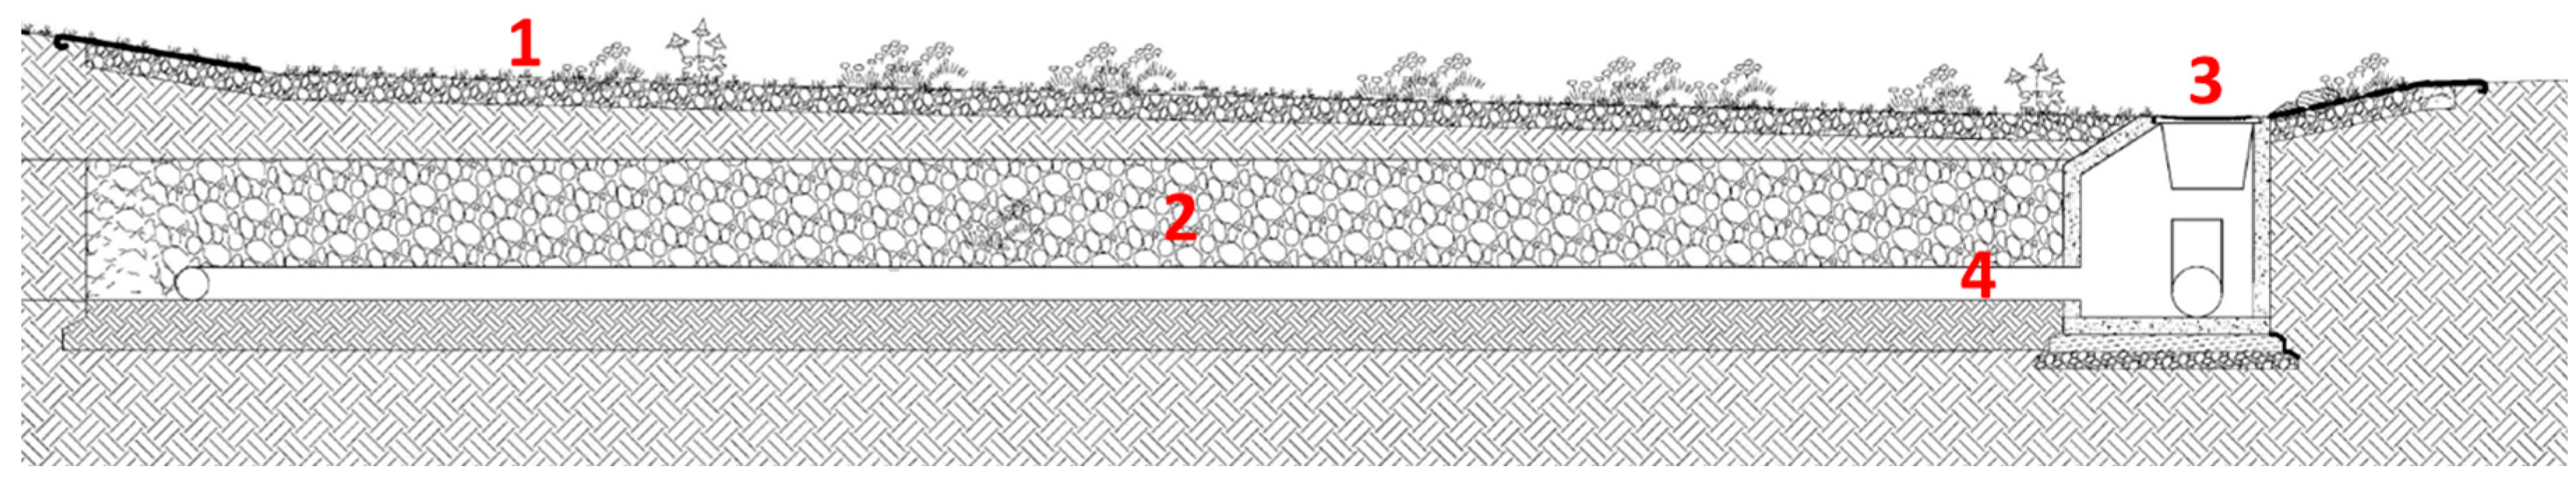
Figure 7.
General workflow for the research methodology.
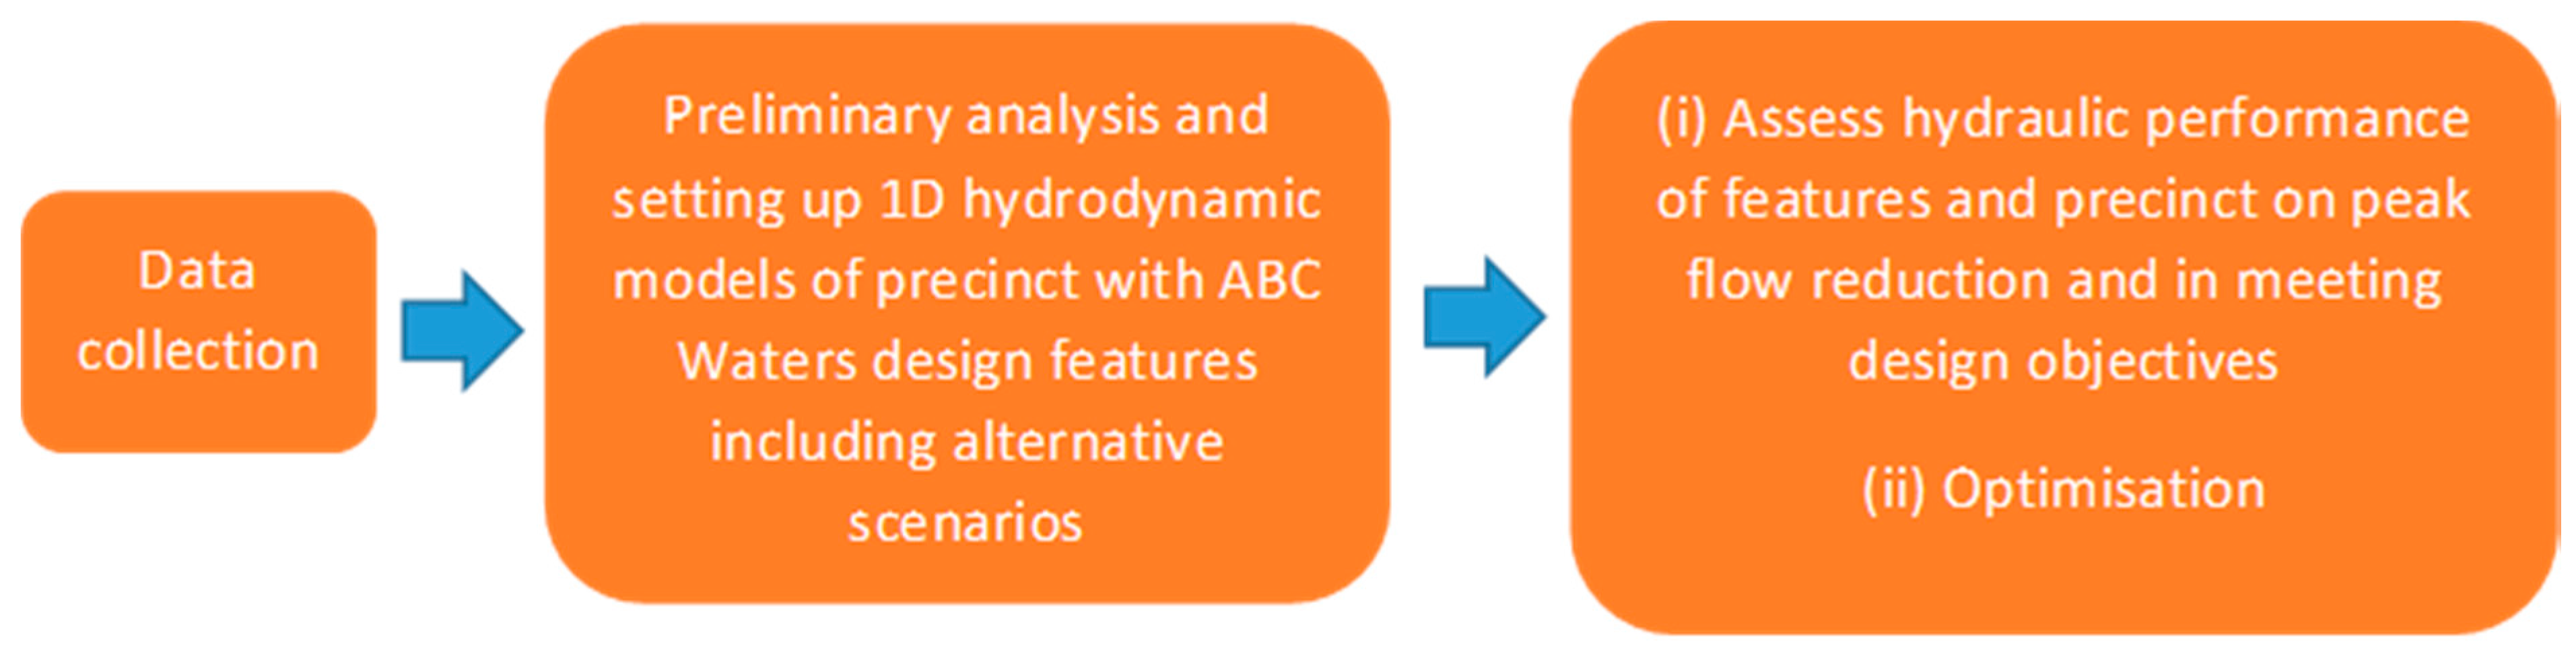
Figure 8.
The completed 1D SWMM model for the precinct (in addition to the features whose colour scheme follows that of Figure 2, the other four colours depict the four main subcatchments in the precinct).
Figure 8.
The completed 1D SWMM model for the precinct (in addition to the features whose colour scheme follows that of Figure 2, the other four colours depict the four main subcatchments in the precinct).

Figure 10.
Outflow results of the precinct and alternative scenarios for the 10-year design storm.

Figure 11.
Outflow results of the precinct and alternative scenarios for the 3-month design storm.

Figure 12.
Peak flow difference between the best and worst performing scenario for the 3-month and 10-year design storms.
Figure 12.
Peak flow difference between the best and worst performing scenario for the 3-month and 10-year design storms.

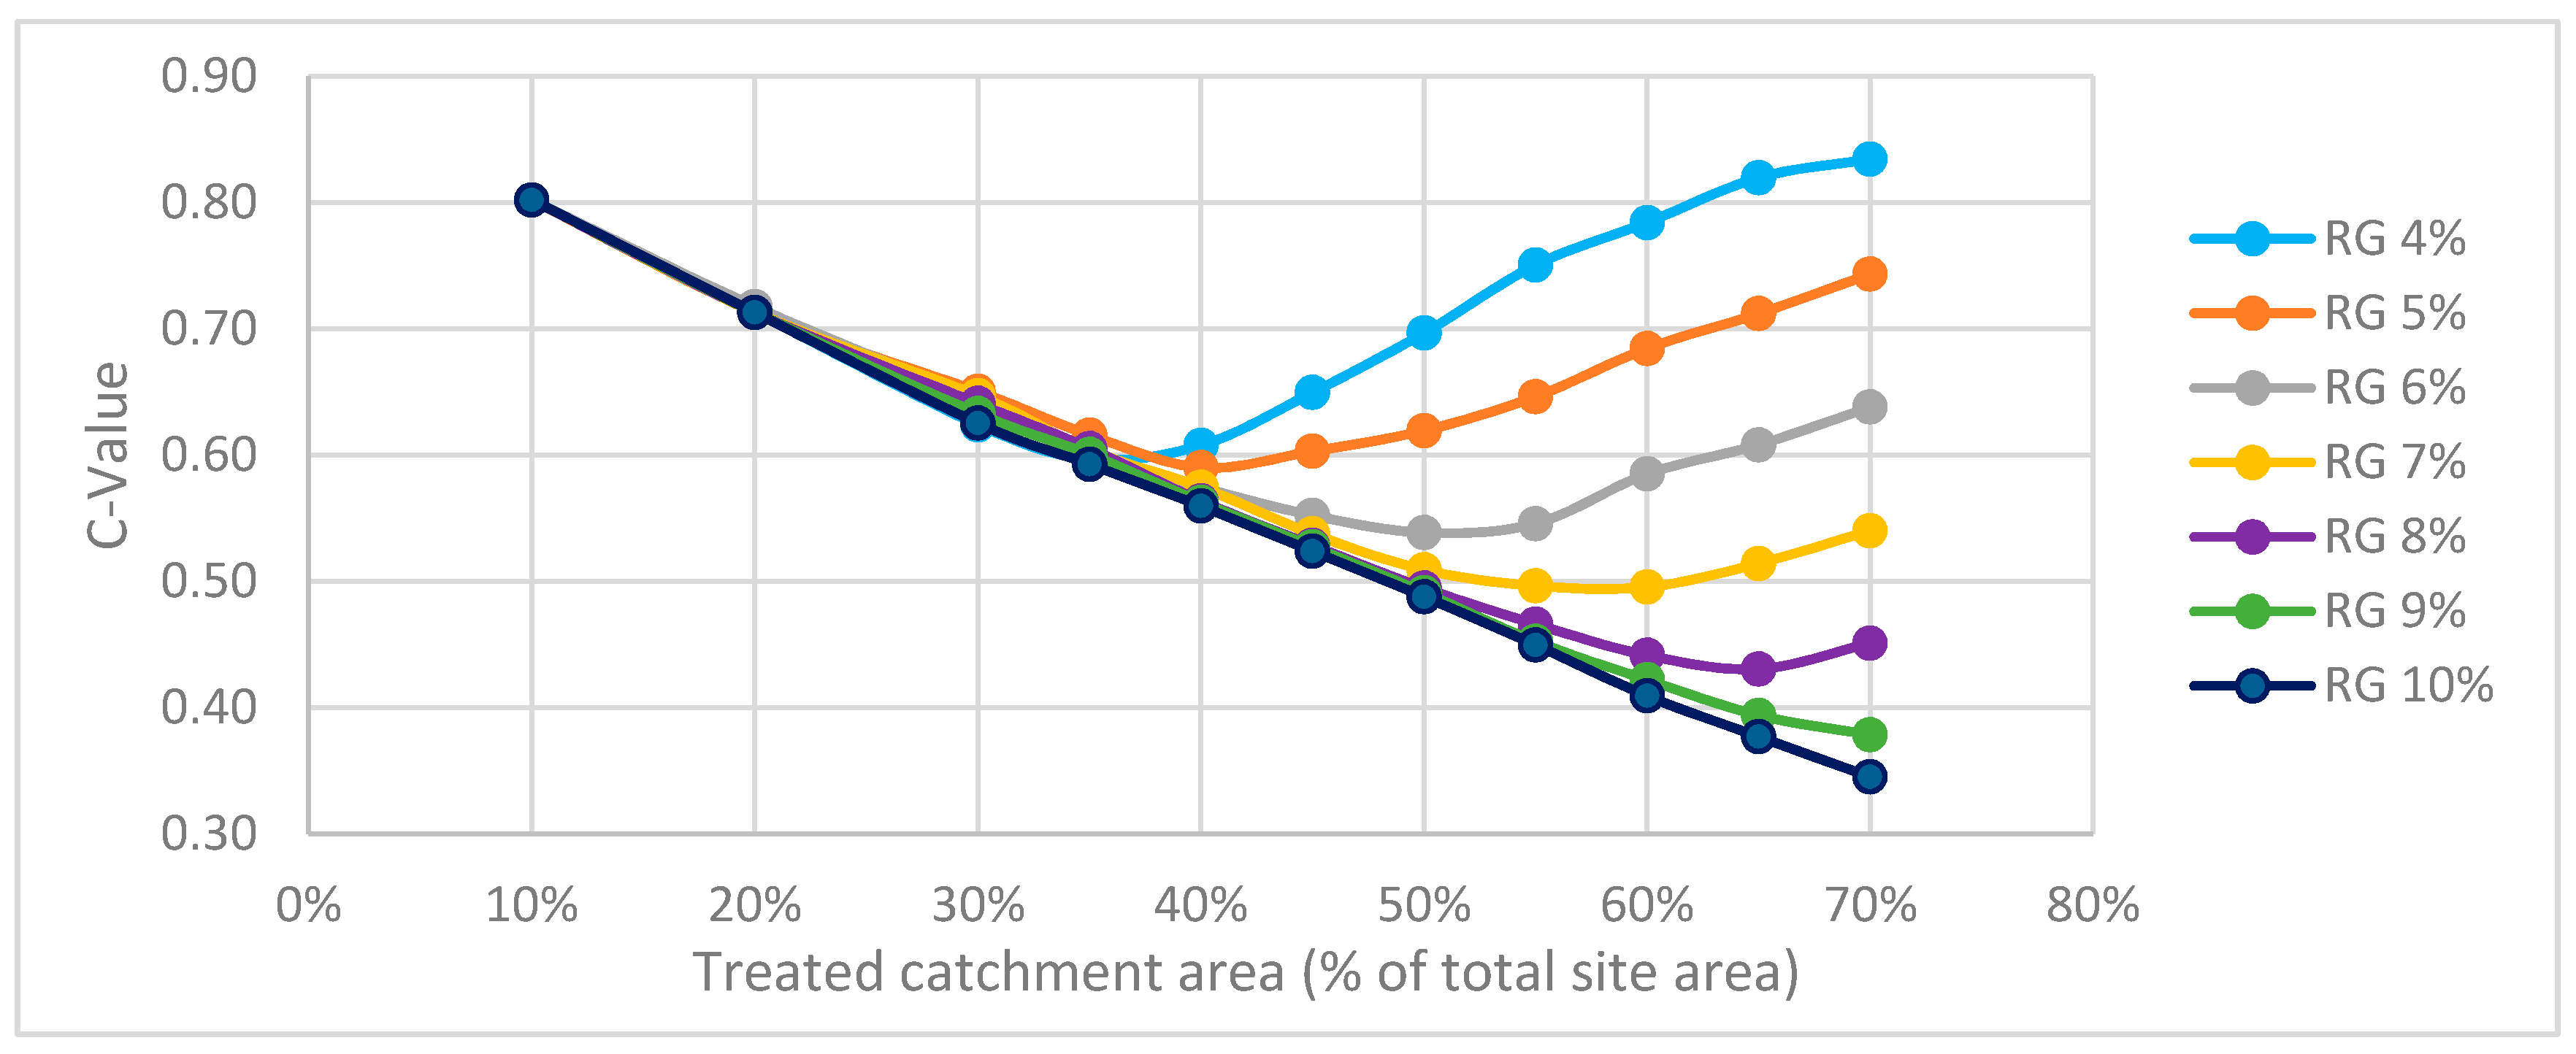
Figure 13.
Residential precinct results of effective C-value versus treated catchment area for various rain garden sizes for the separate optimisation study.
Figure 13.
Residential precinct results of effective C-value versus treated catchment area for various rain garden sizes for the separate optimisation study.
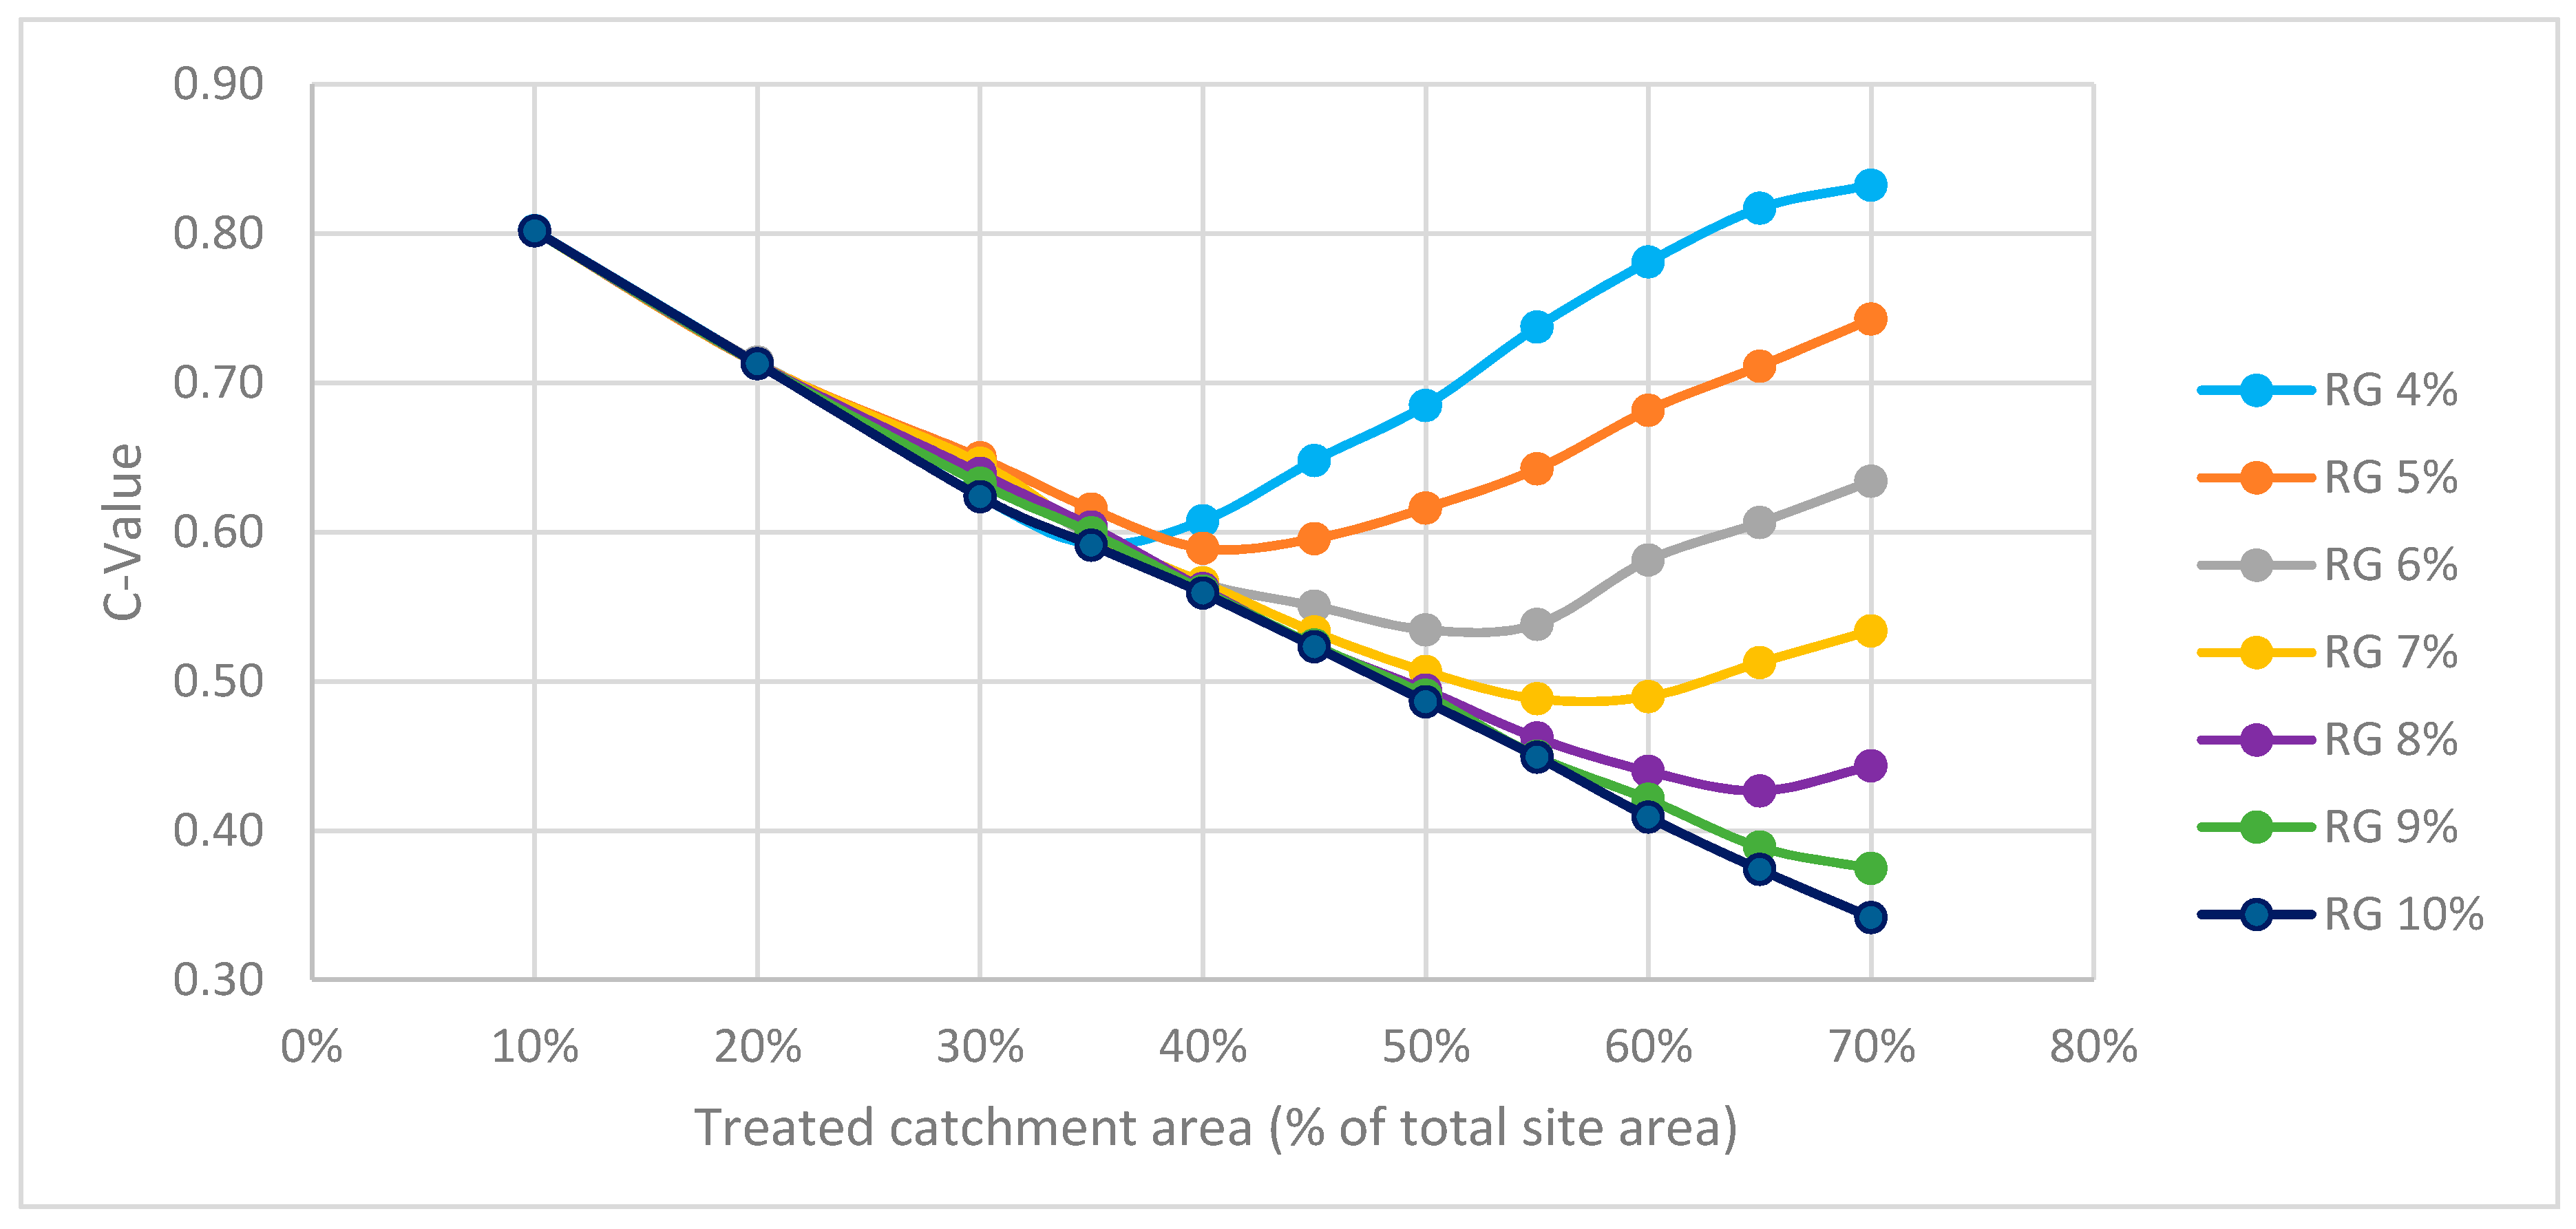
Table 1.
Summary of base and alternative scenarios of the precinct which were modelled and analysed.
Table 1.
Summary of base and alternative scenarios of the precinct which were modelled and analysed.
| S/N | Scenario Description | Remarks |
|---|---|---|
| 1 | Precinct without any detention (i.e., conventional design without ABC Waters features, gravel storage or orifice outlets) | To assess performance of the conventional design |
| 2 | Precinct without ABC Waters features but with orifice outlets from the respective subcatchments | To assess effectiveness of orifice outlets alone in reducing peak flow |
| 3 | Precinct with typical design of ABC Waters features implemented in Singapore (i.e., rain gardens and swales without orifice outlets and gravel storage layer) | To assess performance of the precinct if typical design of ABC Waters features was used |
| 4 | Precinct with ABC Waters features coupled with orifice outlets but without gravel storage | To determine importance of gravel storage in reducing peak flow |
| 5 | Precinct with ABC Waters features coupled with gravel storage but without orifice outlets | To determine importance of orifice outlets in reducing peak flow |
| 6 | Precinct with ABC Waters features coupled with gravel storage and orifice outlets | Base model that corresponds to the actual constructed precinct |
Table 2.
Outflow and effective C-value results of the precinct and alternative scenarios for the 10-year design storm.
Table 2.
Outflow and effective C-value results of the precinct and alternative scenarios for the 10-year design storm.
| S/N | Label | Scenario | Qmax (m3/s) | Reduction * in Qmax | Effective C-Value |
|---|---|---|---|---|---|
| 1 | No treatment/detention | Precinct without any treatment or detention | 2.13 | 0% | 0.89 |
| 2 | Orifice only | Precinct with orifice outlets only | 2.13 | 0% | 0.89 |
| 3 | Typical ABC | Precinct with typical design of ABC Waters features implemented in Singapore | 1.85 | 13.0% | 0.77 |
| 4 | ABC + Orifice | Precinct with ABC Waters features and orifice outlets but without gravel storage | 1.86 | 12.6% | 0.77 |
| 5 | ABC + Storage | Precinct with ABC Waters features and gravel storage but without orifice outlets | 1.75 | 17.7% | 0.73 |
| 6 | ABC + Storage + Orifice | Precinct with ABC Waters features coupled with gravel storage and orifice outlet | 1.44 | 32.6% | 0.60 |
Note: * Relative to Scenario 1 of the precinct without any treatment or detention.
Table 3.
Peak flow reduction performance of the various feature types for the 10-year design storm.
| Design Feature Type | Average Peak Flow Reduction (%) | Average Normalised Peak Flow Reduction (%) |
|---|---|---|
| Rain gardens * | 39% | 47% |
| Gravel swales | 9% | 25% |
| Vegetated swales | 0% | 0% |
Note: * Excluding rain gardens without orifice outlets (i.e., rain gardens FB6, FB10, FB15 and FB17).
Table 4.
Comparison of the outflow and effective C-value results of the precinct and alternative scenarios for the 3-month and 10-year design storms.
Table 4.
Comparison of the outflow and effective C-value results of the precinct and alternative scenarios for the 3-month and 10-year design storms.
| S/N | Scenario | 3-Month Design Storm | 10-Year Design Storm | ||||
|---|---|---|---|---|---|---|---|
| Qmax (m3/s) | Reduction * in Qmax (%) | C-Value | Qmax (m3/s) | Reduction * in Qmax (%) | C-Value | ||
| 1 | No treatment/detention | 0.78 | 0% | 0.89 | 2.13 | 0% | 0.89 |
| 2 | Orifice only | 0.78 | 0% | 0.89 | 2.13 | 0% | 0.89 |
| 3 | Typical ABC | 0.49 | 36.8% | 0.56 | 1.85 | 13.0% | 0.77 |
| 4 | ABC + Orifice | 0.49 | 37.3% | 0.56 | 1.86 | 12.6% | 0.77 |
| 5 | ABC + Storage | 0.44 | 43.2% | 0.51 | 1.75 | 17.7% | 0.73 |
| 6 | ABC + Storage + orifice | 0.42 | 46.7% | 0.47 | 1.44 | 32.6% | 0.60 |
Note: * Relative to Scenario 1 of the precinct without any treatment or detention.
© 2017 by the authors. Licensee MDPI, Basel, Switzerland. This article is an open access article distributed under the terms and conditions of the Creative Commons Attribution (CC BY) license (http://creativecommons.org/licenses/by/4.0/).
Share and Cite
MDPI and ACS Style
Yau, W.K.; Radhakrishnan, M.; Liong, S.-Y.; Zevenbergen, C.; Pathirana, A. Effectiveness of ABC Waters Design Features for Runoff Quantity Control in Urban Singapore. Water 2017, 9, 577. https://doi.org/10.3390/w9080577
AMA Style
Yau WK, Radhakrishnan M, Liong S-Y, Zevenbergen C, Pathirana A. Effectiveness of ABC Waters Design Features for Runoff Quantity Control in Urban Singapore. Water. 2017; 9(8):577. https://doi.org/10.3390/w9080577
Chicago/Turabian StyleYau, Wing Ken, Mohanasundar Radhakrishnan, Shie-Yui Liong, Chris Zevenbergen, and Assela Pathirana. 2017. "Effectiveness of ABC Waters Design Features for Runoff Quantity Control in Urban Singapore" Water 9, no. 8: 577. https://doi.org/10.3390/w9080577
Note that from the first issue of 2016, this journal uses article numbers instead of page numbers. See further details here.