Sediment-Water Methane Flux in a Eutrophic Pond and Primary Influential Factors at Different Time Scales


1
Circular Agriculture Research Center, Jiangsu Academy of Agricultural Sciences, 50 Zhongling Street, Nanjing 210014, China
2
Institute of Agricultural Resources and Environment, Jiangsu Academy of Agricultural Sciences, 50 Zhongling Street, Nanjing 210014, China
*
Authors to whom correspondence should be addressed.
Water 2017, 9(8), 601; https://doi.org/10.3390/w9080601
Submission received: 11 June 2017
/
Revised: 21 July 2017
/
Accepted: 10 August 2017
/
Published: 14 August 2017
(This article belongs to the Special Issue Eutrophication of Waterways: An Old Problem with Modern Consequences)
Abstract
:Water bodies are major areas for methane release. Eutrophic water bodies may promote methane flux. The sediment-water interface is the major location for methane release, and studies on sediment-water interactions are necessary to regulate methane release in water. However, relevant studies on methane flux at the sediment-water interface are limited due to methodological difficulties. Using an innovative gas trapping device, this study investigated the seasonal characteristics and diel variation in summer methane flux from eutrophic water bodies and analyzed the correlations between temperature, dissolved oxygen (DO), different forms of nitrogen and the methane flux at different time scales. The results showed that methane flux in the eutrophic pond was high and had distinct seasonal variations and diel variations: the average value was 2.81 ± 0.19 mmol m−2 h−1 in summer, which was significantly greater than that in spring (0.62 ± 0.14 mmol m−2 h−1), autumn (0.63 ± 0.10 mmol m−2 h−1) (p < 0.01) and winter (approached zero). The diel characteristics of methane flux in summer exhibited a unimodal pattern of increase at night and decrease during the day. The correlation analysis showed that the sediment-water methane flux rate of the water body was significantly positively correlated with the temperature and NH4+ concentration and significantly negatively correlated with DO, NO3− and NO2− concentration. Meanwhile, among different time scales, the correlations between NO3−/NH4+ concentration and methane flux were the highest at the diel scale in summer (R2 = 0.68, 0.87 respectively) when the temperature and DO vibration was low and the relationship between temperature/DO and methane flux was poor (R2 = 0.45, 0.87 respectively). This study considered that higher NH4+-N and lower NO3−-N/NO2−-N content in eutrophic water could have an effect on the high methane flux in summer as well as the low dissolved oxygen content.
1. Introduction
Methane is an important greenhouse gas [1]. The atmospheric volume fraction of methane in air has been increasing since the Industrial Revolution [2,3]. Wetlands are important sources of methane release and have been extensively studied [4,5]. In recent years, especially in China, eutrophication in water has taken place along with the development of urbanization and agricultural production [6,7]. The eutrophication of a water body, containing higher nutrients and more dissolved organic carbon than oligotrophic areas, could accelerate the production and release of methane [8,9,10]. Therefore, a study of the characteristics of methane flux in eutrophic water bodies is necessary to identify ways to reduce methane release.
It is generally known that methane is produced in aquatic systems under anoxic conditions and is then released to the atmosphere [11,12]. After release from the sediment-water interface, methane can be consumed through two ways: one is to be oxidized by methanotrophs in the presence of dissolved oxygen (DO) in water bodies during diffusion [13,14]; and the other is during the initial state of its production, when it is consumed through the nitrate/nitrite reduction pathway (denitrification-dependent anaerobic methane oxidation) [15], which is considered to be more likely to occur than the sulfate reduction pathway, although both NO3/NO2− and SO42− exist in anaerobic areas of water bodies [16]. The denitrification methane oxidation reaction produces relatively safe N2 and CO2, which reduce the methane release to the atmosphere as well as the excessive nitrogen in water bodies at the same time, and therefore a good double effect of good water quality and air environment is achieved [17]. While previous studies paid more attention to the influence of temperature, dissolved oxygen, concentration of organic carbon, and pH value of water bodies on methane release, the role of excessive nitrogen in eutrophic water bodies has seldom been considered [11,12]. The relation between the different forms of nitrogen in eutrophic water bodies and methane release remains unclear.
To study the methane release of water bodies, a static chamber method and a method based on dissolved gas are commonly used [18,19]. Using the static chamber method, a closed chamber is placed upside-down on the water surface, a gas sample inside the chamber is collected every 15 min, and then the methane fraction in the gas sample is determined to estimate the methane flux rate. This method is usually used to investigate the net gas emission at the water-atmosphere interface but not the total flux at the mud-water boundary layer [14]. For the application of the method based on the dissolved gas determination, the lysimetric tube should be set ahead in the sediment; then, the lysimetric water in the tube is pumped for the determination of methane concentration. The whole operation should be very careful, otherwise, the sectional structure of the sediment will be disturbed, and the accuracy of the gas release determination will be affected [20]. Moreover, when the dissolved gas accumulates in the lysimetric water and exceeds the saturation point, the gas will burst from the water body in the form of bubbles [21,22], which cannot be detected by the method. The high concentration of nitrogen in urban eutrophic water bodies leads to vigorous growth of phytoplankton and algae, which may increase the dissolved oxygen in water bodies [23] and accelerate methane oxidation; the decomposition of fresh algae induces strong DO consumption and dissolved organic carbon input into the sediment, which could cause higher microbiological activity to produce a large methane flux in the form of gas bubbles. For these reasons, the conventional method involving dissolved gas studies in the upper parts of the sediment, or the static chamber method at the water surface for methane flux measurement as such are not applicable for the studies of all biotic or abiotic factors that control of methanogenesis and methanotrophy at the sediment-water boundary.
Recently, a gas trapping device (GTD) has been constructed and applied in situ to collect gas released from a water body [24]. The device is mainly composed of a bracing structure floating on the water surface, connecting to the gas-collecting dome submerged 5 cm above the sediment-water interface; a gas storage bottle is connected to the peak of the gas-collecting dome through a silicon tube. The methane released from the sediment-water interface could rise into the collecting dome through the open mouth at the bottom and temporarily accumulate at the inner top of the dome, and finally move into the storage bottle through the silicon tube at the peak mouth of the collecting dome. After the collection campaign, the volume and components of gas samples in the gas storage bottle were analyzed for further evaluation of gas flux. According to the GTD method, both bubble and diffusion gas can enter the collecting dome and be collected. The accuracy of the GTD method for determining diffusive and bubble gas flux at the sediment-water interface has been verified to be reliable [25,26]. Applying the GTD method, gas release from the sediment-water interface could be completely collected, and the control factors of methane flux can be assessed.
In this study, using the GTD method, the characteristics of the methane release in an urban eutrophic water body were in situ investigated, and the influence of different forms of nitrogen on methane flux was analyzed. In order to avoid damage occurring at the sediment structure, we choose water parameters 5 cm above the mud-water interface as the independent variables because they are in equilibrium with those in the top sediment [20,27]. We hypothesized that methane flux in eutrophic water could be greater than that in a normal water body, and excessive nitrogen in eutrophic water could have an effect on the methane flux.
2. Materials and Methods
2.1. Characteristics of the Eutrophic Water Body and Sampling Point Settings
The tested water body was a severely eutrophic pond, which was located in Nanjing, Jiangsu, China. In Nanjing, a subtropical humid monsoon climate prevails, with high temperatures and rain in summer, and low temperatures, humidity and less rainy in winter. The annual precipitation of the city is 1060.4 mm on average. The temperature range is between −5 and 38 °C, with an annual average temperature of 15.6 °C. The region where the river channel flows through is shown in Figure 1A, and the specific pond (1.5–2.0 m depth, 5400 m2 water area) is located in the middle of the channel (Figure 1B); dry branches and fallen leaves floating in the running water of the Purple Mountain bring considerable organic matter and abundant nutrients to the pond after flowing through the business center and the residential living quarters. Affected by the surrounding domestic sewage, industrial wastewater or pollution from agricultural fertilizers, the pond has always been in a eutrophic condition, causing a blue-green algal bloom during the spring and summer season. The total nitrogen (TN) and total phosphorus (TP) contents in water body are higher than 2.0 and 0.2 mg L−1, respectively, throughout the year.
Eutrophic ponds usually exist in the suburban cities in China and serve as a normal channel for releasing flood waters and the source of irrigation water for downstream farmland. Therefore, temporary fluctuation of water levels occurs during the flood season in summer or the irrigation season. The thickness of the sediment in the pond is deep in the middle and shallow near the inlet and outlet. Water isobaths of the pond are shown in Figure 1B. In this experiment, the central position a, b and c (Figure 1B) with a depth of 150 ± 5 cm were chosen to set the gas trapping device in the pond; the water flow at the three positions was usually stable, and the sediment thickness was homogeneous. There are three repetitions at each site position. Before this experiment, six top sediment (0–15 cm) samples were collected at the three positions using the Peterson core sampler. The main parameters of the sediment are shown in Table 1.
2.2. Sampling Campaign
The whole sampling campaign, including 30 sample collections in total, was arranged from June 2013 to May 2014, including summer, i.e., June, July and August; autumn, i.e., September, October and November; winter, i.e., December, January and February of the next year; and spring, i.e., March, April and May. Each sample collection was arranged on days without wind and rain or water fluctuation. Every sampling included the collection of gas and water samples. Gas sampling was based on a complete day as a cycle; the total amount of the released gas (diffuse and ebullitive gas) on different days was collected using the gas trapping device for the daily mean release rate calculation. The number of days of every sampling process depended on the season. Normally, in summer, the sampling cycle is the shortest (24 h) and increases in spring and autumn (2~4 days). As detection of the gas release was difficult because of low gas flux in winter, the flux rate was considered to be zero [10,24,26]. Water samples at the sediment-water interface were collected using the syringe and tube set 5 cm above the mud-water interface. To investigate the diel flux of CH4, preliminary tests were performed, and a similar pattern of diel CH4 flux and other water parameters (such as NH4+, NO3−, NO2−, and etc.) over several days was observed [28]. In this study, the day with the highest flux rate was chosen to study the diel characteristics of CH4 flux at the sediment-water interface and the correlations between CH4 flux and different forms of nitrogen. The investigation of the diel characteristics of CH4 flux was arranged in summer (10–11 August) when the flux rate reached the peak of the year, and the sampling interval was four hours. At the end of each sampling cycle, the gas sampling bottle was carefully taken down; then, the water sample at the sediment-water interface was sampled at the same time for nutrient and chlorophyll-a concentration analysis. The water temperature, dissolved oxygen and pH index at the mud-water interface were measured with a portable water quality monitoring system (YSI Pro Plus, YSI Inc., Yellow Springs, OH, USA). The gas sample was analyzed by gas chromatography (GC-2010, Shimadzu Corp., Kyoto, Japan) [26]. The methane flux was calculated as the total volume of gas and methane concentration in the gas sample; the detailed calculation is shown in Gao et al., (2013) [24]. The concentration of TP, NH4+-N, NO3−-N and NO2−-N in the water sample was analyzed by a flow analyzer (Skalar Analytical, Breda, Netherlands). The chlorophyll-a concentration was analyzed by a conventional method (US-EPA, 1983).
2.3. Statistical Analysis
Analysis of variance (ANOVA) and correlation analysis between gas flux and the main environmental factors were performed using Statistical software (SPSS18.0, Spss Inc., NewYork, NY, USA). In order to analyze the main factors that influence the CH4 flux at different time scales, a simple linear regression analysis was applied for testing the relationships between CH4 flux and other parameters (temperature, DO, NH4+, NO3− and NO2−). The vertical box plot graphs were created in Sigmaplot12.0 (Systat Software, Inc., San Jose, CA, USA).
3. Results and Analysis
3.1. Annual Variation Characteristics and Diel Variation of Methane Flux
Throughout the whole year, the methane flux rate in the severely eutrophic water body reached the peak value of 0 − 7.33 ± 2.09 mmol m−2 h−1 in summer, which was significantly higher than that in other seasons (Table 2). Diel characteristics of the methane flux under stable hydrologic conditions in summer demonstrated a unimodal pattern as a whole: the CH4 flux rate increased after sunrise (8:00–12:00), reached the highest rate during the period of 20:00 to 2:00 of the next morning; then decreased and reached the lowest between 8:00–12:00 of the second day (Table 2).
3.2. Environmental Parameter Variation
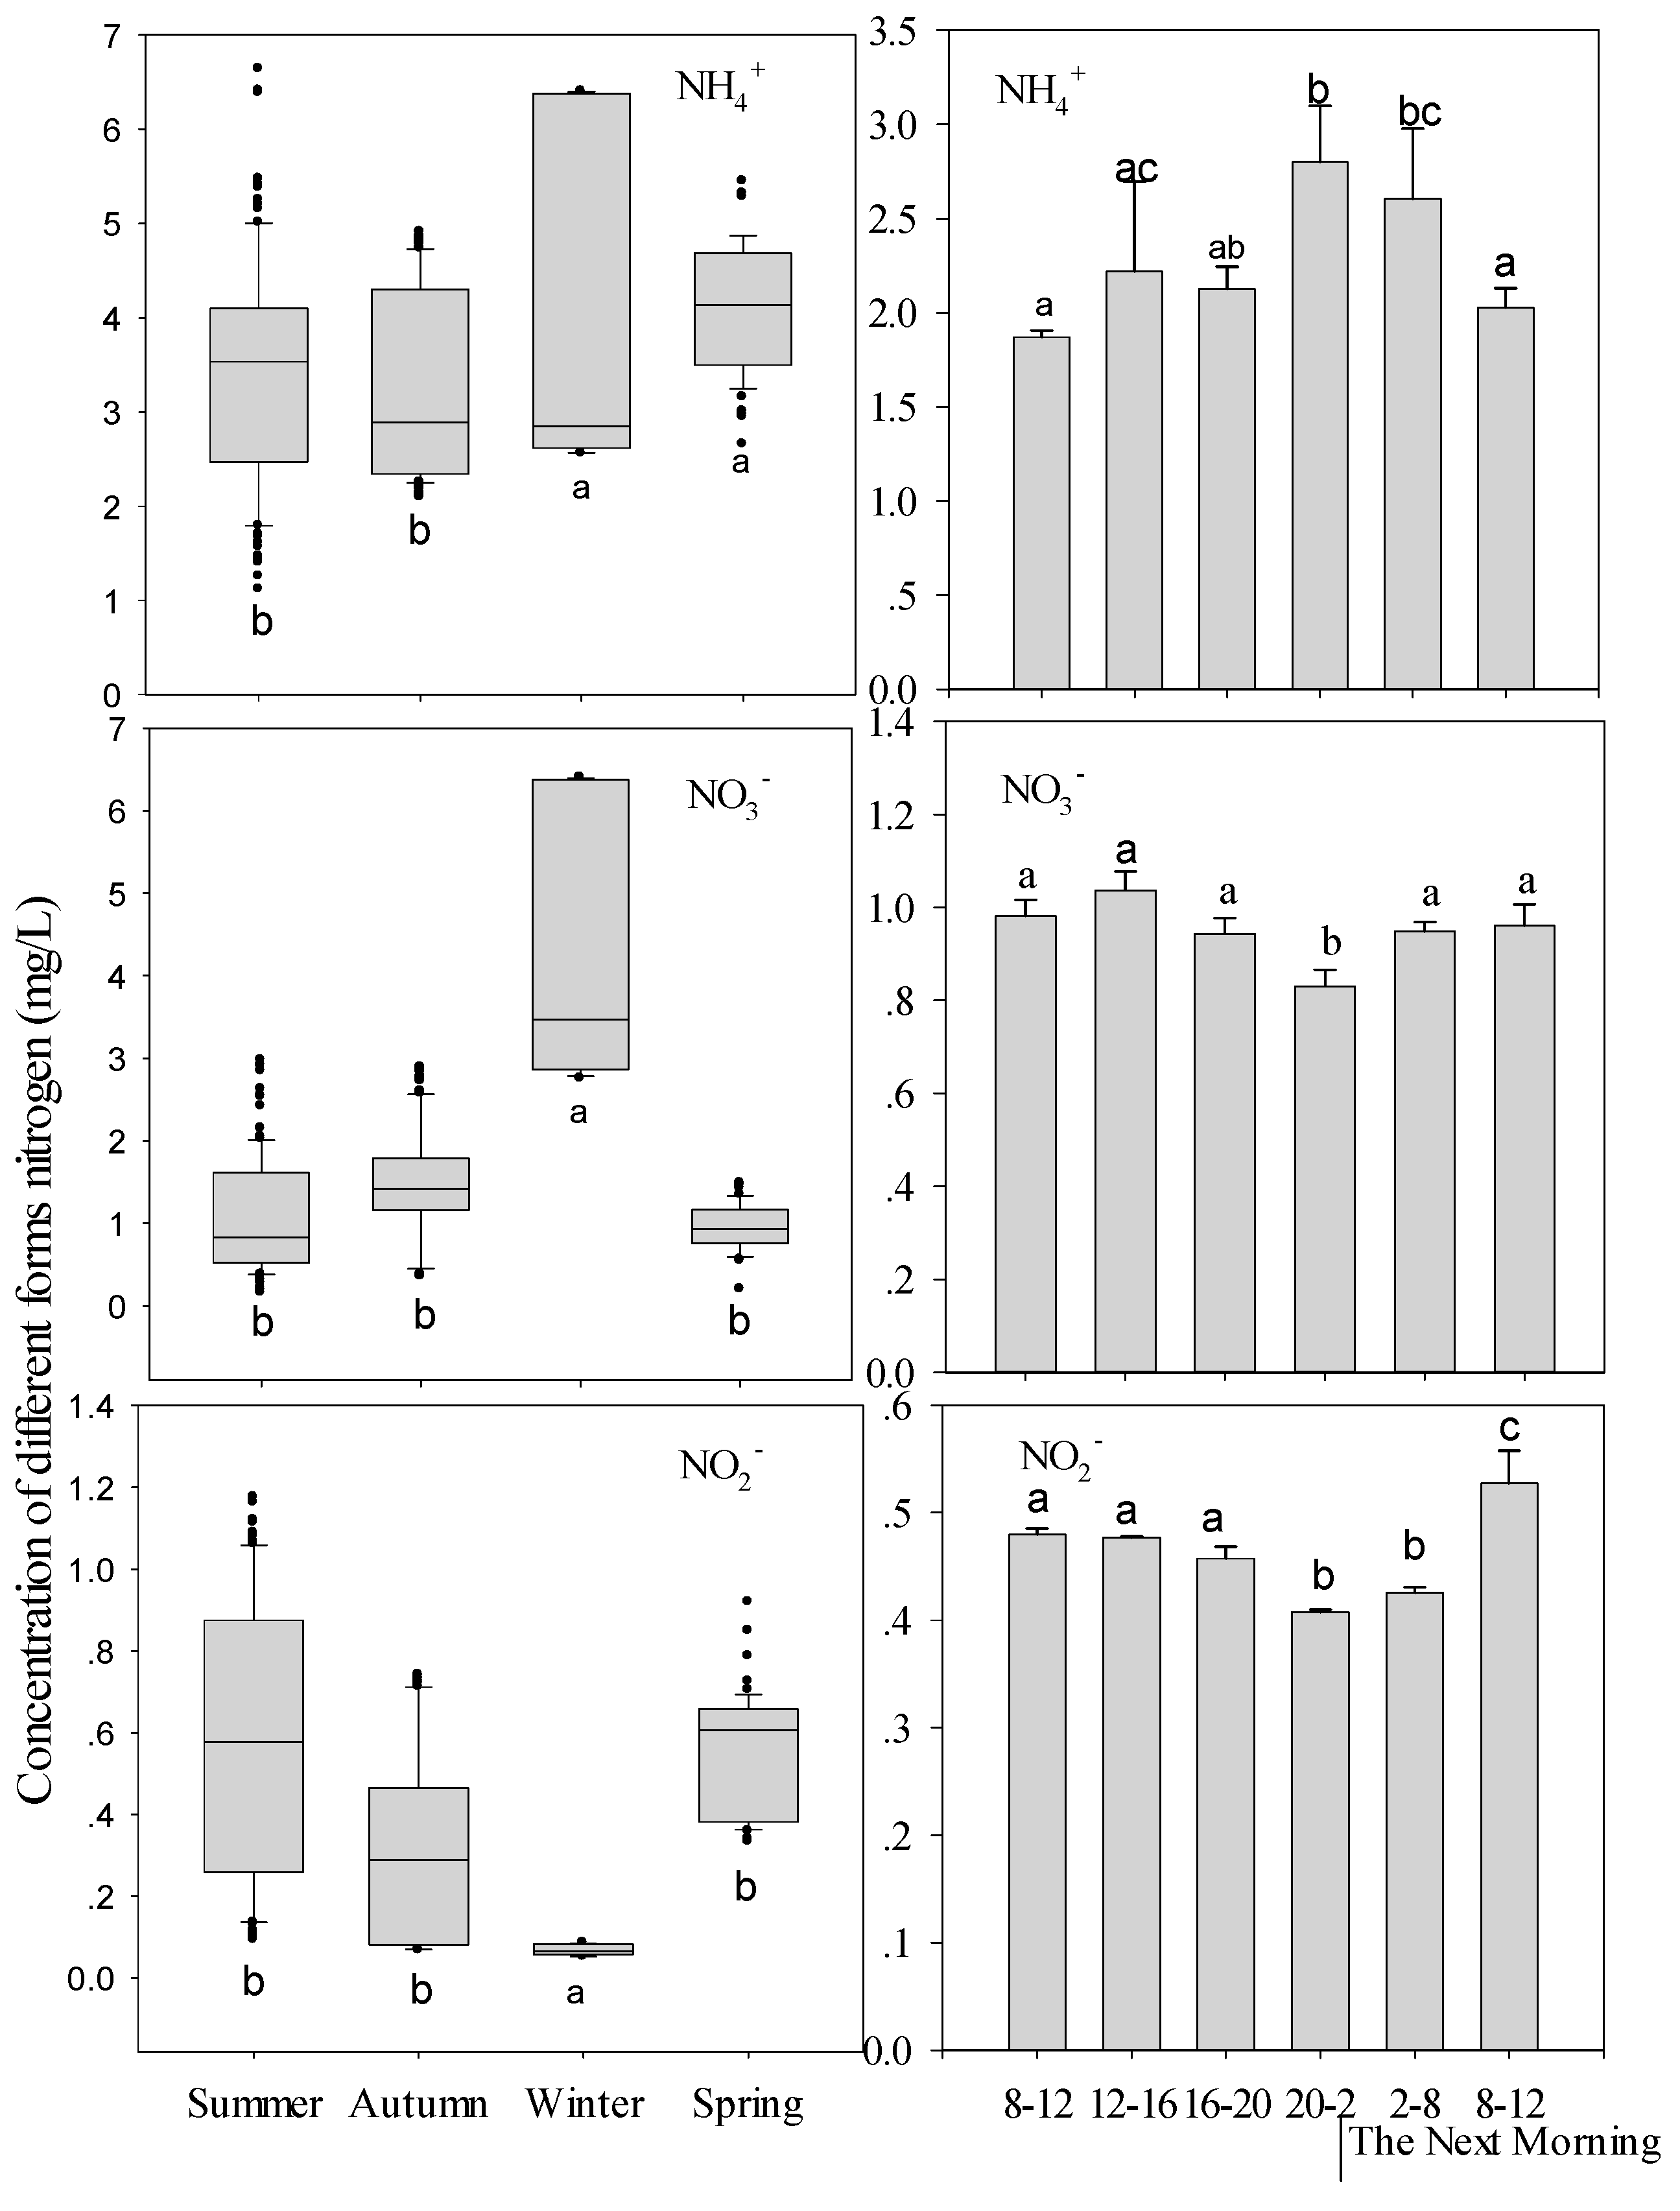
As shown in Figure 2, the NO3−-N concentration at the sediment-water interface was highest in winter, followed by autumn, which was significantly higher than that in both summer and spring (p < 0.001). The NO2−-N concentration in summer and spring was significantly higher than that in winter and autumn (p < 0.001). The NH4+-N concentration was the highest in winter, followed by spring, which was significantly higher than that in autumn and summer (p < 0.001). The concentration variation in different seasons was high for different forms of nitrogen.
The diel variation of different nitrogen forms at the mud-water interface differed: the NO3−-N and NO2−-N concentration reached the lowest level between 20:00 to 2:00 of the next morning, which was significantly lower than that from 8:00 to 12:00. By contrast, the NH4+-N concentration reached a peak between 20:00 to 2:00 of the next morning, which was significantly higher than that from 8:00 to 12:00.
The temperature, dissolved oxygen, pH value, chlorophyll-a, TN and TP at different time were shown in Table 3, and distinct seasonal variation was observed. The water temperature in summer was significantly higher than that in other seasons (p < 0.01). The chlorophyll-a concentration in spring and summer was significantly higher than that in autumn and winter (p < 0.01). The saturation percentage of dissolved oxygen was the highest in winter, which is significantly higher than that of other seasons (p < 0.01); in contrast, lowest in summer, which was under anaerobic condition and significantly lower than that in other seasons (p < 0.01). pH value was close to neutral in summer and significantly lower than that of winter. Both TN and TP were significantly higher in winter than that in other seasons (p < 0.01). Compared to the seasonal variation, the diel variation range of each parameter was relatively smaller. Specifically, the temperature variation at each time period was less than 0.1 °C and the total nitrogen and total phosphorus have no significant difference for all day long. Both the dissolved oxygen and pH were at the lowest level from 20:00 to 2:00 of the next morning and were significantly lower than that of the other times (p < 0.01).
3.3. Influential Factor Analysis
As shown in Table 4, at a seasonal scale, the CH4 flux was positively correlated with the temperature and negative correlated with DO (p < 0.01). However, on the whole summer scale or diel scale, the correlations between the temperature and CH4 flux, and between DO and methane flux were not significant except for the correlation between temperature and methane flux at the diel scale.
NO3− and NH4+ concentration at the mud-water interface was significantly negatively and positively correlated, respectively, with the CH4 flux rate at different time scales (p < 0.02); NO2− concentration was significantly negatively correlated with the CH4 flux rate only at the diel scale (p < 0.01). The correlation coefficients between the three nitrogen forms and methane flux were the highest at the diel scale (R2 > 0.36), followed by the whole summer scale, and the lowest at the seasonal scale (R2 < 0.05). In terms of the diel scale, the correlation coefficient between NH4+ and CH4 flux was the highest (R2 = 0.87), followed by NO3− (R2 = 0.68) and NO2− (R2 = 0.36), which were all higher than that between temperature/DO and CH4 flux.
4. Discussion
4.1. A Eutrophic Pond Is a Significant Waterbody of Methane Release
Eutrophication has been known to promote CH4 flux [29]. In this study, the CH4 flux from the eutrophic pond peaked at 7.33 ± 2.09 mmol m−2 h−1, and more than 30% of all monitoring data were higher than 2 mmol m−2 h−1 (as shown in Table 2), which was much higher than the methane release rate of low nutrient rivers [30], general reservoirs [18,31,32,33], a lake [32,34], some eutrophic lakes [29] and even a paddy field [35]. More than 90% of all released gases in a water body are ebullition gases [36]; methane flux from the sediment-water boundary in the eutrophic pond probably was possibly close to the net release flux at the water-gas interface, although the GTD method could overestimate the net flux of methane gas because it avoids methane oxidation in the emission process in aerobic water. In this study, the nutrient concentration levels in the eutrophic pond were far above those in a eutrophic reservoir [31], wetland [34], and paddy soil [35] and were equivalent to those in some eutrophic urban ponds [8,37]. A higher nutrient load possibly contributed to the higher methane flux in the eutrophic water.
4.2. Effects of Temperature and DO on Other Parameters
Temperature is an important factor influencing the biological activity [19]. Hydrophytes develop and biological activity is promoted as temperature increases [28,38]. In this study, temperatures in summer and spring were higher than in winter and autumn. Accordingly, the chlorophyll-a concentrations in summer and spring were higher than in winter and autumn, despite higher TN and TP concentration in winter than in summer and spring. An increase in temperature tended to promote the development of phytoplankton in water. However, a higher temperature increases the biological respiration and biodegradation of phytoplankton that tends to exhaust the DO at the sediment-water interface [30,32,33]. Thus, lower SPDO was observed in summer than in winter in this study. Moreover, the low SPDO and high temperature facilitate CH4 production in summer [19,20]; we also found higher CH4 flux in summer than in other seasons. Nitrogen in a eutrophic pond is removed through biological processes including the processes of nitrification/denitrification, assimilation, and so on. A low temperature in winter may reduce the biological activity, which decreases the removal rate of nitrogen from water. Therefore, nitrogen in different forms was higher in winter than in other seasons, except NO2− nitrogen. NO2− is the product of nitrate reductase action under anoxic conditions [39,40], which did not readily occur because the SPDO was 92.41% at the sediment-water interface in winter (Table 3).
Thermal stratification has been found in eutrophic ponds; this causes DO stratification in the water column of a shallow water body [27,28,38]. It has been demonstrated that DO and temperature stratifications in the water column of a hyper-eutrophic pond occur after sunrise and are strongest in the early afternoon and gradually attenuate from the afternoon to early the next morning [28,38]. This study showed that DO at the sediment-water interface decreased after sunrise, reached the minima early the next morning and then increased, which almost synchronized with the diel thermal stratification characteristics. The redistribution of DO is persistently affected by thermal stratification [28]. Accordingly, in this study, distinct diel variations in DO at the sediment-water interface were shown although the temperature was stable in one day.
DO has been known to be an important factor influencing biological activity. Anoxic conditions at the sediment-water interface favor the activity of methanogen to produce CH4. Further, the nitrogen removal pathways such as denitrification, simultaneous nitrification-denitrification and the anaerobic ammonium oxidation (ANAMMOX) process all require strict anaerobic conditions to consume NO3−/NO2− [36,40]. At the same time, degradation of organic matter is facilitated, but nitrification is inhibited under anoxic conditions [38]. In addition, stratification seems to hinder the distribution of NO3−/NO2− from the surface water to the bottom water [28]. Consequently, this study found NO3−/NO2− decreased and NH4+ and CH4 flux increased with DO decrease in one day.
4.3. Factors Correlated with Methane Release
CH4 is produced in the sediments and is released at the air-water interface through the pathway of ebullition and diffusive gas. Physical factors such as the water level and total static pressure (the sum of hydrostatic and atmospheric pressure) has been proved to be the controlling factors of CH4 flux [19,41]. CH4 is produced through a biological process [11,14]. The factors correlated with the biological activity were primarily considered in this study. Therefore, the GTD was placed 5 cm above the mud-water interface to directly collect all the gas flux from the sediments.
Firstly, temperature and dissolved oxygen are two major determinants affecting bioactivity [19,24]. The increase of temperature corresponded to higher microbial activities and lower methane solubility in the water body, which both increase the release flux rate of methane [22,29]. By contrast, higher dissolved oxygen conditions inhibited the activity of methanogen and accelerated methane oxidation [13], reducing the methane release rate. This study also found that the methane release rate had a significant positive correlation with temperature (p < 0.01) and a highly significant negative correlation with the DO (p < 0.01). Interestingly, the correlations were low at the summer and diel scale when the variations of temperature or DO were low. The influence of temperature on methane flux tended to decrease in summer, especially during day-night in summer, and methane flux was at a high level.
Besides temperature and DO, the relationships between nitrogen and CH4 have been studied under anoxic conditions. NH4+ can restrain the biological process of methane oxidation, resulting in an increase in CH4 release [14,15,42]. Similarly, in this study, NH4+ concentration in water was significantly positively correlated with CH4 flux during different periods; the correlation was higher at summer and diel scales (Table 4). NO3− and NO2− can participate in anaerobic oxidation of methane (AOM) as an electron acceptor under oxygen-deficient conditions, which would finally reduce methane release [15,17,43]. AOM often co-occurs with NO3−/NO2− consumption peaks [44,45]. However, this study found the concentrations of NO3− and NO2− were negatively correlated with CH4 flux, and the peak of CH4 flux was accompanied with the NO3−/NO2− consumption peak. There are possibly two primary reasons for this observation. One was because of the higher NH4+ concentration than NO3−/NO2− at the water bottom, which could inhibit the methane-oxidizing activity [46]; the other may be because NO3−/NO2− was consumed through the denitrification process and could not be supplied due to the stratification characteristic of the water column and low DO level at the sediment-water interface. NO3− has been identified to be primarily regulated by oxygen [47], which is the key factor to promote AOM at the anoxic sediment-water interface [43,45]. In this study, according to correlation analysis, we also found NO3−, similar to NH4+, had a higher correlation with CH4 flux (R2 = 0.68) at a summer diel scale. In summary, the promotive effects of NH4+ on CH4 flux may have offset the consumption effect of NO3−/NO2− on CH4 flux. The higher NH4+-N and lower NO3−-N/NO2−-N content in eutrophic water possibly had an effect on the high CH4 flux in summer as well as the low dissolved oxygen content.
Acknowledgments
This work was supported by the State Natural Science Foundation of China (No. 41301575, 41471415).
Author Contributions
X.H.L. Y.G. and S.H.Y. conceived and designed the experiments; X.H.L. performed the experiments; X.H.L. and Z.H.Z. analyzed the data; X.H.L. and J.L. wrote the paper.
Conflicts of Interest
The authors declare no conflict of interest.
References
- Alford, D.P.; Delaune, R.D.; Lindau, C.W. Methane flux from Mississippi river deltaic plaine wetland. Biogeochemistry 1997, 37, 227–236. [Google Scholar] [CrossRef]
- Intergovernmental Panel on Climate Change (IPCC). Climate Change 2001: The Scientific Basis; Cambridge University Press: Cambridge, UK, 2001. [Google Scholar]
- Houghton, T.; Ding, Y.; Griggs, D.J.; Noguer, M.P.; van der Linden, J.; Dai, X.; Maskell, K.; Johnson, C.A. Climate Change: The Scientific Basis; Cambridge University Press: Cambridge, UK; New York, NY, USA, 2001. [Google Scholar]
- Whalen, S.C. Biogeochemistry of methane exchange between natural wetlands and the atmosphere. Environ. Eng. Sci. 2005, 22, 73–94. [Google Scholar] [CrossRef]
- IPCC. IPCC Fourth Assessment Report: Climate Change; Cambridge University Press: Cambridge, UK, 2007. [Google Scholar]
- Qu, J.; Fan, M. The current state of water quality and technology development for water pollution control in China. Crit. Rev. Environ. Sci. Technol. 2010, 40, 519–560. [Google Scholar] [CrossRef]
- Chen, W.Y. Environmental externalities of urban river pollution and restoration: A hedonic analysis in Guangzhou (China). Landsc. Urban Plan. 2017, 157, 170–179. [Google Scholar] [CrossRef]
- Uggetti, E.; García, J.; Lind, S.E.; Martikainen, P.J.; Ferrer, I. Quantification of greenhouse gas emissions from sludge treatment wetlands. Water Res. 2012, 46, 1755–1762. [Google Scholar] [CrossRef] [PubMed]
- Wang, X.F.; He, Y.X.; Yuan, X.Z.; Chen, H.; Peng, C.H.; Yue, J.S.; Zhang, Q.Y.; Diao, Y.B.; Liu, S.S. Greenhouse gases concentrations and fluxes from subtropical small reservoirs in relation with water shed urbanization. Atmos. Environ. 2017, 154, 225–235. [Google Scholar] [CrossRef]
- Liu, K.H.; Hu, Z.B.; Wei, J.Q.; Jiang, Z.; Lu, H.; Wang, C. Analysis of methane flux produced by city black odor river in summer-an example of Chaoyang creek in Nanjing City, China. Earth Environ. 2015, 43, 415–419. (In Chinese) [Google Scholar]
- Ding, W.X.; Cai, Z.C. Effects of soil organic matter and exogenous organic materials on methane production in and emission from wetlands. Acta Ecol. Sin. 2002, 22, 1672–1679. (In Chinese) [Google Scholar]
- Wassmann, R.; Neue, H.U.; Bueno, C.; Lantin, R.S.; Alberto, M.C.R.; Buendia, L.V.; Bronson, K.; Papen, H. Methane production capacities of different rice soils derived from inherent and exogenous substrates. Plant Soil 1998, 203, 227–237. [Google Scholar] [CrossRef]
- Bender, M. Kinetics of methane oxidation in oxic soils. Chemosphere 1993, 26, 687–696. [Google Scholar] [CrossRef]
- Conrad, R.; Rothfuss, F. Methane oxidation in the soil surface layer of a flooded rice field and the effect of ammonium. Biol. Fertil. Soils 1991, 12, 28–32. [Google Scholar] [CrossRef]
- Mason, I. Methane as a carbon source in biological denitrification. Water Pollut. Control Fed. 1977, 49, 855–857. [Google Scholar]
- Canfield, D.E.; Glazer, A.N.; Falkowski, P.G. The evolution and future of earth’s nitrogen cycle. Science 2010, 330, 192–196. [Google Scholar] [CrossRef] [PubMed] [Green Version]
- Ettwig, K.F.; Butler, M.K.; Paslier, D.L.; Pelletier, E.; Mangenot, S.; Kuypers, M.M.M.; Schreiber, F.; Dutilh, B.E.; Zedelius, J.; Beer, D.D.; et al. Nitrite-driven anaerobic methane oxidation by oxygenic bacteria. Nature 2010, 464, 543–549. [Google Scholar] [CrossRef] [PubMed]
- Duchemin, E.; Lucotte, M.; Canuel, R.; Chamberland, A. Production of the greenhouse gases CH4 and CO2 by hydroelectric reservoirs of the boreal region. Glob. Biogeochem. Cycles 1995, 9, 529–540. [Google Scholar] [CrossRef]
- Smith, L.K.; Lewis, W.M. Seasonality of methane emissions from five lakes and associated wetlands of the coloeado rockies. Glob. Biogeochem. Cycles 1992, 6, 323–338. [Google Scholar] [CrossRef]
- Mazumdar, A.; Peketi, A.; Joao, H.M.; Dewangan, P. Pore-water chemistry of sediment cores off Mahanadi Basin, Bay of Bengal: Possible link to deep seated methane hydrate deposit. Mar. Pet. Geol. 2014, 49, 162–175. [Google Scholar] [CrossRef]
- Bastviken, D.; Jonathan, C.; Michael, P.; Tranvik, L. Methane emissions from lakes: Dependence of lake characteristics, two regional assessments, and a global estimate. Glob. Biogeochem. Cycles 2004, 18. [Google Scholar] [CrossRef]
- Keiski, R.L.; Desponds, O.; Chang, Y.F.; Somorjai, G.A. Kinetics of the water-gas shift reaction over several alkane activation and water-gas shift catalysts. Appl. Catal. A-Gen. 1993, 101, 317–338. [Google Scholar] [CrossRef]
- Zhang, Y.L.; Shi, K.; Liu, J.J.; Deng, J.M.; Qin, B.Q.; Zhu, G.W.; Zhou, Y.Q. Meteorological and hydrological conditions driving the formation and disappearance of black blooms, an ecological disaster phenomena of eutrophication and algal blooms. Sci. Total Environ. 2016, 569–570, 1517–1529. [Google Scholar] [CrossRef] [PubMed]
- Gao, Y.; Liu, X.H.; Yi, N.; Wang, Y.; Guo, J.Y.; Zhang, Z.H.; Yan, S.H. Estimation of N2 and N2O ebullition from eutrophic water using an improved bubble trap device. Ecol. Eng. 2013, 57, 403–412. [Google Scholar] [CrossRef]
- Liu, X.H.; Gao, Y.; Zhao, Y.; Wang, Y.; Yi, N.; Zhang, Z.; Yan, S. Supplemental tests of gas trapping device for N2 flux measurement. Ecol. Eng. 2016, 93, 9–12. [Google Scholar] [CrossRef]
- Liu, X.H.; Gao, Y.; Wang, H.L.; Guo, J.Y.; Yan, S.H. Applying a new method for direct collection, volume quantification and determination of N2 emission from water. J. Environ. Sci. 2015, 27, 217–224. [Google Scholar] [CrossRef] [PubMed]
- Palma, P.; Ledo, L.; Soares, S.; Barbosa, I.R.; Alvarenga, P. Spatial and temporal variability of the water and sediments quality in the Alqueva reservoir (Guadiana Basin; southern Portugal). Sci. Total Environ. 2014, 470, 780–790. [Google Scholar] [CrossRef] [PubMed]
- Gao, Y.; Zhang, Z.H.; Liu, X.H.; Yi, N.; Zhang, L.; Song, W.; Wang, Y.; Mazumder, A.; Yan, S.H. Seasonal and diurnal dynamics of physicochemical parameters and gas production in vertical water column of a eutrophic pond. Ecol. Eng. 2016, 87, 313–323. [Google Scholar] [CrossRef]
- Martinez, D.; Anderson, M.A. Methane production and ebullition in a shallow, artificially aerated, eutrophic temperate lake (Lake Elsinore, CA). Sci. Total Environ. 2013, 454, 457–465. [Google Scholar] [CrossRef] [PubMed]
- Smith, L.K.; Lewis, W.M.; Jeffrey, P.; Cronin, G.; Hamilton, S.K. Methane emissions from the Orinoco River floodplain, Venezuela. Biogeochemistry 2000, 51, 113–140. [Google Scholar] [CrossRef]
- Delsontro, T.; McGinnis, D.F.; Sobek, S.; Ostrovsky, I.; Wehrli, B. Extreme methane emissions from a Swiss hydropower reservoir: Contribution from bubbling sediments. Environ. Sci. Technol. 2010, 44, 2419–2425. [Google Scholar] [CrossRef] [PubMed]
- Xiao, S.B.; Wang, Y.C.; Liu, D.F.; Yang, Z.J.; Lei, D.; Zhang, C. Diel and seasonal variation of methane and carbon dioxide fluxes at Site Guojiaba, the Three Gorges Reservoir. J. Environ. Sci. 2013, 25, 2065–2071. [Google Scholar] [CrossRef]
- Li, Z.; Yao, X.; He, P.; Wang, Q.; Guo, J.S.; Chen, Y.B. Diel variations of air-water CO2 and CH4 diffusive fluxes in the Pengxi River, Three Gorges Reservoir. J. Lake Sci. 2014, 26, 576–584. (In Chinese) [Google Scholar]
- Yang, W.Y.; Song, C.C.; Zhang, J.B. Seasonal dynamics of dissolved org anic carbon and nitrogen and correlativity between their concentrations and methane flux in the fresh water marsh. Acta Sci. Circumstantiae 2006, 26, 1745–1750. (In Chinese) [Google Scholar]
- Su, M.M.; Kuang, F.H.; Lv, Y.; Shi, X.J.; Liu, X.J.; Shen, J.B.; Zhang, F.F. Nitrous oxide and methane emissions from paddy soils in southwest China. Geoderma Reg. 2017, 8, 1–11. [Google Scholar] [CrossRef]
- Higgins, T.M.; McCutchan, J.H.; Lewis, W.M. Nitrogen ebullition in a Colorado plains river. Biogeochemistry 2008, 89, 367–377. [Google Scholar] [CrossRef]
- Olguin, E.J.; Galvan, G.S.; Melo, F.J.; Hernandez, V.J.; Portela, R.E.G. Long-term assessment at field scale of floating treatment wetlands for improvement of water quality and provision of ecosystem services in a eutrophic urban pond. Sci. Total Environ. 2017, 584–585, 561–571. [Google Scholar] [CrossRef] [PubMed]
- Lenzi, M.; Gennaro, P.; Mercatali, I.; Persia, E.; Solari, D.; Porrello, S. Physico-chemical and nutrient variable stratifications in the water column and in macroalgal thalli as a result of his biomass mats in a non-tidal shallow-water lagoon. Mar. Pollut. Bull. 2013, 75, 98–104. [Google Scholar] [CrossRef] [PubMed]
- Glover, H.E.; Keller, M.D.; Spinrad, R.W. The effects of light quality and intensity on photosynthesis and growth of marine eukaryotic and prokaryotic phytoplankton clones. J. Exp. Mar. Biol. Ecol. 1987, 105, 137–159. [Google Scholar] [CrossRef]
- Fernandes, S.O.; Javanaud, C.; Aigle, A.; Michotey, V.D.; Guasco, S.; Deborde, J.; Deflandre, B.; Anschutz, P.; Bonin, P.C. Anaerobic nitrification–denitrification mediated by Mn-oxides in meso-tidal sediments:Implications for N2 and N2O production. J. Mar. Syst. 2015, 144, 1–8. [Google Scholar] [CrossRef]
- Hutsch, B.W.; Webster, C.P.; Powlson, D.S. Methane oxidation in soil as affected by land use, soil pH and N fertilization. Soil Biol. Biochem. 1994, 26, 1613–1622. [Google Scholar] [CrossRef]
- Deshmukh, C.; Serça, D.; Delon, C.; Tardif, R.; Demarty, M.; Jarnot, C.; Meyerfeld, Y.; Chanudet, V.; Guédant, P.; Rode, W.; et al. Physical controls on CH4 emissions from a newly flooded subtropical freshwater hydroelectric reservoir: Nam Theun 2. Biogeosciences 2014, 11, 4151–4269. [Google Scholar] [CrossRef]
- Mochizuki, Y.; Koba, K.; Yoh, M. Strong inhibitory effect of nitrate on atmospheric methane oxidation in forest soils. Soil Biol. Biochem. 2012, 50, 164–166. [Google Scholar] [CrossRef]
- Modin, O.; Fukushi, K.; Yamamoto, K. Denitrification with methane as external carbon source. Water Res. 2007, 41, 2726–2738. [Google Scholar] [CrossRef] [PubMed]
- Roland, F.A.E.; Darchambeau, F.; Morana, C.; Bouillon, S. Emission and oxidation of methane in a meromictic, eutrophic and temperate lake (Dendre, Belgium). Chemosphere 2017, 168, 756–764. [Google Scholar] [CrossRef] [PubMed]
- Waki, M.; Tanaka, Y.; Osada, T.; Susuki, K. Effects of nitrite and ammonium on methane-dependent denitrification. Appl. Microbiol. Biothechnol. 2002, 59, 338–343. [Google Scholar]
- Liikanen, A.; Martikainen, P.J. Effect of ammonium and oxygen on methane and nitrous oxide fluxes across sediment-water interface in a eutrophic lake. Chemosphere 2003, 52, 1287–1293. [Google Scholar] [CrossRef]
Figure 1.
Detailed watershed of the eutrophic pond (A), locations of the sampling sites and the distribution of water depth (B). Numbers in plot B are the water depths (cm) of different positions in the pond, and the scale indicates the dimension of the pond.
Figure 1.
Detailed watershed of the eutrophic pond (A), locations of the sampling sites and the distribution of water depth (B). Numbers in plot B are the water depths (cm) of different positions in the pond, and the scale indicates the dimension of the pond.
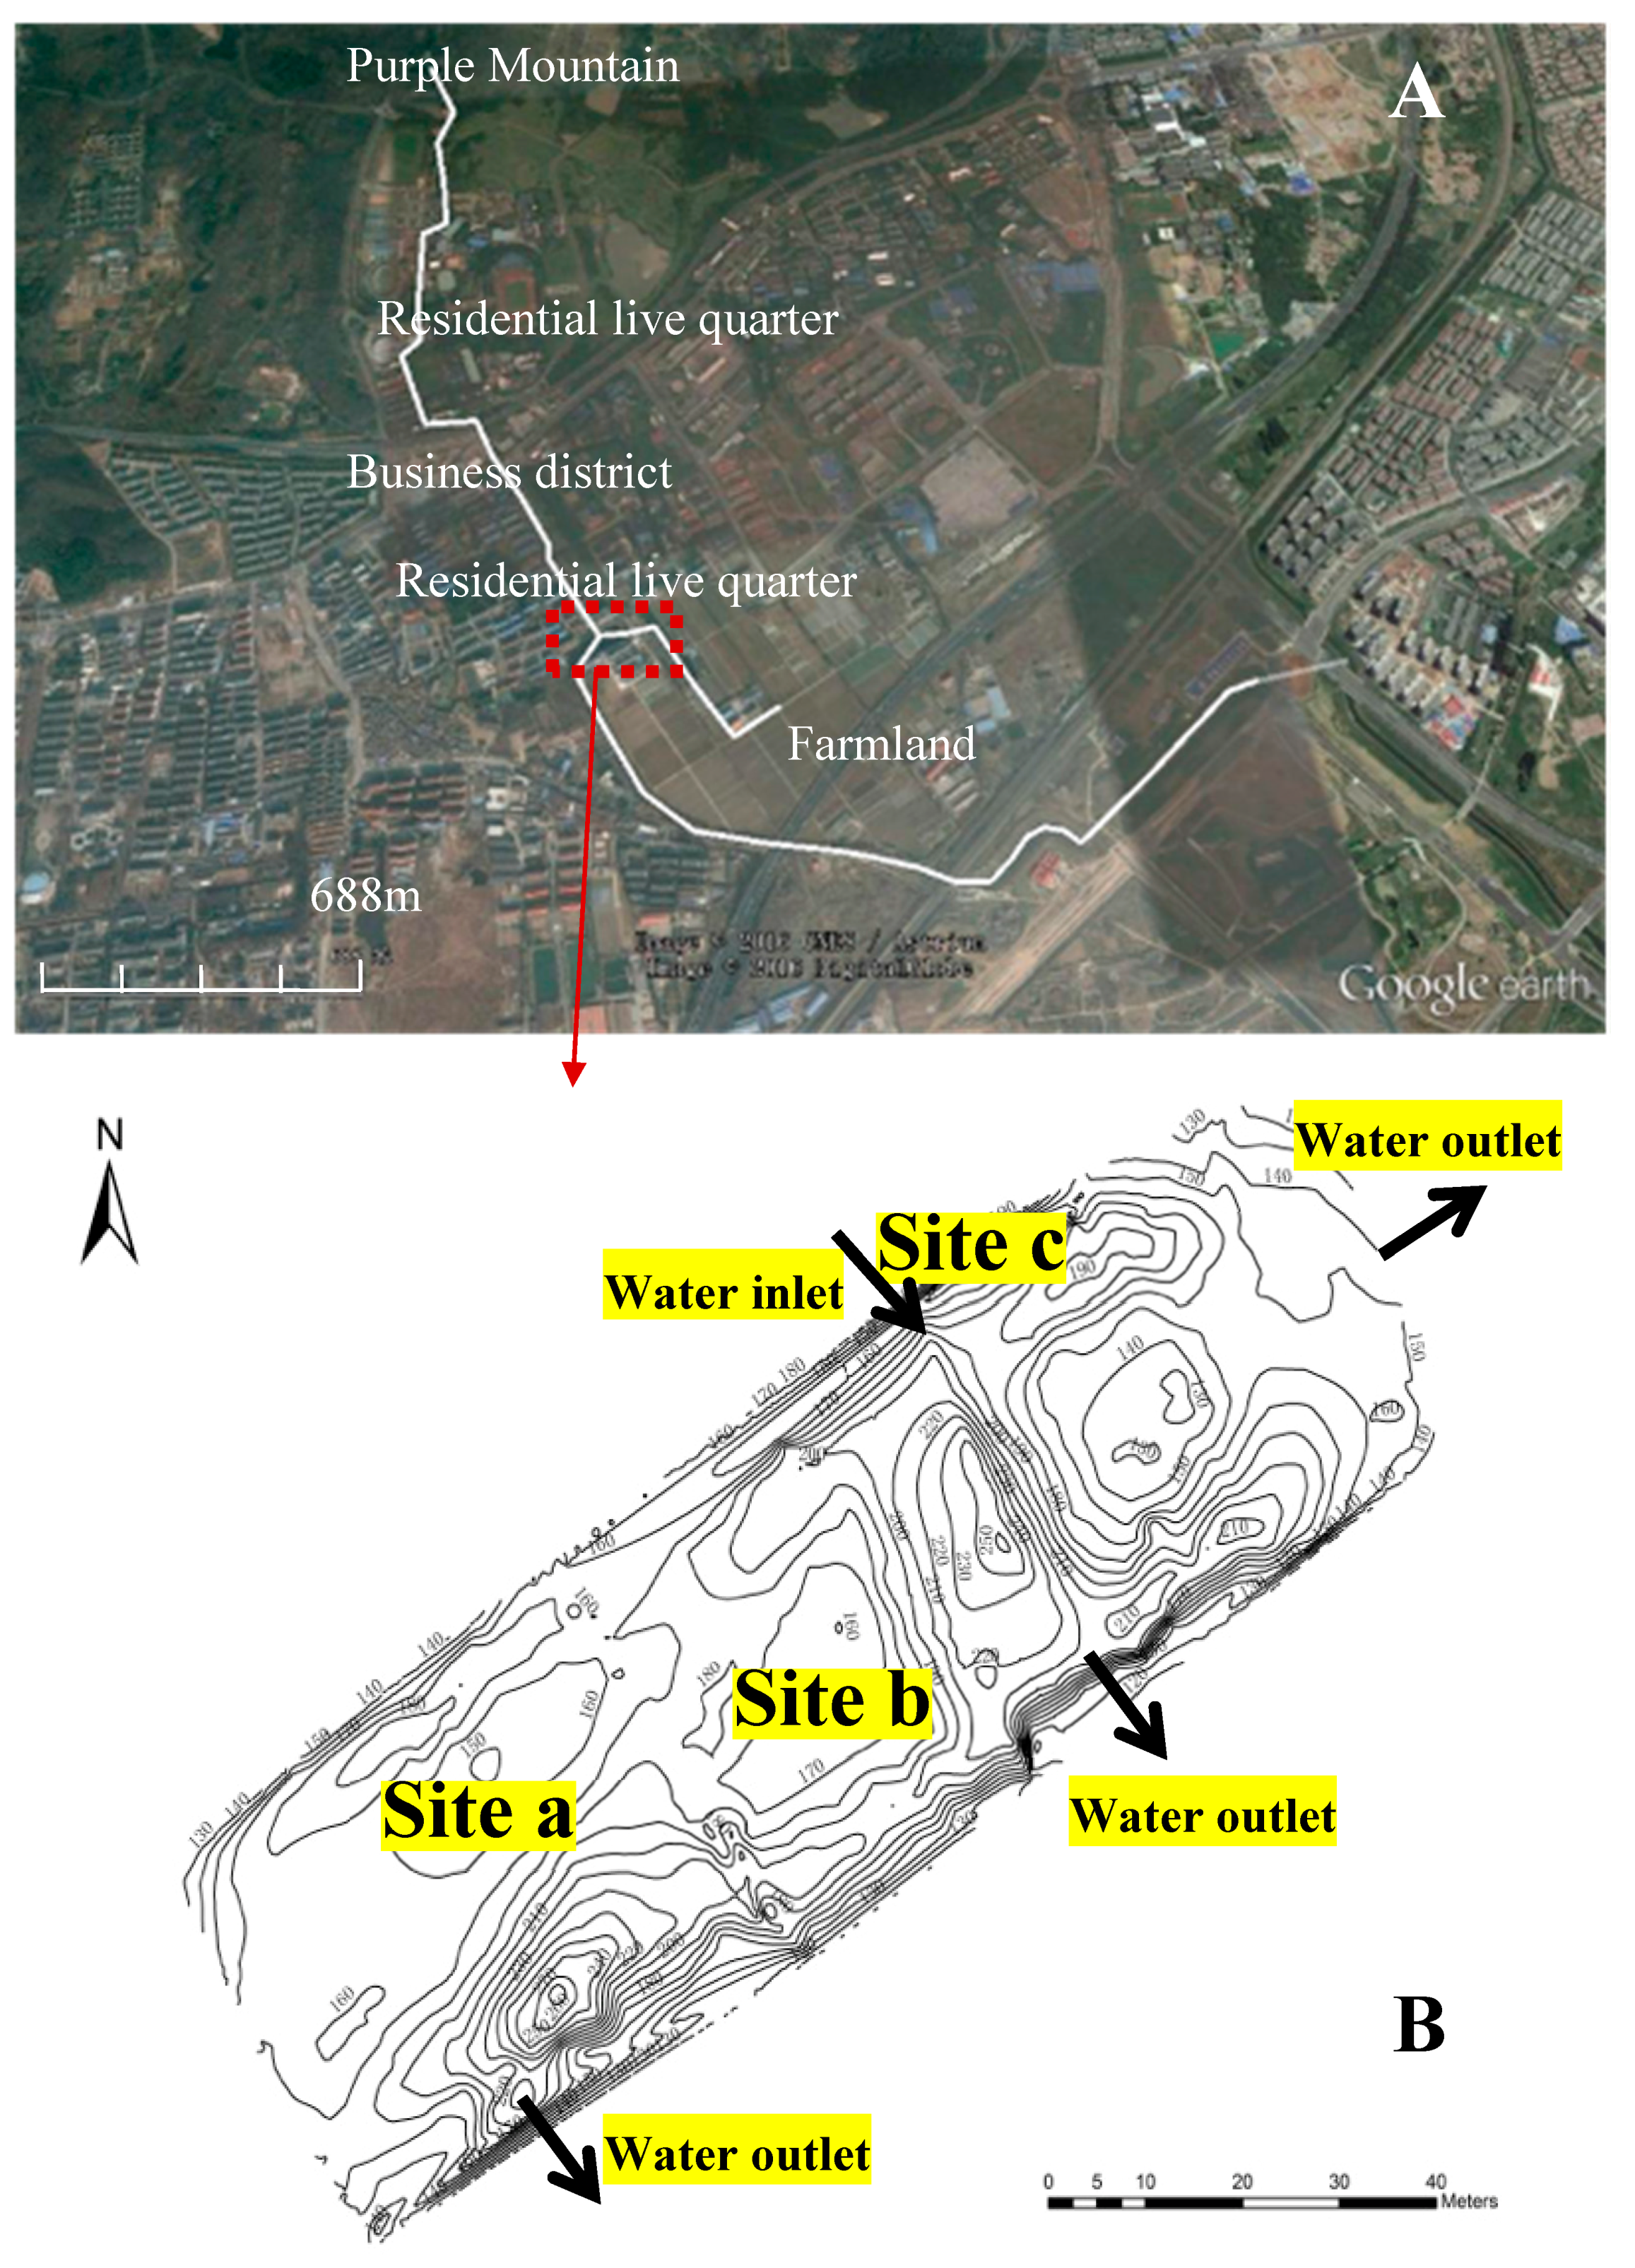
Figure 2.
Concentration variation characteristics of different forms of nitrogen. The three plots in the left column are box plots; they represent concentration values of NH4+, NO3− and NO2− in different seasons, and the short line in the middle of every small box represents the middle value of the object data. The three plots in the right column are bar charts with mean concentration values (±SD) at different times of the diel cycle.

Table 1.
Main parameter characteristics of the sediment samples collected from the eutrophic pond.
| Parameters | NO3− (mg kg−1) | NO2− (mg kg−1) | NH4+ (mg kg−1) | Total Nitrogen (TN) % | Total Phosphorus (TP) (%) | Organic Matter % | pH |
|---|---|---|---|---|---|---|---|
| Content | 3.64 ± 1.41 | 0.95 ± 0.23 | 169.06 ± 30.42 | 0.71 ± 0.08 | 0.46 ± 0.05 | 3.56 ± 0.71 | 7.53 ± 0.22 |
Note: mg kg−1 is milligram nutrient per kilogram dry sediment; % is the nutrient percentage of dry sediment.
Table 2.
The variation characteristics of methane at different time scales.
| Parameters | Time | CH4 Flux Rate (mmol m−2 h−1) |
|---|---|---|
| Seasonal variation | Summer | 2.81 ± 0.19 |
| Autumn | 0.63 ± 0.10 | |
| Winter | zero | |
| Spring | 0.62 ± 0.14 | |
| Diel variation in Summer | 8:00–12:00 | 2.75 ± 0.14 a |
| 12:00–16:00 | 3.41 ± 0.89 a | |
| 16:00–20:00 | 6.19 ± 0.44 b | |
| 20:00–2:00 | 11.48 ± 0.84 c | |
| 2:00–8:00 | 6.46 ± 1.35 b | |
| 8:00–12:00 | 2.93 ± 1.55 a |
Table 3.
The variation characteristics of water parameters during different investigating period.
| Parameters | Time | Temperature °C | Saturation Percentage of Dissolved Oxygen % | pH | Chlorophyll-a μg L−1 | TN mg L−1 | TP mg L−1 |
|---|---|---|---|---|---|---|---|
| Seasonal variation | Summer | 26.46 ± 0.22 | 12.55 ± 1.14 | 7.41 ± 0.05 | 150.56 ± 9.47 | 5.21 ± 0.15 | 0.56 ± 0.03 |
| Autumn | 19.86 ± 0.53 | 46.21 ± 1.97 | 7.95 ± 0.03 | 75.44 ± 5.38 | 4.77 ± 0.11 | 0.45 ± 0.04 | |
| Winter | 7.25 ± 0.21 | 92.41 ± 13.03 | 8.13 ± 0.16 | 76.22 ± 18.16 | 8.15 ± 0.65 | 1.00 ± 0.10 | |
| Spring | 17.28 ± 0.56 | 27.27 ± 3.13 | 8.04 ± 0.03 | 182.97 ± 18.46 | 5.43 ± 0.18 | 0.57 ± 0.02 | |
| Diurnal variation in Summer | 8:00–12:00 | 31.3 ± 0.00 a | 17.43 ± 3.50 a | 7.56 ± 0.1 a | 52.33 ± 4.39 a | 2.85 ± 0.04 a | 0.66 ± 0.00 a |
| 12:00–16:00 | 31.2 ± 0.00 b | 16.8 ± 2.38 a | 7.76 ± 0.08 a | 54.6 ± 3.03 a | 3.03 ± 0.06 a | 0.63 ± 0.01 a | |
| 16:00–20:00 | 31.25 ± 0.07 b | 4.7 ± 0.44 b | 7.44 ± 0.03 a | 94.19 ± 4.95 b | 3.25 ± 0.05 a | 0.62 ± 0.01 a | |
| 20:00–2:00 | 31.25 ± 0.07 b | 1.67 ± 0.20 c | 7.33 ± 0.04 b | 75.96 ± 3.82 b | 3.44 ± 0.02 a | 0.60 ± 0.00 a | |
| 2:00–8:00 | 31.35 ± 0 a | 13.68 ± 2.01 a | 7.59 ± 0.07 a | 88.27 ± 5.59 b | 3.18 ± 0.02 a | 0.60 ± 0.02 a | |
| 8:00–12:00 | 31.15 ± 0.07 a | 3.97 ± 1.40 b | 7.52 ± 0.05 a | 73.48 ± 0.81 b | 3.32 ± 0.03 a | 0.54 ± 0.03 a |
Note: Different letters indicate significant differences between means (p < 0.05).
Table 4.
Fitting equations of different environmental factors and methane flux during different seasons and the correlation coefficient (R2) and probability test value (p-value).
Table 4.
Fitting equations of different environmental factors and methane flux during different seasons and the correlation coefficient (R2) and probability test value (p-value).
| Parameters | Time | Equation | R2 | p-Value |
|---|---|---|---|---|
| NO3−-N concentration | Different seasons | y = −0.33x + 2.23 | 0.05 | 0.01 |
| The whole Summer | y = −1.21x + 4.33 | 0.32 | <0.0001 | |
| Diel variation | y = −34.99x + 39.08 | 0.68 | <0.001 | |
| NO2−-N concentration | Different seasons | y = 0.68x + 1.37 | 0.01 | 0.12 |
| The whole Summer | y = −0.92x + 3.37 | 0.01 | 0.45 | |
| Diel variation | y = −41.896x + 24.912 | 0.36 | <0.01 | |
| NH4+-N concentration | Different seasons | y = 0.259x + 1.428 | 0.03 | <0.02 |
| The whole Summer | y = 0.796x + 0.532 | 0.19 | <0.01 | |
| Diel variation | y = 5.2067x − 7.4312 | 0.87 | <0.01 | |
| Temperature | Different seasons | y = 0.227x − 3.345 | 0.44 | <0.001 |
| The whole Summer | y = 0.0376x + 1.753 | 0 | 0.73 | |
| Diel variation | y = 18.680x − 577.962 | 0.41 | <0.02 | |
| Dissolved oxygen | Different seasons | y = −0.303x + 2.536 | 0.13 | <0.001 |
| The whole Summer | y = −0.3172x + 3.2479 | 0.07 | 0.08 | |
| Diel variation | y = −2.5061x + 7.4835 | 0.25 | 0.08 |
© 2017 by the authors. Licensee MDPI, Basel, Switzerland. This article is an open access article distributed under the terms and conditions of the Creative Commons Attribution (CC BY) license (http://creativecommons.org/licenses/by/4.0/).
Share and Cite
MDPI and ACS Style
Liu, X.; Gao, Y.; Zhang, Z.; Luo, J.; Yan, S. Sediment-Water Methane Flux in a Eutrophic Pond and Primary Influential Factors at Different Time Scales. Water 2017, 9, 601. https://doi.org/10.3390/w9080601
AMA Style
Liu X, Gao Y, Zhang Z, Luo J, Yan S. Sediment-Water Methane Flux in a Eutrophic Pond and Primary Influential Factors at Different Time Scales. Water. 2017; 9(8):601. https://doi.org/10.3390/w9080601
Chicago/Turabian StyleLiu, Xinhong, Yan Gao, Zhenhua Zhang, Jia Luo, and Shaohua Yan. 2017. "Sediment-Water Methane Flux in a Eutrophic Pond and Primary Influential Factors at Different Time Scales" Water 9, no. 8: 601. https://doi.org/10.3390/w9080601
Note that from the first issue of 2016, this journal uses article numbers instead of page numbers. See further details here.