Article

Defining Runoff Indices and Analyzing Their Relationships with Associated Precipitation and Temperature Indices for Upper River Basins in the Northwest Arid Region of China

1
State Key Laboratory of Cryospheric Sciences/Division of Hydrology Water-Land Resources in Cold and Arid Regions, Northwest Institute of Eco-Environment and Resources, Chinese Academy of Science, Lanzhou 730000, Gansu, China
2
University of Chinese Academy of Sciences, Beijing 100049, China
3
Key Laboratory of Land Surface Process and Climate Change in Cold and Arid Regions, Northwest Institute of Eco-Environment and Resources, Chinese Academy of Sciences, Lanzhou 730000, Gansu, China
*
Author to whom correspondence should be addressed.
Water 2017, 9(8), 618; https://doi.org/10.3390/w9080618
Submission received: 9 May 2017 / Revised: 14 August 2017 / Accepted: 14 August 2017 / Published: 18 August 2017
(This article belongs to the Special Issue Sustainable Water Management within Inland River Watershed)

Abstract

:
The northwest arid region (NAR) of China, located in a cold region, has been experiencing extreme weather and runoff events for years. Summer (from June to August) is the main season for forming runoff in this region. Summer runoff is contributed by glacial runoff in addition to precipitation in glacierized basins. The upper basins of Hei River, Shule River, Kaidu River, and Manas River with different glacier coverage and available daily average discharge data were selected in this study. Two runoff indices—maximum discharge difference (MDD) and accumulated direct discharge (ADD)—were defined and calculated for each runoff event in the time series of daily average discharge during 1961–2007. To provide scientific knowledge for managing water resources and preventing disasters, the relationships between summer runoff indices and their associated precipitation and temperature variables were obtained by linear regression analysis. Results suggest that the regulation of glacier on runoff is more significant with the increase of glacier coverage.

1. Introduction

Global climate warming and its consequences have been discussed for years in the scientific literature and mass media, and have become the focus of attention of the scientific community [1,2]. The Intergovernmental Panel on Climate Change (IPCC) has concluded that global climate warming is mainly characterized by significant air temperature increases [3]. It can increase moisture content in the atmosphere which favors stronger precipitation events and consequently increases the risk of flooding [4,5]. Therefore, global climate warming could induce extreme weather events and extreme hydrological events characterized by extreme runoff, resulting in the increased risk of water management.
The northwest arid region (NAR) of China is a region which is sensitive to global climate warming on the planet [6]. The frequency and intensity of extreme precipitation and temperature events of this region have increased [7,8,9], and consequently, extreme hydrological events such as hailstorms, floods (rainstorm floods, snowmelt floods, icicle floods, and glacier lake outburst floods), and landslides and so on could easily occur in this region due to the fragile ecological environment [10]. Therefore, for disaster prevention and mitigation, it is important to study the relationships between extreme runoff events and extreme weather events in the NAR. However, most of the previous studies focused on the relationships of runoff with annual or seasonal precipitation and temperature variables [11,12,13], and the relationships between extreme runoff events and extreme weather events have not been studied yet.
Moreover, the most common methods applied to define extreme runoff indices in previous studies are annual maximum (AM) and peak over thresholds (POT) [14,15]. AM method can find the maximum daily discharge in one year. POT method can find more daily discharge peaks than AM method in one year. However, the quantitative relationships between these daily discharge peaks, which are determined by AM and POT methods, and their associated precipitation and temperature events could not be obtained because of the difficulty of discovering which precipitation and temperature events lead to these daily discharge peaks. Thus, it is necessary to define extreme runoff indices using another method which can identify their associated precipitation and temperature events. As extreme runoff events are a few cases of runoff events, to overcome the drawback of a lack sufficient samples for extreme runoff events, the relationships between runoff events and their associated precipitation and temperature events should be understood first.
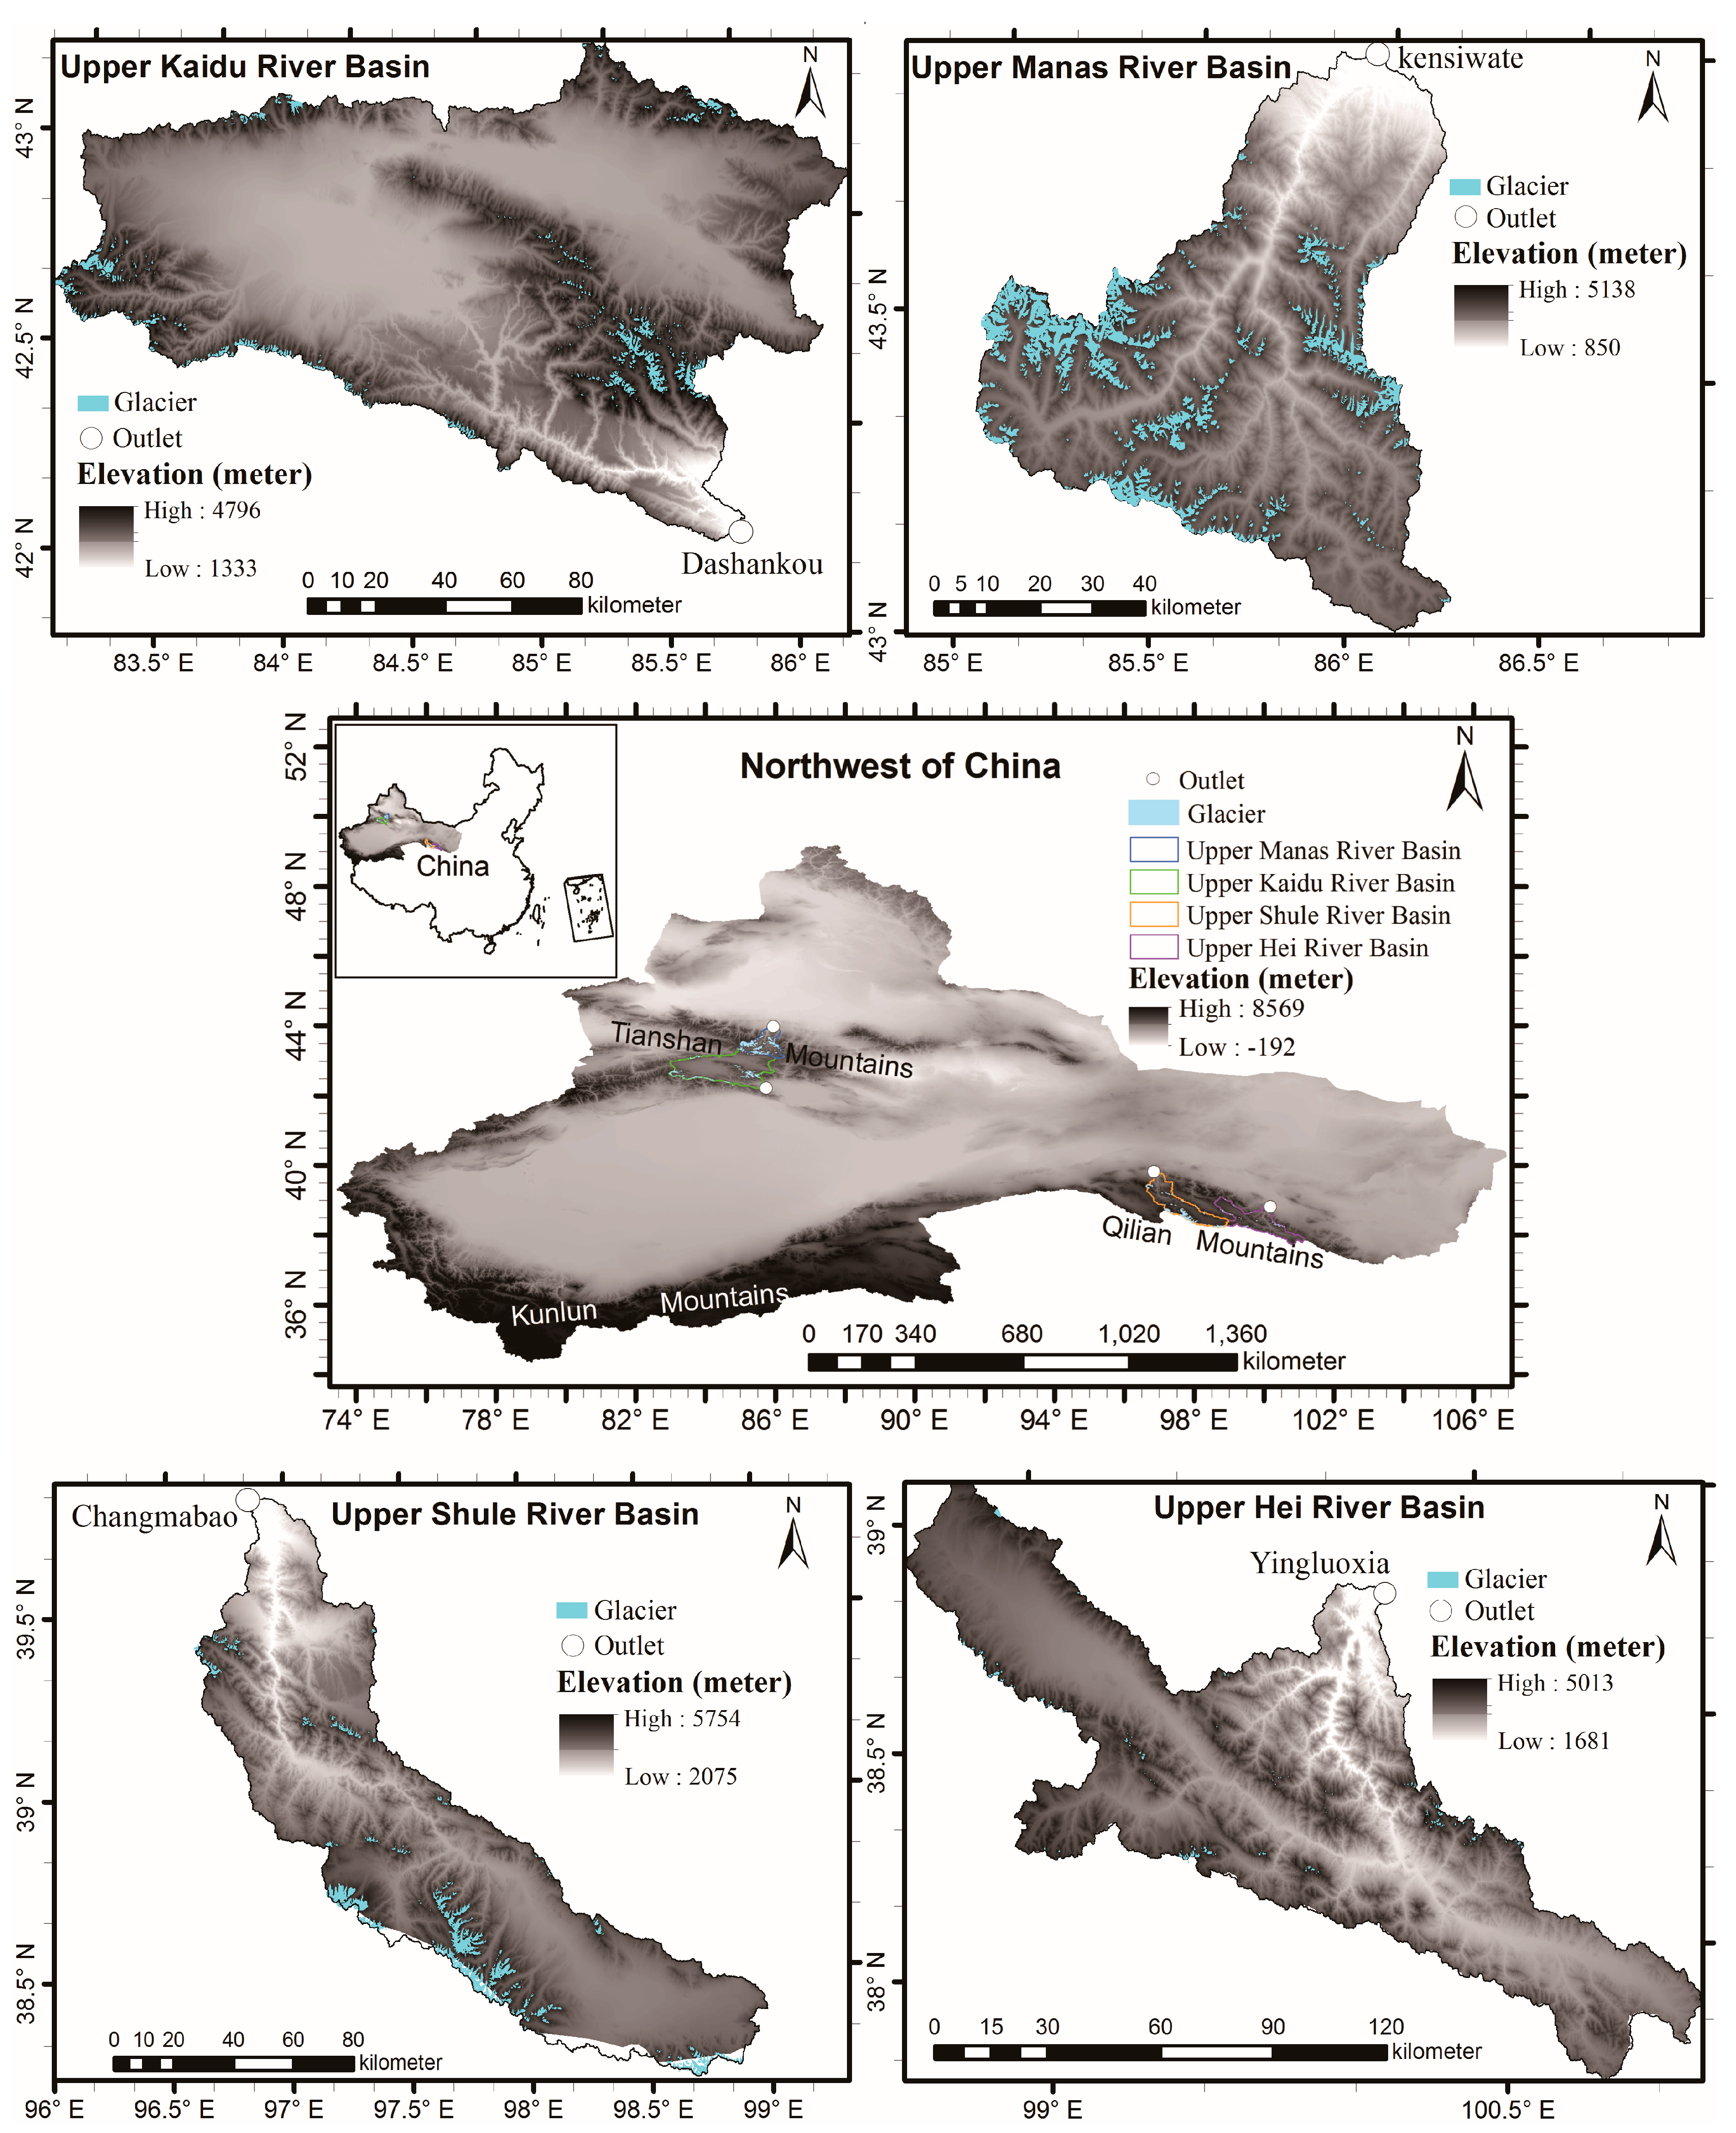
The NAR is located in a cold region, snow cover and glaciers exist in the mountainous area of this region (Figure 1). Thus, this region experiences snowmelt water and glacial melt water floods in addition to rainstorm floods [16,17,18]. In basins with snow cover, snowmelt water from April to June is an important source of runoff besides rainfall [19,20,21,22]. Snow melting is controlled by previous accumulated snow volume and air temperature during the snow melting period [23,24]. In basins with glaciers, glacial melt water contributes most of the runoff in the months of July and August besides rainfall [19,20,25]. Glacier melting is dominated by air temperature and the relationship between runoff and air temperature is stronger with the increase of glacier coverage [26,27]. Therefore, it can be concluded that runoff has a complicated relationship with precipitation and temperature. Additionally, because glacier coverage and snow volume are different among basins in this region, the runoff of different basins has different relationships with precipitation and temperature on a monthly scale. Therefore, it is necessary to reveal how precipitation and temperature dominate the runoff of a particular basin on specific time scale in the NAR.
As July and August are the main months which experience more precipitation and higher air temperature in the NAR, runoff in these months contributes more to annual runoff than the other months in this region [28], and they are high risk months for floods. However, the quantitative relationships of runoff events with precipitation and temperature in these months for the basins of this region have not been studied yet. The impacts of different glacier coverage on runoff events have not been discussed yet. Thus, to provide scientific knowledge of water resource management for basins in the NAR, a typical cold region in the world, this paper aims to: (1) define runoff indices and precipitation and temperature indices which might cause these runoff indices; (2) reveal the quantitative relationships of runoff indices with their related precipitation and temperature indices in the months of July and August by linear regression equations based on typical basins in the NAR with different glacier coverage; (3) discuss the regulation of different glacier coverage on runoff.

2. Materials and Methods

2.1. Selected Basins and Dataset

In order to understand the relationships between runoff events and their related weather variables in inland basins, upper basins in the NAR which have different glacier coverage and available long time series of daily average discharge at their outlets were selected for this study (Figure 1). Upper Manas River Basin lies in the north of the Tianshan Mountains with glacier coverage of 13.1%; upper Shule River Basin lies in the north slope of the Qilian Mountains with glacier coverage of 5.01%; upper Kaidu River Basin is located in the south slope of the Tianshan Mountains with glacier coverage of 2.34%; and upper Hei River Basin is located in the north slope of the Qilian Mountains with glacier coverage of 0.59%. There was no reservoir in these basins.
The daily meteorological grid datasets were obtained from the China Meteorological Data Service Center. The datasets covered the period 1961–2014 and its spatial resolution is 0.5° × 0.5°. The precipitation dataset can be downloaded from: http://data.cma.cn/data/detail/dataCode/SURF_CLI_CHN_PRE_DAY_GRID_0.5.html, and the temperature dataset can be accessed through: http://data.cma.cn/data/detail/dataCode/SURF_CLI_CHN_TEM_DAY_GRID_0.5.html. Daily average discharge data at outlets of the upper basins of the Kaidu River and Manas River were collected from the Hydrology Bureau of Xinjiang province, China, and those of the Hei River and Shule River were collected from the Hydrology Bureau of Gansu province, China. Changmabao, Yingluoxia, Dashankou, and Kensiwate are the outlets of upper basins of the Shule River, Hei River, Kaidu River and Manas River, respectively. Their daily average discharge are from 1954 to 2009, from 1957 to 2009, from 1958 to 2007, and from 1956 to 2007, respectively. To study the relationships of runoff events with their related precipitation and temperature variables, a consistent time span of these daily discharge datasets and daily precipitation and temperature datasets is needed. Therefore, daily average discharge, precipitation, and temperature data covering the period 1961–2007 were selected. The grids in each basin were extracted by using the boundary lines of these basins in Arcmap. No missing value was found in the time series of daily average discharge of Kensiwate, Dashankou, and Changmabao stations. Yingluoxia station has missing records for the years of 1981, 1986, 1988, and 1989, and then these years were not considered for upper Hei River Basin in this study. No missing value was found in the time series of daily temperature dataset. Three days have missing values in the time series of the daily precipitation dataset, and these missing values were filled by averaging the daily precipitation of the same day from 1961 to 2007. Areal average daily precipitation and temperature from 1961 to 2007 were calculated for each selected basin. The months of July and August are regarded as summer in this study. The upper basins of Manas River, Shule River, Kaidu River, and Hei River are referred to as the Manas River Basin, Shule River Basin, Kaidu River Basin, and Hei River Basin, respectively, in the following contents of this study.

2.2. Methods

2.2.1. Definition of Runoff, Precipitation, and Temperature Indices

The runoff indices defined in this study are based on the definition of runoff event. The definition of runoff event is illustrated in Figure 2. From the lowest daily average discharge (valley) to the next highest one (peak) is a runoff event. In Figure 2, there are two runoff events in the 10 days’ time series of daily average discharge. The first runoff events lasted for four days, and the second one for two days. Every runoff event in the time series of daily average discharge during 1961–2007 were extracted for the outlets of selected basins. The start date and end date of a runoff event may lie in two different months or years. In this study, the start date of a runoff event is used to identify the runoff event. Two runoff indices—maximum daily discharge difference (MDD) and accumulated direct discharge (ADD)—were defined (Table 1). MDD is the difference between the peak discharge and its previous valley discharge of a runoff event in the hydrograph (Figure 2). It is related to the maximum water level which is increased in the channel during a runoff event at the outlet of a basin. ADD is related to the total accumulated daily average discharge which is increased in the reservoir during a runoff event at the outlet of a basin. Some precipitation and temperature indices that might cause the variability of these two runoff indices were defined in Table 2. These indices were calculated based on the areal average daily precipitation and temperature of these selected basins. Maximum daily precipitation (MDP), daily precipitation of the day with discharge peak (DPP), and average intensity of precipitation (IP) were defined to characterize the intensity of the precipitation events during a runoff event; accumulated precipitation amount (APA) and the days of precipitation (DP) were defined to capture the amount and days of precipitation events during a runoff event, respectively. Mean temperature (MnT) and maximum temperature (MT) aim to reflect the average and maximum intensity of the temperature event during a runoff event; accumulated positive temperature (AT) contains the information of days and extent of the temperature event during a runoff event.

2.2.2. The Division of Wet and Dry Summers

In the Chinese national “hydrological basic terms and symbolic standards” (GB/T50095-98), the river runoff is divided into feature years—extreme wet year, partial wet year, normal year, partial dry year, and extreme dry year. Anomaly percentage P which was introduced in the “Hydrological Information and Forecast” (GB/T22482-2008) was used to divide river runoff.
P ( % ) = ( X i X ¯ ) / X ¯
X i is the annual river runoff in a certain year, X ¯ is the mean value of the X i ’s. In this study, X ¯ is the mean value of the X i during the period 1961–1990. The anomaly percentage P value of each year from 1961 to 2007 was calculated using Equation (1). Subsequently, these P values were sorted in descending order and divided into five groups at equal intervals. Four P values which were used to divide all the P values into five groups were regarded as the thresholds to divide feature years. The above method can ensure that these feature years take the same percentages from all the studied years. Then it can indicate that this division of river runoff is reasonable. In water resource analysis, extreme wet years and partial wet years are usually regarded as wet years, while extreme dry years and partial dry years are regarded as dry years.
The summer river runoff at each outlet of selected basins in this study were divided into wet and dry summers by the method mentioned above. The values of anomaly percentage p which were used to divide wet and dry summers for each selected basin were illustrated in Figure 3 as two lines. The summers with anomaly percentage P values between these two lines are normal ones, while those out of these two lines are the wet and dry summers, respectively. Wet summers have larger anomaly percentage P values, while dry summers have smaller ones.

2.2.3. Relationships of Runoff Indices with Precipitation and Temperature Indices

Subsequently, the relationships of runoff indices with precipitation and temperature indices in months of July and August during wet and dry summers were examined by linear regression analysis for each selected basins. To improve the performance of linear regression analysis, some preparations were completed on runoff, precipitation, and temperature indices. First, the time series of these indices were detrended. Second, each series of these indices was standardized. Furthermore, rotated principal component analysis (PCA) was conducted on the detrended and standardized precipitation and temperature indices (Table 2) for wet and dry summers respectively to get a lower dimensional and uncorrelated representation of these indices. The retained significant components were shown in Table 3. Eigenvalues larger than 1 indicate that the associated components are significant and must be retained [29]. Variance explained indicates what percentage of information of its associated component can explain for the variability in raw precipitation and temperature indices. Cumulative variance explained is the sum of the associated variance explained of these retained components. The larger the cumulative variance explained is, the more variations in raw precipitation and temperature indices can be explained by its associated retained components. Most of the cumulative variances explained of these retained components were above 90% for all selected basins during wet and dry summers except for Shule River and Manas River Basins (i.e., around 80%) during dry summers (Table 3). Thence, these retained components can represent most of the information of raw precipitation and temperature indices. The loading matrix of the vectors for these components are shown in Table 4. Higher loading in the vector of a component indicates that more information is explained by its associated index.
Consequently, regarding these components as new variables, the relationships between runoff indices and these components were studied by linear regression analysis. The significances of linear regression equations were tested by the test of goodness of fit and variance analysis (ANOVA) (Table 5). The range of adjusted R2 is from 0 to 1. The large value of adjusted R2 indicate the significance of linear regression equation. A p-value of variance analysis smaller than 0.05 indicates the significance of linear regression equation at the 95% confident level. From Table 5, it was found that all the linear regression equations on the relationships of runoff indices with precipitation and temperature indices during wet and dry summers are significant. Significances of the standardized coefficients in these regression equations were tested by t-test (Table 6). A p-value smaller than 0.05 of the associated t-value indicates that the associated coefficient is significant at the 95% confident level. As all the p-values in Table 6 are smaller than 0.05, it indicates that all the coefficients in these linear regression equations are significant at the 95% confident level.

3. Results

3.1. Relationships of Runoff Indices with Precipitation and Temperature Indices during Wet and Dry Summers

Relationships of runoff indices with precipitation and temperature indices during wet and dry summers were obtained by multiple linear regression equations. In these linear regression equations, dependent variables are runoff indices and independent variables are uncorrelated components which were extracted from precipitation and temperature indices by rotated PCA analysis. To explain how to get the relationships of runoff indices with precipitation and temperature indices, MDD during wet summers from the Hei River Basin is presented here as an example. The Components 1, 2, and 3 for wet summers of Hei River Basin are named as X1, X2, and X3. According to the loadings of these components on precipitation and temperature indices (Table 4), vectors of these components are
X1 = 0.844 × MDP + 0.756 × DPP + 0.770 × APA + 0.061 × DP + 0.979 × IP + 0.046 × AT − 0.008 × MnT + 0.057 × MT
X2 = −0.087 × MDP + 0.214 × DPP + 0.029 × APA + 0.122 × DP − 0.043 × IP + 0.631 × AT + 0.982 × MnT + 0.947 × MT
X3 = 0.327 × MDP − 0.241 × DPP + 0.609 × APA + 0.961 × DP + 0.026 × IP + 0.752 × AT + 0.023 × MnT + 0.235 × MT
Then, according to the corresponding coefficients of the components for runoff indices which are shown in Table 6, the linear regression equation for the Hei River Basin during wet summers on the relationship between MDD and these components is
MDD = 0.591 × X1 + 0.187 × X2 + 0.354 × X3
Further, by substituting Equations (2)–(4) into Equation (5), the linear regression equation on the relationship of MDD with precipitation and temperature indices for Hei River Basin during wet summers is
MDD = 0.598 × MDP + 0.402 × DPP + 0.676 × APA + 0.399 × DP + 0.581 × IP + 0.411 × AT + 0.187 × MnT + 0.294 × MT
Similarly, following the above stated criteria, standardized coefficients of linear regression equations on the relationships of runoff indices with precipitation and temperature indices during wet and dry summers for all selected basins were presented in Table 7.
Since X1, X2, and X3 are uncorrelated components to each other in Equation (5), according to the theory of multiple linear regression analysis, it can be concluded that: if X2 and X3 do not change and the value of X1 increases 1, the value of MDD will increase 0.591; if X1 and X3 do not change and the value of X2 increases 1, the values of MDD will increase 0.187; if X1 and X2 do not change and the value of X3 increases 1, the values of MDD will increase 0.354. Thus, the relative contributions of X1, X2, and X3 to the variability of MDD are 52.208, 16.519, and 31.272%, respectively. The associated equations are
(0.591/(|0.591| + |0.187| + |0.354|)) × 100% = 52.208%
(0.187/(|0.591| + |0.187| + |0.354|)) × 100% = 16.519%
(0.354/(|0.591| + |0.187| + |0.354|)) × 100% = 31.272%
Then, the contribution of each precipitation and temperature index to each component during wet summers in the Hei River Basin was calculated by using the results of Table 4 which showed the loading matrix of the vectors of components. For example, the contributions of MnT to X1, X2, and X3 were −0.227, 32.144, and 0.725%, respectively, which were obtained through Equations (10)–(12).
−0.008/(|0.844| + |0.756| + |0.77| + |0.061| + |0.979| + |0.046| + |−0.008| + |0.057|) × 100% = −0.227%
0.982/(|0.844| + |0.756| + |0.77| + |0.061| + |0.979| + |0.046| + |−0.008| + |0.057|) × 100% = 32.144%
0.023/(|0.844| + |0.756| + |0.77| + |0.061| + |0.979| + |0.046| + |−0.008| + |0.057|) × 100% = 0.725%
To get the contribution of MnT to the MDD variability during wet summers for Hei River Basin, the contributions of MnT to X1, X2, and X3 (Equations (7)–(9))were respectively multiplied by the associated relative contributions of X1, X2, and X3 to the variability of MDD (Equations (10)–(12)), and the sum of them were taken. The associated equation is
52.208% × (−0.227%) + 16.519% × 32.144% + 31.272% × 0.725% = 5.418%
Following the above-stated method which is used to get the contribution of MnT to MDD variability, the contributions of precipitation and temperature indices to the variations in runoff indices during wet and dry summers for selected basins were presented in Table 8.
The coefficients and contributions of temperature and precipitation indices to the variations in the runoff indices—MDD and ADD—were shown in Table 7 and Table 8. The positive coefficients and contributions indicate that the associated precipitation or temperature indices have positive effects on the associated runoff indices, and vice versa. For the Hei River Basin, APA and MDP (APA and DP) have stronger impacts on runoff index MDD (ADD) than the other precipitation and temperature indices during both wet and dry summers. For Kaidu River Basin, APA and MDP (DP and AT) have stronger impacts on runoff index MDD (ADD) than the other precipitation and temperature indices during both wet and dry summers. For Shule River Basin, APA and DP (DP and AT) have stronger impacts on runoff index MDD (ADD) than the other precipitation and temperature indices during wet summers while during dry summers MDD and ADD are influenced by AT and DP. For Manas River Basin, APA and DP ( DP and AT) have stronger impacts on runoff index MDD (ADD) than the other precipitation and temperature indices during wet summers; while AT and DP have a greater effect on MDD and ADD during dry summers. This indicates that, in the Hei River Basin, runoff indices—MDD and ADD—are affected by precipitation indices during wet and dry summers; and in the other basins, during dry summers, both MDD and ADD are mainly affected by AT and DP, while during wet summers, ADD is influenced by DP and AT and MDD by precipitation indices. Results also suggest that temperature has a stronger impact on runoff indices during dry summers than during wet ones in the Kaidu River, Shule River, and Manas River Basins which have higher glacier coverage than the Hei River Basin. Moreover, in these three basins, the coefficients of temperature index AT to runoff indices are different, which suggests that temperature plays a role in runoff indices according to different glacier coverage.

3.2. The Regulation of Different Glacier Coverage on Summer Runoff

The glacier melting is dominated by high temperature in summer. Thus, to understand the impact of glacier coverage on summer runoff, the contributions of the temperature indices to the runoff indices need to be discussed. The contributions of the temperature indices—AT, MnT, and MT—to the runoff indices—MDD and ADD—for each selected basin during wet and dry summers were showed in Table 8 which was obtained in the previous section. By taking the sum of the contributions of AT, MnT, and MT to their associated runoff indices for selected basins during wet and dry summers respectively, the total contributions of these temperature indices to the runoff indices were obtained and shown in Table 9. The contributions of the temperature indices to the runoff indices are higher during dry summers than during wet ones, and their differences vary among selected basins (Table 9).
Subsequently, differences of contributions of the temperature indices to the runoff indices between dry and wet summers—which are named as TCdiff—were plotted against the glacier coverage (Figure 4). Generally, the values of TCdiff increase with the increase of glacier coverage for both of the runoff indices defined in this study.

4. Discussion

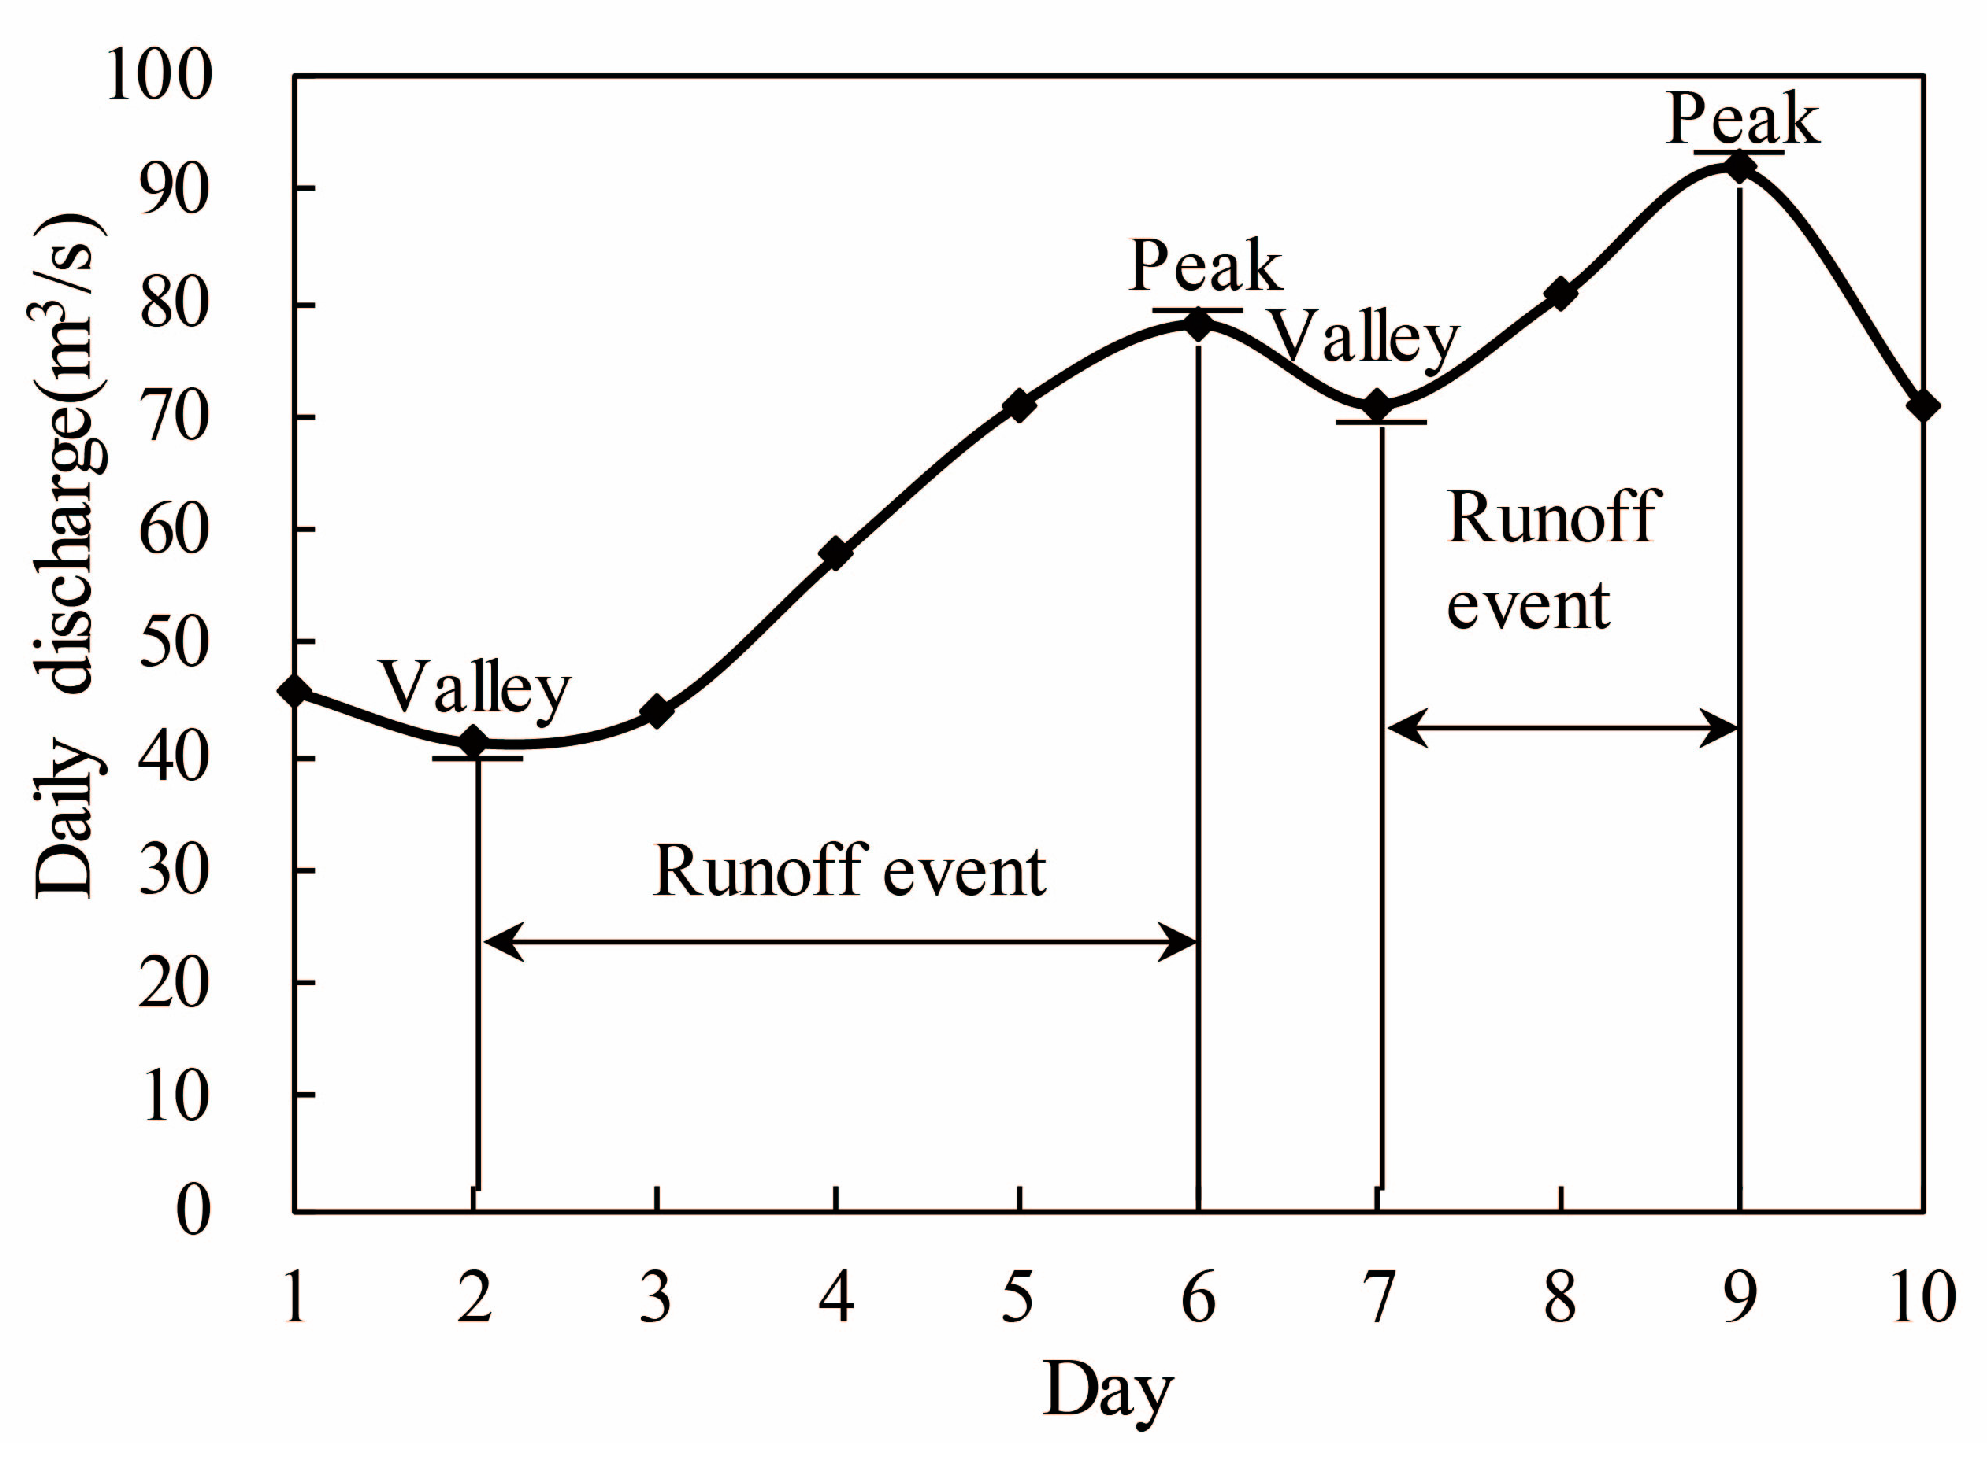
In this study, a runoff event is from the valley to the next peak in the time series of daily average discharge (Figure 2). Runoff events in the time series of daily average discharge were extracted for the outlets of selected basins in the NAR. Two runoff indices—MDD and ADD—were defined and calculated for each runoff event. MDD is the difference of daily average discharge between the peak and the valley in each runoff event and ADD is the accumulated daily direct discharges during each runoff event. Daily direct discharge is the difference between a certain daily discharge and the valley discharge in a runoff event (Table 2). In the definition of these two runoff indices, the valley discharge was subtracted from daily discharges in each runoff event. Precipitation and temperature events occurring during these runoff events can be the main cause for the increase in daily average discharges of these runoff events. Thus, the runoff events defined in this study are independent.
Areal average daily precipitation and temperature were determined for each selected basin by using the grid datasets of daily precipitation and temperature and the boundaries of these selected basins. Subsequently, some precipitation and temperature indices which may contribute to the increase of daily average discharges during a runoff event were defined based on the obtained areal average daily precipitation and temperature. These precipitation indices are MDP, DPP, IP, APA, and DP (Table 3). MDP, DPP, and IP can characterize the intensity of the precipitation events during a runoff event; APA and DP the amount and days, respectively. The temperature indices are MnT, MT, and AT (Table 3). MnT and MT can reflect the average and maximum intensity of the temperature event during a runoff event; AT can reflect the days and amount. These precipitation and temperature indices can represent the common characteristics of precipitation and temperature events: intensity, frequency, and amount. Thus, these indices can be used to study the relationships between the runoff indices and the related precipitation and temperature indices.
In this study, because the precipitation and temperature indices were calculated using the areal average daily precipitation and temperature, the areal average weather events during a runoff event can be regarded as the main cause of this runoff event. The weather event which can trigger runoff events and occur before these runoff events were not considered in this study because the defined precipitation and temperature indices during the associated runoff events have explained the variability of these runoff events quite well. The linear regression equations on the relationships between the runoff indices and their associated precipitation and temperature indices were built (Table 5), and the coefficients in these equations were obtained (Table 7). Because the time series of these runoff, precipitation, and temperature indices were detrended, the other factors which can have effects on the variations in these indices were excluded, and only the relationship between the variations in the runoff indices and the precipitation and temperature indices were built. Therefore, these runoff indices during a few days could be explained by their associated precipitation and temperature indices in this study.
Consequently, the precipitation and temperature indices during a few days on a basin scale can be used to explain the runoff indices in the same period by their standardized coefficients in the linear regression equations. If the values of precipitation and temperature indices are very high on a few days, there will likely be large MDD and ADD on these days at the outlets of basins. The water level in the channel and the total accumulated daily average discharge in the reservoir at the outlet of a basin during these days might increase largely. This study could provide an example for basins which are in cold regions with glaciers and snow cover to explain runoff if the areal average daily precipitation and temperature datasets of these basins can be determined. This could provide scientific knowledge to manage water resources and prevent disasters.
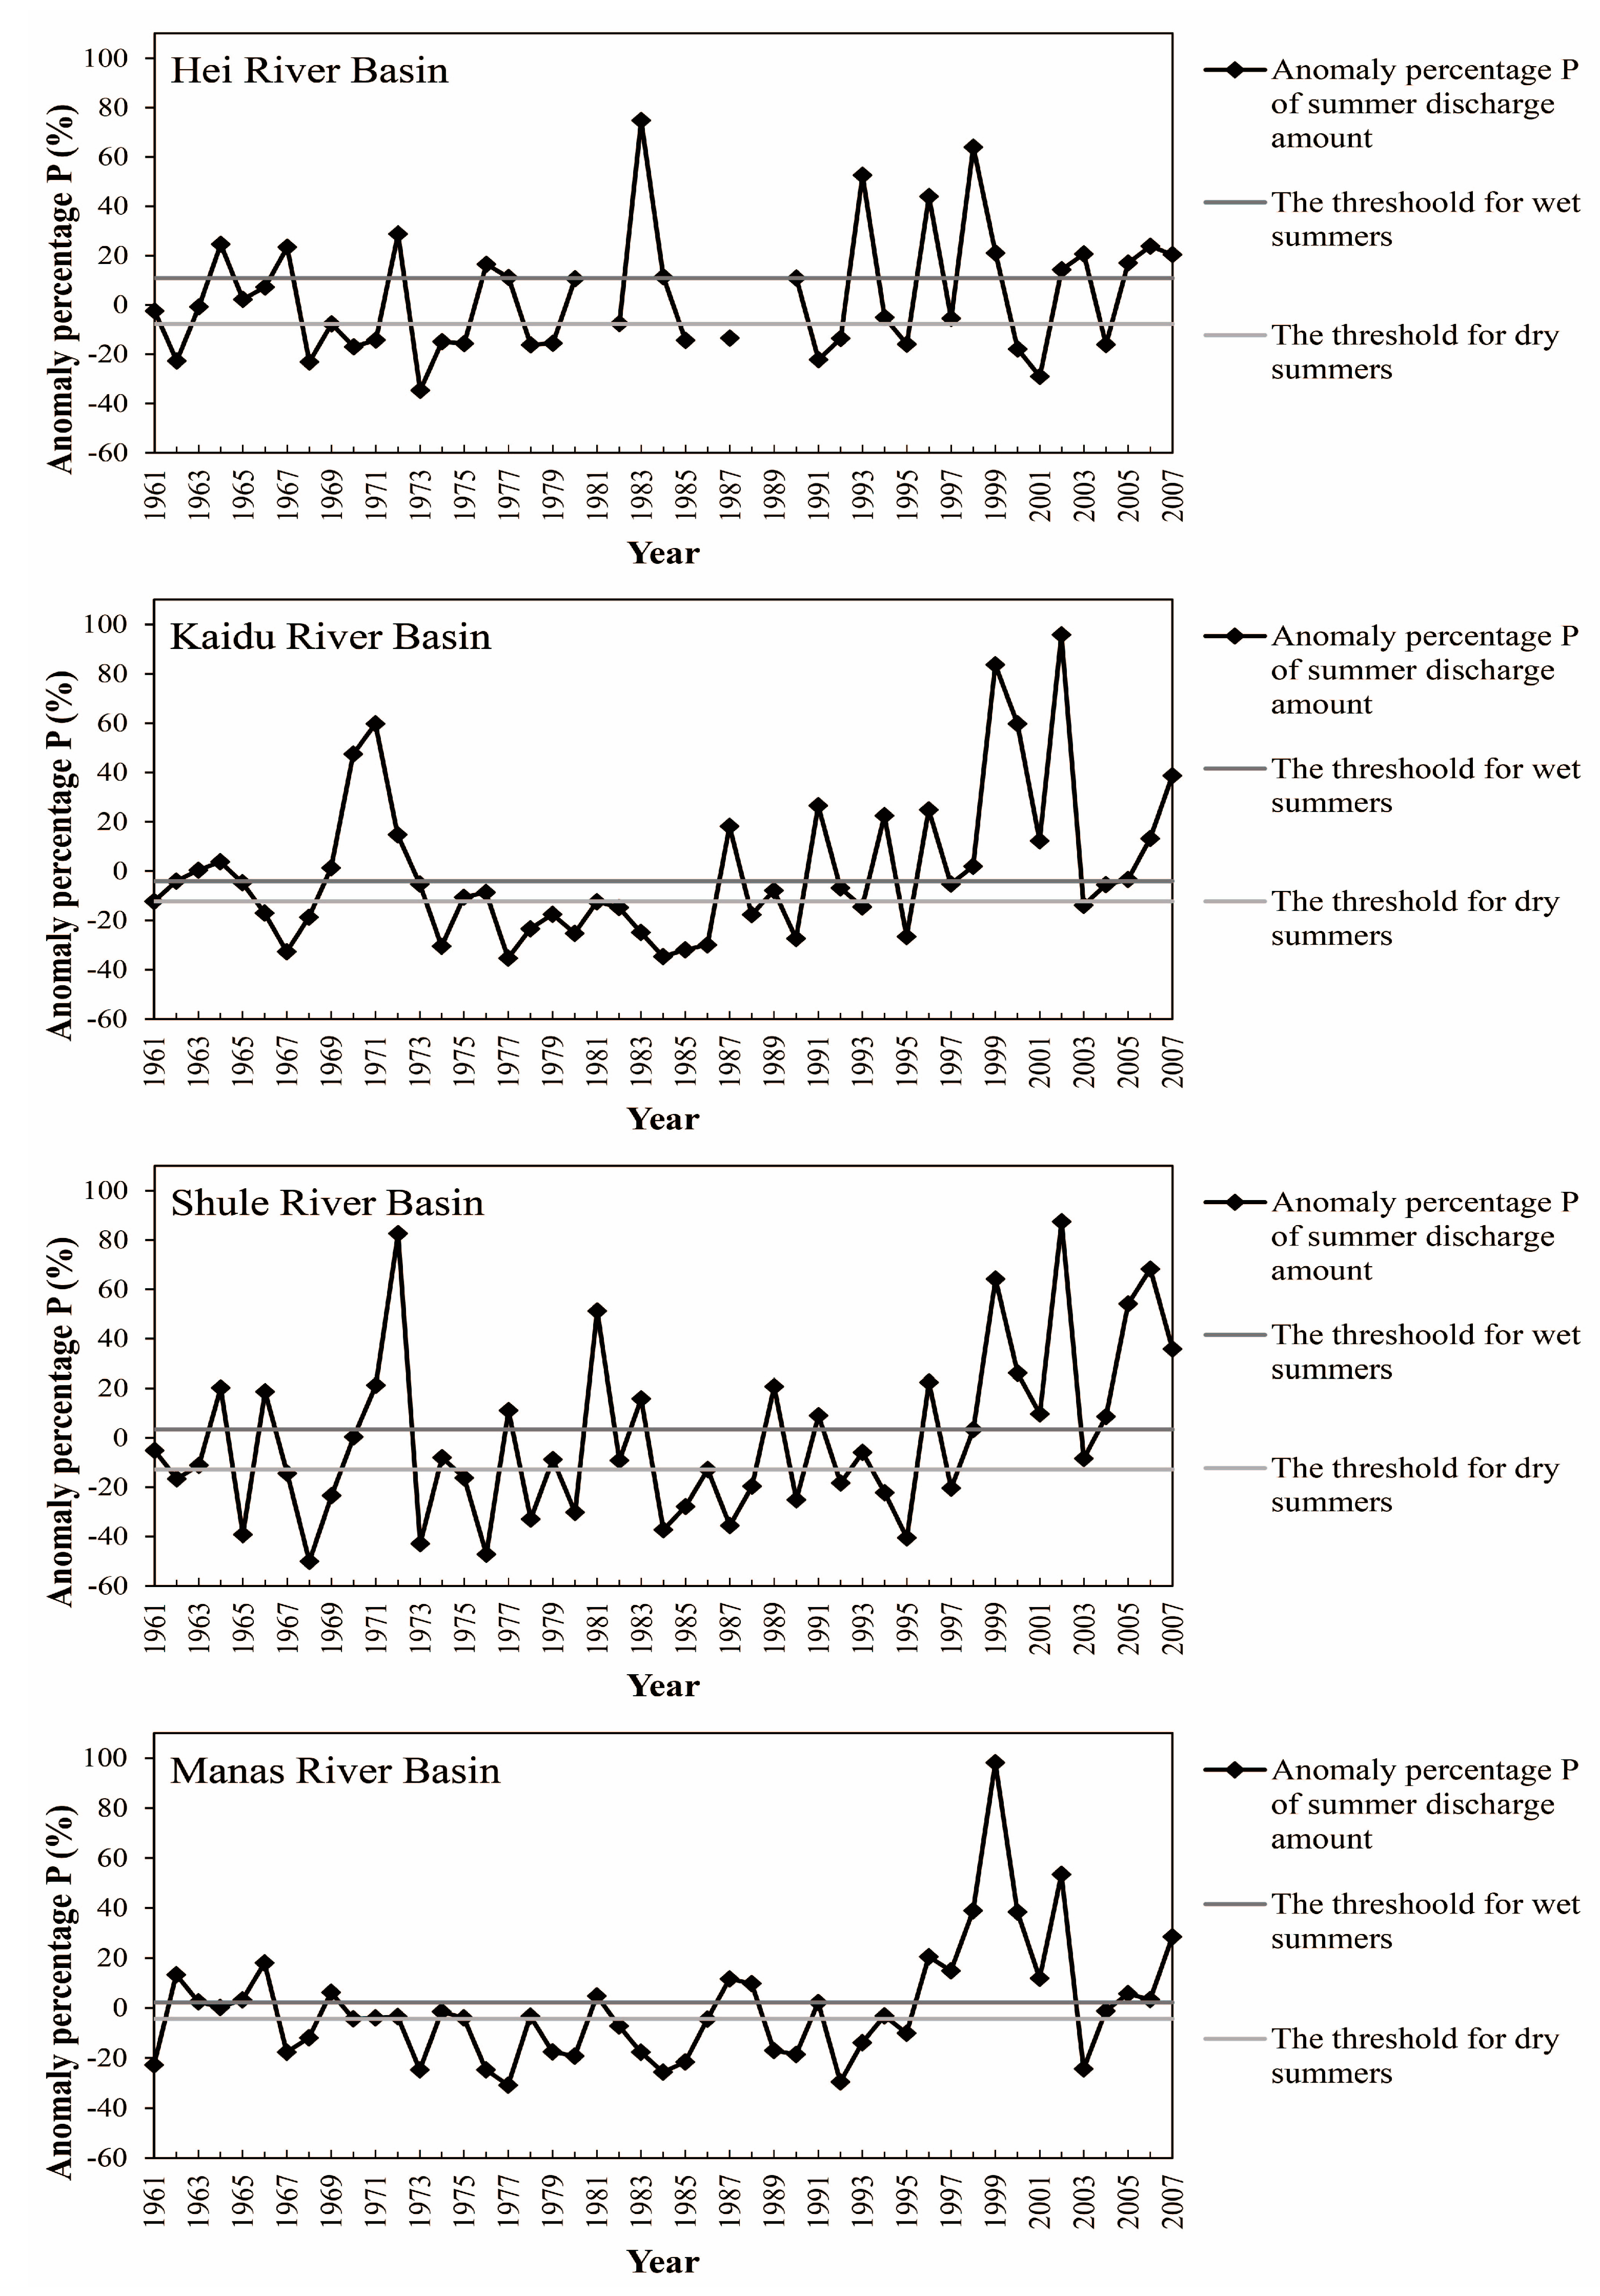
Because the glacier melt water mainly contributes to runoff in the months of July and August which are regarded as summer in this study, the impacts of glacier coverage on runoff could be found if the relationship between runoff and temperature in these months is obtained. The contributions of temperature indices to runoff indices for selected basins increased during dry summers compared with those during wet summers. This might be because glacier melting water contributes more to runoff in hot and dry spells than in cold and wet spells [27,
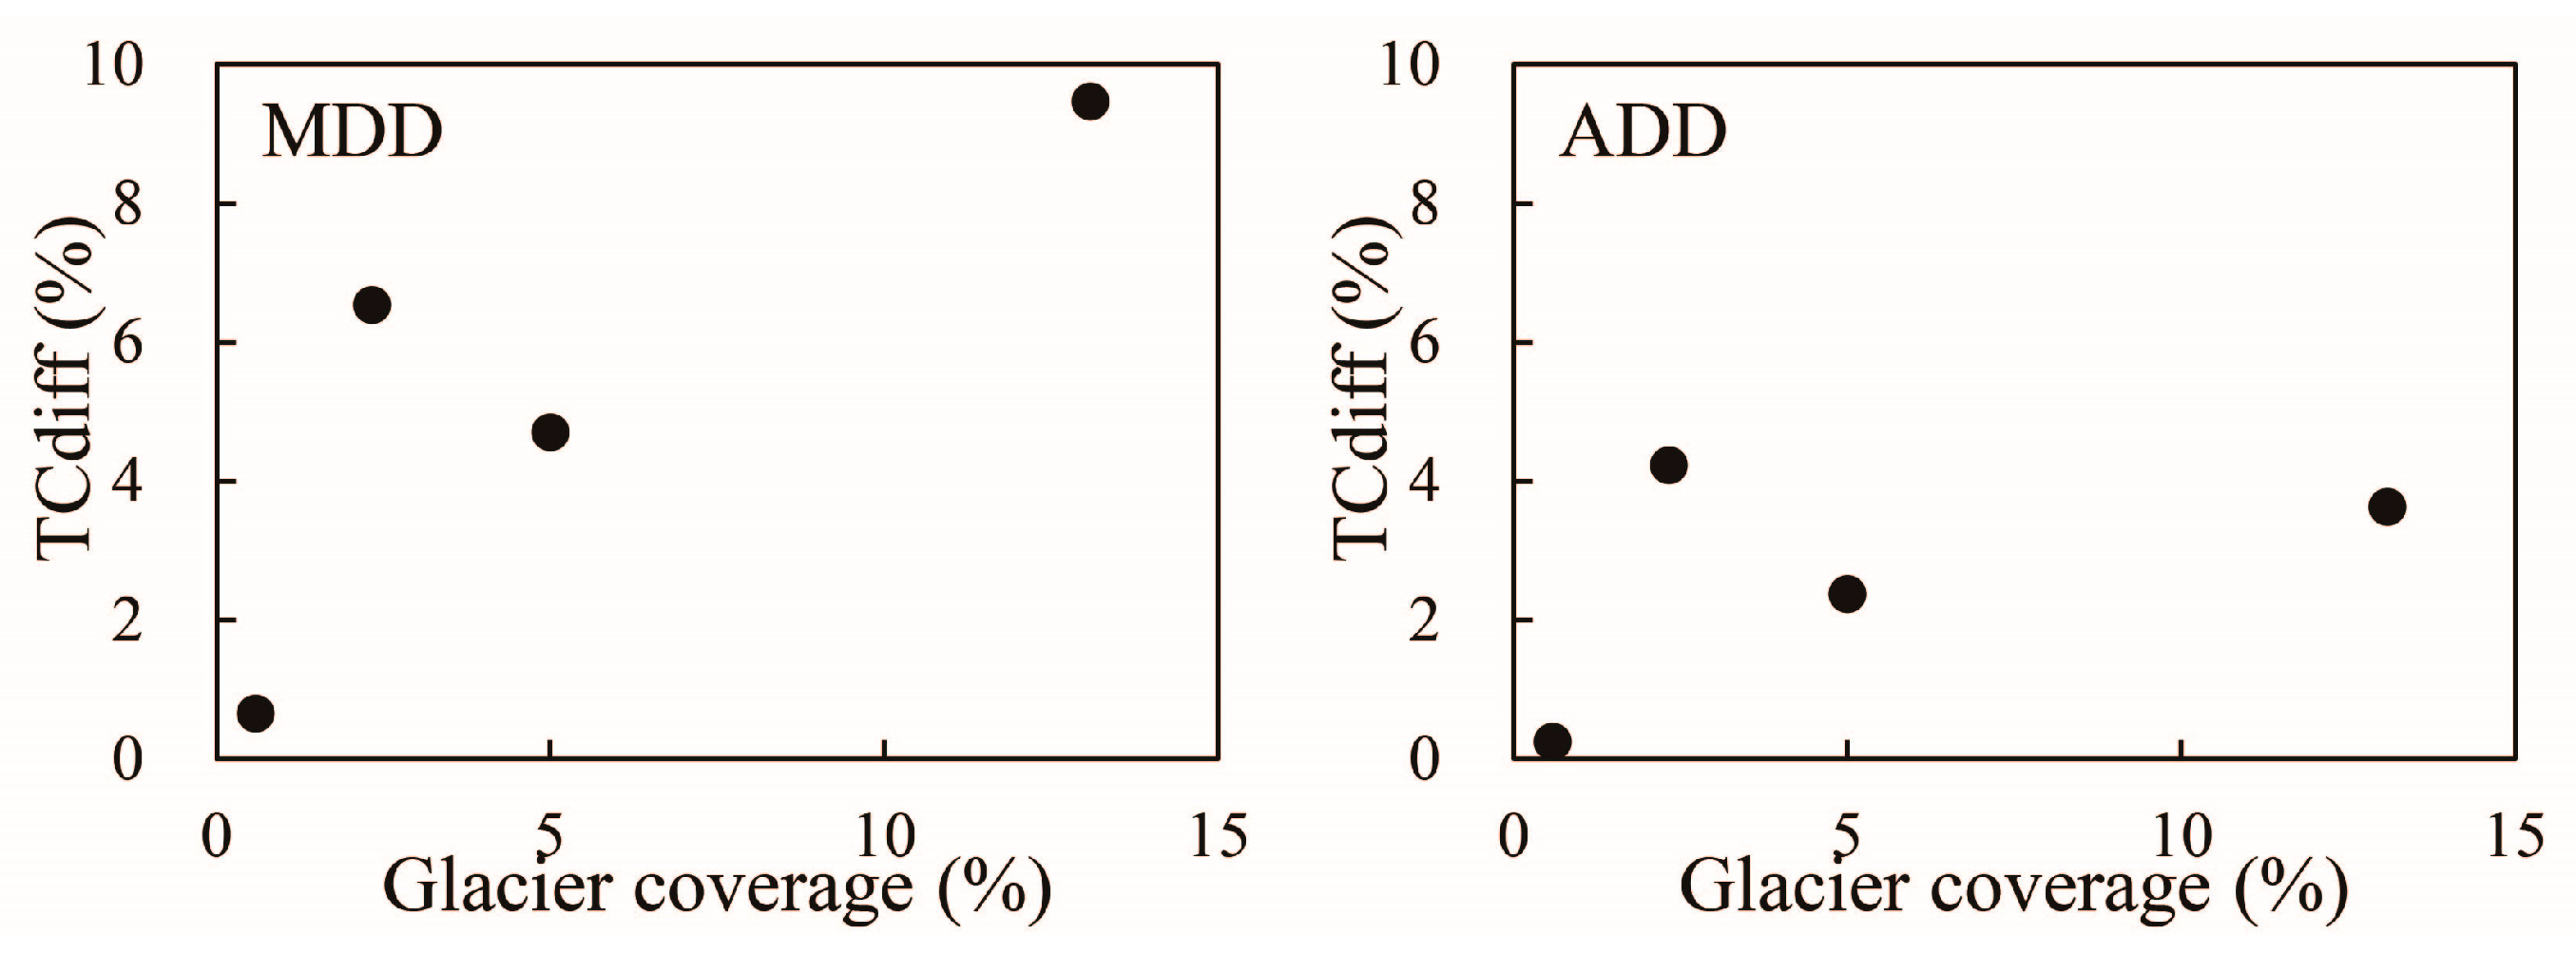
30]. The results of plotted TCdiff against glacier coverage (Figure 4) infer that with the increase of glacier coverage, the regulation of glaciers on runoff become stronger. Thus, the runoff variations during a year in basins which have high glacier coverage will likely be smaller than those in basins which have low glacier coverage due to the glacier’s effect of reducing peaks and filling valleys in the time series of daily discharge. These results are in agreement with the work of Ding et al. [31,32].
The regulation of glaciers on the runoff indices—MDD and ADD—are stronger in Kaidu River Basin than in Shule River Basin (Figure 4), though the glacier coverage of Kaidu River Basin is much smaller than that of Shule River Basin. The reason might be that the areal average daily temperature of summer is much higher in Kaidu River Basin than in Shule River Basin (Table 10). Thus, when only the relationships between TCdiff and glacier coverage are going to be discussed, basins with similar areal average daily temperature in summer should be selected since high summer temperature can enlarge the effect of glacier coverage on runoff [19]. Though only a few basins with glacier coverage were analyzed in this study due to lack of daily discharge data, this study is still a good case to reveal the regulation of glacier coverage on runoff.

5. Conclusions

In this study, two runoff indices—MDD and ADD—were defined and calculated for each runoff event in the time series of daily average discharge of selected upper basins of the Hei River, Shule River, Kaidu River, and Manas River during 1961–2007. As the start and end date of each runoff event can be found based on the definition of runoff event in this study, the precipitation and temperature events could be identified during these runoff events. Eight precipitation and temperature indices which might effect on runoff indices were defined and calculated for their associated runoff events. The linear regression relationships between these runoff indices and their associated precipitation and temperature indices were obtained for selected basins during wet and dry summers, respectively. Moreover, the regulations of glacier coverage on runoff were discussed according to the relationships between TCdiff and glacier coverage of these selected basins for both of the runoff indices. The following important conclusions were obtained.
Firstly, because glaciers and snow cover melting are controlled by temperature, the characteristics of runoff events in basins which lie in cold regions can be well explained by the variables of precipitation and temperature events during these runoff events. The linear regression equations on the relationship between runoff indices and their associated precipitation and temperature indices provide a possibility to explain the runoff events using precipitation and temperature datasets, which holds importance for basins in cold regions to be able to manage their water resources and prevent disasters.
Secondly, the increase of TCdiff with the increase of glacier coverage infers that the regulation of glaciers on runoff is more significant in basins which have larger glacier coverage. Thus, the variations of runoff during a year decrease in glacierized basins compared with those without glaciers or with small glacier coverage.

Acknowledgments

The present research was supported by the Ministry of Science and Technology of the People’s Republic of China (Grant No. 2013CBA01808), the National Natural Science Foundation of China (Grant No. 41671066), and the External Cooperation Program of the Chinese of Academy of Sciences (Grant No. Y560L01001). The authors are very thankful to the editor and the anonymous reviewers for their professional comments and suggestions which greatly improved the quality of this manuscript.

Author Contributions

Shaoping Wang performed data processing, result analysis, and wrote the article. Yongjian Ding collected the data and offered advice for this study. The independence of the runoff events defined in this study was discussed with Mudassar Iqbal and the knowledge of lag time between precipitation events and daily discharge peaks was also obtained from him.

Conflicts of Interest

The authors declare no conflict of interest.

References

  1. Havens, K.; Paerl, H.; Phlips, E.; Zhu, M.Y.; Beaver, J.; Srifa, A. Extreme Weather Events and Climate Variability Provide a Lens to How Shallow Lakes May Respond to Climate Change. Water 2016, 8, 229. [Google Scholar] [CrossRef]
  2. Mikhailova, M.V.; Mikhailov, V.N.; Morozov, V.N. Extreme hydrological events in the Danube River basin over the last decades. Water Resour. 2012, 39, 161–179. [Google Scholar] [CrossRef]
  3. Intergovernmental Panel on Climate Change (IPCC). Contribution of Working Group I to the Fifth Assessment Report of the Intergovernmental Panel on Climate Change; Stocker, T.F., Ed.; Cambridge University Press: Cambridge, UK, 2013. [Google Scholar]
  4. Lila, C.; Lindsay, B.; Christel, P. Assessing the Impact of Climate Change and Extreme Value Uncertainty to Extreme Flows across Great Britain. Water 2017, 9, 103. [Google Scholar] [CrossRef]
  5. Trenberth, K.E. Atmospheric moisture residence times and cycling: Implications for rainfall rates with climate change. Clim. Chang. 1998, 39, 667–694. [Google Scholar] [CrossRef]
  6. Chen, Y.N.; Li, Z.; Fan, Y.T.; Wang, H.J.; Fang, G.H. Research progress on the impact of climate change on water resources in the arid region of Northwest China. J. Geogr. Sci. 2014, 69, 1295–1304. (In Chinese) [Google Scholar]
  7. Zhai, P.M.; Pan, X.H. Change in Extreme Temperature and Precipitation over Northern China during the Second Half of the 20th Century. Acta Geogr. Sin. 2003, 58, 1–10. (In Chinese) [Google Scholar]
  8. Wang, Y.Q.; Fan, J.; Shao, M.A. Analysis of effects of climate change on reference evapotranspiration on the Loess Plateau in recent 50 years. Trans. CSAE 2008, 24, 6–10. [Google Scholar] [CrossRef]
  9. Wang, S.P.; Jiang, F.Q.; Ding, Y.J. Spatial coherence of variations in seasonal extreme precipitation events over Northwest Arid Region, China. Int. J. Climatol. 2015, 35, 4642–4654. [Google Scholar] [CrossRef]
  10. Sun, G.L.; Chen, Y.N.; Li, W.H.; Pan, C.D.; Li, J.; Yang, Y.H. Spatial distribution of the extreme hydrological events in Xinjiang, north-west of China. Nat. Hazards 2013, 67, 483–495. [Google Scholar] [CrossRef]
  11. Chen, Y.N.; Xu, C.C.; Hao, X.M.; Li, W.H.; Chen, Y.P.; Zhu, C.G.; Ye, Z.X. Fifty-year climate change and its effect on annual runoff in the Tarim River Basin, China. Quat. Int. 2009, 208, 53–61. [Google Scholar]
  12. Xu, J.H.; Chen, Y.N.; Lu, F.; Li, W.H.; Zhang, L.J.; Hong, Y.L. The Nonlinear trend of runoff and its response to climate change in the Aksu River, western China. Int. J. Climatol. 2011, 31, 687–695. [Google Scholar] [CrossRef]
  13. Xu, J.H.; Chen, Y.N.; Ji, M.H.; Lu, F. Climate Change and Its effects on Runoff of Kaidu River, Xinjiang, China: A Multiple Time-scale Analysis. Chin. Geogr. Sci. 2008, 18, 331–339. [Google Scholar] [CrossRef]
  14. Petrow, T.; Merz, B. Trends in flood magnitude, frequency and seasonality in Germany in the period 1951–2002. J. Hydrol. 2009, 371, 129–141. [Google Scholar] [CrossRef]
  15. Xia, J.; Du, H.; Zeng, S.D.; She, D.X.; Zhang, Y.Y.; Yan, Z.Q.; Ye, Y. Temporal and spatial variations and statistical models of extreme runoff in Huaihe River Basin during 1956–2010. J. Geogr. Sci. 2012, 22, 1045–1060. (In Chinese) [Google Scholar] [CrossRef]
  16. Marsh, P.; Woo, M. Snowmelt, glacier melt, and high arctic streamflow regimes. Can. J. Earth Sci. 1981, 18, 1380–1384. [Google Scholar] [CrossRef]
  17. Lipson, D.A.; Schadt, C.W.; Schmidt, S.K. Changes in Soil Microbial Community Structure and Function in an Alpine Dry Meadow Following Spring Snow Melt. Microb. Ecol. 2002, 43, 307–314. [Google Scholar] [CrossRef] [PubMed]
  18. Paul, F.; Machguth, H.; Kääb, A. On the impact of glacier albedo under conditions of extreme glacier melt: The summer of 2003 in the Alps. EARSeL eProc. 2005, 4, 139–149. [Google Scholar]
  19. Singh, P.; Jain, S.K. Snow and glacier melt in the Satluj River at Bhakra Dam in the western Himalayan region. Hydrol. Sci. J. Sci. Hydrol. 2002, 47, 93–106. [Google Scholar] [CrossRef]
  20. Ye, B.S.; Ding, Y.J.; Kang, E.S.; Li, G.; Han, T.D. Response of snowmelt and glacier runoff to the climate warming-up in the last 40 years in Xinjiang Autonomous Region, China. Sci. China Ser. D 1999, 42, 44–51. [Google Scholar] [CrossRef]
  21. Shen, Y.P.; Wang, G.Y.; Su, H.C.; Han, P.; Gao, Q.Z.; Wang, S.D. Hydrological Processes Responding to Climate Warming in the Upper Reaches of Kelan River Basin with Snow-dominated of the Altay Mountains Region, Xinjiang, China. J. Claciol. Geocryol. 2007, 29, 845–854. [Google Scholar]
  22. Wang, J.; Li, H.; Hao, X. Responses of snowmelt runoff to climatic change in an inland river basin, Northwestern China, over the past 50 years. Hydrol. Earth Syst. Sci. 2010, 14, 1979–1987. [Google Scholar] [CrossRef]
  23. Lins, H.F.; Slack, J.R. Streamflow trends in the United States. Geophys. Res. Lett. 1999, 26, 227–230. [Google Scholar] [CrossRef]
  24. Groisman, P.Y.; Knight, R.W.; Karl, T.R. Heavy precipitation and high streamflow in the contiguous United States Trends in the twentieth century. Bull. Am. Meteorol. Soc. 2001, 82, 219–246. [Google Scholar] [CrossRef]
  25. Kang, E.S. Relationship between runoff and meteorological factors and its simulation in a Tianshan glacierized basin. In Snow, Hydrology and Forests in High Alpine Areas, Proceedings of the Vienna Symposium, Vienna, Austria, 11–24 August 1991; Bergmann, H., Lang, H., Frey, W., Issler, D., Salm, B., Eds.; IAHS Publication No. 205; IAHS Publication: Oxfordshire, UK, 1991; pp. 189–202. [Google Scholar]
  26. Zappa, M.; Kan, C. Extreme heat and runoff extremes in the Swiss Alps. Nat. Hazards Earth Syst. Sci. 2007, 7, 375–389. [Google Scholar] [CrossRef]
  27. Koboltschnig, G.R.; Schöner, W.; Holzmann, H.; Zappa, M. Glaciermelt of a small basin contributing to runoff under the extreme climate conditions in the summer of 2003. Hydrol. Process. 2009, 23, 1010–1018. [Google Scholar] [CrossRef]
  28. Zou, Q.; Wang, G.Y.; He, B.; Shen, Y.P. Responding of summer runoff and flood processes to extreme climate evens in Manas River Basin, Tianshan Mountains during 1957–2010. J. Glaciol. Geocryol. 2013, 35, 733–740. (In Chinese) [Google Scholar]
  29. Chen, C.F.; Tsai, D.C. How destination image and evaluative factors affect behavioral intentions? Tour. Manag. 2007, 28, 1115–1122. [Google Scholar] [CrossRef]
  30. Ye, B.S.; Han, T.D.; Ding, Y.J. Some Changing Characteristics of Glacier Streamflow in Northwest China. J. Glaciol. Geocryol. 1999, 21, 54–58. (In Chinese) [Google Scholar]
  31. Ding, Y.J.; Ye, B.S.; Liu, S.Y.; Shen, Y.P.; Wang, S.L. Monitoring of frozen soil hydrology in macro-scale in the Qinghai-Xizang Plateau. Chin. Sci. Bull. 2000, 45, 1143–1149. [Google Scholar] [CrossRef]
  32. Ding, Y.J.; Ye, B.S.; Han, T.D.; Shen, Y.P.; Liu, S.Y. Regional difference of annual precipitation and discharge variation over west China during the last 50 years. Sci. China Ser. D Earth Sci. 2007, 50, 936–945. [Google Scholar] [CrossRef]
Figure 1. Locations, delineations, and glacier distribution maps of the upper basins of Kaidu River, Manas River, Shule River, and Hei River in Northwest Arid Region, China. The glacier areas account for 0.59, 2.34, 5.01, and 13.1% of the catchment drainage areas in these upper basins, respectively.
Water 09 00618 g001
Figure 2. Definition of runoff event.
Water 09 00618 g002
Figure 3. The anomaly percentage P of summer discharge amount in studied basins and the thresholds for wet and dry summers of these basins.
Water 09 00618 g003
Figure 4. Differences of contributions of the temperature indices to the runoff indices between dry and wet summers (TCdiff) against the glacier coverage.
Water 09 00618 g004
Table 1. Runoff indices based on the definition of runoff event in this study.
IDIndicator NameDefinitionsUnits
MDDMaximum discharge differenceDifference between the daily peak and valley discharge during a runoff eventm3/s
ADDAccumulated direct dischargeAccumulated daily direct discharges during each runoff event. Daily direct discharge is discharge difference between a certain daily discharge and the valley discharge in a runoff eventm3/s
Table 2. Precipitation and temperature indices based on daily precipitation and temperature during their associated runoff events.
IDIndicator NameDefinitionsUnits
MDPMaximum daily precipitationMaximum daily precipitation during a runoff eventmm/day
DPPDaily precipitation of the day with discharge peakDaily precipitation of the day with discharge peak during a runoff eventmm/day
APAAccumulated precipitation amountAccumulated precipitation amounts during a runoff eventmm
DPDays of precipitationDays of precipitation during a runoff eventdays
IPAverage intensity of precipitationAverage intensity of precipitation events during a runoff eventmm/day
ATAccumulated positive temperatureAccumulated daily average temperature >0 °C in a runoff event°C
MnTMean temperatureMean of daily average temperature in a runoff event°C
MTMaximum temperatureMaximum daily average temperature in a runoff event°C
Table 3. The results of retained components (eigenvalues, variance explained, and cumulative variance explained) extracted through PCA analysis with varimax rotation scheme on precipitation and temperature indices during wet and dry summers for each selected basin.
ComponentsWet SummersDry Summers
EigenvaluesVariance Explained (%)Cumulative Variance Explained (%)EigenvaluesVariance Explained (%)Cumulative Variance Explained (%)
Hei River Basin
12.84435.54635.5462.77734.71334.713
22.33129.14264.6882.54131.76766.480
32.08126.01690.7041.89323.66890.147
Kaidu River Basin
13.04538.06838.0683.18939.86239.862
22.17427.17365.2412.75934.48274.344
32.13926.73891.9791.18414.80589.149
Shule River Basin
12.90036.25136.2513.20140.01340.013
22.23027.87664.1273.08338.53478.548
31.99424.92489.051
Manas River Basin
13.08438.55038.5503.27740.96340.963
22.09126.14164.6903.05338.16279.125
32.08925.11290.803///
Table 4. Loading matrix results for the vectors of the retained components on precipitation and temperature indices for each selected basin during wet and dry summers.
Precipitation and Temperature IndicesComponents
Hei River BasinKaidu River BasinShule River BasinManas River Basin
123123123123
Wet summers
MDP0.844−0.0870.3270.8310.414−0.1610.884−0.1000.2410.9290.176−0.122
DPP0.7560.214−0.2410.845−0.1610.0940.7040.291−0.1990.796−0.0740.185
APA0.7700.0290.6090.8320.507−0.1300.834−0.0330.4940.8260.476−0.150
DP0.0610.1220.9610.1540.963−0.0940.1080.2160.9440.1090.9800.078
IP0.979−0.0430.0260.9440.074−0.1630.951−0.110−0.0420.930−0.046−0.234
AT0.0460.6310.7520.0640.8680.4470.0350.5680.8010.0430.8780.455
MnT−0.0080.9820.023−0.170−0.0520.966−0.0790.9540.150−0.1650.0640.951
MT0.0570.9470.235−0.0180.1730.9590.0550.9180.3080.0010.3020.919
Dry summers
MDP0.827−0.1180.3970.914−0.0960.205−0.0530.959/0.952−0.027/
DPP0.7240.375−0.1870.2480.0920.8330.1100.516/0.6620.024/
APA0.7940.0330.5750.9580.0430.1260.1230.956/0.9410.164/
DP0.1480.2440.9210.6790.574−0.3440.7720.248/0.2930.782/
IP0.953−0.1120.0400.775−0.2750.460−0.2150.934/0.914−0.227/
AT0.0740.7140.6760.4340.821−0.2710.9600.083/0.1180.950/
MnT−0.0350.9640.059−0.3390.8830.1210.863−0.190/−0.3000.799/
MT0.0200.9350.242−0.0910.9390.1180.929−0.070/−0.1510.906/
Table 5. The significances of linear regression equations where dependent variables are runoff indices (MDD and ADD), and the independent variables are precipitation and temperature indices (MDP, DPP, APA, DP, IP, AT, MnT, and MT) for each selected basin during wet and dry summers.
MDDADD
Fit Goodness TestVariance Analysis (ANOVA)Fit Goodness TestVariance Analysis (ANOVA)
Adjusted R2F ValuespAdjusted R2F Valuesp
Hei River Basin
Wet summers0.50269.6610.0000.696156.3990.000
Dry summers0.53982.9170.0000.706169.0240.000
Kaidu River Basin
Wet summers0.566188.1060.0000729386.9790.000
Dry summers0.529129.2830.0000.895647.9840.000
Shule River Basin
Wet summers0.56582.2450.0000.754192.6920.000
Dry summers0.511102.4550.0000.708235.6350.000
Manas River Basin
Wet summers0.33734.9560.0000.783242.2460.000
Dry summers0.512127.6080.0000.771406.0990.000
Table 6. Standardized coefficients of linear regression equations on the relationships of summer runoff indices with extracted components from precipitation and temperature indices during wet and dry summers. The significances of these coefficients are tested by t-test and the results are illustrated by t statistic values and their associated significance probability: p-values. If p < 0.05, the coefficients are significant at the 95% confidence level.
ComponentsWet SummersDry Summers
Standardized Coefficientst-ValuespStandardized Coefficientst-Valuesp
Hei River Basin
MDD10.59111.9760.0000.56312.0260.000
20.1873.7800.0000.2304.9020.000
30.3547.1600.0000.4198.9490.000
ADD10.40710.5320.0000.42011.2120.000
20.1433.7090.0000.2005.3450.000
30.71718.5610.0000.70318.7830.000
Kaidu River Basin
MDD10.68017.4910.0000.70715.5680.000
20.3268.3830.0000.18340.270.000
3//////
ADD10.34611.2690.0000.73334.11800.00
20.78225.4360.0000.52924.63700.00
3///−0.282−13.15000.00
Shule River Basin
MDD10.4799.9450.0000.57111.3740.000
20.2785.7850.0000.4368.6910.000
30.51510.6940.000///
ADD10.3349.2220.0000.73018.7880.000
20.3529.7300.0000.42210.8760.000
30.72319.9590.000///
Manas River Basin
MDD10.4317.4800.0000.3267.2510.000
20.3606.2590.0000.64014.2350.000
30.1803.1200.002///
ADD10.2788.4510.0000.33210.7720.000
20.81624.8030.0000.81426.3850.000
30.2086.3350.000///
Table 7. Standardized coefficients of linear regression equations on the relationships of runoff indices—MDD and ADD—with precipitation and temperature indices during wet and dry summers.
MDPDPPAPADPIPATMnTMT
Wet summers
Hei River Basin
MDD0.5980.4020.6760.3990.5800.4110.1870.294
ADD0.5660.1650.7540.7310.4110.6480.1540.327
Kaidu River Basin
MDD0.7000.5220.7310.4190.6660.326−0.1330.056
ADD0.6110.1660.6840.8060.3840.701−0.0990.129
Shule River Basin
MDD0.5200.3160.6450.5980.4030.5870.3050.414
ADD0.4340.1940.6240.7950.2490.7910.4180.564
Manas River Basin
MDD0.4050.3500.5000.4140.3420.4170.1230.275
ADD0.3770.1990.5870.8460.1720.8230.2040.438
Dry summers
Hei River Basin
MDD0.6050.4160.6960.5250.5280.4890.2270.328
ADD0.6030.2480.7440.7580.4060.6490.2200.366
Kaidu River Basin
MDD0.6290.1920.6850.5850.4980.457−0.0780.108
ADD0.561−0.0040.6890.8980.2930.8290.1840.397
Shule River Basin
MDD0.3880.2880.4870.5490.2840.5840.4100.500
ADD0.3660.2980.4930.6680.2370.7360.5500.649
Manas River Basin
MDD0.2930.2310.4120.5960.1530.6460.4140.531
ADD0.2940.2390.4460.7340.1190.8120.5510.687
Table 8. Contributions of eight precipitation and temperature indices to the variations in the runoff indices during wet and dry summers. Unit: (%).
MDPDPPAPADPIPATMnTMT
Wet summers
Hei River Basin
MDD15.2669.99217.57411.03314.54011.5035.4188.281
ADD13.2093.39117.99018.1419.23616.1593.9658.209
Kaidu River Basin
MDD18.91513.13119.64312.40517.2309.875−3.4931.745
ADD15.6233.22117.53622.0059.07719.242−2.4693.591
Shule River Basin
MDD11.1956.78314.76814.6148.63914.4187.55510.148
ADD8.6573.66613.19417.6214.71417.5629.29712.448
Manas River Basin
MDD11.5349.70614.86413.8979.14314.1054.5189.243
ADD7.9043.98313.93221.5303.17620.9635.30111.068
Dry summers
Hei River Basin
MDD14.5379.35616.91513.52912.22112.3845.4388.038
ADD13.6454.84317.05918.1728.66515.3444.8718.374
Kaidu River Basin
MDD15.8304.94717.38515.32412.35312.303−1.1913.557
ADD7.383−2.6409.71515.0812.36914.1953.6086.798
Shule River Basin
MDD9.7497.19712.19613.5907.19314.43310.07812.321
ADD8.0466.51010.78914.4515.26415.88211.82713.978
Manas River Basin
MDD6.9575.56810.13315.6393.24517.14511.30914.298
ADD5.8744.8689.29716.2791.95718.18512.62415.580
Table 9. Total contributions (%) of the temperature indices to the runoff indices—MDD and ADD—during wet and dry summers in studied basins.
MDDADD
Wet SummersDry SummersWet SummersDry Summers
Hei River Basin25.20325.86028.33228.589
Kaidu River Basin8.12714.66920.36424.601
Shule River Basin32.12136.83239.30741.687
Manas River Basin27.86637.33242.75246.389
Table 10. Areal average daily average temperature in summer of selected basins.
BasinsTemperature (°C)
Hei River Basin5.96
Kaidu River Basin8.86
Shule River Basin6.39
Manas River Basin7.21

