Article

Incorporating Rainfall-Runoff Events into Nitrate-Nitrogen and Phosphorus Load Assessments for Small Tile-Drained Catchments

1
Research Institute for Soil and Water Conservation, Prague; Zabovreska 250, 156 27 Praha-Zbraslav, Czech Republic
2
Prague, Čílova 277/13, 162 00 Praha 6-Veleslavín, Czech Republic
*
Author to whom correspondence should be addressed.
Water 2017, 9(9), 712; https://doi.org/10.3390/w9090712
Submission received: 2 June 2017 / Revised: 1 September 2017 / Accepted: 13 September 2017 / Published: 16 September 2017

Abstract

:
Rainfall-runoff events significantly influence water runoff and the loss of pollutants from tile-drained agricultural land. We monitored ten small (4 to 38 ha) tile-drained catchments in Czechia for three to five years (2012 to 2016). The discharge was measured continuously; a regular 14-day scheme of water quality monitoring was accompanied with event sampling provided by automatic samplers in 20 to 120 min intervals. A new semi-automated algorithm was developed for the identification of runoff events (RE) based on discharge and water temperature changes. We then quantified the share of RE on the total runoff and the N and P losses, and we compared six methods for nutrient load estimation on an annual and monthly basis. The results showed considerable differences among the monitored sites, seasons, and applied methods. The share of RE on N loads was on average 5% to 30% of the total annual load, whereas for P (dissolved and total), the share of RE was on average 10% to 80% on the total annual load. The most precise method for nutrient load estimation included the RE. The methods based on point monitoring of the discharge and water quality underestimated the loads of N by 10% to 20% and of P by 30% to 80%. The acquired findings are crucial for the improvement of nutrient load assessment in tile-drained catchments, as well as for the design of various mitigation measures on tile-drained agricultural land.

1. Introduction

There is great concern among hydrologists, watershed managers, and as policy makers about how different rainfall-runoff events influence hydrology as well as the loss of pollutants from tile-drained agricultural land [1,2]. Intensively managed tile-drained landscapes have been found to have a considerable potential for N and P losses, with regard to different soil conditions and cropping systems, especially during periods with elevated flows [3,4,5,6,7,8,9]. Nutrient concentrations in drainage waters may change rapidly within a rainfall-runoff event due to variable pre-event and event soil/catchment moisture conditions, related soil biogeochemical processes [10,11,12,13], precipitation characteristics, and water flow paths into drainage and with different origin and residence times [14,15,16,17].
Tile-drained fields and catchments of various scales have been subject to many studies trying to quantify how different sampling strategies, monitoring schemes, and load calculation methods influence the assessment of runoff and nutrient fluxes from tile drains, from one season to longer periods. While there is in-depth research for individual fields or paired catchments [8,14,18,19,20,21], not many mid-term studies have been conducted to compare nutrient losses and load assessment methods for tile-drained fields or small catchments with different agricultural management and runoff characteristics, especially in central European conditions. In the Czech Republic, around 30% of the agricultural land is tile-drained, and in some regions land drainage exists on every field [22,23].
The basic classification of load estimation methods is usually in four categories: averaging methods, ratio estimators, period-weighted, and regression methods. For nitrate-N load estimation, two methods have been recommended by numerous authors: (1) linear interpolation, a period weighted method, and (2) flow-weighted mean concentration, an averaging method [18,24,25]. Previous research has shown that the uncertainty due to infrequent sampling and nutrient load estimation approaches for drainage systems or small streams is often much greater than the uncertainty brought about by other steps in the sample collection process [25,26,27]. In general, the uncertainties in annual or monthly nutrient load estimates are reported to be influenced both by the sampling interval and the load assessment methods and tend to increase with an increasing sampling interval for the majority of load estimation algorithms [24,25,28]. Ratio methods are often reported as bei ng unsatisfactory compared with the two aforementioned simple methods. Regression based algorithms are also found to poorly characterize load variation (especially for nitrates) in drainage or small watercourses [27,29] despite the implementation of error correction techniques [20,30].
To our knowledge, only a few studies have been published to compare monitoring approaches and nutrient load assessment methods for tile-drained fields or small catchments [6,25,27,31]. These studies often conclude that the most dominant factors influencing nutrient fluxes are precipitation characteristics and catchment hydrological connectivity. This pertains, compared to nitrogen, to a greater extent to phosphorus, as high P concentrations in water from land drainage are associated predominantly with elevated flows, both from ploughland and grassland [4,5,32,33,34]. Load assessment approaches without continuous discharge measurements and event sampling tend to underestimate P loads especially [33,35]. However, little is still known about how and to what extent various nutrient load assessment approaches, including those used in operational activities (e.g., of River Basin Authorities) may differ for small, tile-drained catchments, situated in sloping conditions. Further, there is an obvious research gap in the knowledge of the hydrological behaviour of small, tile-drained catchments with different soil and land-use characteristics, especially during various rainfall-runoff events captured by different monitoring strategies [1,36].
The necessity of the accurate assessment of nutrient loads from tile-drained fields or small catchments is invoked by watershed management and agricultural policy aims oriented towards diminishing nutrient and pesticides losses from drained land [2,36,37]. Therefore, it is crucial to develop an approach to identify the processes responsible for the input of pollutants from land to water via tile drainage. To reveal the rapid discharge/concentration changes, describe the related processes, and estimate the true pollutant loads, a proper monitoring programme and appropriate methods for the evaluation of matter fluxes are necessary to support [6,18,38] the design of field to catchment scale mitigation measures for tile drainage or on drained land, as well as when estimating their effects [2,9,22,38,39,40].
The aim of this study was to quantify the proportion of N and P losses in drainage waters from runoff events, assess the real N and P losses, and to compare six different methods for N and P load estimation at ten very small tile-drained catchments with different drainage and agricultural management characteristics in Czechia on a monthly and annual basis in three to five hydrological years between 2012 and 2016.

2. Materials and Methods

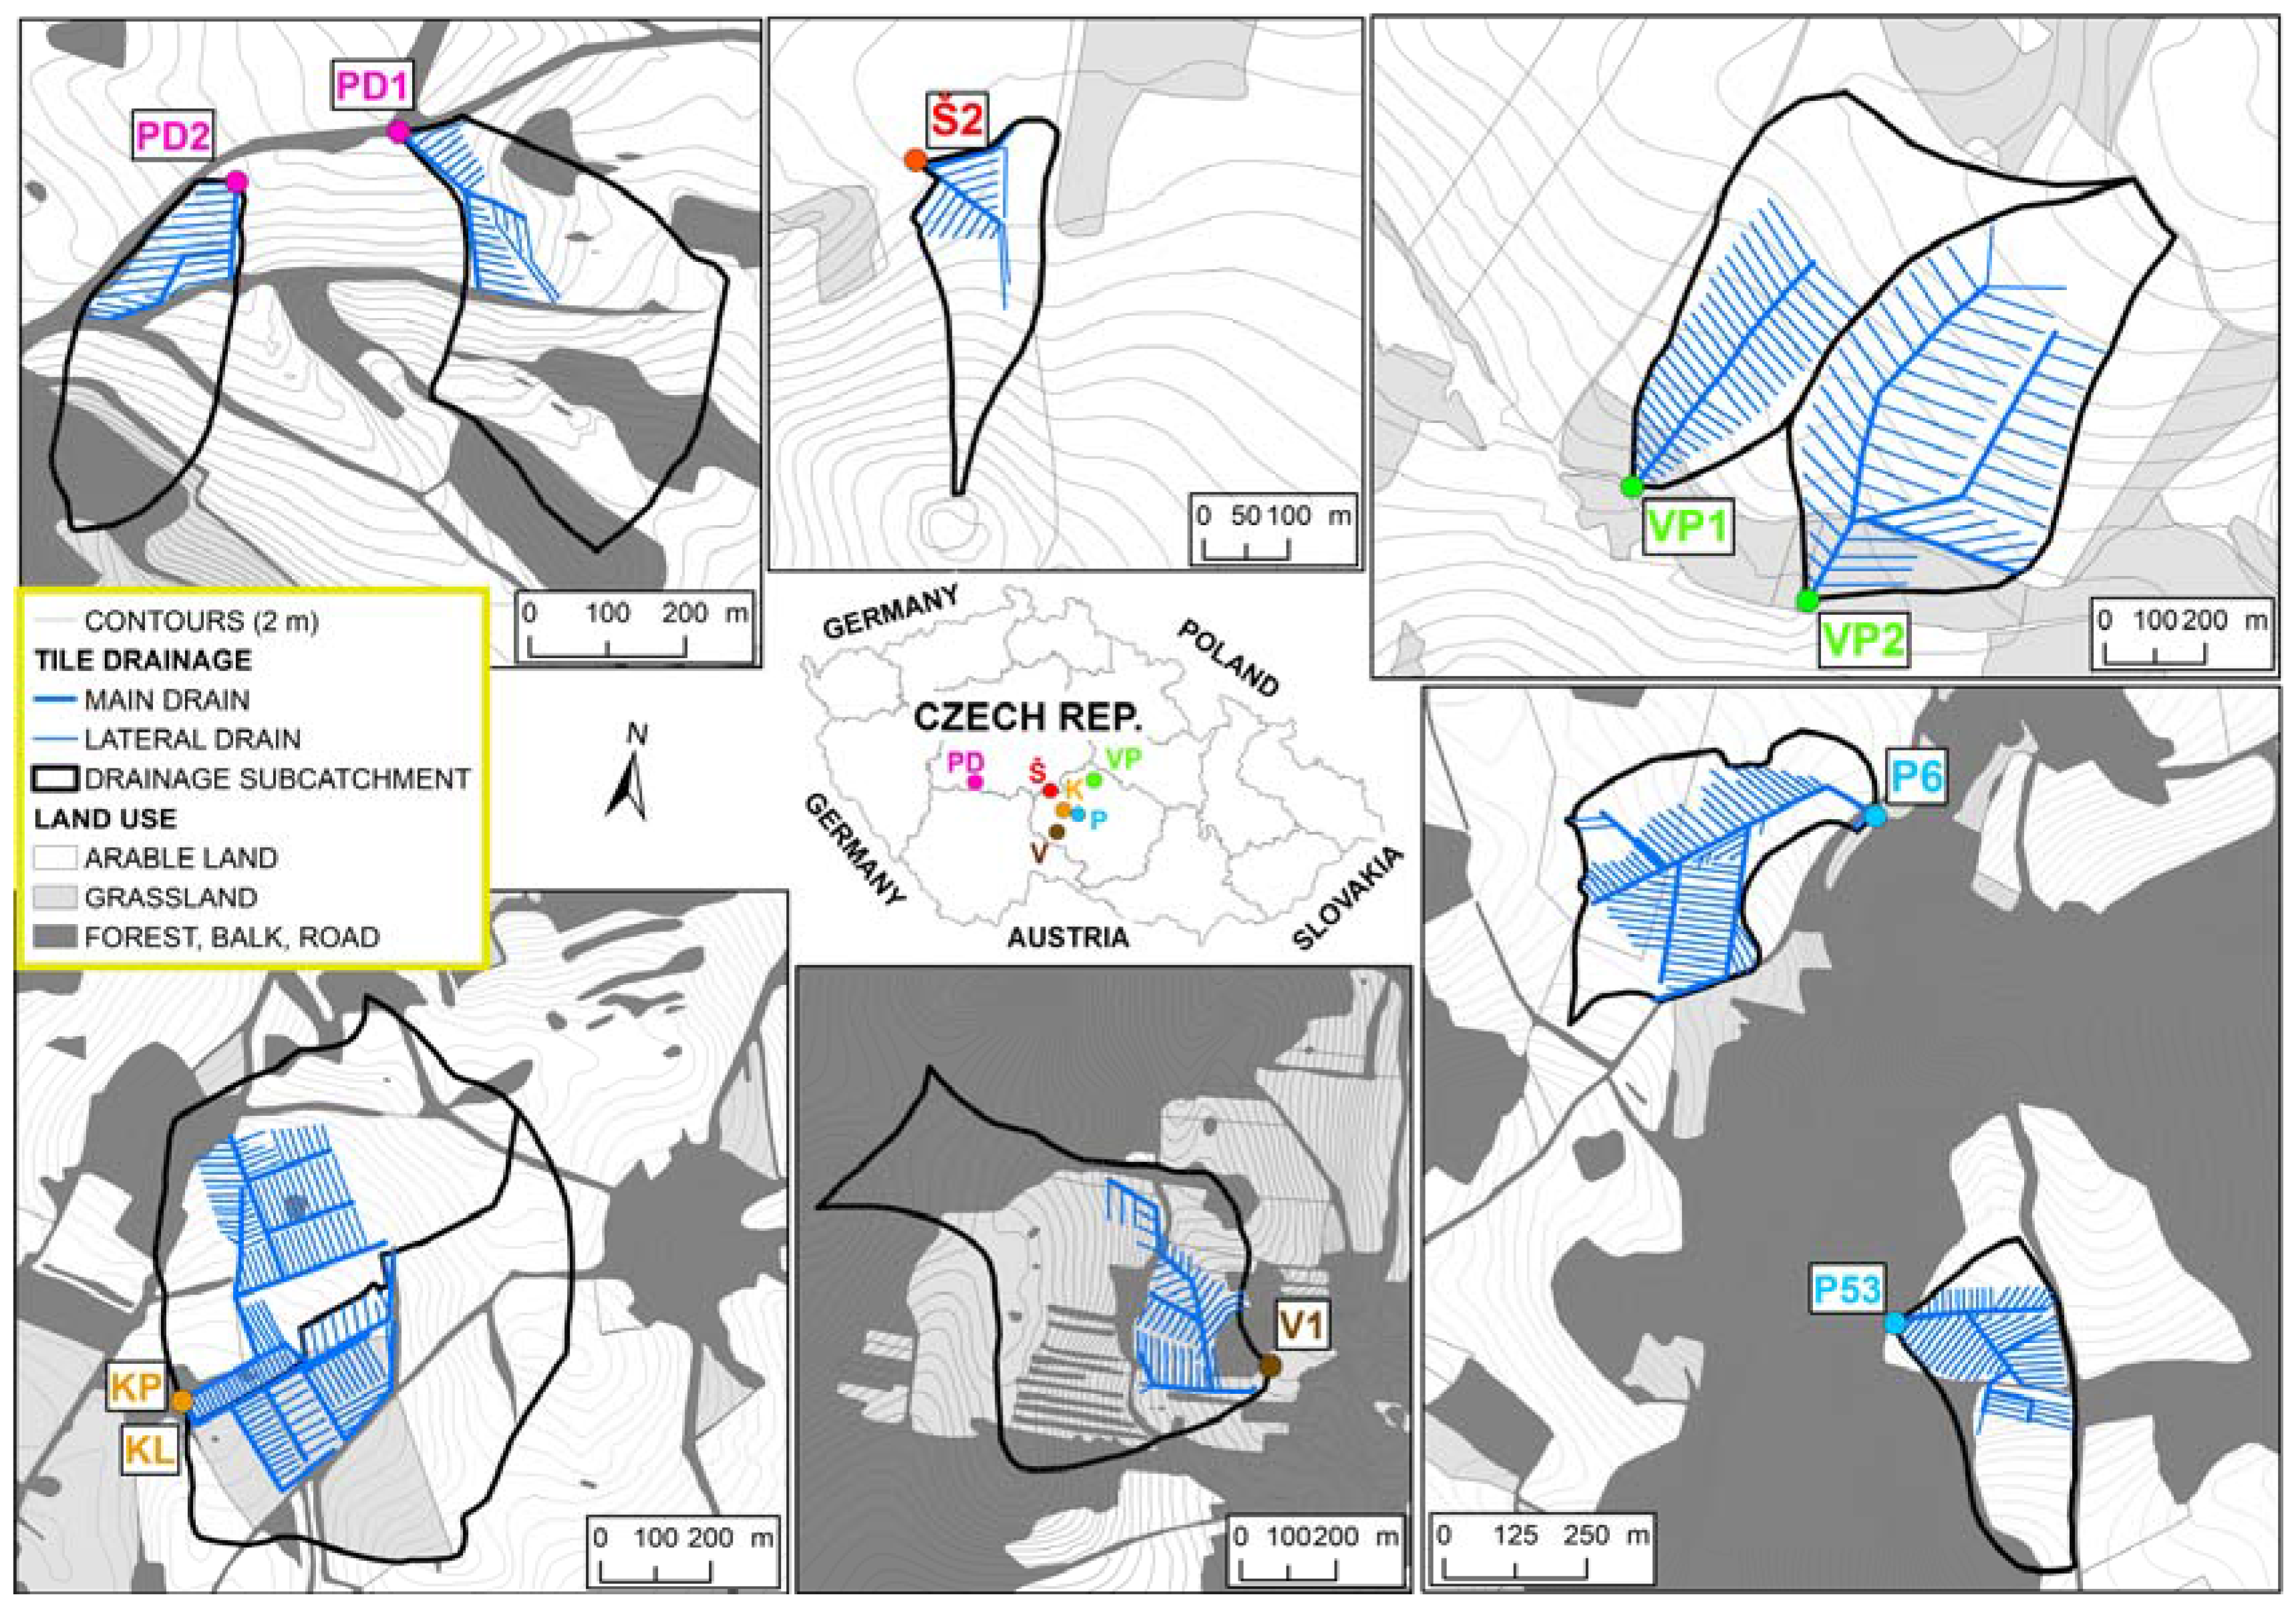
2.1. Experimental Sites

The research was conducted in the Bohemo-Moravian Highlands, Czech Republic. The catchment areas were 4 to 38 ha, and the sites were monitored for three to five hydrological years. These sites represent the prevailing soil types and agricultural management practices across the Czech Highland region. At all the sites, tile drainage is located on slopes of 3° to 6°. The substrate of the sites is crystalline rocks, i.e., various forms of paragneiss, ortogneiss, or granite. Soils at the sites are heterogenous; in discharge areas (mid to low parts of slopes), there are usually stagnic cambisols, haplic stagnosol, haplic gleysols, and sporadically histosols (sandy clay loam/loam) [41]. In the recharge areas (upper slope parts, close to catchment boundaries), there are haplic and shallow haplic cambisols and cambic hyperskeletic leptosol (loamy sand/sandy loam) [41]. Artificial drainage is placed 0.9 to 1.1 m below the soil surface, drain spacing is between 10 to 18 m, and, since the drainage is built on slopes, the hydrologically contributing area (subcatchment) for a drainage group is far larger than the drained field itself [15,17,42,43]. The average annual precipitation at the sites ranged between 550 and 750 mm. On ploughland, cereals, oil seed rape, maize, and, to a lesser extent, potatoes were the typical planted crops. Ploughland catchments were fertilized on average by 120 to 180 kg N·ha−1·y−1 and by 20 to 30 kg P·ha−1·y−1. The sites PD1 and PD2, where maize was grown, were fertilized by 250 to 300 kg N·ha−1·y−1. The basic characteristics of the sites are given in Table 1, and the locations of the sites are depicted in Figure 1.

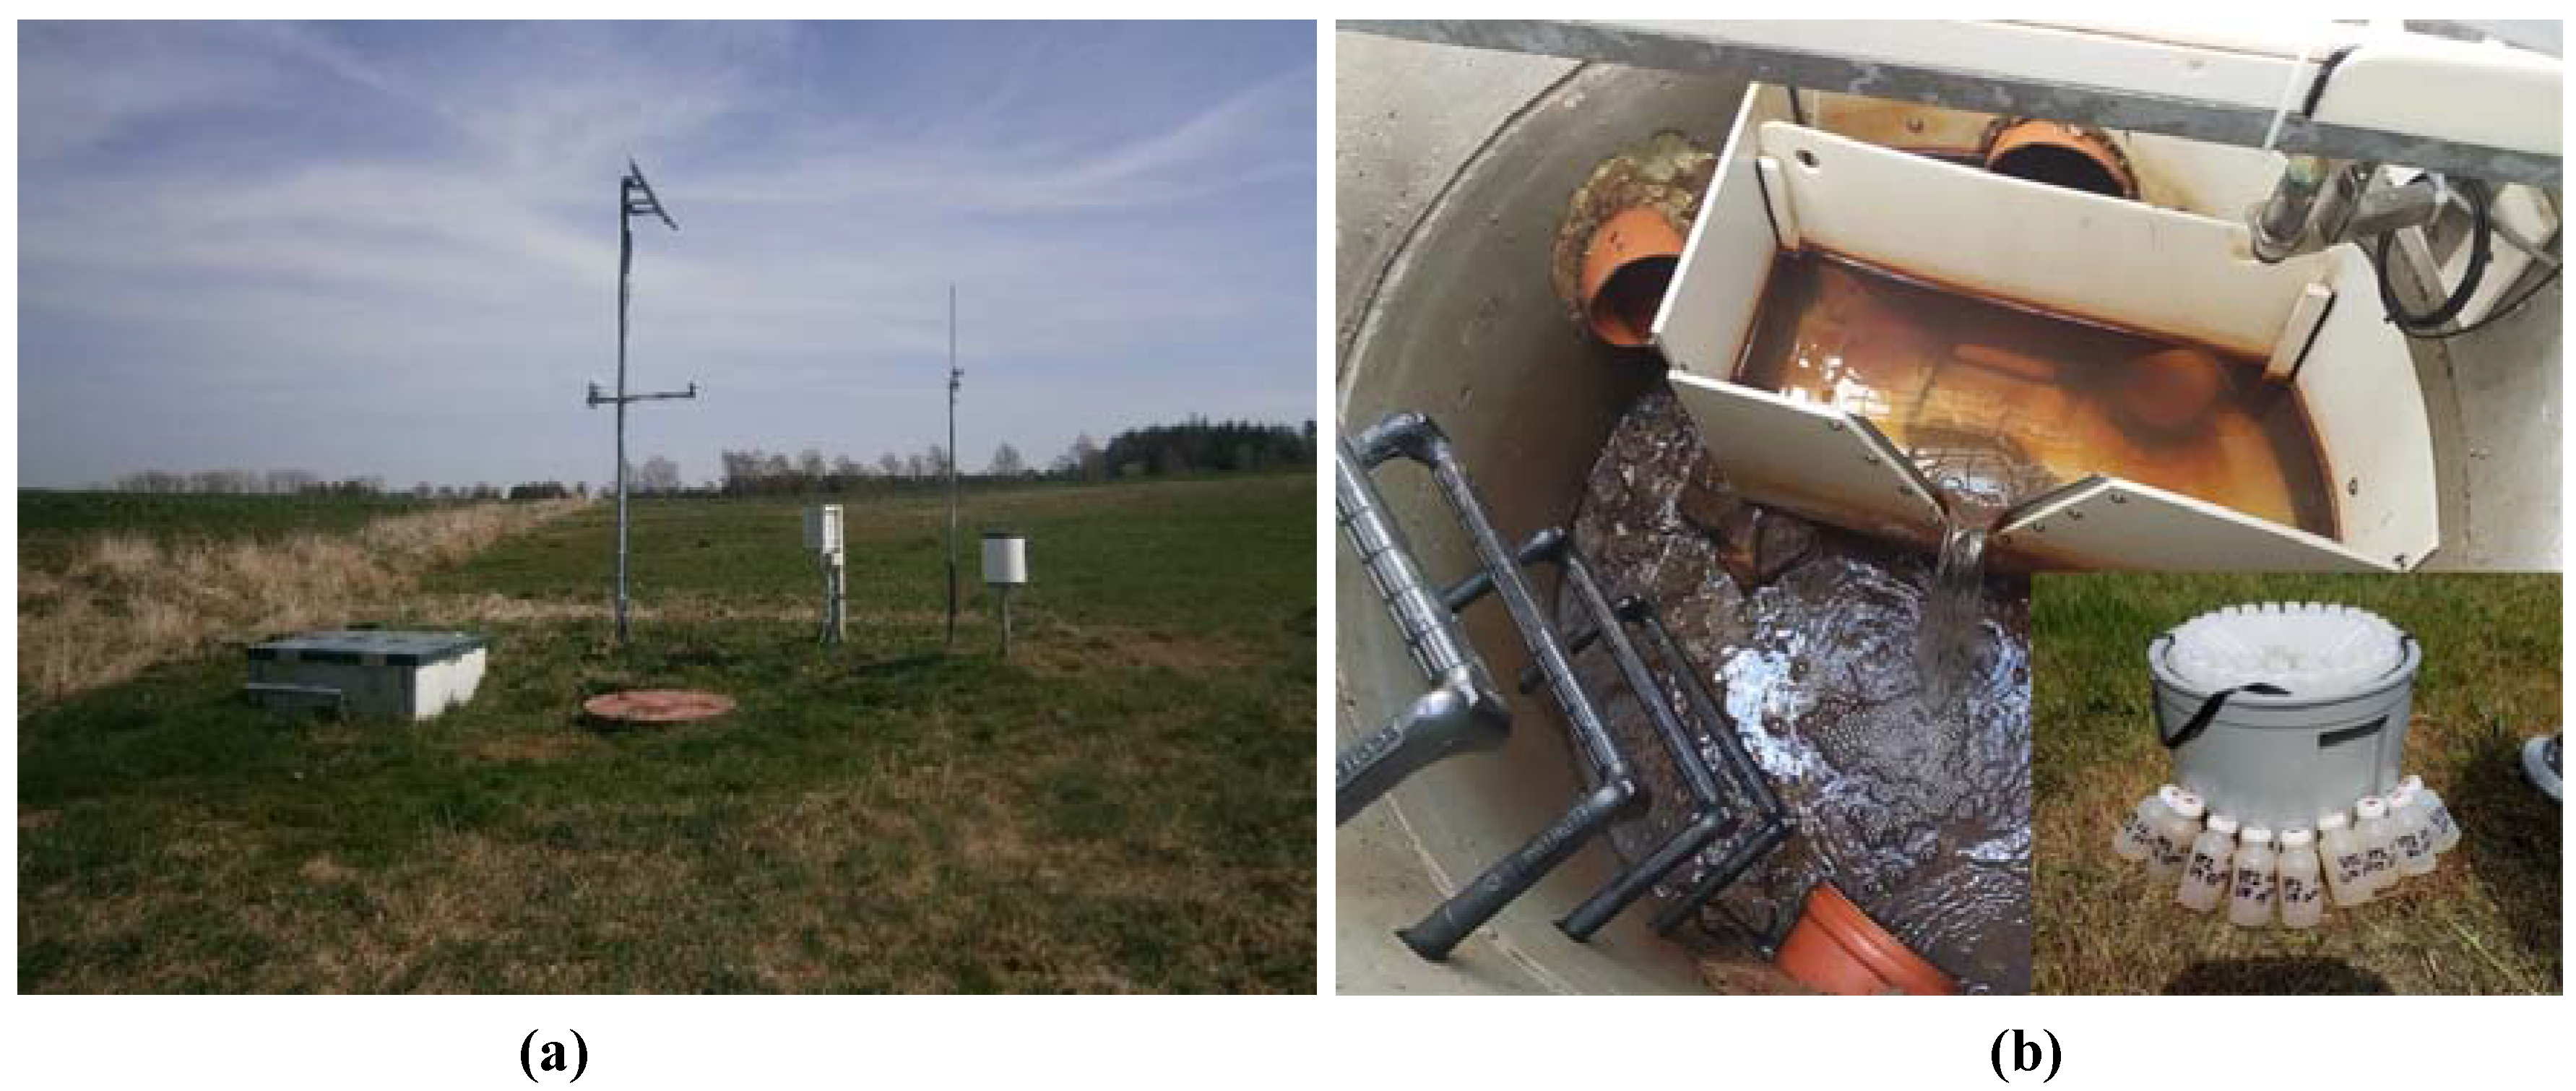
2.2. Monitoring the Setup and Analyses of Samples

The drainage discharges were measured continuously at the sites of all drained catchments (manholes or drainage outlets) using ultrasound water level sensors and calibrated weirs (see example in Figure 2). Further, drainage water temperatures were monitored continuously and used as a proxy for the detection and selection of unsampled discharge events; the details are given below. At each site, a weather station measured precipitation and selected meteorological parameters. The withdrawal of water samples differed according to the discharge situation. During periods of prevailing baseflow and slow interflow, the samples were collected manually in a regular two-week step (grab sampling). During runoff events (RE), samples were taken by automatic samplers (ISCO, Morava) in time steps varying from 20 min (summer events) to 2 h (winter events). Sampling was activated by an increase of drainage discharge. The particular discharge level that triggered automatic sampling was set according to the precipitation forecast and with regard to previously measured discharges. On average six (4 to 8) samples were taken during a single sampled RE. Immediately after withdrawal, the samples were transported to an accredited laboratory, where they were analyzed for N-NO3, P-PO4, and total phosphorus (Ptot) by an automated SKALAR device using Flow Injection and Continuous Flow Analyses (spectrophotometry).
For the identification of the REs, a new semi-automated algorithm was developed, taking into account previously published approaches [29,44]. A RE was considered as an episodic drainage runoff, elevated by rainfall or snowmelt. The algorithm for the detection of an RE was based on a 10-min discharge and water temperature data record. The algorithm identified a RE, based on the following criteria: drainage discharge for at least 3 h exceeding 1.5 times the mean daily discharge of the previous day. The beginning of a RE took place when the drainage discharge rose by 10% or more within 2 h. This eliminated short-term discharge changes during very low flow conditions or due to weir clogs. The end of a RE was set when the drainage water temperature became stable for >2 h so no event water appeared in the drainage discharge [17]. Runoff events with several flow peaks were considered as one RE if the time between the consecutive flow peaks was less than 24 h. The procedure for the identification of REs was applied to all REs, no matter whether they were sampled or not. An example of the use of the aforementioned method is shown in Figure 3.

2.3. Description of Applied Load Assessment Methods

For the load assessment of N-NO3, P-PO4, and Ptot, six different methods (M1 to M6) using annual (a) and/or monthly (m) time scales were employed and compared. M1 to M3 are commonly used techniques when 14 to 30 day grab sampling schemes are followed. The descriptions and equations of these methods are given in Table 2. Nutrient loads were further converted to year- and area-specific losses, dividing the load by the drainage subcatchment area. For load assessments in the unsampled RE (M6), flow-weighed concentration values (Cfw) from a particular season (veg; April to September/non-veg; October to March/snow melt) were used to calculate the loads during these events. The calculation of the Cfw was as follows:
C f w = ( C i × Q i ) Q i
where Cfw is the flow-weighted concentration, Ci is the concentration value during an i withdrawal, and Qi is the discharge during i withdrawal. Cfw was further employed for the basic description of the hydrochemical behaviour of the individually monitored sites (Table 3). The nutrient loads according to M6 were considered the ‘true load’.

2.4. Statistical Analyses and Comparison of Load Assessment Methods

Basic statistics on drainage discharges as well as on N-NO3, P-PO4, and Ptot concentration values were applied across all the sites, separately for regular and for event sampling schemes. Using both the monitored data and the semi-automated algorithm, the share of REs in the total drainage runoff was quantified. Further, the proportions of REs in the N-NO3, P-PO4, and Ptot loads were calculated on an annual and a monthly basis. The comparison of the differences in the load assessment methods both for the annual (M1 to M5) and monthly (M3 to M5) loads was related to the true load method (M6). For the statistical significance of the differences among the methods on an annual basis, one-way ANOVA with a significance level of α = 0.05 was applied. Assumptions of the normal distribution of the data and the homogeneity of variances were checked, and, when they were not assumed to be satisfied, rank (N-NO3 and Ptot) or square root transformations (P-PO4) were carried out. For a comparison of the differences between the selected load assessment methods (M3 to M6) on a monthly basis, root mean square error (RMSE) was used. RMSE expresses the cumulative degree of the relative error of a particular method, related to M6, when both accuracy and precision are taken into account [45]. Accuracy (E) was calculated as a ratio of M6 to M1 to M5 (Equation (8)), and precision was expressed by the standard deviation s of E. The RMSE was then calculated according to Equation (9).
E M 3 , M 4 , M 5   =   M 6 M 3 , M 4 , M 5
R M S E = Ē 2 + s 2

3. Results

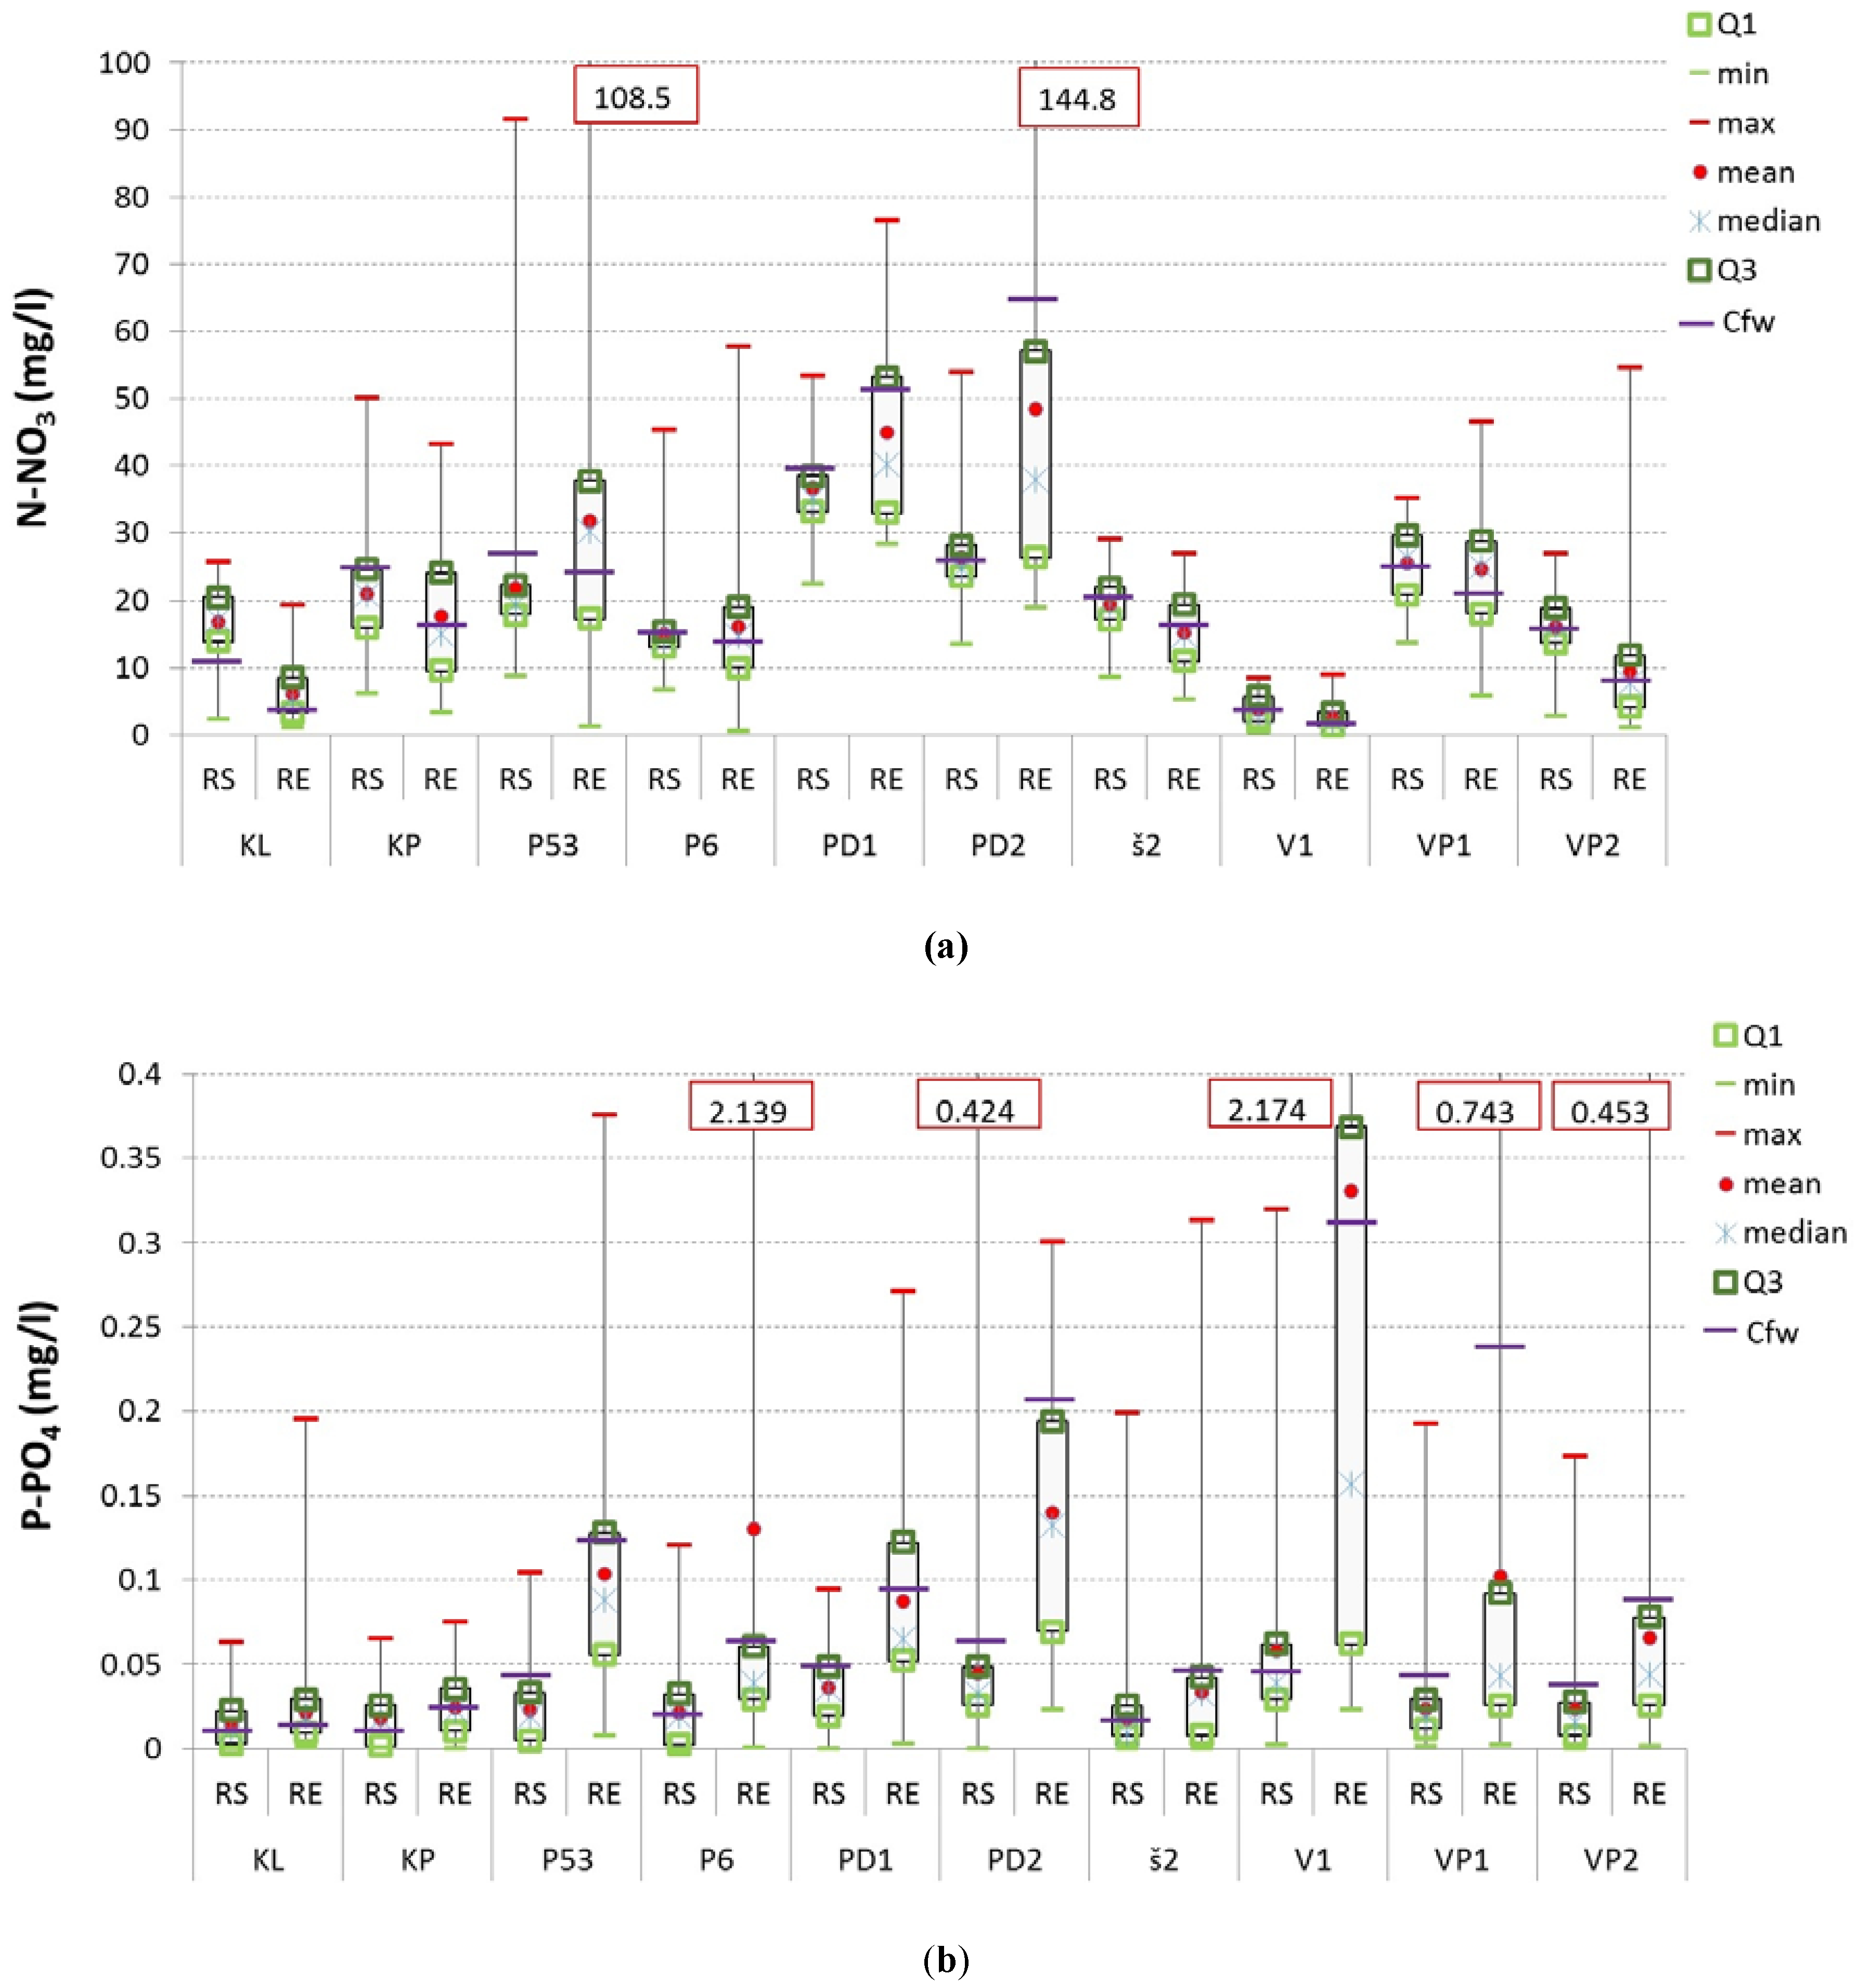
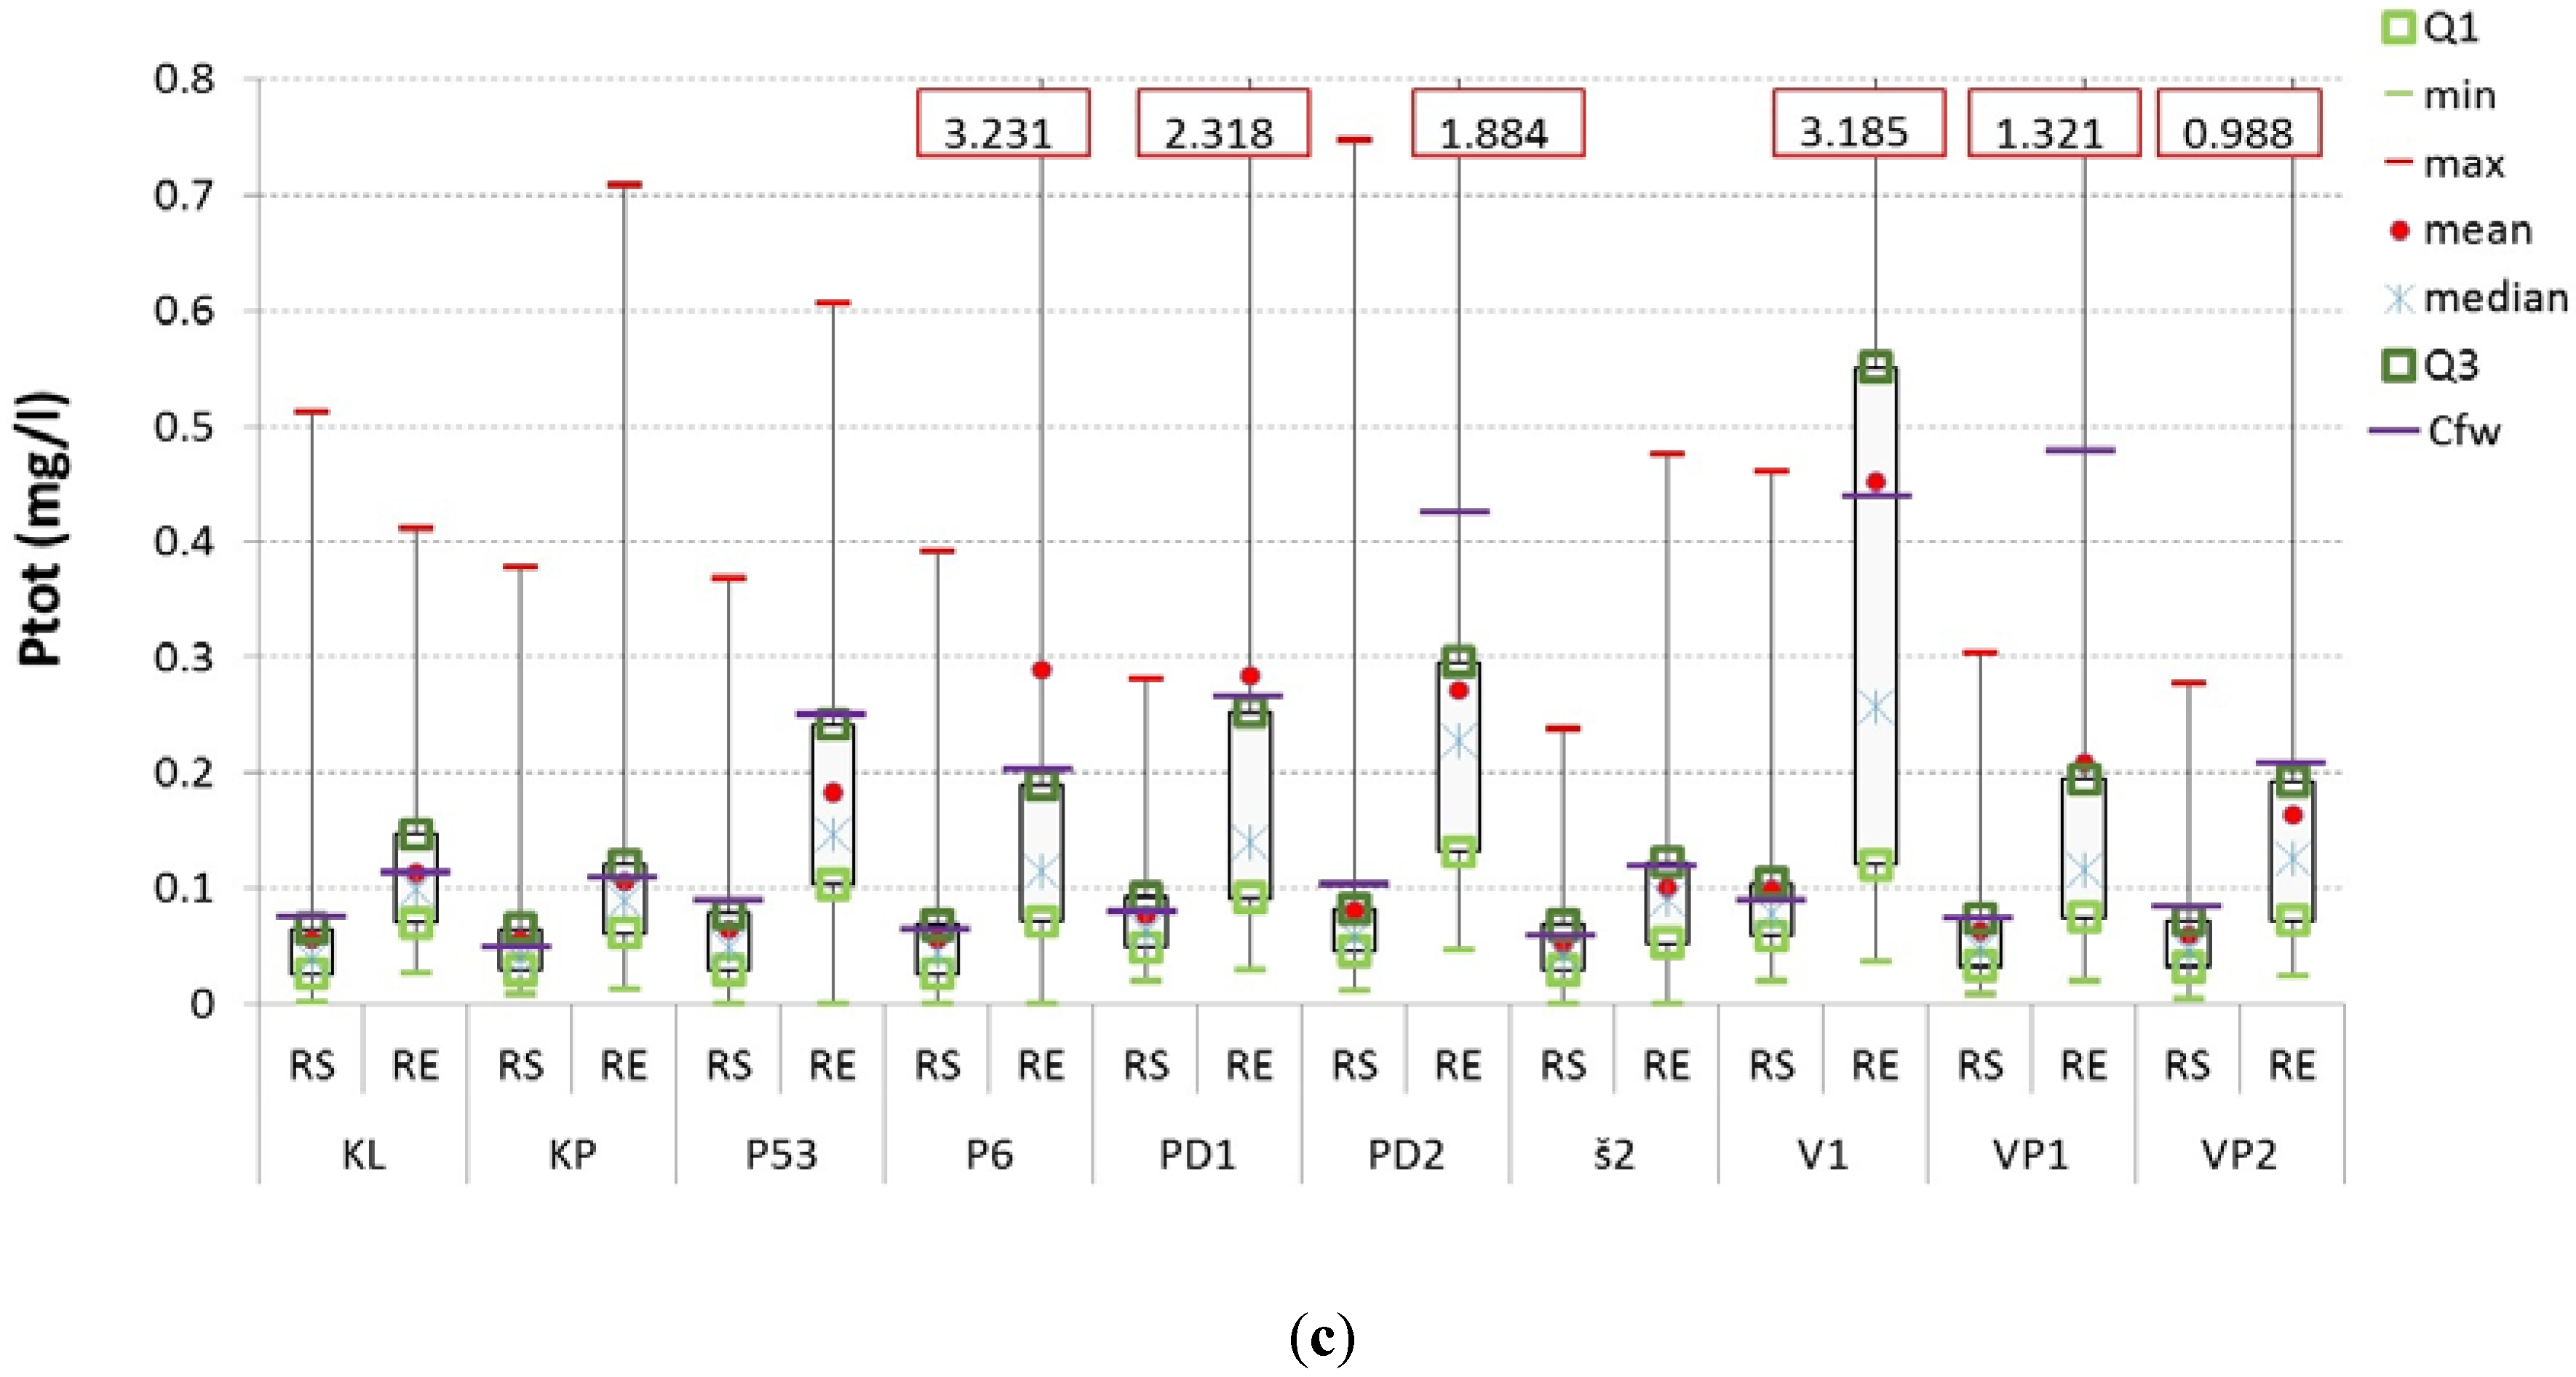
3.1. Dynamics of N and P Concentrations

The concentration values of N-NO3, P-PO4, and Ptot in drainage waters differed profoundly across the sites, between hydrological years, and within regular sampling (RS) and event sampling (ES) schemes. In RSs, N-NO3 concentrations were 1.0 to 91.5 mg/L (median 19.4 mg/L), P-PO4 ranged between 0.001 and 0.424 mg/L (median 0.020 mg/L), and concentrations of Ptot were 0.001 to 0.747 mg/L (median 0.046 mg/L). In the ES, N-NO3 concentrations were 0.452 to 144.9 mg/L (median 14.9 mg/L), P-PO4 ranged between 0.001 to 2.174 mg/L (median 0.043 mg/L), and Ptot was between 0.001 to 3.231 mg/L (median 0.120 mg/L).
The concentrations of nutrients adjusted to hydrology (Cfw) were usually lower for N-NO3 in REs compared to RSs, whereas for both P-PO4 and Ptot, the opposite was true. This means that during an RE, a dilution of N-NO3 in drainage waters usually prevailed, whilst for both P-PO4 and Ptot, the concentrations usually rose with elevated discharge (Figure 4a–c). The only exceptions were sites PD1 and PD2, with Cfw N-NO3 being higher in REs than in RSs. No statistically significant correlation between drainage discharge and any of the substances was discovered during baseflow conditions. During an RE, positive correlations between discharge and both P forms were found, although with a broad range of slopes and shapes of the regression curves (data not shown).

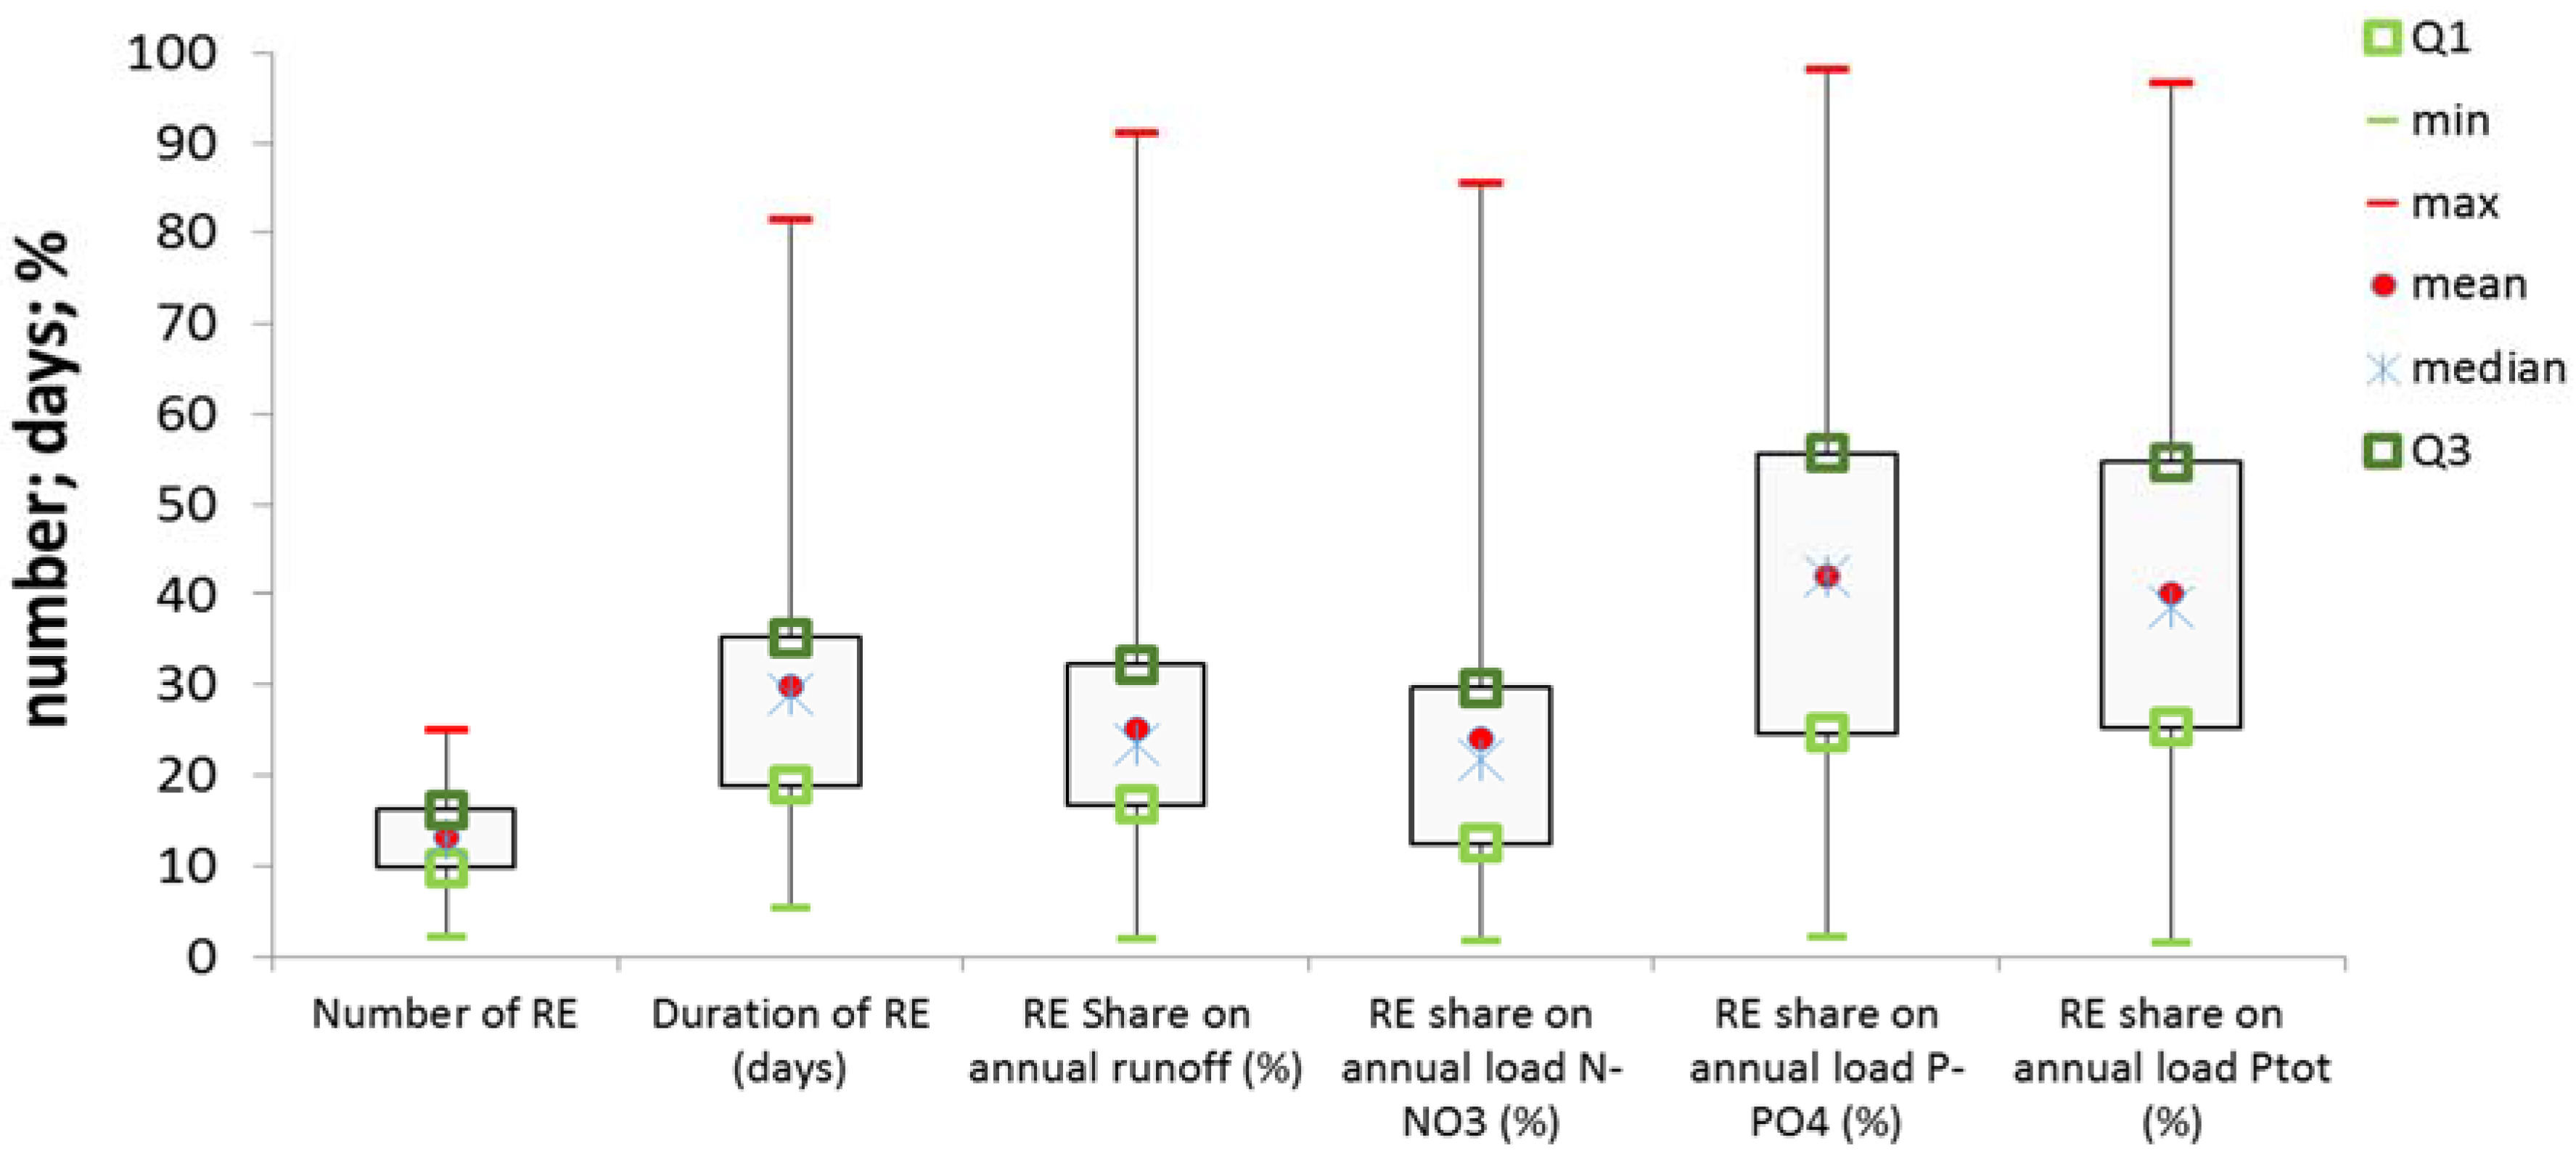
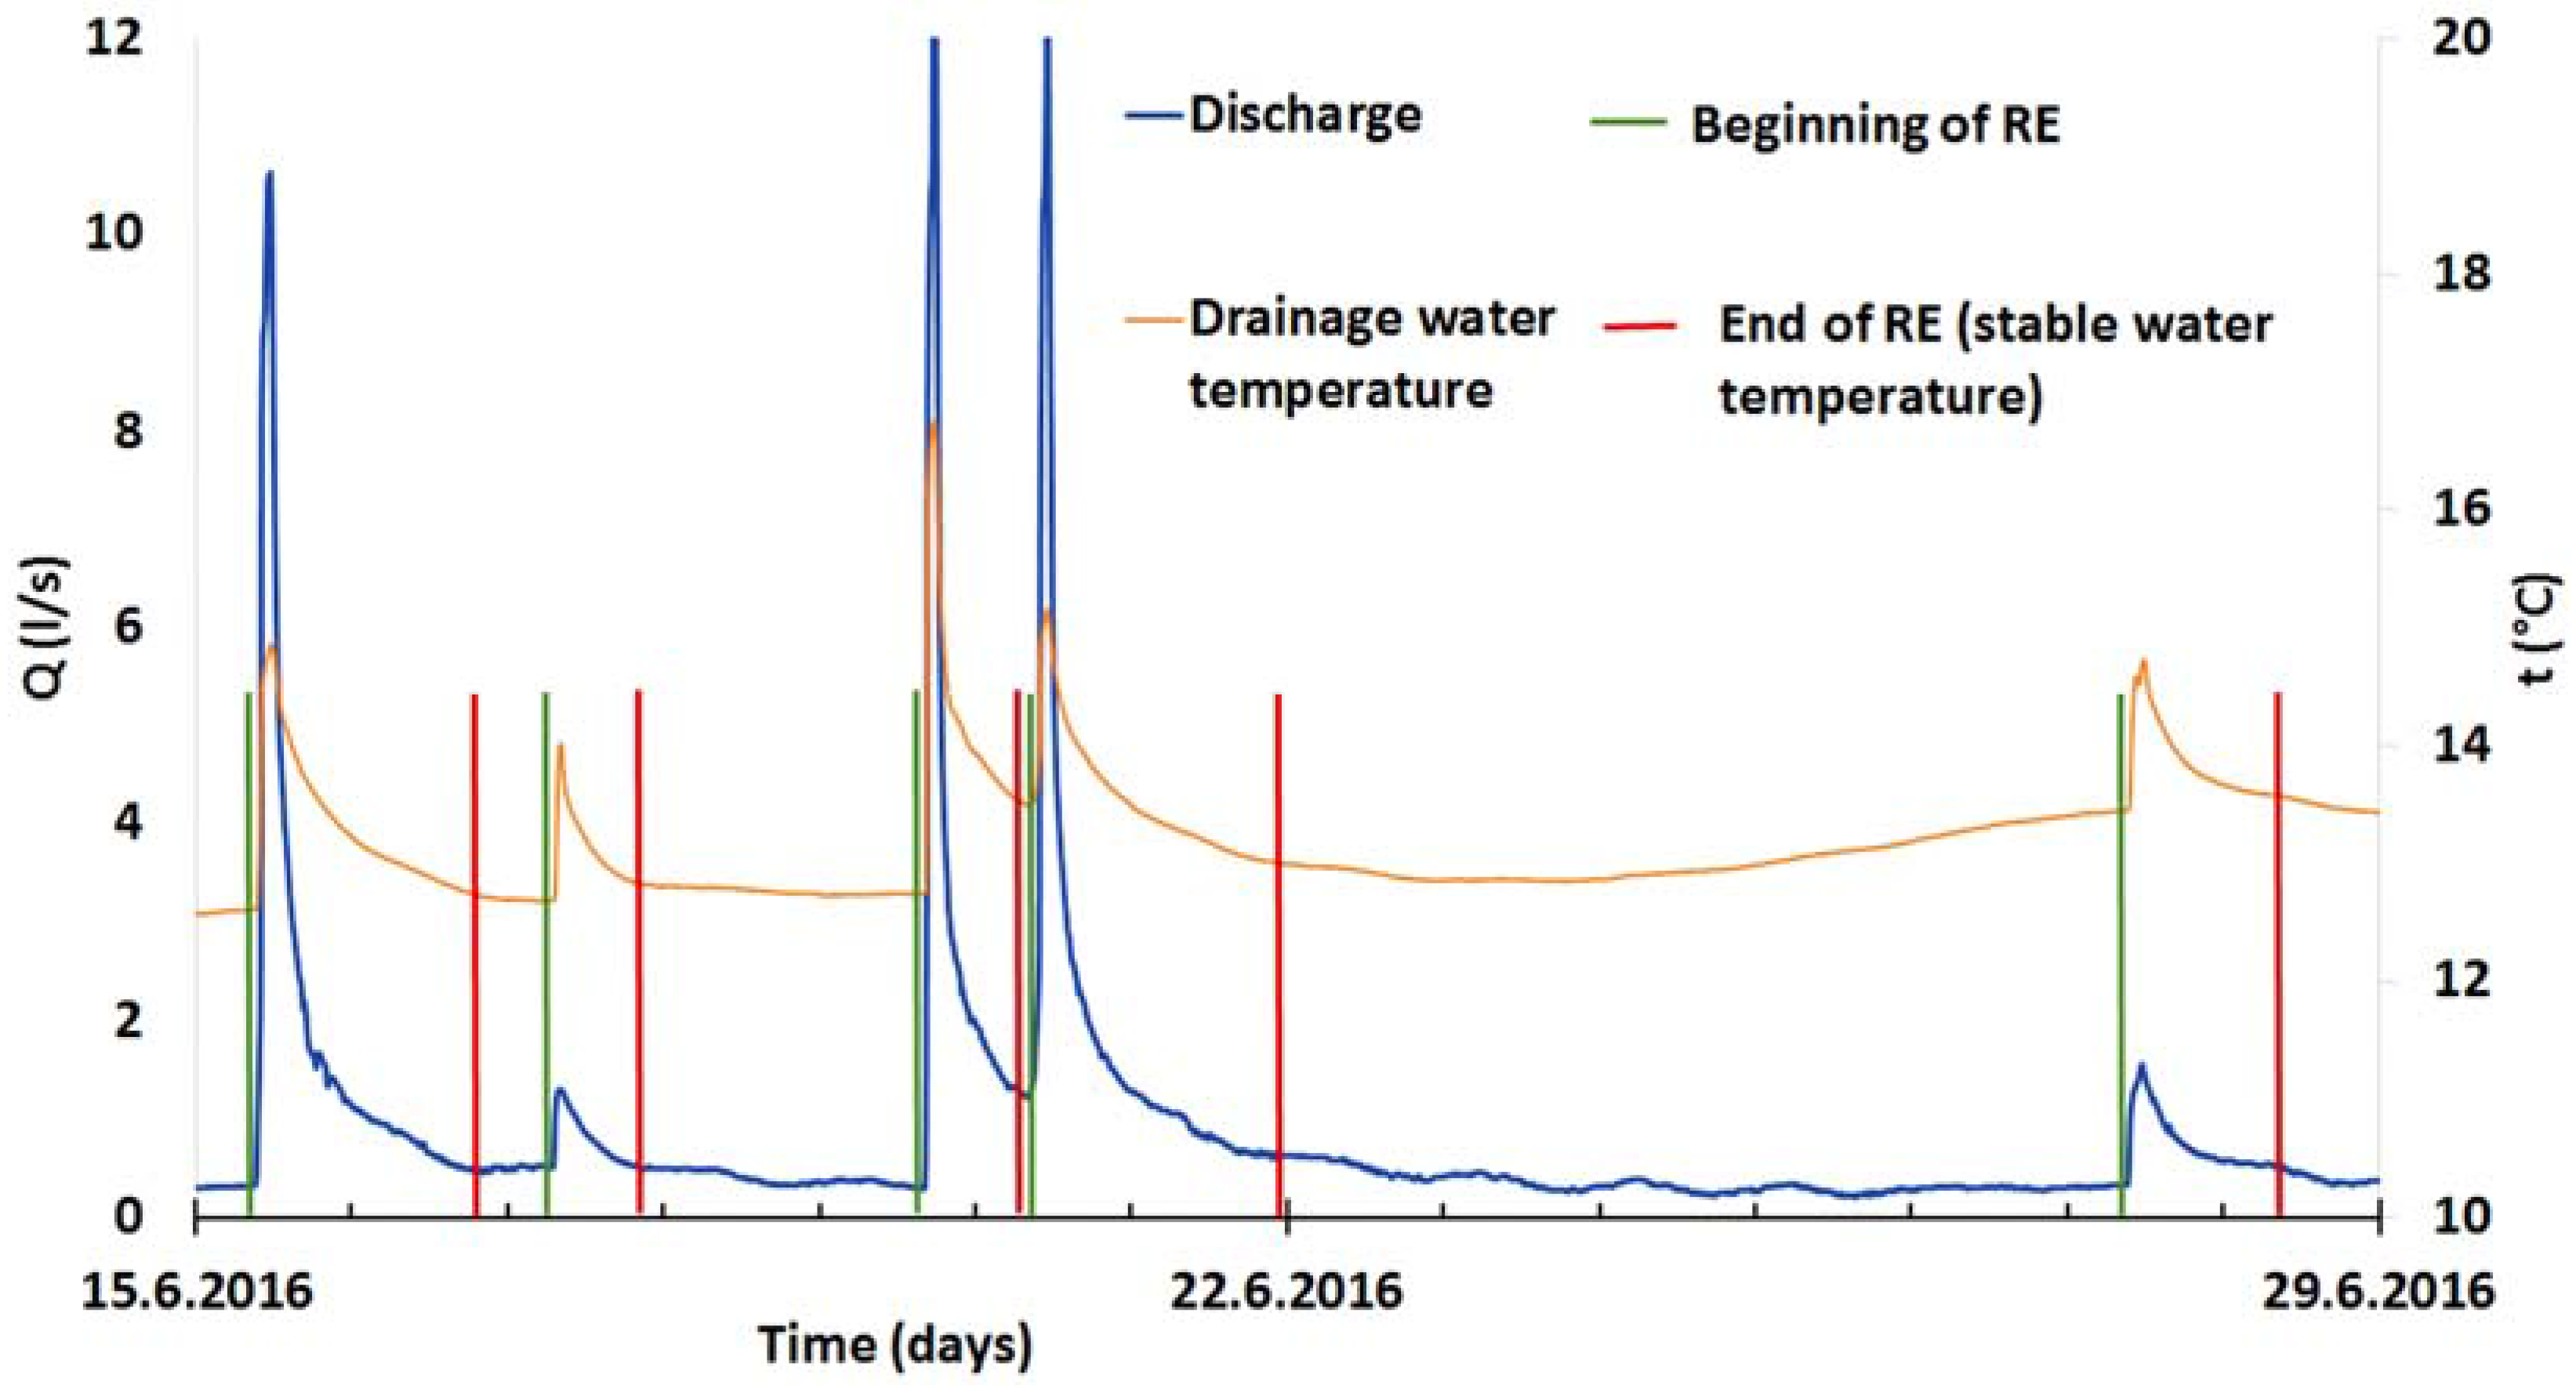
3.2. Runoff Events and Their Proportion in the Total Runoff, N and P Loads

The average number of REs per hydrological year, across all the sites during the whole monitored period, was 13 (2 to 25), and these lasted on average for 30 (5.3 to 81.3) days within a hydrological year; see Table 3. The portion of REs sampled in one season varied from 30% to 45% of the total number of REs (Table 3). The within-period differences among the number and magnitudes of REs were induced most probably by different precipitation amounts and their variable time-distribution across the evaluated period (hydrological years). The lowest number of REs was monitored in the very dry year 2015 (an RE lasted on average 14 days, with an average 12% share on the total runoff), whereas in the wet year 2013, an RE lasted on average 48.5 days, with the mean share on the total runoff being 38.5%. The proportion of REs in the annual total runoff and in the N-NO3, P-PO4, and Ptot loads across all the monitored sites and periods was on average 24.5% (1.8–91.1%), 23.8% (1.7–85.5%), 41.6% (2.1–98.1%), and 40.3% (1.4–96.5%), respectively; see Table 3 and Figure 5 for details.

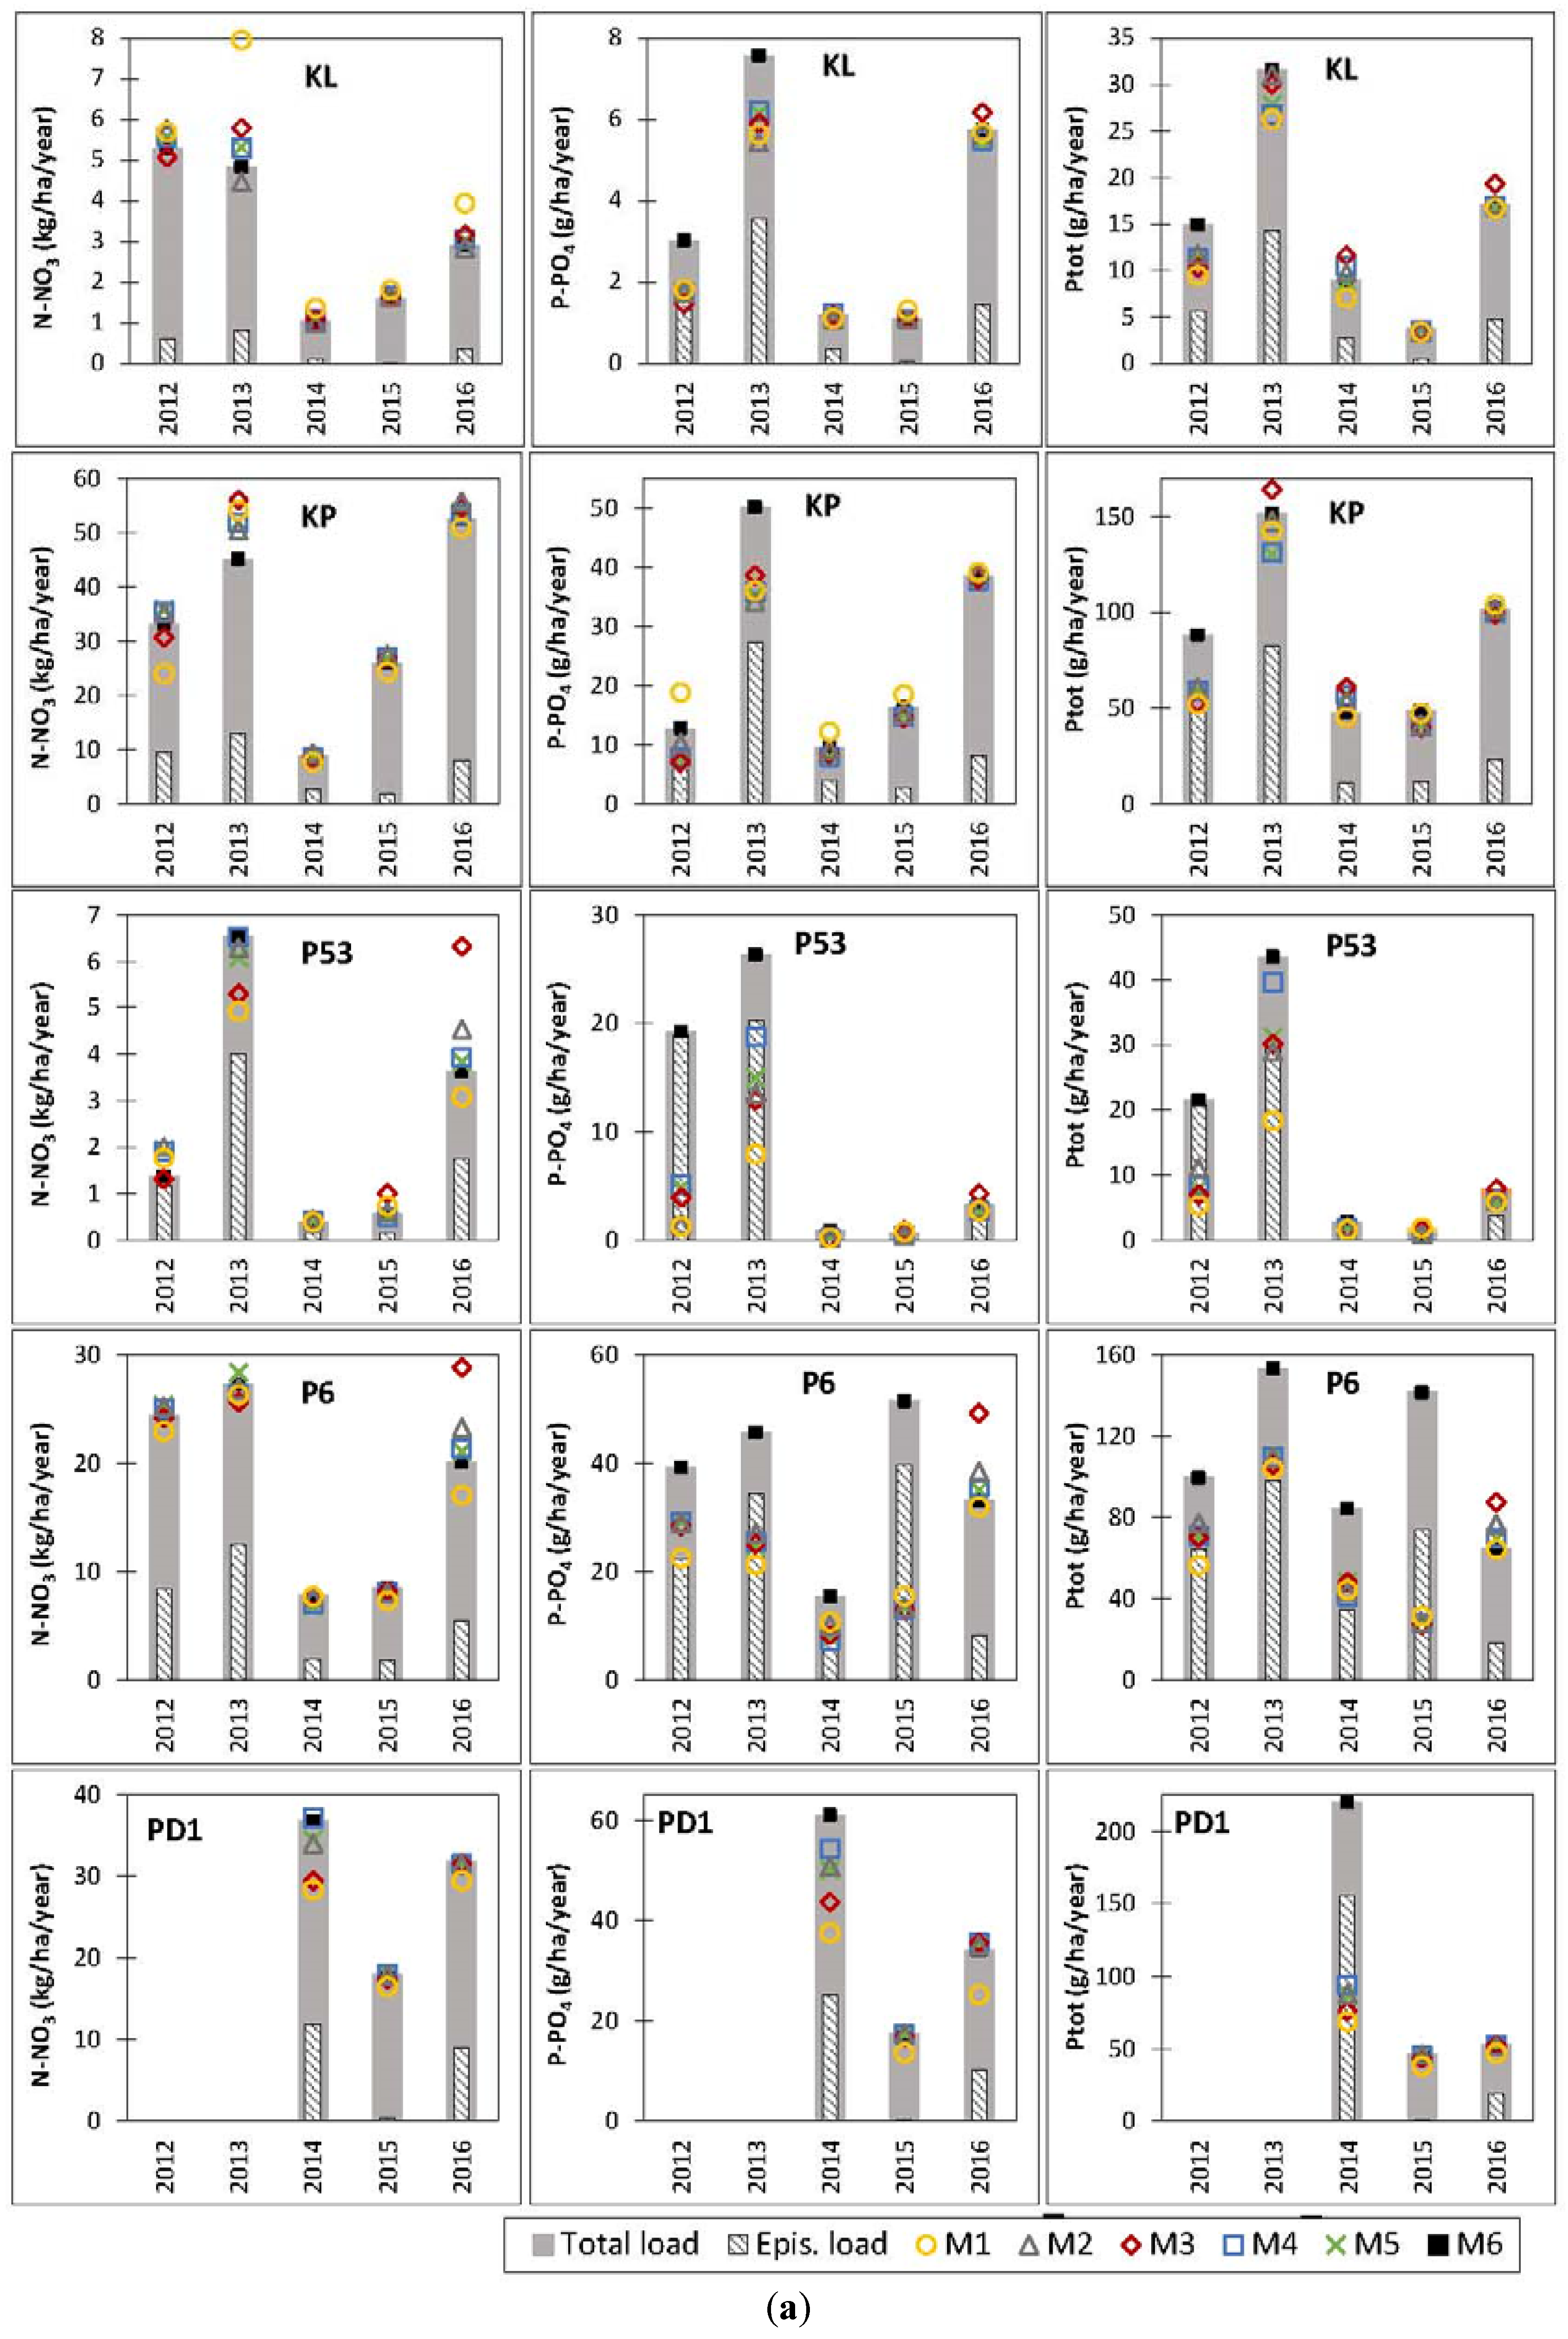
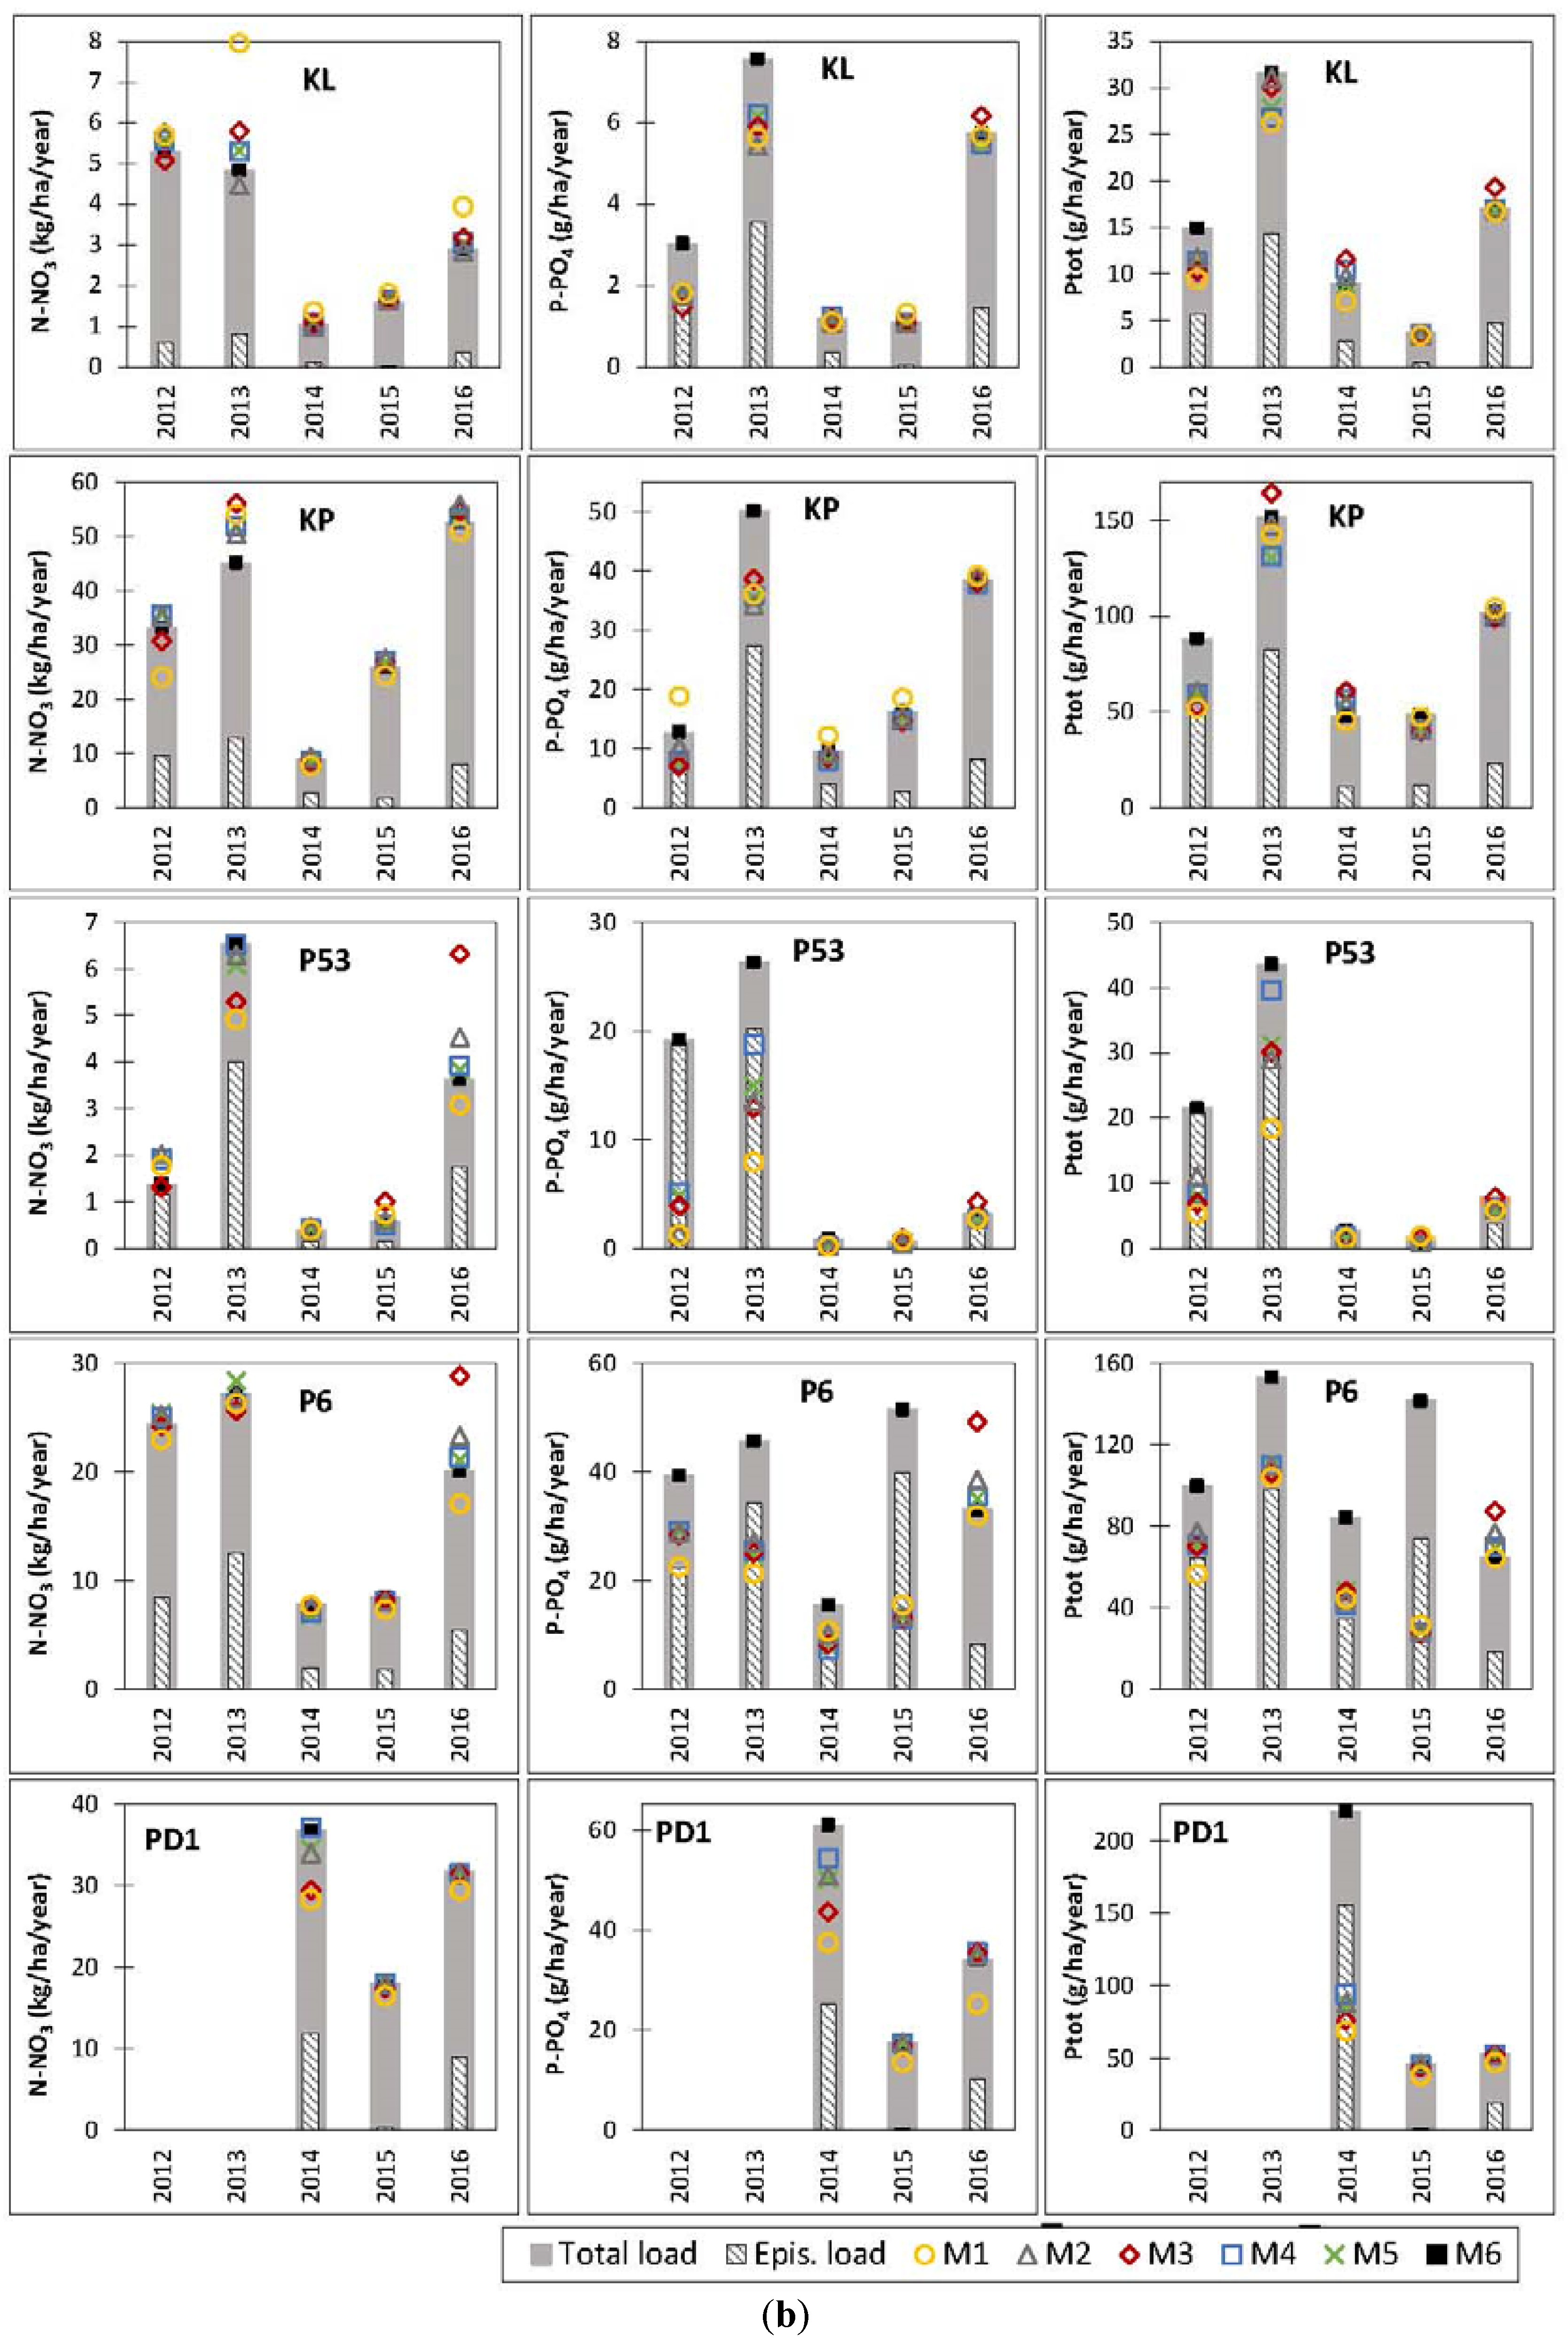
3.3. Comparison of Load Assessment Methods Annual Load Schemes

The annual true loads (M6) for N-NO3, P-PO4, and Ptot across all the monitored sites and periods were on average 19.01 kg·ha−1 y−1 (0.39–60.50), 32.09 g·ha−1·y−1 (0.64–131.85), and 99.28 g·ha−1·y−1 (3.83–337.65), respectively. The lowest N-NO3 loads were measured at the grassland sites (KL, V1) and at the ploughed P53 site, which exhibits an obvious episodic runoff pattern. The N-NO3 annual load from ploughed sites was on average around 30 kg·ha−1·y−1. The P-PO4 and Ptot loads were comparable at the ploughed and grazed catchment (V1). The lowest P-PO4 and Ptot loads were measured at sites KL and P53, the catchments with the smallest total runoff.
The nutrient load assessment algorithms differed according to the employed method of discharge monitoring and, to a lesser extent, the method of nutrient concentration monitoring (calculation), with the exception of monitoring during the REs (M6). Nutrient loads, calculated by M1 to M5, in relation to M6, along with the loads in REs, are depicted on Figure 6a,b, and the basic statistics on M1 to M5 accuracy related to the true load (M6) on an annual basis for all the substances, sites, and monitored periods are shown in Table 4. For annual N-NO3 loads, M1 was the least accurate method, when accounting for the average 3.2% underestimation (−27.5 to 64.5%) of the M6 load. The M1 algorithm was also the least accurate for annual phosphorus loads; for P-PO4, it underestimated M6 loads by 27.9% on average (−93.3% to 47.5%), and, for Ptot, it underestimated M6 loads by 28.2% on average (−78.2% to 4.2%). None of the variables (nutrient loads according to M1 to M6 across all the sites and monitored periods) was affected significantly by the methods (ANOVA; p > 0.05).

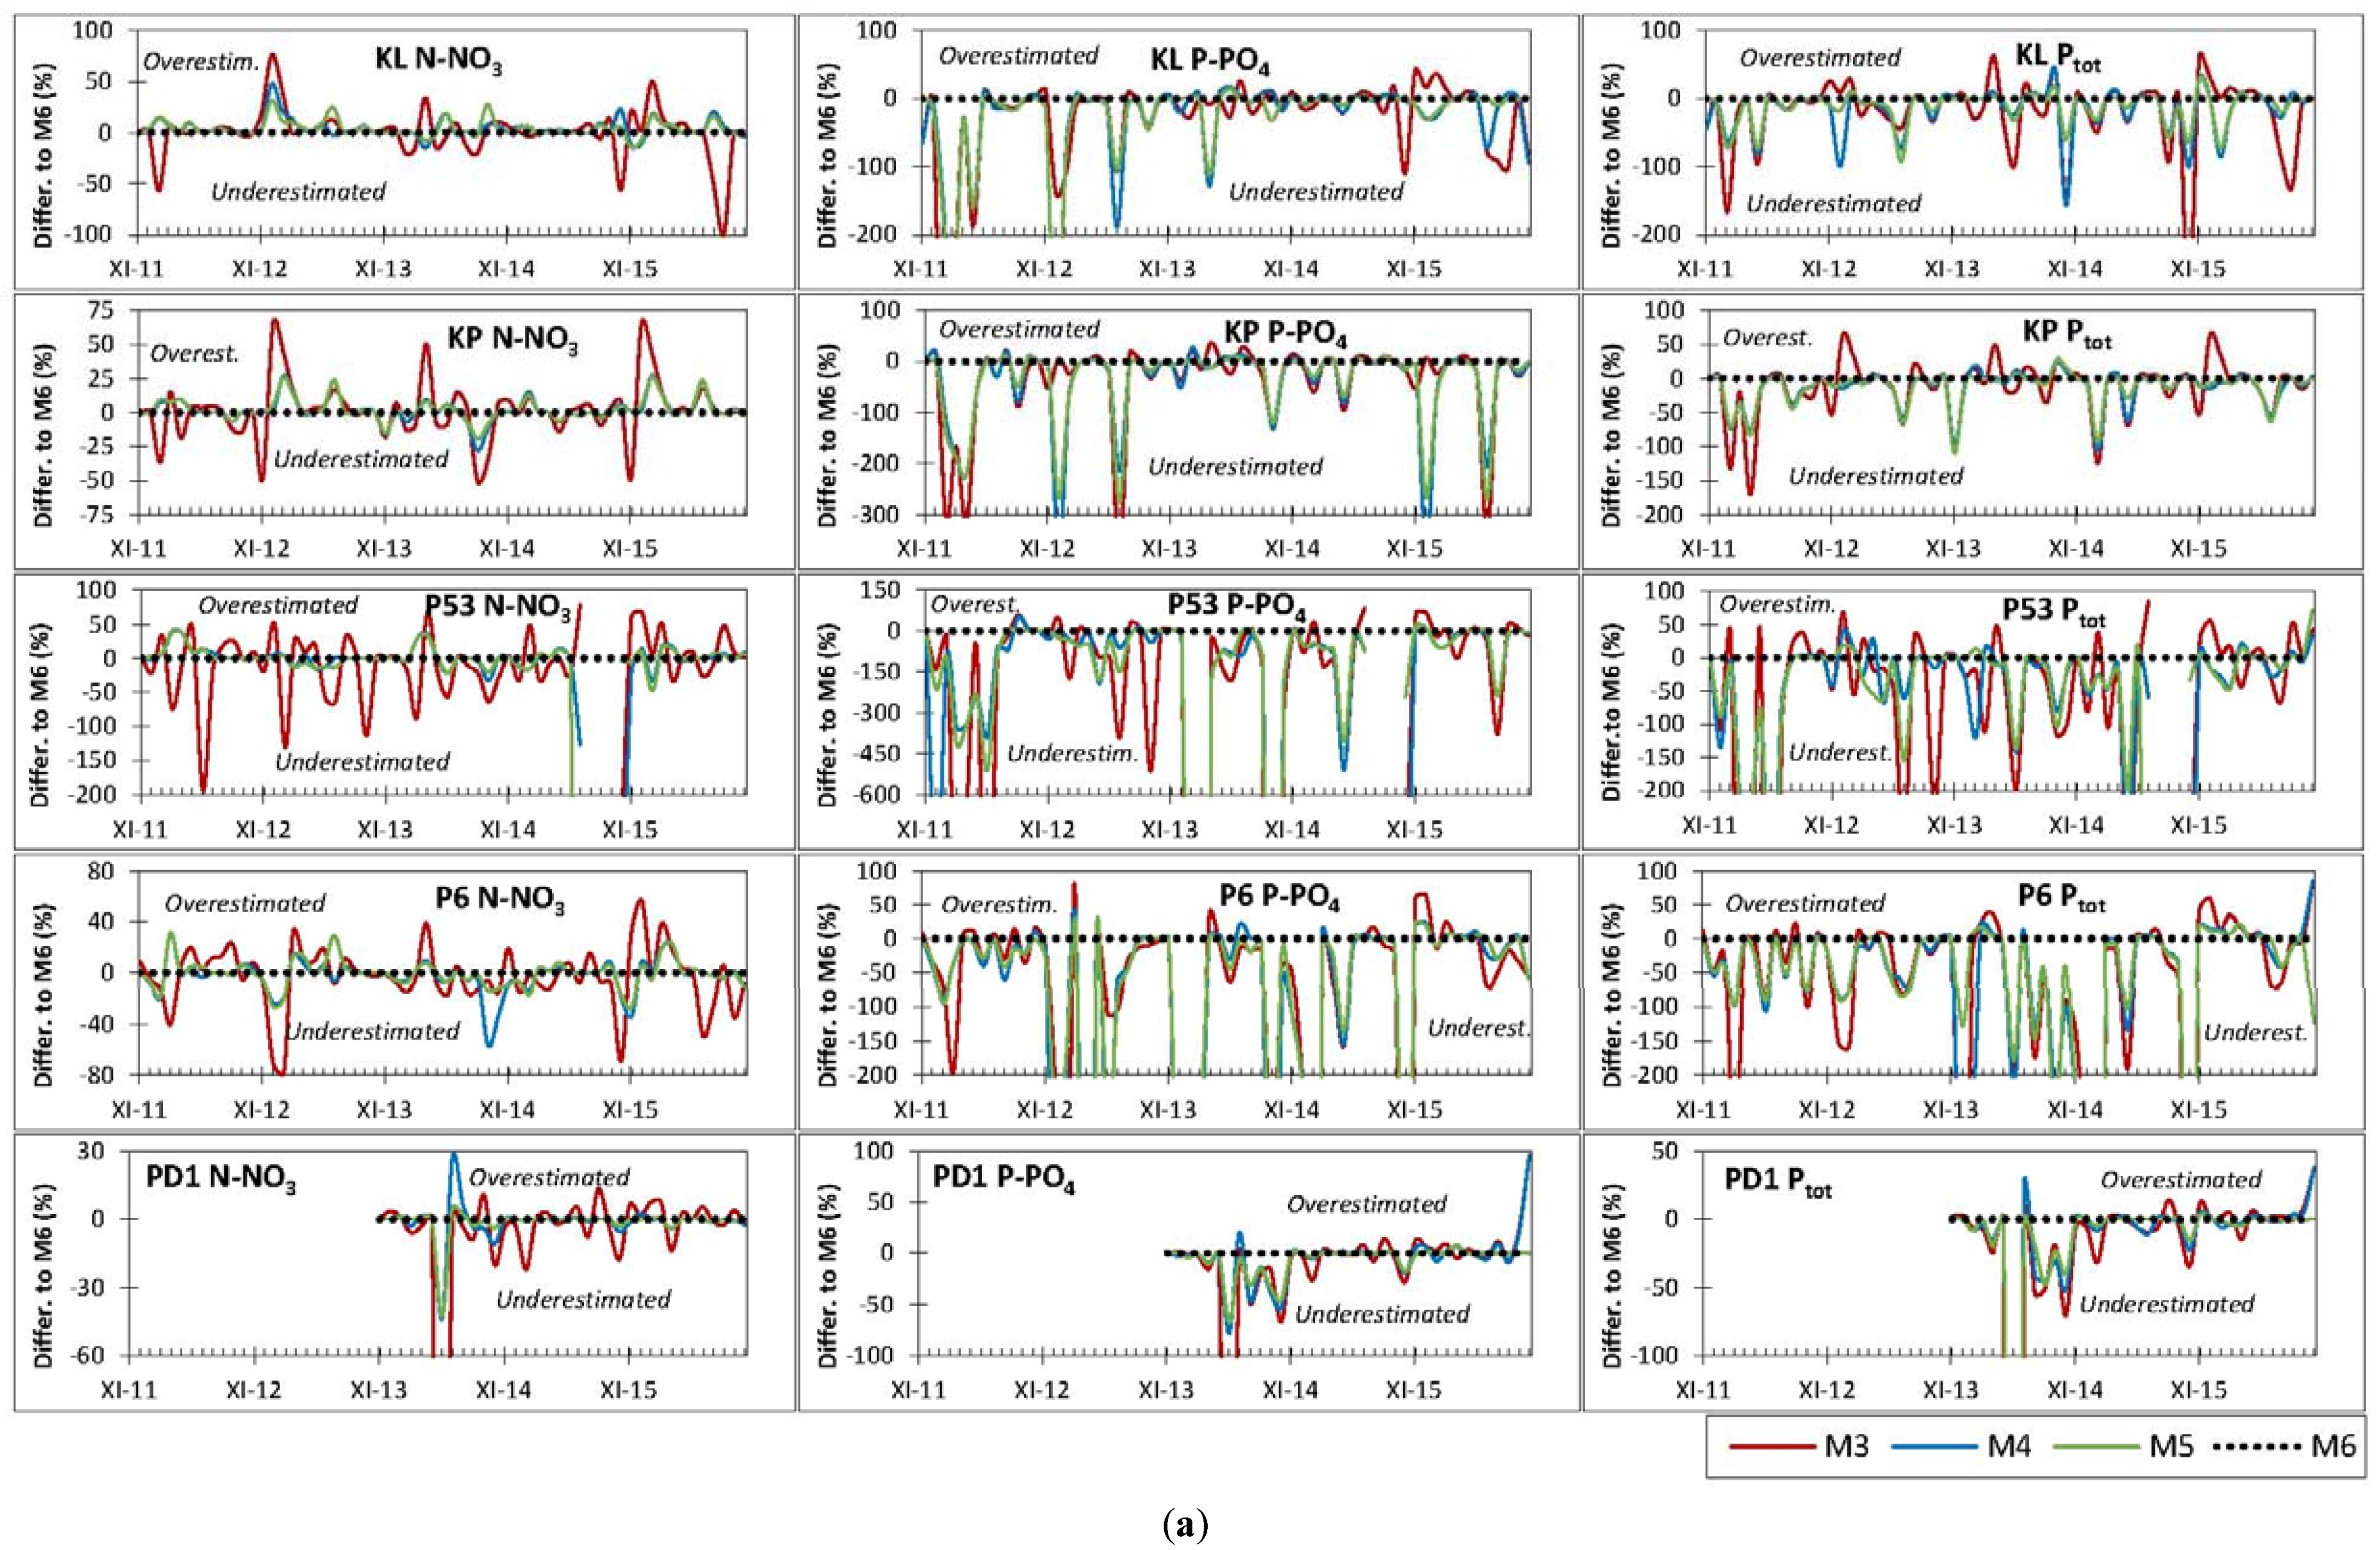
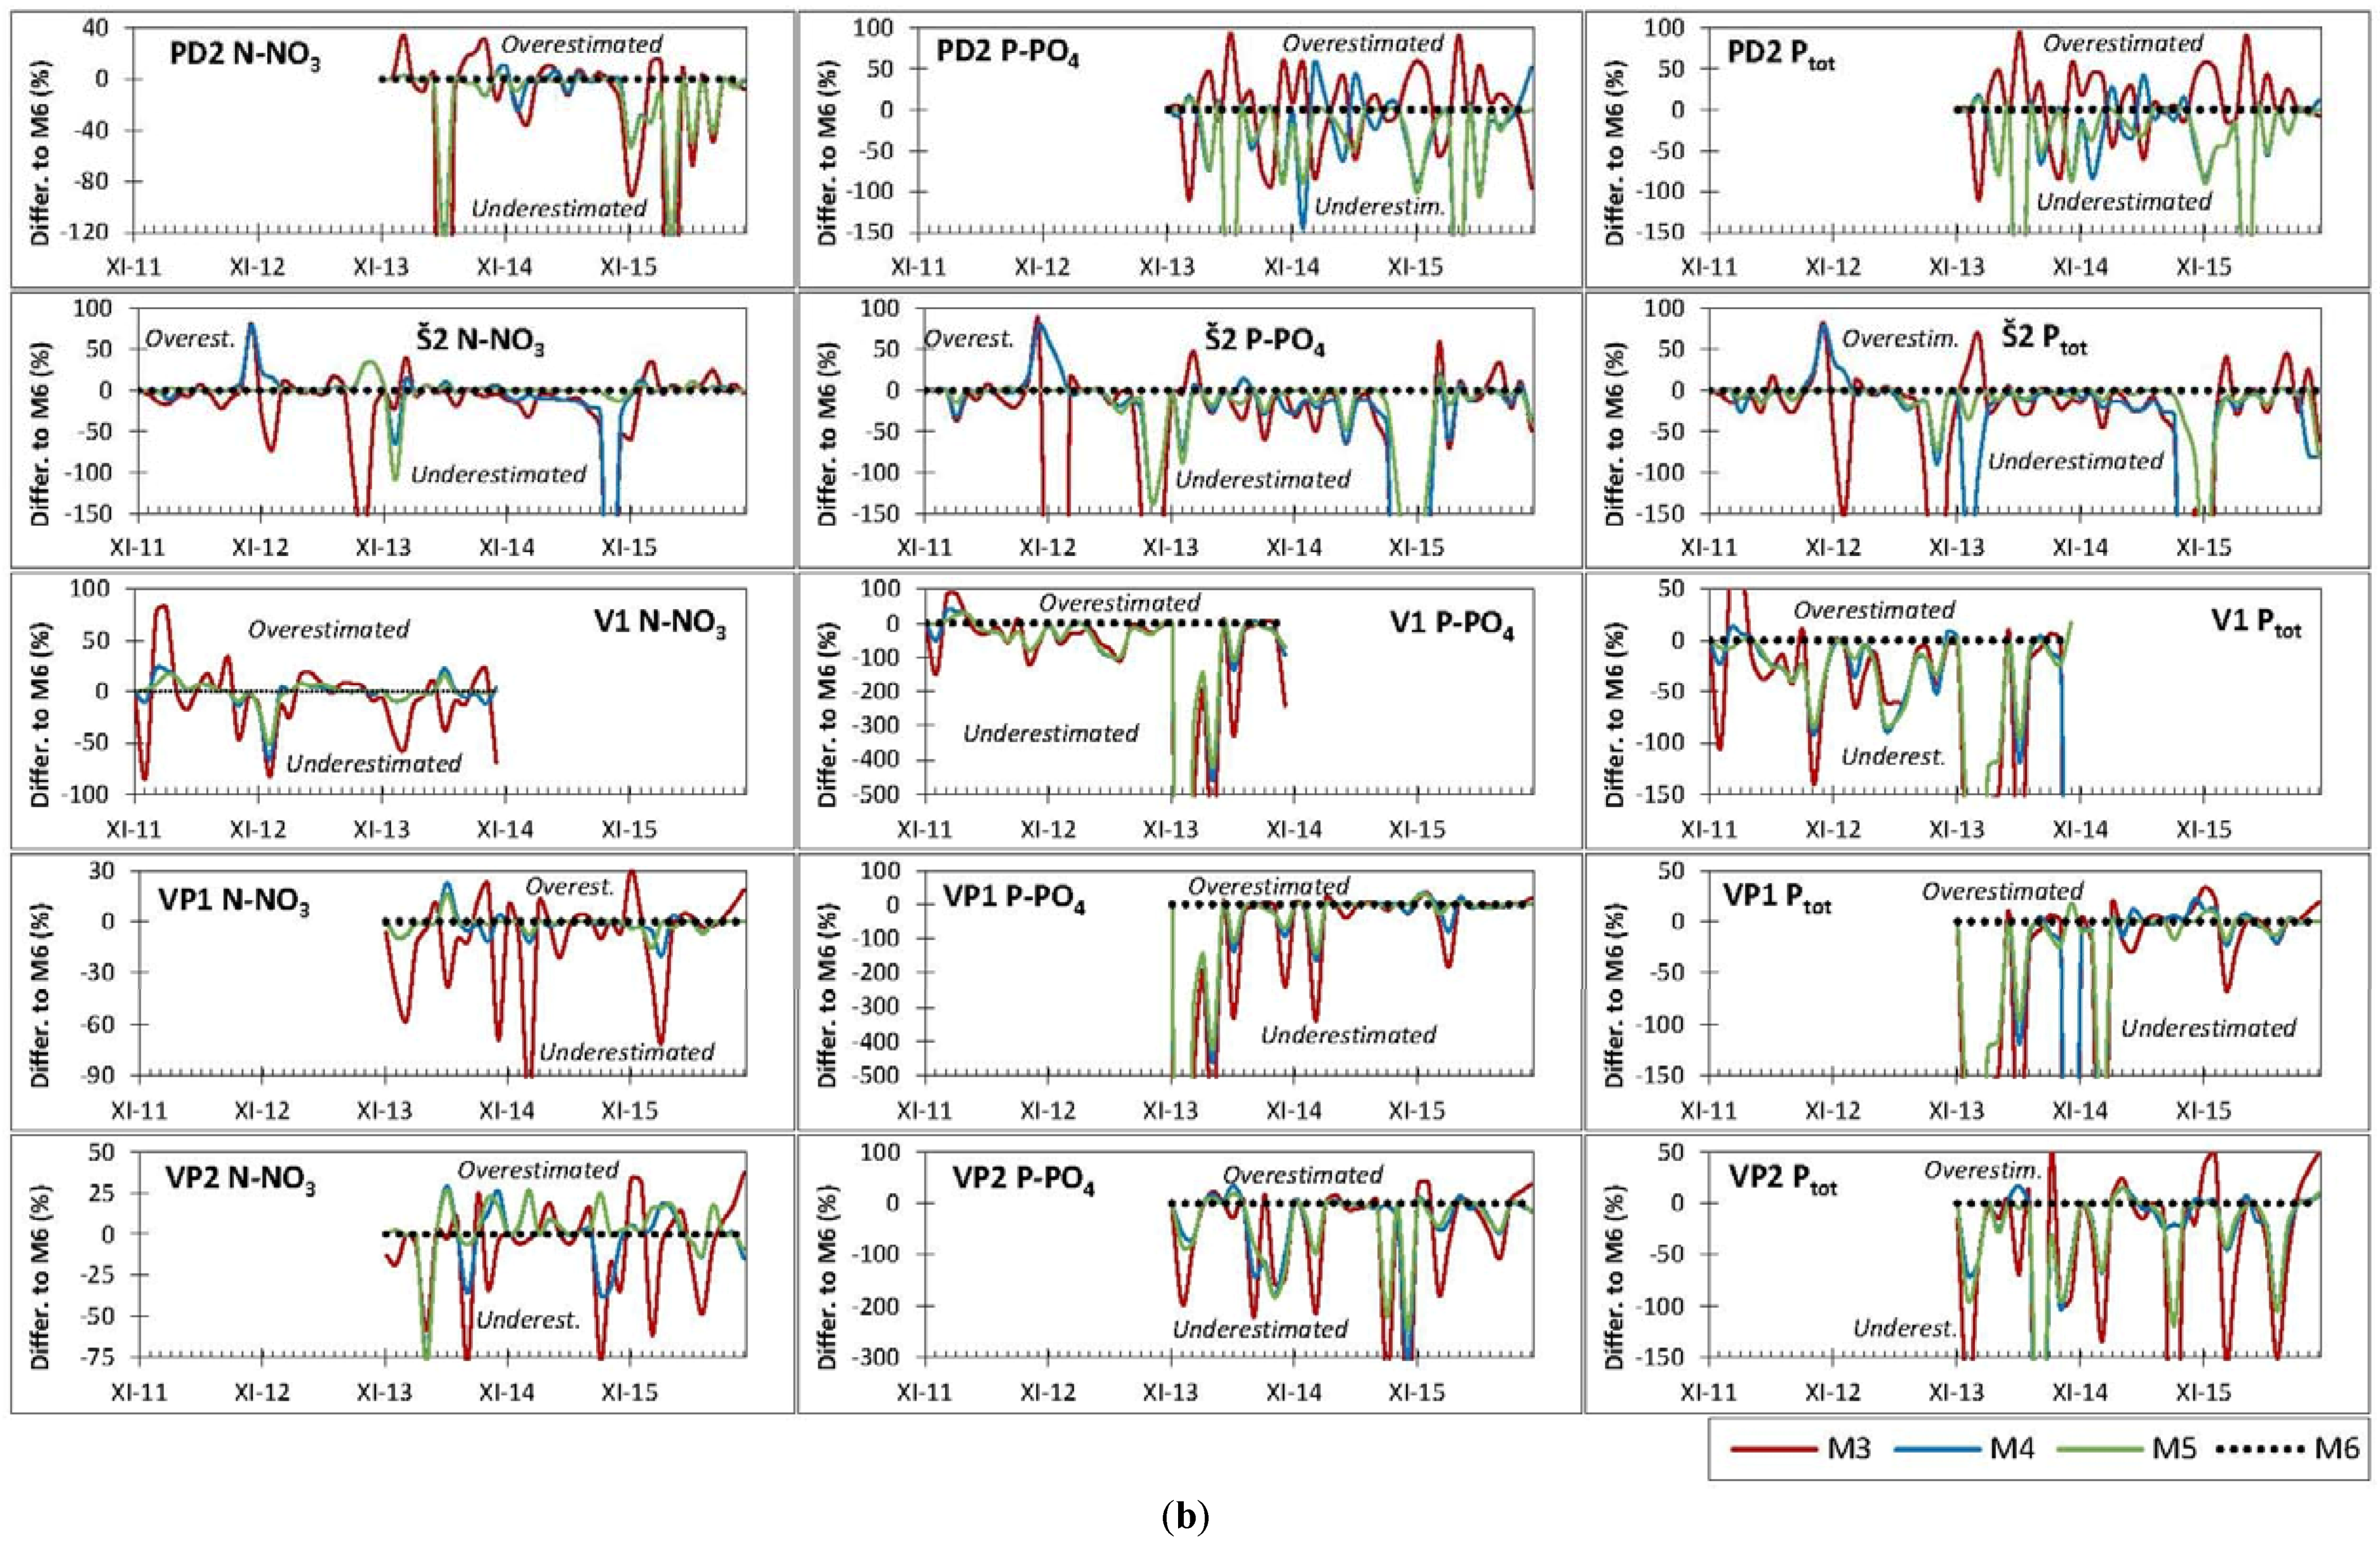
3.4. Monthly Load Schemes

The monthly nutrient true loads (M6) for N-NO3, P-PO4, and Ptot across all the monitored sites and periods were on average 1.52 kg·ha−1·month−1 (0.01–16.41), 2.81 g·ha−1·month−1 (0.003–48.85), and 6.87 g·ha−1·month−1 (0.004–139.32), respectively. The accuracy and the RMSE of M3 to M5 (M1 and M2 only on annual basis) as related to the true loads (M6) are given in Table 5 and Table 6, and the accuracy for all the sites over the monitored period is displayed in Figure 7a,b. In the monthly load schemes, the results showed that the algorithm that did not use a continuous record of discharge (M3) under- or overestimated nutrient loads the most. For N-NO3, the average underestimation by M3 on a monthly basis was 10.5%, whereas for P-PO4 and Ptot it was 176% and 59%, respectively. The extensive underestimation of monthly P-PO4 loads was due to the fact that, at some sites (P53, V1, VP1), the P-PO4 loss occurred solely during REs. As seen in Table 5 and Table 6, M4 and M5 gave comparable results; i.e., for N-NO3 loads, the underestimation was on average only around 3%, for P-PO4 loads it was on average around 100% and for Ptot it was 35% to 40%.

4. Discussion

4.1. Dynamics of N and P Concentrations

In general, the grassed catchments (KL, V1) had lower N-NO3 concentration values than the ploughed catchments, both during RSs and ESs due to the well-known mitigation effect of grassland on nitrate leaching [12,15,42]. For both P forms monitored in drainage waters, no such differences were found. During the REs, a dilution of N-NO3 in drainage waters usually prevailed, whilst for both P-PO4 and Ptot, the concentrations usually rose with elevated discharge, which is in accordance with many monitoring campaigns in tile-drained catchments [5,12,18,25,31]. The only exceptions were sites PD1 and PD2, with Cfw N-NO3 higher in ESs than in RSs. This was most probably due to the over-fertilization of these catchments either by mineral nitrogen or digestate, as documented by other studies [13,44].

4.2. Runoff Events and Their Proportion on Total Runoff, N and P Loads

The within-site differences between the number and magnitudes of REs and their share of total runoff and between the N-NO3, P-PO4, and Ptot loads were brought about most probably by the distinct hydrological connectivity and runoff formation pattern in particular drainage—catchment systems [7,21,34,46]. This connectivity is affected by the position of a drainage system in a particular part of a slope (higher, lower) and by local soil variability [42,43,47,48,49]. This can lead to different proportions of runoff components in drainage runoff, e.g., sites lying in higher positions on slopes (typically P53) have lower proportions of baseflow and higher numbers of REs. Similar (very variable) proportions of event water (12% to 50%) for similar amounts of precipitation (20 to 30 mm) are reported by other studies [21,50,51,52]. This variability in REs is more probably caused by diverse hydrological conditions in the catchments preceding the rain, namely, soil moisture, the groundwater level in summer, and snow cover for winter events, than by the intensity of rainfall [51], although some other studies reported contrarily [21,53].
In general, the relatively small share of REs for N-NO3 loads is explained as a dilution of nitrate-rich drainage water by rain water during the majority of the REs, both on grassed as well as on ploughed sites, as discovered also by other studies [4,17,44]. The highest share of REs in N-NO3 loads was measured in the N-overfertilized catchments (PD1, PD2; RE share up to 61%) and at site P53 (RE share on average 51%), which had a profound episodic runoff pattern (some months were almost without regular flow). The low share of REs for N-NO3 loads was exhibited on grassed site KL (on average 10.8%) and on ploughed site Š2 (on average 8.6%), which corresponded to a high baseflow. For both P forms, higher proportions of REs for P loads were found. The higher share of RE on P loads compared to N loads was caused by the well documented different patterns of N and P leaching from soil into drainage waters [10,34], when P concentrations substantially rose with the elevated discharge across all the sites. This manifested the most at the sites with a substantial share of REs in the runoff (P53 site). However, a detailed analysis of these effects was not an aim of this study.

4.3. Comparison of Load Assessment Methods

The lowest P-PO4 and Ptot loads were measured at the sites with the smallest total runoff (KL, P53). This means that, for both the P-PO4 and Ptot loads, the runoff pattern seems to play in general a more dominant role than land use within the monitored catchments, as discovered also by other studies in similar and different climate and cropping systems [5,9,12,19]. The differences in total runoff in sites with similar geographical conditions were caused most probably by the different areas of their recharge zones [43]. The changeable runoff pattern probably also explains the fact that the ANOVA found the differences among the methods to be insignificant (N-NO3: F-ratio 0.08, P-value 0.9958, P-PO4: F-ratio 0.98, P-value 0.4286, Ptot: F-ratio 1.77, P-value 0.1196). The results showed supposedly small differences between the methods on the annual basis. M2 appeared to be quite a reasonable algorithm for the assessment of N-NO3 loads, when only grab sampling (without continuous monitoring of discharge) was employed. However, it still gave large underestimations, especially for both phosphorus compounds, as the grab sampling rarely captured different REs with different P concentration values, as documented by [31,32,33,34].
For monthly nutrient loads, the M5 algorithm, with continuous flow measurements and using linear interpolations of the concentrations from the consecutively sampled days, resulted in a quite acceptable degree of accuracy for monthly N load estimation, with an exception for one overfertilized site (PD2) and site P53, which had a dominant episodic runoff pattern, where the average underestimation of N loads was 14.5% and 21.9%, respectively. M5, however, for both P compounds, gave unsatisfactory estimates of the monthly loads since the temporal changes of P concentrations were not covered by the regular sampling, as discovered in other studies when a weekly time step of sampling was employed [18,33,34].
The results have highlighted the importance of runoff events (not only erosion-generating) in delivering phosphorus by tile drainage, sometimes in large amounts. Given that the average duration of an RE within a hydrological year was 30 (5.3 to 81.3) days across all the sites and seasons, the loss of phosphorus by subsurface runoff should be given considerable attention in central European tile-drained catchments, as recommended by many other studies in tile-drained landscapes of diverse natural and agricultural characteristics [5,6,8,10,34,35]. Since the algorithms that do not use a continuous record of flow rates (M1 to M3) has considerable poorer performance, yielding biased and imprecise results, the use of continuous flow measurement is necessary to capture discharge dynamics and to calculate the real nutrient fluxes from small tile-drained catchments with reasonable certainty [25,27,33].
The RMSE expressed the cumulative information on the degree and variation of the relative error of a particular method, relative to M6, when both accuracy and precision were taken into account. It clearly showed that, for monthly N load estimation, M3 had an average RMSE approximately two-fold greater than those of M4 and M5 (48.6%, 23%, 29.4%, respectively). For P, roughly the same ratio was discovered, although in terms of percent values in the hundreds (Table 6). As for the accuracy, for the RMSE, the largest degrees and variations of errors were found for the sites with significant episodic runoff patterns, especially for P-PO4 loss.

5. Conclusions

This study compared six methods for nitrogen and phosphorus load calculation in ten small tile-drained sloped catchments in both annual and monthly time steps based on data from three to five hydrological years. Further, for the monitored sites and periods, the share of runoff events in the total runoff of N-NO3, P-PO4, and Ptot was quantified. A novel semi-automated algorithm for the identification and selection of runoff events from continuous flow using drainage water temperature was proposed and applied for load calculation in the unsampled events. The share of runoff events in N loads was on average 5% to 30% of the total annual load, whereas for P (dissolved and total), the share of runoff events was on average 10% to 80% of the total annual load. The most precise methods for nutrient load estimation were those with the use of continuous measurement of the discharge (M4, M5). However, without sampling the runoff events, these methods showed considerable uncertainties, especially for phosphorus load estimation. The methods based on point monitoring discharge and water quality (M1 to M3), commonly employed in practice when balancing non-point pollution sources in small tile-drained agricultural catchments, underestimated the annual loads of N by 10% to 20% and of P by 30% to 80%. For the monthly loads, this study demonstrated that methods without continuous flow measurements and with infrequent sampling tended to underestimate N and especially P loads by percentage values in the tens to the hundreds. The variability in loads between the years and sites was caused most probably by the dissimilar runoff patterns between particular sites and between particular years, which is not captured by grab sampling and regular monitoring at fixed intervals.
Based on the acquired results, we recommend continuous flow and water temperature monitoring, as well as event-based sampling programmes, to be employed on tile drainage outlets, drainage mahnoles, or ditches. Although such very small catchments as observed in the present study could hardly be the subject of routine (nation-wide or large catchment) monitoring programmes, we emphasize the need to pay increased attention to the hydrochemical role of tile drainage since these systems strongly impact water quality and quantity in agriculturally exploited headwater catchments. This work also provided regionally representative N and P loads, which we consider to be of great value when balancing the non-point pollution sources of small water courses and designing appropriate mitigation measures for tile-drained land. Future work could focus on the linkages between catchment characteristics, nutrient load dynamics, and load calculation uncertainties provided by different methods in different seasons. Further, a more detailed hydrological description of the sites such as runoff flashiness, baseflow index, antecedent moisture conditions, or water catchment residence time will be employed in a follow-up study in order to better explain the magnitude of uncertainty and the dynamics of various algorithms across different catchments [27,34,46,47].

Acknowledgments

The research leading to these results has received funding from the Norwegian Financial Mechanism 2009 to 2014 under Project Contract no. 7F14341, ‘Assessing water quality improvement options concerning nutrient and pharmaceutical contaminants in rural watersheds’. The project funds covered the costs of publishing this article in open access. The data and results introduced in this study were obtained from the projects of Technology Agency of the Czech Republic, No. TA03020202 and TA02020337. The Institutional support from Ministry of Agriculture No. RO0216 is also greatly acknowledged. The authors thank David Šádek, Hana Libichová, and Pavel Pražák for their field work and basic data management. The authors thank the anonymous reviewers for their very valuable comments. The authors dedicate this paper to František Doležal, a genuine expert in hydrology and soil science and an inspiring, open minded, and favourite colleague.

Author Contributions

Petr Fučík, Antonín Zajíček, and Renata Duffková conceived and designed the experiments; Antonín Zajíček, Jana Peterková, Petr Fučík, Renata Duffková, and Markéta Kaplická performed the experiments; Antonín Zajíček, Markéta Kaplická, Petr Fučík, Renata Duffková, Jana Peterková, and Jana Maxová analyzed the data; and Petr Fučík, Antonín Zajíček, Markéta Kaplická, Renata Duffková, and Šárka Takáčová wrote the paper. Authorship is limited to those who have contributed substantially to the work reported.

Conflicts of Interest

The authors declare no conflicts of interest. The founding sponsors had no role in the design of the study; in the collection, analyses, or interpretation of data; in the writing of the manuscript; or in the decision to publish the results.

References

  1. Rogger, M.; Agnoletti, M.; Alaoui, A.; Bathurst, J.C.; Bodner, G.; Borga, M.; Chaplot, V.; Gallart, F.; Glatzel, G.; Hall, J.; et al. Land use change impacts on floods at the catchment scale: Challenges and opportunities for future research. Water Resour. Res. 2017, 53. [Google Scholar] [CrossRef]
  2. Van Geer, F.C.; Kronvang, B.; Broers, H.P. High-resolution monitoring of nutrients in groundwater and surface waters: process understanding, quantification of loads and concentrations, and management applications. Hydrol. Earth Syst. Sci. 2016, 20, 3619–3629. [Google Scholar] [CrossRef]
  3. Dragon, K.; Kasztelan, D.; Gorski, J.; Najman, J. Influence of subsurface drainage systems on nitrate pollution of water supply aquifer (Tursko well-field, Poland). Environ Earth Sci. 2016, 75. [Google Scholar] [CrossRef]
  4. Fučík, P.; Hejduk, T.; Peterková, J. Quantifying Water Pollution Sources in a Small Tile-drained Agricultural Watershed. CLEAN 2014, 42, 698–709. [Google Scholar] [CrossRef]
  5. King, K.W.; Williams, M.R.; Macrae, M.L.; Fausey, N.R.; Frankenberger, J.; Smith, D.R.; Kleinman, P.J.A.; Brown, L.C. Phosphorus Transport in Agricultural Subsurface Drainage: A Review. J. Environ. Qual. 2015. [Google Scholar] [CrossRef] [PubMed]
  6. Kyllmar, K.; Bechmann, M.; Deelstra, J.; Iital, A.; Blicher-Mathiesen, G.; Jansons, V.; Koskiaho, J.; Povilaitis, A. Long-term monitoring of nutrient losses from agricultural catchments in the Nordic–Baltic region—A discussion of methods, uncertainties and future needs. Agric. Ecosyst. Environ. 2014, 198, 4–12. [Google Scholar] [CrossRef]
  7. Macrae, M. L.; English, M.C.; Schiff, S.L.; Stone, M. Capturing temporal variability for estimates of annual hydrochemical export from a first-order agricultural catchment in southern Ontario, Canada. Hydrol. Process. 2007, 21, 1651–1663. [Google Scholar] [CrossRef]
  8. Rozemeijer, J.C.; Visser, A.; Borren, W.; Winegram, M.; van der Velde, Y.; Klein, J.; Broers, H.P. High-frequency monitoring of water fluxes and nutrient loads to assess the effects of controlled drainage on water storage and nutrient transport. Hydrol. Earth Syst. Sci. 2016, 20, 347–358. [Google Scholar] [CrossRef]
  9. Smith, D.R.; King, K.W.; Johnson, L.; Francesconi, W.; Richards, P.; Baker, D.; Sharpley, A.N. Surface Runoff and Tile Drainage Transport of Phosphorus in the Midwestern United States. J. Environ. Qual. 2015, 44, 495–502. [Google Scholar] [CrossRef] [PubMed]
  10. Christianson, L.E.; Harmel, R.D.; Smith, D.; Williams, M.R.; King, K. Assessment and Synthesis of 50 Years of Published Drainage Phosphorus Losses. J. Environ. Qual. 2016, 45, 1467–1477. [Google Scholar] [CrossRef] [PubMed]
  11. Ernstsen, V.; Olsen, P.; Rosenbom, A.E. Long-term monitoring of nitrate transport to drainage from three agricultural clayey till fields. Hydrol. Earth Syst. Sci. 2015, 19, 3475–3488. [Google Scholar] [CrossRef]
  12. King, K.W.; Williams, M.R.; Fausey, N.R. Effect of crop type and season on nutrient leaching to tile drainage under a corn–soybean rotation. J. Soil Water Conserv. 2016, 71, 56–68. [Google Scholar] [CrossRef]
  13. Zhao, X.; Christianson, L.E.; Harmel, D.; Pittelkow, C.M. Assessment of drainage nitrogen losses on a yield-scaled basis. Field Crop. Res. 2016, 199, 156–166. [Google Scholar] [CrossRef]
  14. Exner-Kittridge, M.; Strauss, P.; Blöschl, G.; Eder, A.; Saracevic, E.; Zessner, M. The seasonal dynamics of the stream sources and input flow paths of water and nitrogen of an Austrian headwater agricultural catchment. Sci. Total Environ. 2016, 542, 935–945. [Google Scholar] [CrossRef] [PubMed]
  15. Fučík, P.; Zajíček, A.; Duffková, R.; Kvítek, T. Water Quality of Agricultural Drainage Systems in the Czech Republic—Options for Its Improvement. In Research and Practices in Water Quality; Lee, T.S., Ed.; InTech: Rijeka, Croatia, 2015; pp. 239–262. ISBN 978-953-51-2163-3. [Google Scholar]
  16. Monaghan, R.M.; Smith, L.C.; Muirhead, R.W. Pathways of contaminant transfers to water from an artificially-drained soil under intensive grazing by dairy cows. Agric. Ecosyst. Environ. 2016, 220, 76–88. [Google Scholar] [CrossRef]
  17. Zajíček, A.; Pomije, T.; Kvítek, T. Event water detection in tile drainage runoff using stable isotopes and a water temperature in small agricultural catchment in Bohemian-Moravian Highlands, Czech Republic. Environ. Earth Sci. 2016, 75. [Google Scholar] [CrossRef]
  18. Tiemeyer, B.; Kahle, P.; Lennartz, B. Designing monitoring programs for artificially drained catchments. Vadose Zone J. 2010, 9, 14–24. [Google Scholar] [CrossRef]
  19. Ulén, B.; von Brömssen, C.; Johansson, G.; Torstensson, G.; Forsberg, L.S. Trends in nutrient concentrations in drainage water from single fields under ordinary cultivation. Agric. Ecosyst. Environ. 2012, 161, 61–69. [Google Scholar] [CrossRef]
  20. Verma, S.; Markus, M.; Cooke, R.A. Development of error correction techniques for nitrate-N load estimation methods. J. Hydrol. 2012, 432, 12–25. [Google Scholar] [CrossRef]
  21. Vidon, P.; Hubbard, H.; Cuadra, P.E.; Hennessy, M. Storm Flow Generation in Artificially Drained Landscapes of the US Midwest: Matrix Flow, Macropore Flow, or Overland Flow. Water 2012, 4, 90–111. [Google Scholar]
  22. Kulhavý, Z.; Fučík, P. Adaptation Options for Land Drainage Systems Towards Sustainable Agriculture and the Environment: A Czech Perspective. Pol. J. Environ. Stud. 2015, 24, 1085–1102. [Google Scholar] [CrossRef]
  23. Tlapáková, L.; Žaloudík, J.; Kolejka, J. Thematic survey of subsurface drainage systems in the Czech Republic. J. Maps 2016, 13, 55–65. [Google Scholar] [CrossRef]
  24. Aulenbach, B.T.; Burns, D.A.; Shanley, J.B.; Yanai, R.D.; Bae, K.; Wild, A.D.; Yang, Y.; Yi, D. Approaches to stream solute load estimation for solutes with varying dynamics from five diverse small watersheds. Ecosphere 2016, 7. [Google Scholar] [CrossRef]
  25. Birgand, F.; Faucheux, C.; Gruau, G.; Augeard, B.; Moatar, F.; Bordenave, P. Uncertainties in assessing annual nitrate loads and concentration indicators: Part 1: Impact of sampling frequency and load estimation algorithms. ASABE 2010, 53, 437–446. [Google Scholar] [CrossRef]
  26. Harmel, R.D.; Smith, D.R.; King, K.W.; Slade, R.M. Estimating storm discharge and water quality data uncertainty: A software tool for monitoring and modeling applications. Environ. Model. Softw. 2009, 24, 832–842. [Google Scholar] [CrossRef]
  27. Jiang, Y.; Frankenberger, J.R.; Bowling, L.C.; Sun, Z. Quantification of uncertainty in estimated nitrate-N loads in agricultural watersheds. J. Hydrol. 2014, 519, 106–116. [Google Scholar] [CrossRef]
  28. Reynolds, K.N.; Loecke, T.D.; Burgin, A.J.; Davis, C.A.; Riveros-Iregui, D.; Thomas, S.A.; Clair, M.A.St.; Ward, A.S. Optimizing Sampling Strategies for Riverine Nitrate Using High-Frequency Data in Agricultural Watersheds. Environ. Sci. Technol. 2016. [Google Scholar] [CrossRef] [PubMed]
  29. Richards, R.P.; Baker, D.B.; Kramer, J.W.; Ewing, D.E.; Merryfield, B.J.; Miller, N.L. Storm discharge, loads, and average concentrations in Northwest Ohio Rivers, 1975–1995. J. Am. Water Resour. Assoc. 2001, 37, 423–438. [Google Scholar] [CrossRef]
  30. Guo, Y.; Markus, M.; Demissie, M. Uncertainty of nitrate-N load computations for agricultural watersheds. Water Resour. Res. 2002, 38, 1185. [Google Scholar] [CrossRef]
  31. Williams, M.R.; King, K.W.; Macrae, M.L.; Ford, W.; Van Esbroeck, Ch.; Brunke, R.I.; English, M.C.; Schiff, S.L. Uncertainty in nutrient loads from tile-drained landscapes: Effect of sampling frequency, calculation algorithm, and compositing strategy. J. Hydrol. 2015, 530, 306–316. [Google Scholar] [CrossRef]
  32. Cassidy, R.; Jordan, P. Limitations of instantaneous water quality sampling in surface-water catchments: Comparison with near-continuous phosphorus time-series data. J.Hydrol. 2011, 405, 182–193. [Google Scholar] [CrossRef]
  33. Defew, L.H.; May, L.; Heal, K.V. Uncertainties in estimated phosphorus loads as a function of different sampling frequencies and common calculation methods. Mar. Freshwater. Res. 2013, 64, 373–386. [Google Scholar] [CrossRef] [Green Version]
  34. Lam, W.V.; Macrae, M.L.; English, M.C.; O´Halloran, I.P.; Plach, J.M.; Wang, Y. Seasonal and event-based drivers of runoff and phosphorus export through agricultural tile drains under sandy loam soil in a cool temperate region. Hydrol. Process. 2016, 30, 2644–2656. [Google Scholar] [CrossRef]
  35. Campbell, J.M.; Jordan, P.; Arnscheidt, J. Using high-resolution phosphorus data to investigate mitigation measures in headwater river catchments. Hydrol. Earth Syst. Sci. 2015, 19, 453–464. [Google Scholar] [CrossRef]
  36. Bloodworth, J.W.; Holman, I.P.; Burgess, P.J.; Gillman, S.; Frogbrook, Z.; Brown, P. Developing a multi-pollutant conceptual framework for the selection and targeting of interventions in water industry catchment management schemes. J. Environ. Manag. 2015, 161, 153–162. [Google Scholar] [CrossRef] [PubMed] [Green Version]
  37. Knauer, K. Pesticides in surface waters: A comparison with regulatory acceptable concentrations (RACs) determined in the authorization process and consideration for regulation. Environ. Sci. Eur. 2016, 28. [Google Scholar] [CrossRef] [PubMed]
  38. Brauer, N.; O’Geen, A.T.; Dahlgren, R.A. Temporal variability in water quality of agricultural tailwaters: Implications for water quality monitoring. Agric. Water Manag. 2009, 96, 1001–1009. [Google Scholar] [CrossRef]
  39. Lenhart, C.; Gordon, B.; Gamble, J.; Current, D.; Ross, N.; Herring, L.; Nieber, J.; Peterson, H. Design and Hydrologic Performance of a Tile Drainage Treatment Wetland in Minnesota, USA. Water 2016, 8, 549. [Google Scholar] [CrossRef]
  40. Coyle, C.; Creamer, R.E.; Schulte, R.P.O.; O’Sullivan, L.; Jordan, P. A Functional Land Management conceptual framework under soil drainage and land use scenarios. Environ. Sci. Policy 2016, 56, 39–48. [Google Scholar] [CrossRef]
  41. USDA-NRSC. Soil Taxonomy, 2nd ed.; Govermnent Printing Office: Washington, DC, USA, 1999.
  42. Doležal, F.; Kvítek, T. The role of recharge zones, discharge zones, springs and tile drainage systems in peneplains of Central European highlands with regard to water quality generation processes. Phys. Chem. Earth 2004, 29, 775–785. [Google Scholar] [CrossRef]
  43. Herrmann, A.; Duncker, D. Runoff Formation in a Tile-drained Agricultural Basin of the Harz Mountain Foreland, Northern Germany. Soil Water Res. 2008, 3, 83–97. [Google Scholar]
  44. Bauwe, A.; Tiemeyer, B.; Kahle, P.; Lennartz, B. Classifying hydrological events to quantify their impact on nitrate leaching across three spatial scales. J. Hydrol. 2015, 531, 589–601. [Google Scholar] [CrossRef]
  45. Büttner, O.; Tittel, J. Uncertainties in dissolved organic carbon load estimation in a small stream. J. Hydrol. Hydromech. 2013, 61, 81–83. [Google Scholar] [CrossRef]
  46. Deelstra, J.; Iital, A.; Povilaitis, A.; Kyllmar, K.; Greipsland, I.; Blicher-Mathiesen, G.; Jansons, V.; Koskiaho, J.; Lagzdins, A. Reprint of ‘Hydrological pathways and nitrogen runoff in agricultural dominated catchments in Nordic and Baltic countries’. Agric. Ecosyst. Environ. 2014, 198, 211–219. [Google Scholar] [CrossRef]
  47. Fučík, P.; Kaplická, M.; Kvítek, T.; Peterková, J. Dynamics of Stream Water Quality during Snowmelt and Rainfall—Runoff Events in a Small Agricultural Catchment. CLEAN 2012, 40, 154–163. [Google Scholar] [CrossRef]
  48. Konečná, J.; Karásek, P.; Fučík, P.; Podhrázská, J.; Pochop, M.; Ryšavý, S.; Hanák, R. Integration of soil and water conservation measures in an intensively cultivated watershed – a case study of Jihlava River Basin (Czech Republic). Eur. Countryside 2017, 1, 17–28. [Google Scholar] [CrossRef]
  49. Nováková, E.; Karous, M.; Zajíček, A.; Karousová, M. Evaluation of ground penetrating radar and vertical electrical sounding methods to determine soil horizons and bedrock at the locality Dehtáře. Soil Water Res. 2013, 8, 105–112. [Google Scholar]
  50. Kennedy, C.D.; Bataille, C.; Liu, Z.; Ale, S.; VanDeVelde, J.; Roswell, C.R.; Bowling, L.C.; Bowen, G.J. Dynamics of nitrate and chloride during storm events in agricultural catchments with different subsurface drainage intensity (Indiana, USA). J. Hydrol. 2012, 466, 1–10. [Google Scholar] [CrossRef]
  51. Klaus, J.; Zehe, E.; Elsner, M.; Külls, C.; McDonnell, J.J. Macropore flow of old water revisited: Experimental insights from a tile-drained hillslope. Hydrol. Earth Syst. Sci. 2013, 17, 103–118. [Google Scholar] [CrossRef] [Green Version]
  52. Tachecí, P.; Žlábek, P.; Kvítek, T.; Peterková, J. Analysis of rainfall-runoff events in four subcatchments of the Kopaninský potok (Czech Republic). Bodenkultur 2013, 64, 105–111. [Google Scholar]
  53. Merz, R.; Bloschl, G.; Parajka, J. Spatio-temporal variability of event runoff coefficients. J. Hydrol. 2006, 331, 591–604. [Google Scholar] [CrossRef]
Figure 1. Characteristics and location of the monitored sites in the Czech Republic.
Water 09 00712 g001
Figure 2. An example of sampling site equipment. (a): site Š2; (b): site VP2.
Water 09 00712 g002
Figure 3. Using the semi-automated algorithm for the identification of REs; an example from the VP2 site.
Water 09 00712 g003
Figure 4. (a) Basic statistics of N-NO3 concentrations in drainage waters across all the monitored sites, for regular (RS) and event (RE) sampling schemes. Cfw is flow-weighed concentration; (b) Basic statistics of P-PO4 concentrations in drainage waters across all the monitored sites, for regular (RS) and event (RE) sampling schemes. Cfw is flow-weighed concentration; (c) Basic statistics of Ptot concentrations in drainage waters across all the monitored sites, for regular (RS) and event (RE) sampling schemes. Cfw is flow-weighed concentration.
Water 09 00712 g004aWater 09 00712 g004b
Figure 5. Basic statistics of the share of runoff events (RE) in the annual runoff and nutrient loads (data from all monitored sites and periods).
Water 09 00712 g005
Figure 6. (a) Annual nutrient loads calculated by M1 to M6 and the proportion of runoff events in the total load for all substances at sites KL, KP, P53, P6, and PD1 and for all monitored periods. (b) Annual nutrient loads calculated by M1 to M6 and the proportion of runoff events in the total load for all substances at sites PD2, Š2, V1, VP1, and VP2 and for all monitored periods.
Water 09 00712 g006aWater 09 00712 g006b
Figure 7. (a) Monthly values of accuracy (%) of M3 to M5 related to M6 for all substances at sites KL, KP, P53, P6, and PD1 and for all monitored periods. (b) Monthly values of accuracy (%) of M3 to M5 related to M6 for all substances at sites PD2, Š2, V1, VP1, and VP2 and for all monitored periods.
Water 09 00712 g007aWater 09 00712 g007b
Table 1. Basic characteristics of the monitored sites.
SiteMean Catchment Altitude (m a.s.l.)Drained Area (ha)Catchment Area (ha)Primary Land UseAvg. Discharge (l/s)Specific Discharge (l/s/ha)Fertilization/ManagementEvaluated Period (HR)
KL5506.5129.6grassland0.2190.007Digestate2012–2016
KP5509.5128.3arable land1.2650.044Mineral + manure2012–2016
P535655.4614.86arable land0.0450.003Mineral2012–2016
P65109.8515.73arable land0.5590.036Mineral2012–2016
PD13951.9213.42arable land0.3070.023Digestate2014–2016
PD23952.316.98arable land0.2440.035Mineral2014–2016
Š25151.213.82arable land0.2560.067Mineral2012–2016
V16555.8537.9pasture0.9930.026Cattle grazing2012–2014
VP14958.6819.95arable land0.570.028Fugate + mineral2014–2016
VP249521.3228.25arable land0.7050.025Fugate + mineral2014–2016
HR—hydrological year. Specific discharge calculated using the catchment area.
Table 2. The load assessment methods employed and compared in this study.
MethodDescriptionEquation
M1Load (a) = Mean year discharge × mean annual concentration (both from 14 day sampling values) L = K ( Q a C a )
M2Load (a) = Cumulative annual runoff volume (from 10 min data) × flow-weighted concentration (from 14 day sampling values) L = K ( V a C f w )
M3Load (a,m) = Actual discharge (from sampled days only) × concentration (from 14 day sampling values). For the unsampled days, a load of the previous/next sampling day is set. L = K ( i = 1 n Q i C i )
M4Load (a,m) = Mean daily discharge (from 10 min data in all days) × concentration (from 14 day sampling values). For the unsampled days, a concentration of the previous/next sampling day is set. L = K ( i = 1 n Q d i C i )
M5Load (a,m) = Mean daily discharge (from 10 min data in all days) × concentration (from 14 day sampling values). For the unsampled days, a linear interpolation of the concentration is used from the consecutive sampled days L = K ( j = 1 n Q d i C j i n t )
M6Load (a,m) = M5 + loads during runoff eventsThis method was the only one to include runoff events, both sampled and unsampled (modelled). L = K ( j = 1 n Q d i C j i n t ) + K ( e = 1 n Q e C e )
K is the units and time conversion constant; Qa is the mean annual discharge; Ca is the mean annual concentration; Va is the cumulative annual runoff volume; Cfw is the flow-weighted concentration; Qi is the actual discharge in time of sampling; Ci is the concentration from grab sampling; Qd is the mean daily discharge; Vd is the cumulative daily runoff volume (from 10 min data); Cjint is the linear interpolation of concentration values between the consecutive grab samples; Qe is the actual discharge during an event; Ce is the actual concentration during an event, whether measured or modeled; Cfw is flow-weighted concentration; and n is the number of days.
Table 3. The share of runoff events in the total annual drainage runoff and in N-NO3, P-PO4, and Ptot total annual loads and the share of runoff events on average within one HR for the monitored hydrological years at all the sites.
SiteKLKPP53P6PD1PD2Š2V1VP1VP2
Evaluated Period (HR)12–1612–1612–1612–1614–1614–1612–1612–1414–1614–16
TotalNumber of RE (monitored)71 (29)65 (25)53 (22)78 (21)21 (8)36 (16)39 (14)56 (21)37 (17)56 (26)
Duration of RE days (%) 133 (7.3)177 (9.7)168 (9.2)226 (12.4)46 (4.2)62 (5.7)51 (2.8)125 (11.4)61 (5.6)110 (10.0)
Share of total runoff (%)24.827.662.83416.121.714.828.219.628.1
Share of total load N-NO3 (%)12.321.157.734.224.437.510.122.117.018.5
Share of total load P-PO4 (%)37.838.383.661.431.753.519.343.147.647.8
Share of total load Ptot (%)36.640.574.473.253.952.120.339.54650.7
Average per 1 HRNumber of RE (monitored)14 (6)13 (5)11 (4)16 (4)7 (3)12 (5)10 (4)19 (7)12 (6)18 (9)
Duration of RE (days) %26.6 (7.3)35.3 (9.7)33.6 (9.2)45.1 (12.4)15.4 (4.2)20.7 (5.7)17.9 (4.9)41.6 (11.4)20.2 (37.8)36.5 (10.0)
Share of annual runoff (%)21.325.348.828.813.520.611.527.419.229.1
Share of annual load N-NO3 (%)10.82250.930.820.835.48.622.816.919.5
Share of annual load P-PO4 (%)32.337.173.358.824.449.916.54336.743.8
Share of annual load Ptot (%)30.93662.849.736.148.617.137.737.246.7
HR means hydrological year.
Table 4. Accuracy statistics (%) of the M1 to M5 algorithms related to the true load (M6) on an annual basis for all the substances, sites, and monitored periods.
N-NO3P-PO4Ptot
minmaxmeanmedianminmaxmeanmedianminmaxmeanmedian
M1−27.564.5−3.2−6.9−93.347.5−27.9−27.8−78.24.2−28.2−23.6
M2−24.846.13.20.3−92.016.1−20.5−15.0−79.917.8−17.8−11.9
M3−48.774.11.3−2.8−79.589.4−18.8−22.2−80.934.1−18.2−12.7
M4−38.439.81.42.3−74.610.6−22.5−17.8−80.118.5−21.7−16.9
M5−37.341.71.42.1−74.76.0−24.6−18.7−79.720.5−21.9−14.5
Table 5. Average monthly accuracy (%) of the M3 to M5 algorithms related to the true load (M6) for all the substances, sites, and monitored periods.
M3M4M5
SiteN-NO3P-PO4PtotN-NO3P-PO4PtotN-NO3P-PO4Ptot
KL0.38−33.39−20.933.97−31.35−16.174.03−27.33−12.22
KP1.91−37.20−12.482.17−39.78−12.662.48−37.35−12.63
P53−12.35−962.19−88.09−8.58−445.31−51.30−21.91−473.09−59.06
P6−2.80−145.51−96.26−2.42−140.96−88.37−0.65−126.26−75.83
PD1−11.28−16.86−103.62−1.19−3.55−30.85−1.42−6.22−29.87
PD2−38.870.298.41−14.62−33.72−37.27−14.42−35.68−37.38
Š2−16.39−88.88−41.40−5.39−29.36−31.66−0.36−21.95−13.80
V1−6.60−211.20−92.73−0.60−155.40−63.18−0.20−141.39−41.51
VP1−10.67−207.78−88.58−1.83−144.03−52.79−1.43−128.40−32.07
VP2−7.72−60.50−53.11−0.88−36.21−30.143.22−39.77−29.97
average−10.44−176.32−58.88−2.94−105.97−41.44−3.07−103.74−34.43
Table 6. Average monthly RMSE (%) of the M3 to M5 algorithms related to the true load (M6) for all the substances, sites, and monitored periods.
M3M4M5
SiteN-NO3P-PO4PtotN-NO3P-PO4PtotN-NO3P-PO4Ptot
KL23.5890.8761.169.9881.7737.598.9077.2726.96
KP21.9097.3743.449.0892.3828.948.4985.3428.47
P5361.154126.42278.0163.971596.52123.47175.611841.11177.04
P624.43382.84288.4013.28343.94259.2910.92329.51224.72
PD160.9191.76579.898.9625.68155.827.2916.13148.69
PD2140.7150.3243.1135.4084.5886.6934.4377.0585.87
Š259.11276.52124.4649.2591.1989.2815.6253.7136.59
V135.33826.37250.0214.25631.76142.1710.92565.5876.86
VP129.96827.53255.656.56631.46144.634.81565.0679.65
VP229.33125.70129.9019.1574.4375.6017.2476.7262.68
mean48.64689.57205.4022.99365.37114.3529.42368.7594.75

