
Influence of Uneven Lighting on Quantitative Indicators of Surface Defects
by
 ,
,
Ihor Konovalenko
1, 
Pavlo Maruschak
1,
Halyna Kozbur
1, 
Janette Brezinová
2,*, 
Jakub Brezina
2,
Bohdan Nazarevich
1 and
Yaroslav Shkira
1 1
Department of Industrial Automation, Ternopil National Ivan Puluj Technical University, Rus’ka Str. 56, 46001 Ternopil, Ukraine
2
Department of Technology, Materials and Computer Supported Production, Faculty of Mechanical Engineering, Technical University of Košice, Mäsiarska 74, 040 01 Košice, Slovakia
*
Author to whom correspondence should be addressed.
Machines 2022, 10(3), 194; https://doi.org/10.3390/machines10030194
Submission received: 22 January 2022
/
Revised: 28 February 2022
/
Accepted: 4 March 2022
/
Published: 7 March 2022
(This article belongs to the Section Machines Testing and Maintenance)
Abstract
:The impact of the illumination level on the quantitative indicators of mechanical damage of the rolled strip is investigated. To do so, a physical model experiment was conducted in the laboratory. The obtained images of defects at light levels in the range of 2–800 lx were recognized by a neural network model based on the U-net architecture with a decoder based on ResNet152. Two levels of illumination were identified, at which the total area of recognized defects increased: 50 lx and 300 lx. A quantitative assessment of the overall accuracy of defect recognition was conducted on the basis of comparison with data from images marked by an expert. The best recognition result (with Dice similarity coefficient DSC = 0.89) was obtained for the illumination of 300 lx. At lower light levels (less than 200 lx), some of the damage remained unrecognized. At high light levels (higher than 500 lx), a decrease in DSC was observed, mainly due to the fact that the surface objects are better visible and the recognized fragments become wider. In addition, more false-positives fragments were recognized. The obtained results are valuable for further adjustment of industrial systems for diagnosing technological defects on rolled metal strips.
1. Introduction
Metallurgy is one of the high-tech industries where optical and digital control methods for the rolled metal are actively developing. Computer image analysis has become the main tool of technical diagnostic systems, which can significantly improve the rolled metal quality [1,2,3]. At present, metallurgical plants use optoelectronic systems based on the analysis of local areas of the rolled strip surface. However, such systems are limited in understanding the propagation mechanisms of many damages, which can be inherent in the equipment installed at a particular facility only [4,5]. Under such conditions, diagnostically important indicators are those that provide for the defect type assessment based on quantitative statistical parameters, such as the area, curvature, tortuosity, etc. In addition, stringent requirements are placed on modern systems in terms of reliability, accuracy, image processing speed, etc. [6,7]. The existing software systems for analyzing rolled metal require us to further develop and refine software that measures a full set of diagnostic defect signs and establishes the reasons for their occurrence [8,9]. Typically, such systems include image recording tools, band diagnostic information, and most common tools for image pre-processing, quality improvement, and image labeling.
Previous works [10,11] were focused on deep residual neural networks applied in order to detect and classify the defect types found on the rolled metal surface. A classifier for recognizing defects of three classes was constructed on the basis of the ResNet152 neural network. Most images were taken from a dataset provided in 2019 by Severstal Russian Public Company as part of the international Kaggle competition. A total of 14,830 images of steel surfaces, both undamaged and damaged, were selected. A sample for studying the neural network classifier was formed using photographs of rolled metal surfaces that contain various kinds of damage.
The proposed technique makes it possible to recognize and classify surface damage by its image in real-time with high accuracy. The average binary accuracy of the classification based on the test data is 97.3%. Neuron activation fields were studied in the convolutional layers of the model. The areas corresponding to the image areas with damage were shown to be activated. False-positive and false-negative cases of the classifier application have been studied. Errors were found to occur most frequently in ambiguous situations when surface artifacts of different types are similar to each other.
It is noteworthy that increasingly tougher demands placed on diagnostic equipment of metallurgical plants necessitate using new strip lighting tools and image recording cameras. Modern defectometric control systems are based on the analysis of gray-scale strip surface images of different intensities [12]. The reflected light is captured by the camera sensor and creates an image of the defective surface. Therefore, the content and accuracy of such systems depend both on the analyzed surfaces’ ability to reflect light (which may differ even within one batch of rolled metal) and on the lighting system. Lighting is one of the determining factors that impact the result of the digital image recognition of metal surfaces. Creating optimal lighting conditions is a complex technical task, which is part of the general problem consisting in improving the accuracy of systems for identifying technological defects in rolled metal. In addition to theoretical calculations, the creation of the optimal lighting conditions requires direct experiments [13,14]. Front lighting is commonly used in practice, which provides for uniform light distribution and a small number of shadows or illuminated areas [1,2]. This type of lighting has proven itself well for surfaces with significant reflectivity. However, using such lighting for metal strips with a rough surface may lead to images with blurred defect edges or low contrast between the surface and the defect [15,16].
The detection of defects on metal surfaces is an important task that allows effective quality control and ensures the safe use of metal constructions. The recognition of digital images of metal surfaces using neural networks allows locating defects with sufficient accuracy and calculate their quantitative parameters (area, size, orientation, etc.). Quantitative parameters of damage allow automatically assessing the condition of the surface, excluding the subjective factor of the operator. However, lighting conditions affect both the accuracy of defect identification and the value of the obtained quantitative parameters of damage. Therefore, it is important to investigate the variance of the values of quantitative parameters obtained for the same surface at different light levels. It is also important to provide the optimal lighting range for defect recognition. The aim of our study is to investigate the change in the quantitative characteristics of damage when changing lighting, as well as to choose the optimal value of illumination, at which the recognition accuracy is the best.
2. Research Methodology
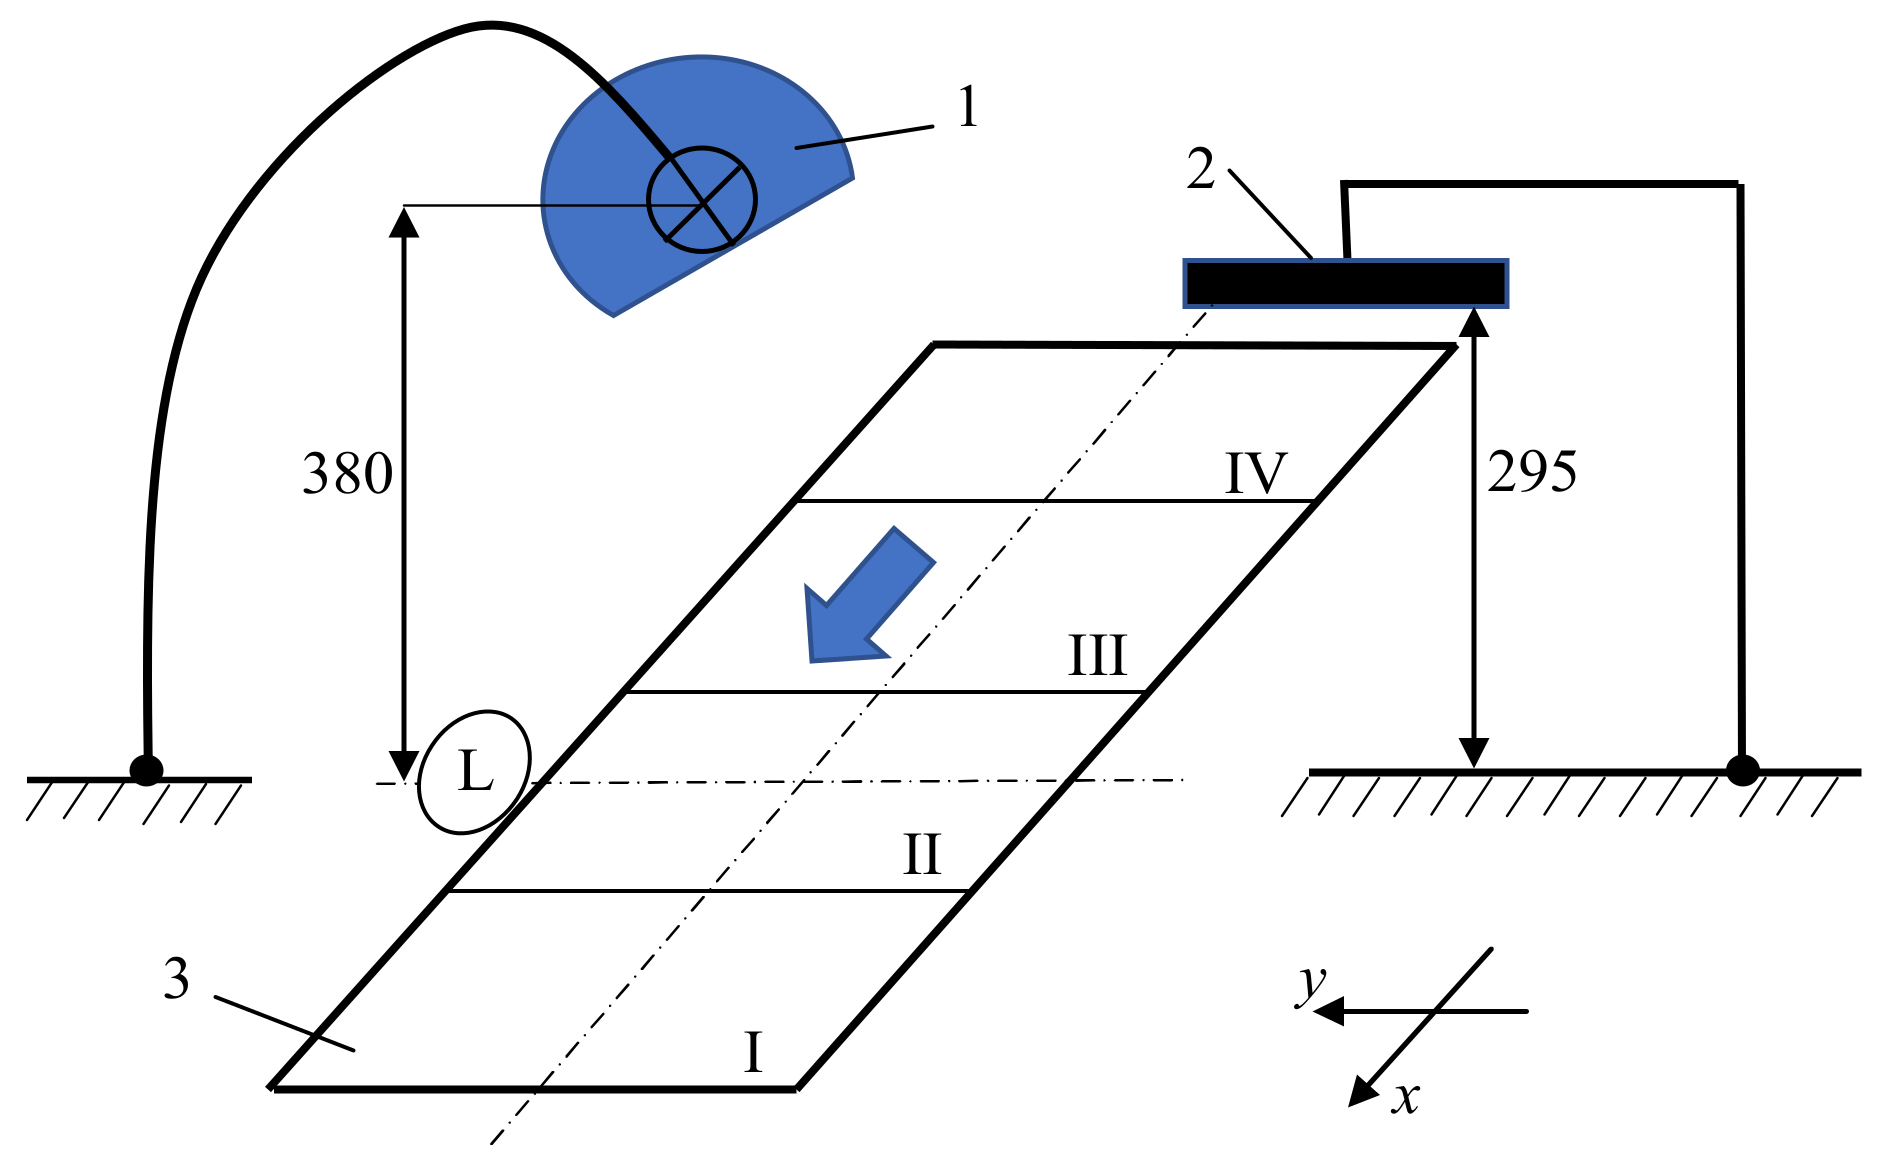
To study the impact of the lighting intensity on defect recognition, a metal plate with scratch-like defects was photographed in laboratory conditions under regulated and controlled lighting [17]. The scheme of the experimental setup for obtaining images of the damaged metal surface is shown in Figure 1. The test was performed by the “light field method”, which is widely used for analyzing the surface, etched metal sections, biological tissues, and various minerals. During the analysis, the surface of the metal strip divided into sections was lit from above. Since different parts of the metal strip reflect the light falling on them differently, the reflected rays have different intensities [18]. Owing to this, the image was obtained. Under the proposed lighting scheme, the camera receives most of the reflected light. This is the so-called “light field” analysis. The directed lighting is almost perpendicular to the metal surface under study. Under such shooting conditions, the surface is bright gray, and the defects are clearly visible.
The metal strip with defects pre-applied onto its surface was divided into several zones (I–IV). A Nikon D5600 camera was used to capture images of these areas. A 60-watt incandescent lamp was used to light the metal plate. During image acquisition, the light brightness was adjusted and controlled by a light meter that remained stationary. Photographs of all areas were obtained at a fixed point of shooting, as shown in Figure 1 for zone II. This made the shooting conditions identical and allowed us to compare images both within one area and between different areas. Images were obtained at light levels of 2, 50, 100, 200, 300, 400, 500, 600, 700, and 800 lx. Figure 2 shows examples of images obtained at different light levels.
3. Image Recognition Using Convolutional Neural Network
A deep convolutional neural network model based on the U-net architecture with a decoder based on ResNet152 was used to recognize damage [11]. The model was trained on rolled metal surface images provided by Severstal steel company as part of the Analytics and Modeling Competition organized on the Kaggle platform in 2019. From the array of images, we selected those that correspond to the scratch-like defects analyzed.
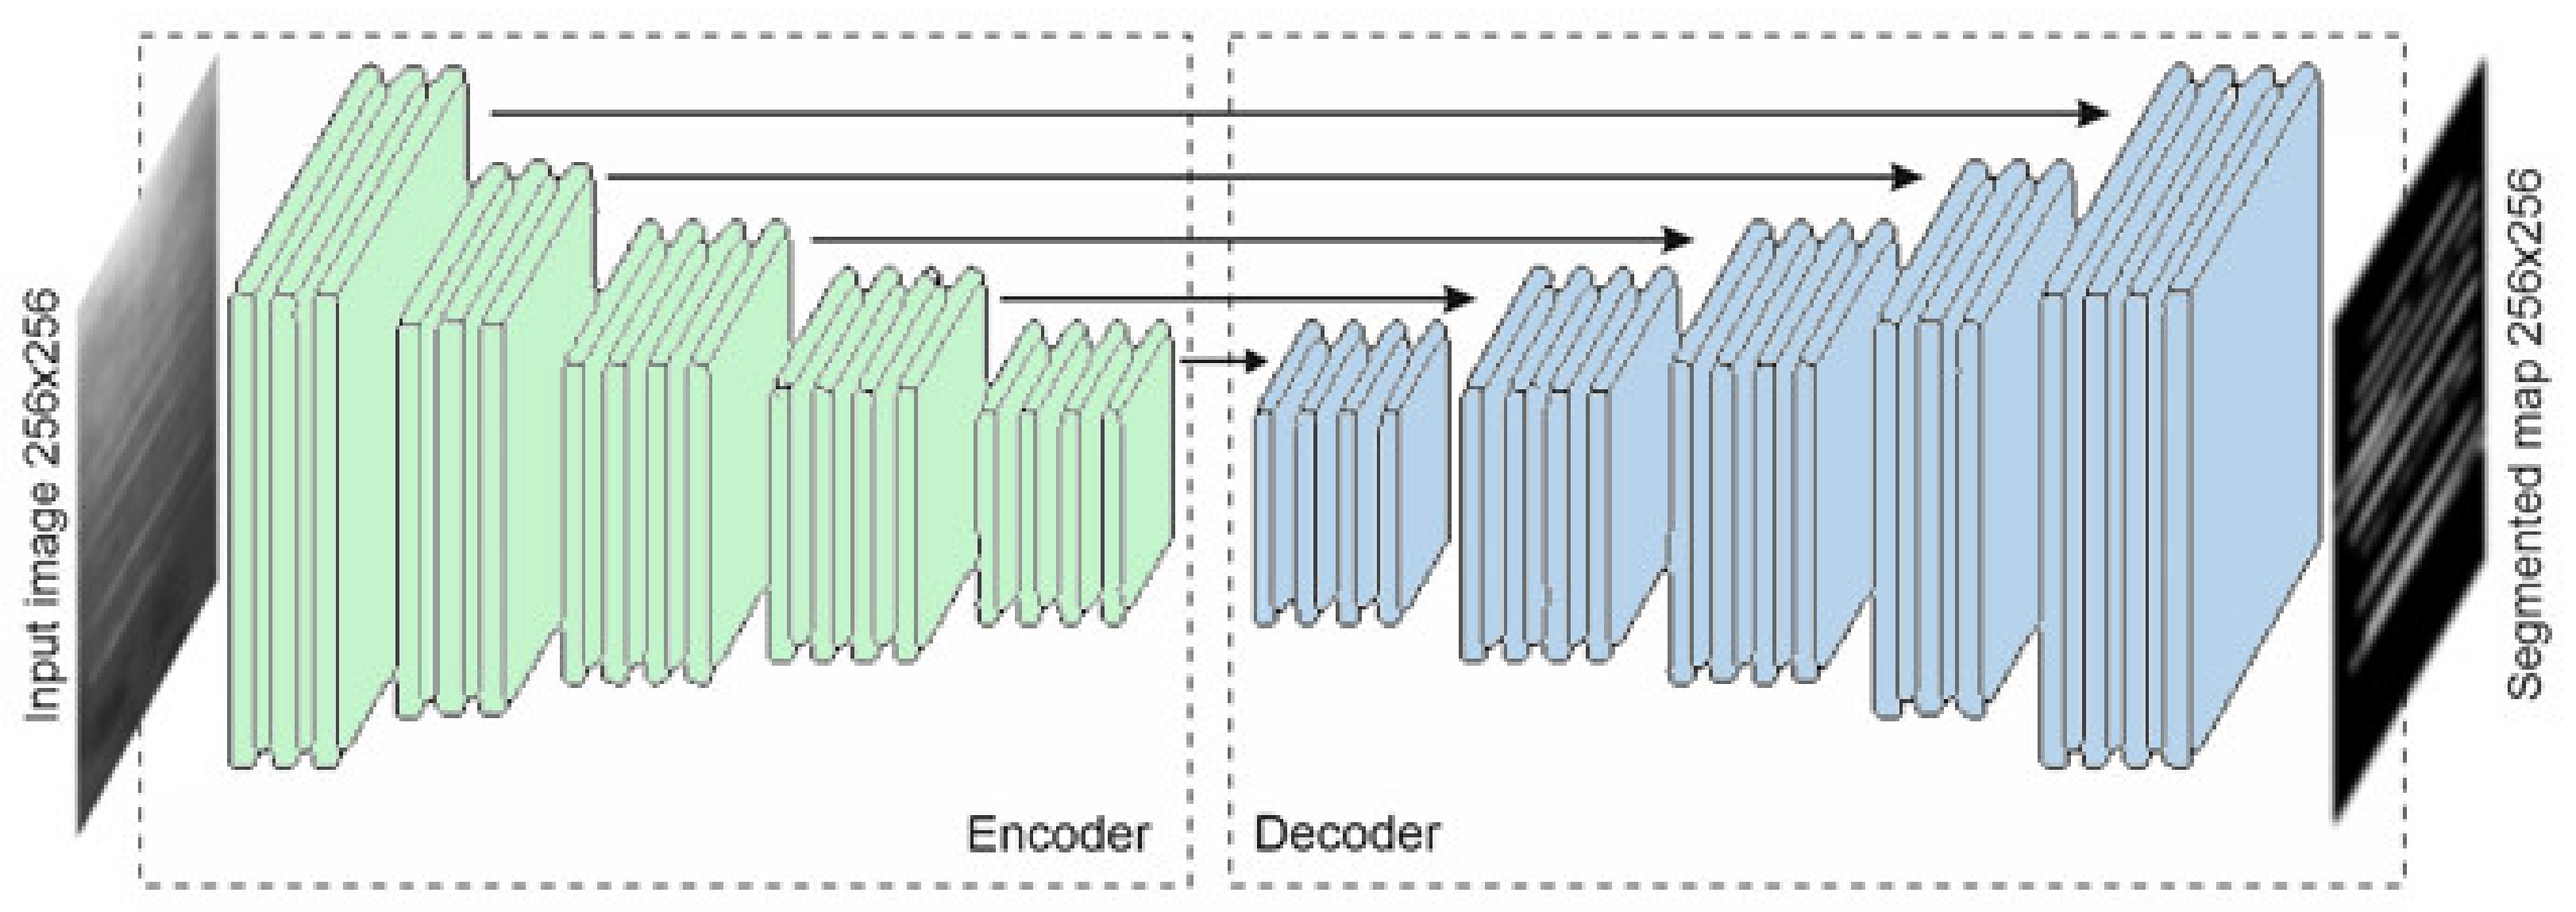
The U-net neural network was developed in 2015 for the processing of medical images. Its architecture results from the development and improvement of conventional convolutional neural networks. As regards defectometry tasks, we need to classify images into those that contain defects and those that do not contain them. Damage location should be precise in this case. Apart from improving the product quality control, this will make it possible to calculate the quantitative characteristics of damage (area, direction, etc.). This, in turn, will give us a better understanding of the damage’s nature and allow us to develop steps to eliminate it. The U-net neural network provides for the semantic segmentation of the image, in which each pixel is classified as belonging to either a damaged or undamaged area. In this case, the input and output images have the same size.
The U-net architecture consists of an encoder that detects feature maps inherent in the damage of interest and a decoder that projects those areas that best match the discovered features to the original image (Figure 3). The encoder contains five stages. Each stage contains sequentially connected convolutional layers, and batch normalization is performed using these layers. The decoder also contains five stages, each of which is connected to the outputs of the corresponding encoder stages and performs upsampling and generalization of its feature maps. The original layer of the neural network has a shape of 256 × 256 neurons with a sigmoid activation function. This makes it possible to obtain values on the output layer’s neurons in the range from 0 to 1, which reflects the degree of reliability with which the model recognizes the corresponding pixel as part of the damage.
The model of semantic segmentation developed and trained in the course of previous research was used [10,11]. The Dice similarity coefficient () is used to assess the segmentation quality. The Dice coefficient shows the area of overlap versus the actual area of the object recognized in a percentage:
where represents a set of pixels of the actual damage object according to the marking, and represents the set of pixels of the recognized object after segmentation.
When recognizing images from the test sample, the model demonstrated the Dice coefficient of 0.93. An image of 256 × 256 pixels was fed to the neural network’s input. The neural network was trained using the SGD (Stochastic Gradient Descent) optimizer and binary cross-entropy loss function.
The damage recognition model is implemented in Python 3.8 using the TensorFlow and Keras libraries, version 2.6.0. An OpenCV library developed by Intel was used to work with images. It contains convenient tools for processing and analyzing image content.
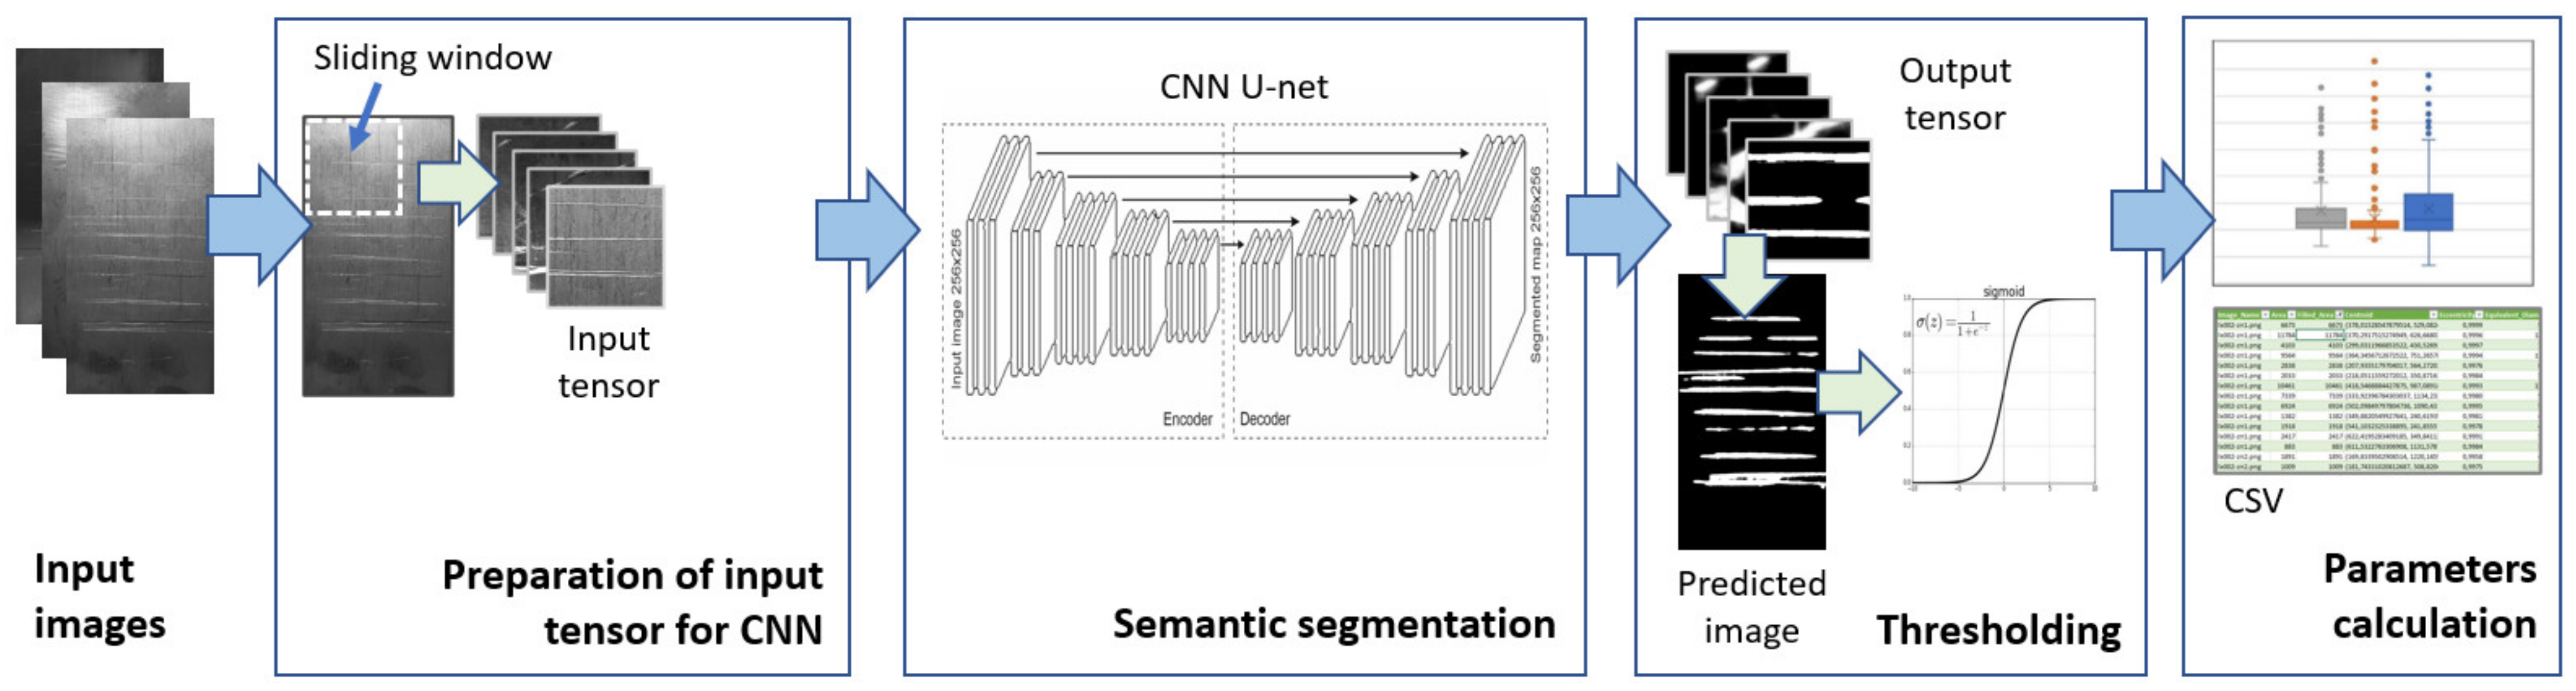
Figure 4 shows the general sequence of operations used when recognizing defects with a neural network. Only images of 256 × 256 pixels can be fed to the input of the neural network. Nevertheless, images of the metal surface can be of any size. Therefore, to recognize the entire surface, fragments were cut from the input image so that they cover its entire area. To this end, we used a sliding window of 256 × 256 pixels, which was moved with a certain fixed step (equal to 2⁄3 of the window width) along the horizontal axis first, and after reaching the edge of the image, along the vertical axis. Since image recognition often results in edge effects that account for a poor recognition accuracy near edges, the fragments were cut so that they overlap. Thus, a tensor with fragments was built for the input image, which was then fed to the input of the neural network for recognition.
After recognizing a set of fragments in the input image using a neural network model, a set of fragments is obtained at its output, in which each fragment recognized corresponds to the input fragment. To obtain a picture of the damage caused to the original image, it must be synthesized from the fragments recognized by folding (and superimposing) in the correct order. The pixels of the overlapping image fragments will have different intensity values. Therefore, two strategies were used and investigated that provide for the synthesis of the general image with damage:
- Averaging. When superimposing two fragments, the pixel intensity is calculated as the arithmetic mean. This is consistent with the hypothesis that both fragments are considered equally accurate in recognition. Then, the initial value will be averaged from the two obtained ones;
- Choosing max. In this case, for a pixel in the fragment overlay area, the maximum value of intensity is selected from the values obtained for two corresponding pixel fragments. This is consistent with the hypothesis that if one of the models is more confident of damage, then it is “right”.
It was found by experiment that the max-method works better for the images analyzed. It eliminates edge effects, which are mainly manifested in such a way that some defects from the fragment edges are almost unrecognizable. Therefore, all subsequent studies were performed using the max-method, which was applied to the synthesis of images recognized.
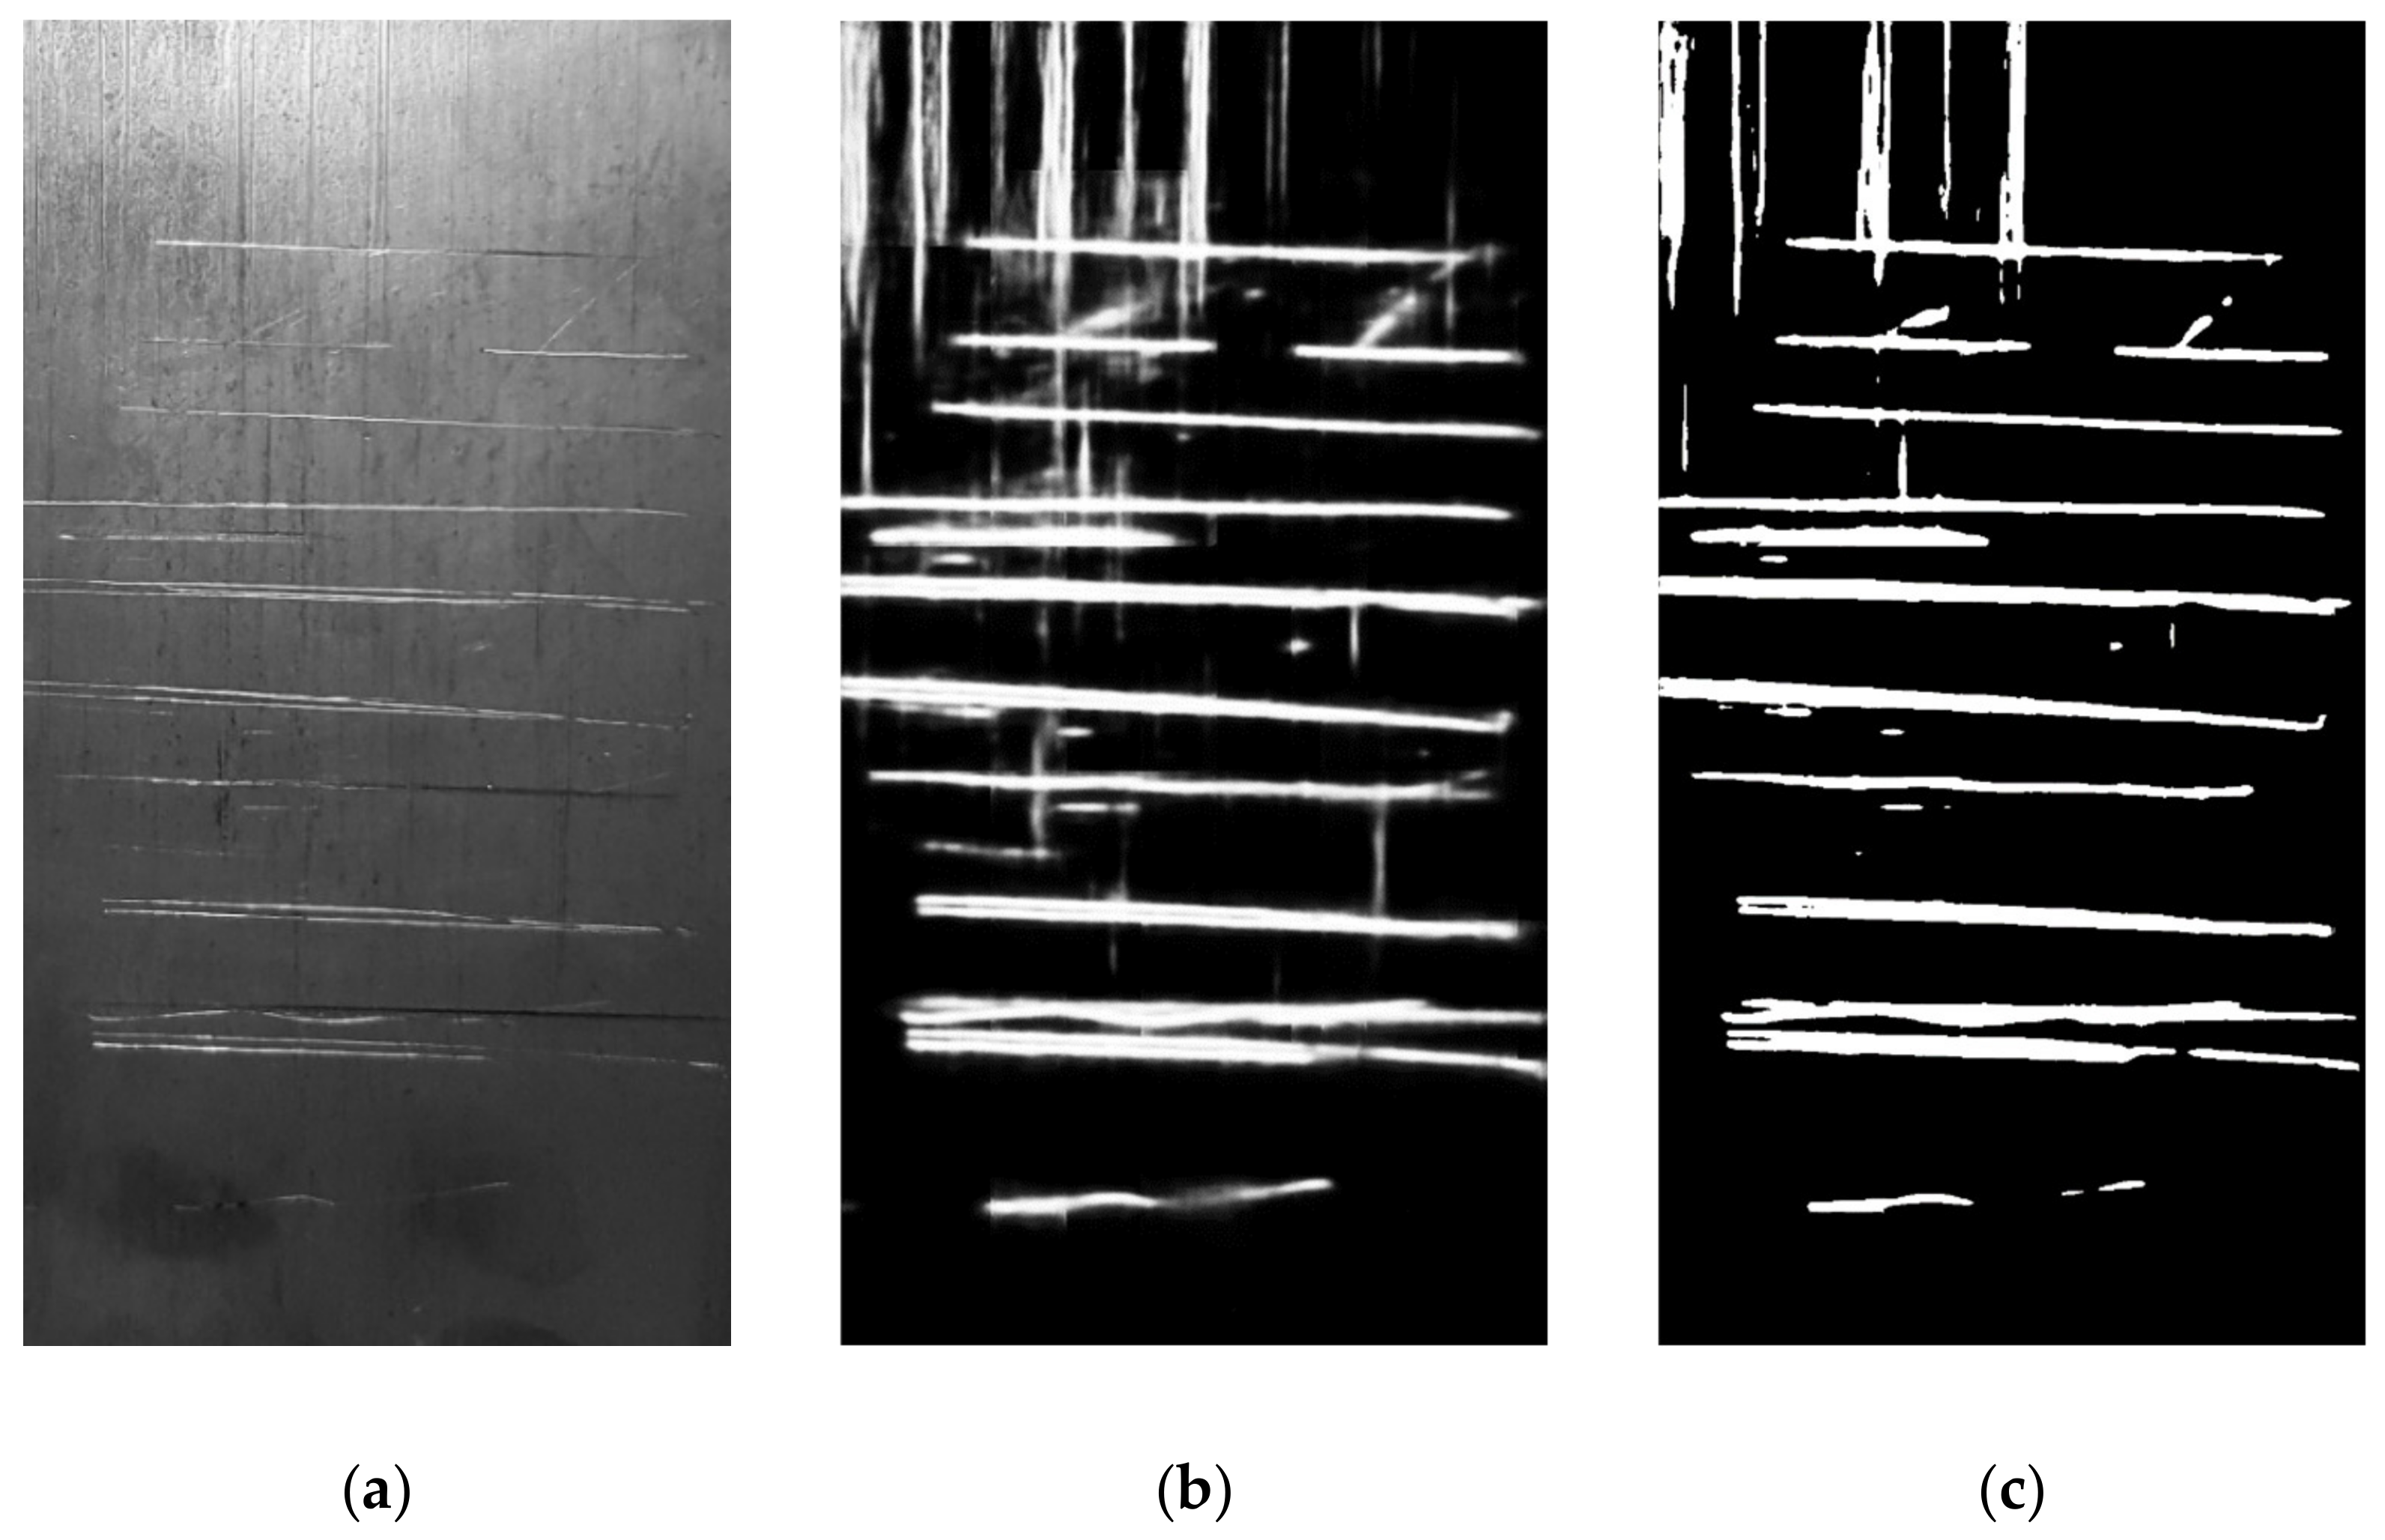
An example of the initial image of the damaged surface and the final synthesized image is shown in Figure 5a,b. As is seen, different areas of damage recognized have uneven brightness. Moreover, brighter areas correspond to damage, which is classified by the neural network as belonging more to the set of features it has formed. Therefore, with some approximation, such areas can be considered as belonging to damage with a greater degree of reliability.
4. Quantitative Parameters of Damage
In order to objectively quantify the surface with damage, it is important to obtain numerical indicators that characterize the type of existing damage. Individual objects (combined groups of pixels) recognized by the model represent fragments of surface defects. In order to identify and differentiate the defect types, their geometric parameters were determined, which describe the features of each damage fragment found.
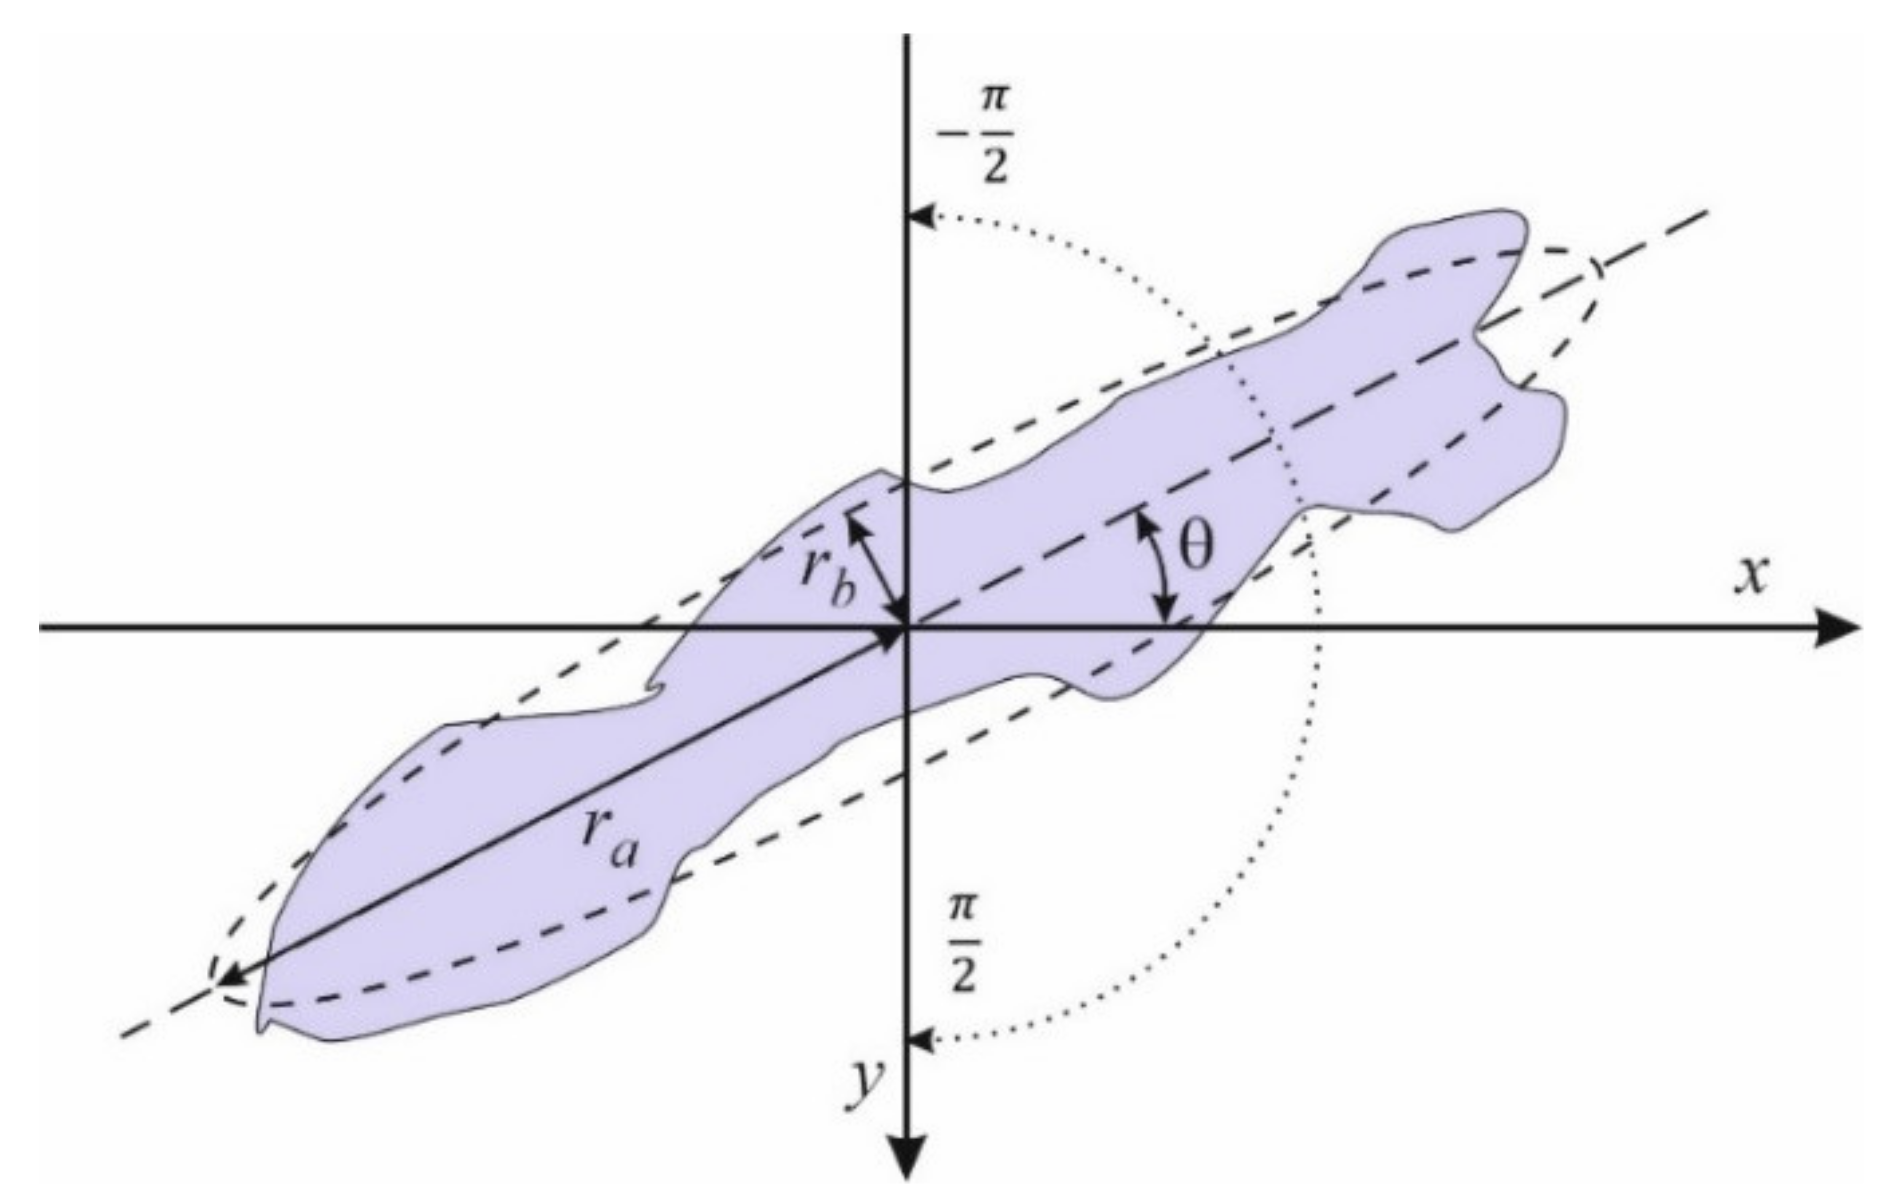
First of all, the area was defined as the basic parameter that characterizes the damage size. To calculate other parameters, we used the “equivalent” ellipse approach (Figure 6) proposed by the authors of [10,19,20,21,22]. The equivalent ellipse has a second moment equal to the moment of the defect recognized. This approach is simplistic and does not always describe the morphology of random defects. However, it is effective for defects of the classes considered.
We assume that is the set of pixels that make up the object. The area of damage was calculated as the total number of pixels in the set:
The center of mass coordinates for the individual damage were calculated by the formulas:
The equivalent diameter was calculated as the circle diameter, the area of which is equal to that of damage:
where is the semi-major axis of the equivalent ellipse.
The major axis of the equivalent ellipse (Figure 6) runs through the object’s center of mass and has inclination relative to axis The orientation may vary within the range of and tends to increase in a clockwise manner since axis is oriented downwards.
5. Investigating the Influence of Lighting on the Recognition Result
When obtaining the surface image, an important factor that affects the result of defect recognition is the surface lighting. Therefore, it is important to understand how the quantitative parameters used to assess surface damage may change while changing lighting. Figure 7 shows the initial surface images of zone I (Figure 7a) and the damaged area recognized by the neural network (Figure 7b).
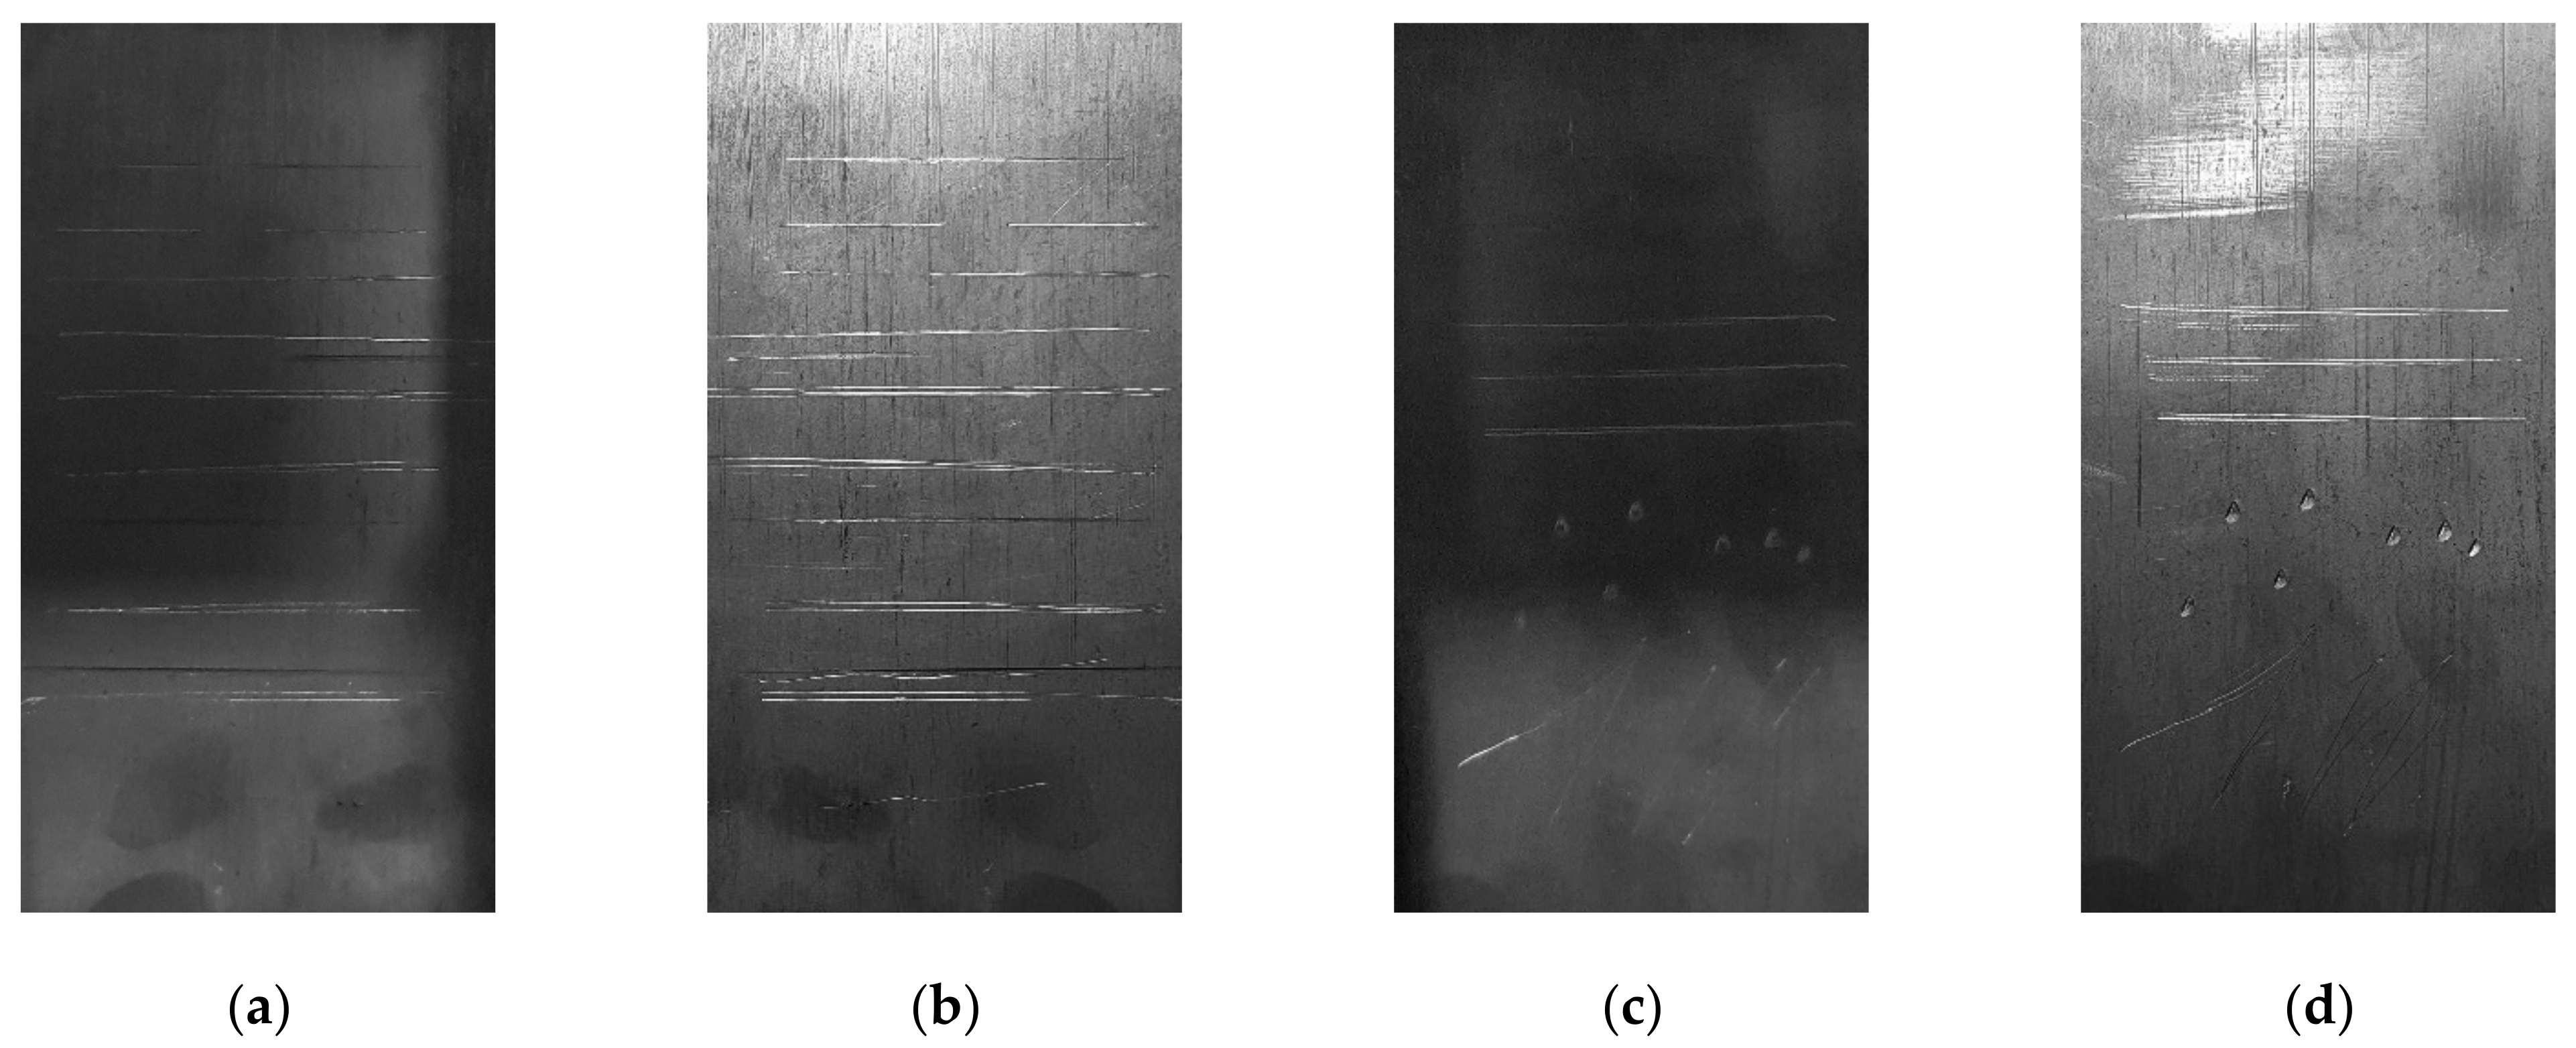
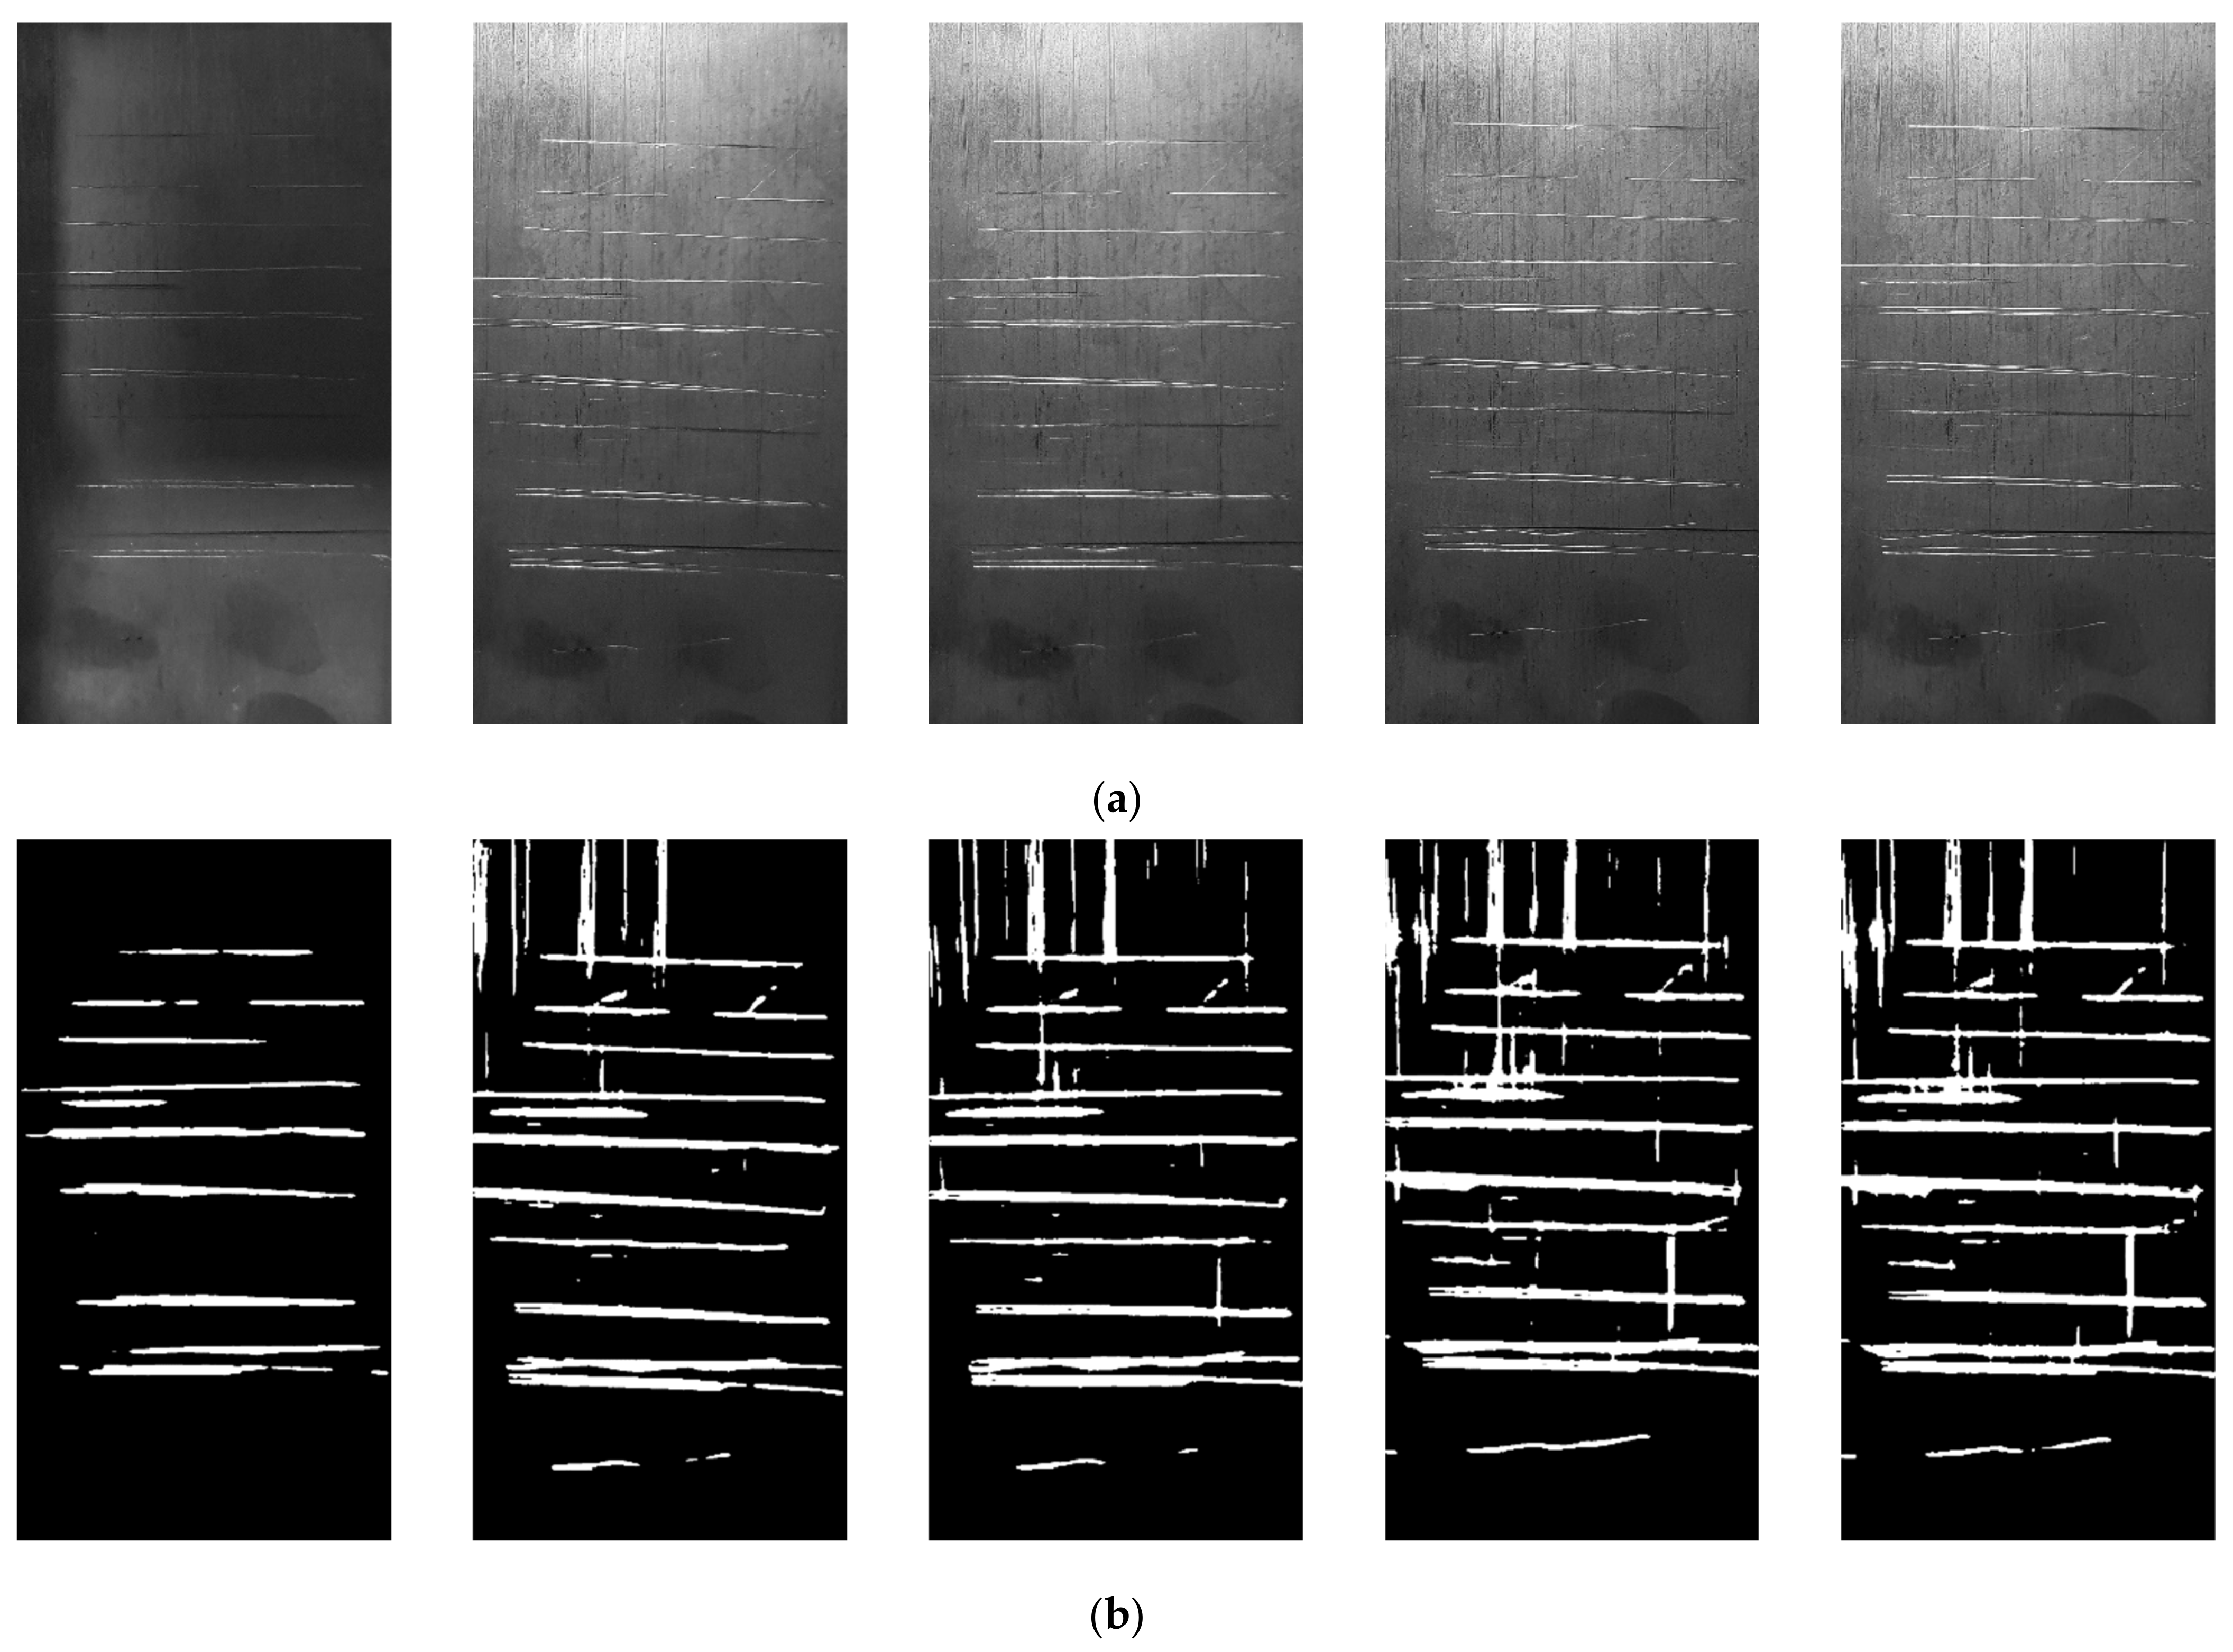
In general, with an increase in the surface lighting, the area of sections recognized as damage increases. The number of damaged fragments found also increases (Figure 7a and Figure 8a). This is primarily due to small scratches and surface texture elements that become better visible. In our case, the transition from a very low lighting level (2 lx) to a higher one (50 lx) is especially noticeable. In the former case, the vertical scratches in the image are not visible at all, while at 50 lx, most of them are already recognizable. A further increase in lighting to 800 lx does not practically contribute to detecting new scratches (except small ones), but the area of objects already recognized becomes larger upon visual observation.
However, the sensitivity of the neural network used to recognize damage is of special notice even at very low light levels: all of the most pronounced scratches are well recognized. Therefore, wherever it is necessary to identify the main, most pronounced damage, low light may be appropriate. At the same time, the noise level in the image caused by an increased level of detail with respect to surface formations, which may not represent damage, is much lower [21,22].
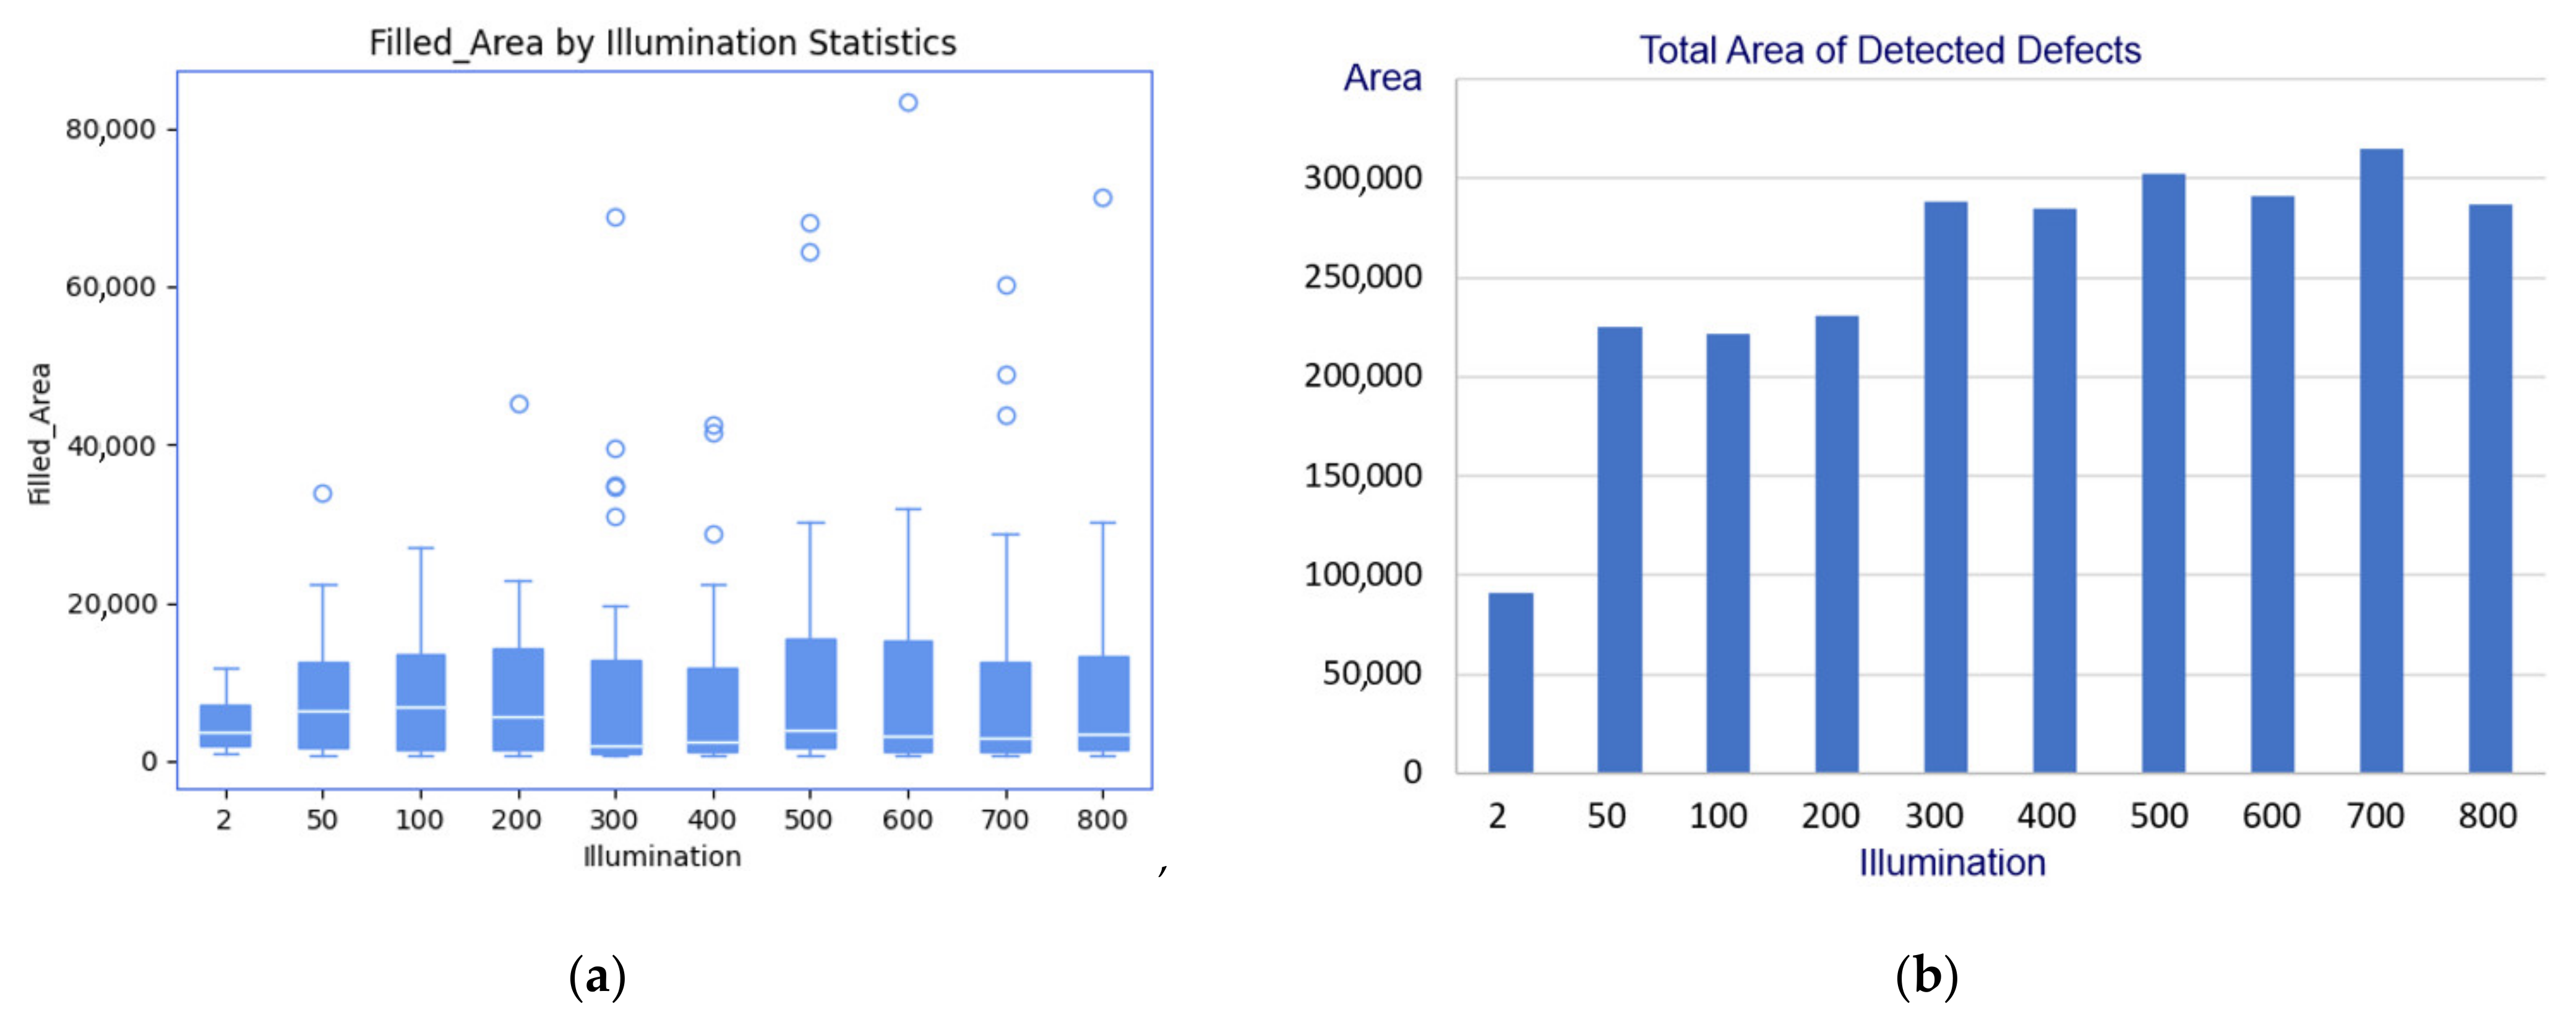
Figure 8 shows quantitative characteristics of the impact caused by the light level on the recognition level. The area distribution of individual fragments recognized is shown by box diagrams (Figure 8a). The main rectangles of the box diagrams contain 50% of the areas of fragments recognized within the interquartile range (where are the 75th and 25th percentiles, respectively). The analysis of the above box diagrams showed that most fragments have an area of up to 10 thousand pixels, while areas larger than 30 thousand pixels have only single fragments. The lines indicate values within ± 1.5 interquartile range, with the upper whisker’s length being limited to the maximum value from the sample that fell within its range; the lower whisker’s length is limited by the minimum value from the sample that fell into its length. Values exceeding are shown in the figure in circles, they are considered outliers.
Figure 8b shows the dependence of the total area of defects recognized on the light level. There are two jumps in the total area, which occur when increasing the light level to 50 lx and 300 lx, respectively. With the light level of 300 lx and higher, relative stabilization of the total area of damage recognized is noticeable.
The lowest scatter of the areas of defects recognized is observed at 2 lx. This corresponds to a situation where only the most pronounced horizontal damage is found in the image. At higher light levels, the scatter of areas is greater, which indicates the neural network’s ability to recognize both small defects and mergers of individual fragments or individual defects (for instance, horizontal and vertical bands).
The following conclusions can be drawn from the above diagrams:
- (1)
- A simultaneous increase in the number of fragments recognized, their average and total area with an increase in the light level to 50 lx indicates an enhanced ability of the neural network to detect defects and their fragments in general;
- (2)
- An increase in the light level to 300 lx entails an increase in the number of defects found and their total area, followed by a simultaneous decrease in the average area. This indicates the next stage of the neural network’s ability to detect new fragments with a small area. If we consider the total area of defects detected to be stable at light levels of 300 lx and above, this tendency will continue with light levels increased to 400 lx;
- (3)
- A decrease in the number of fragments recognized, followed by an increase in their average area at 500 lx, indicates “merging” of defects’ fragments or individual defects;
- (4)
- An increase in the light level up to 700 lx entails an increase in the number of fragments recognized, followed by a decrease in the average area with a virtually unchanged total area. This indicates small defects detected by the neural network, which could not be recognized at a lower light level;
- (5)
- An increase in the light level to 800 lx entails a slight decrease in the indicator values (Figure 8a,b), testifying to a decreased sensitivity of the neural network to defects and their fragments in general.
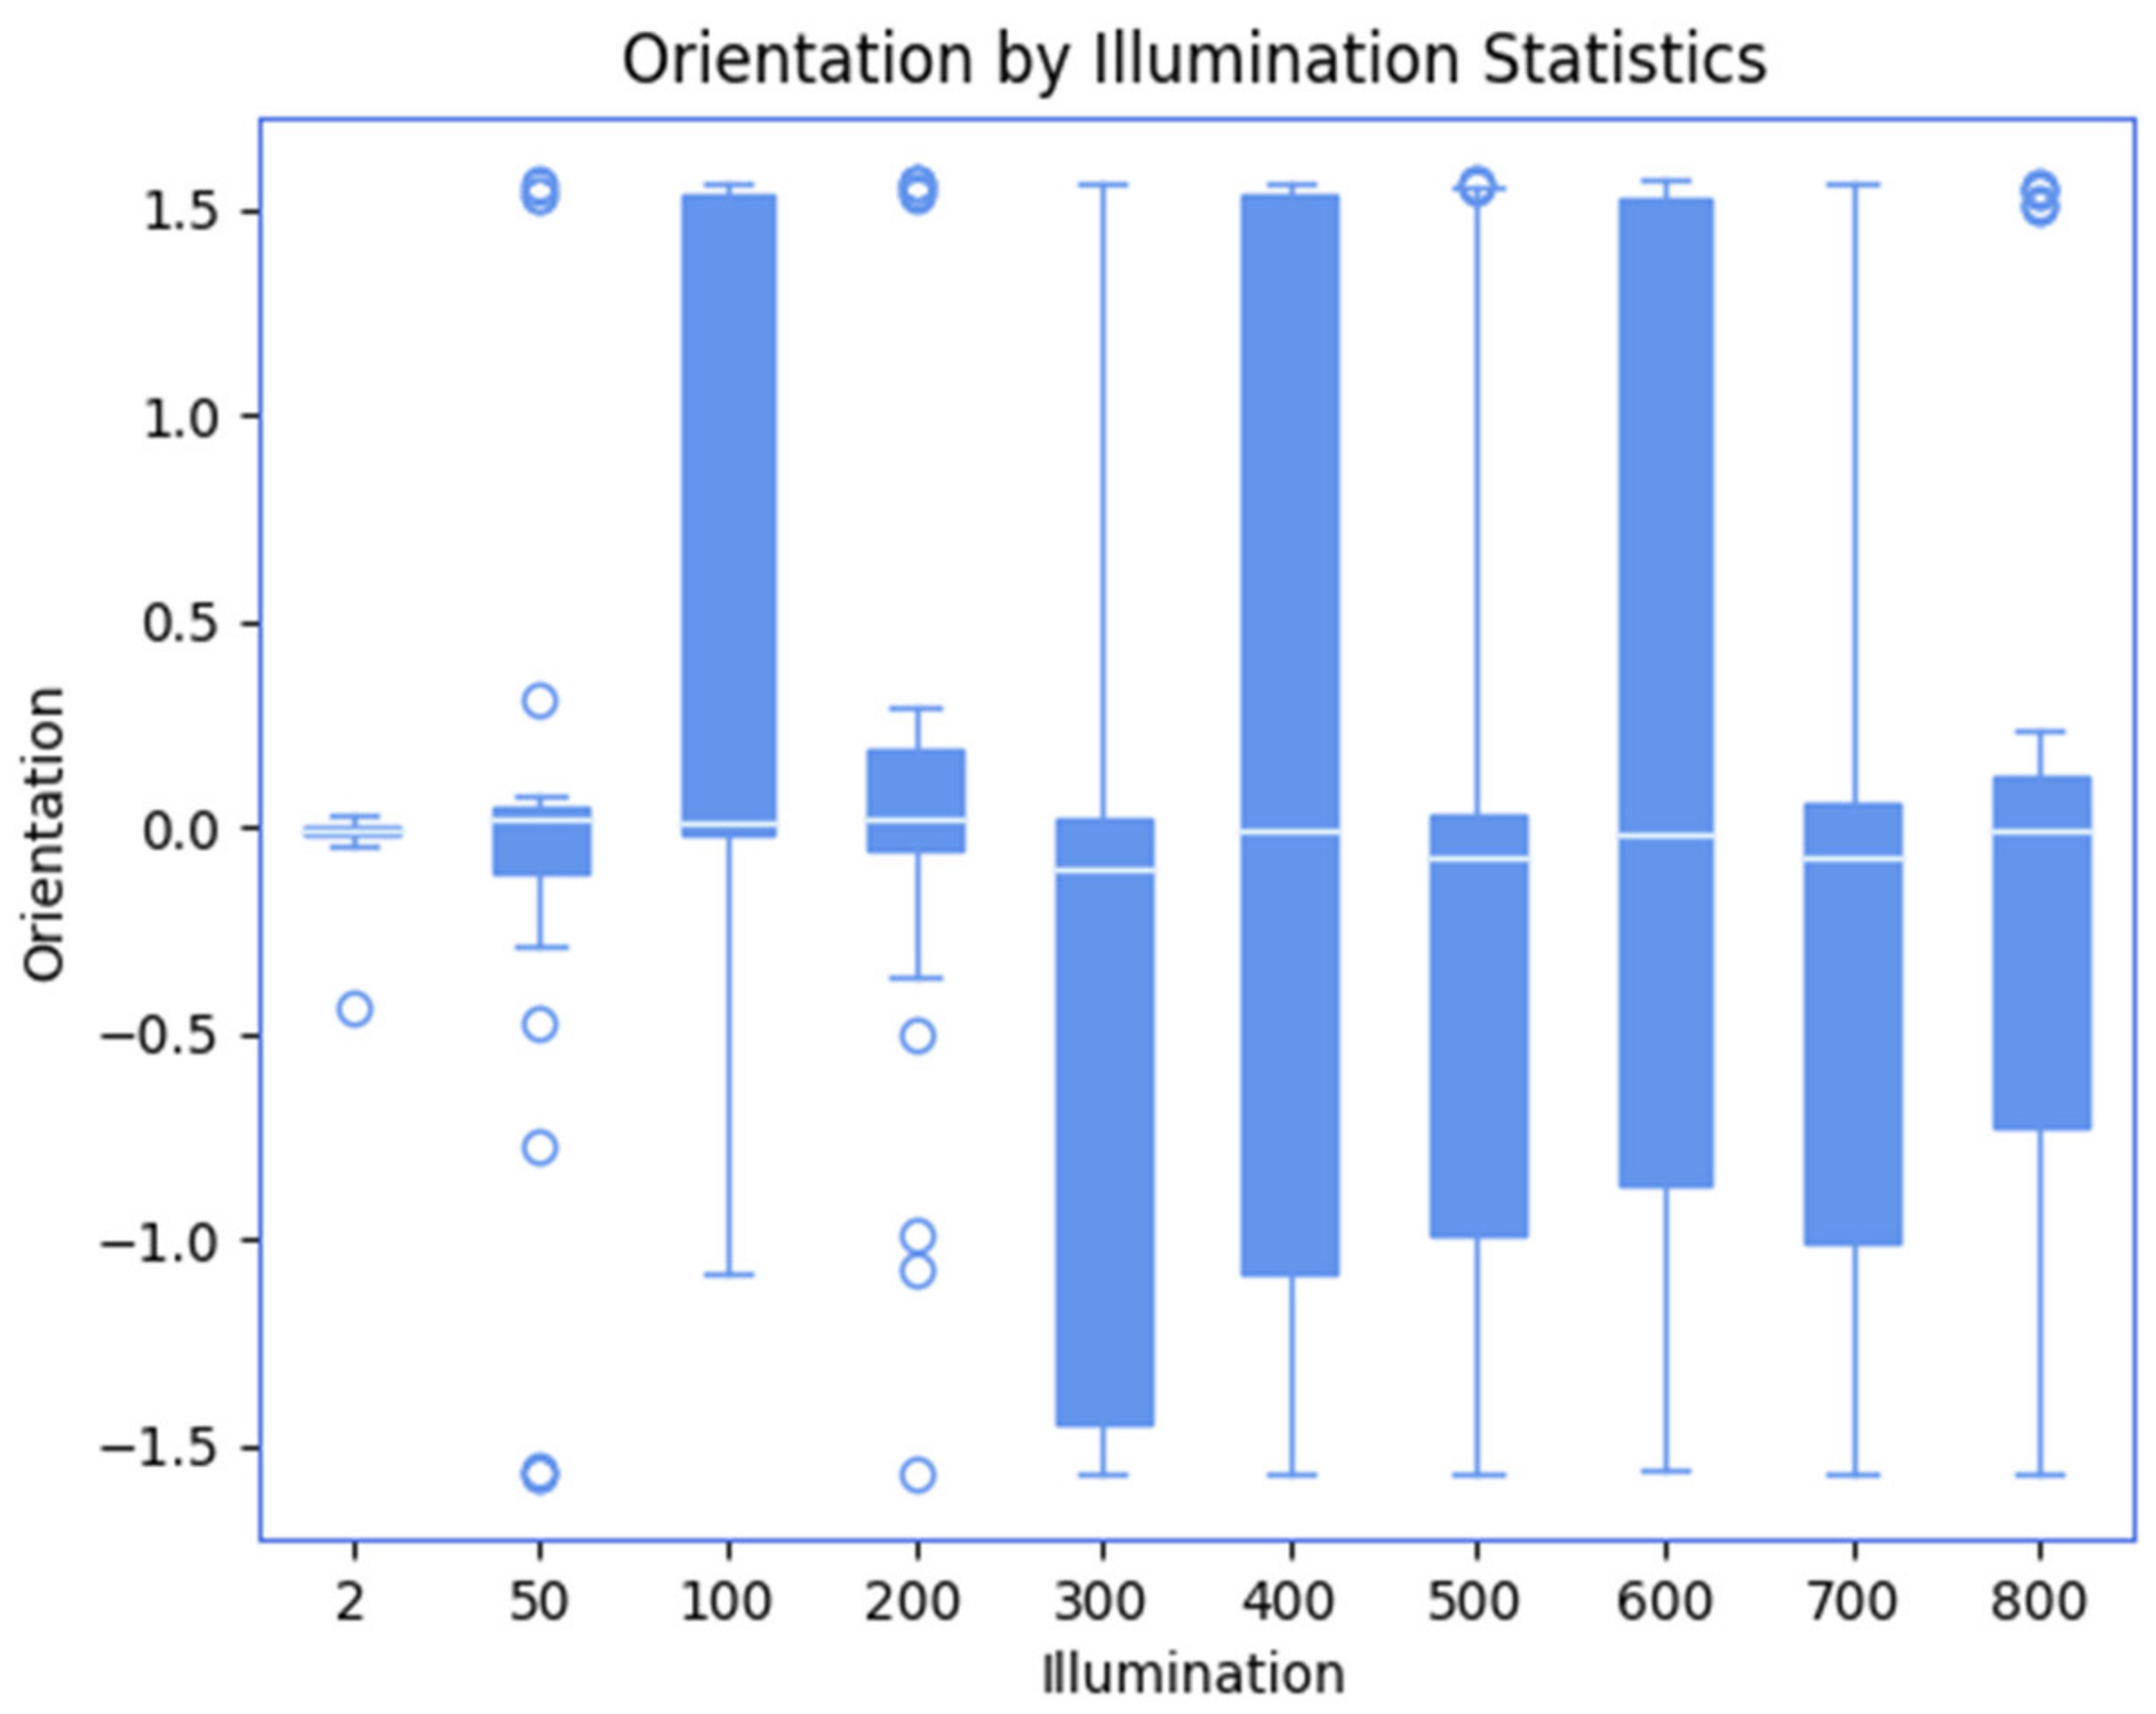
Distribution diagrams of the damage fragments’ orientation (Figure 9) indicate that at low light levels, all the fragments detected have an orientation of about 0 radians, which corresponds to the horizontal axis of the image. At higher light levels, the defect orientation range occupies almost the entire range, indicating the recognition of both horizontal and vertical bands, as well as defects of more complex shapes formed by the intersection of several linear defects of different orientations (T-shaped, L-shaped, etc.). However, regardless of the light level, the median is always around 0.
The comparison of the diagrams in Figure 8 and Figure 9 shows that when the lighting changes, the scatter of values for the parameter “area” is much smaller than the scatter of values of the parameter “orientation”. This means that the “area” parameter is much more stable and can therefore be used to assess the condition of the damaged surface. At the same time, the “orientation” parameter is less resistant to lighting change, so it may be additional when assessing the state of damage.
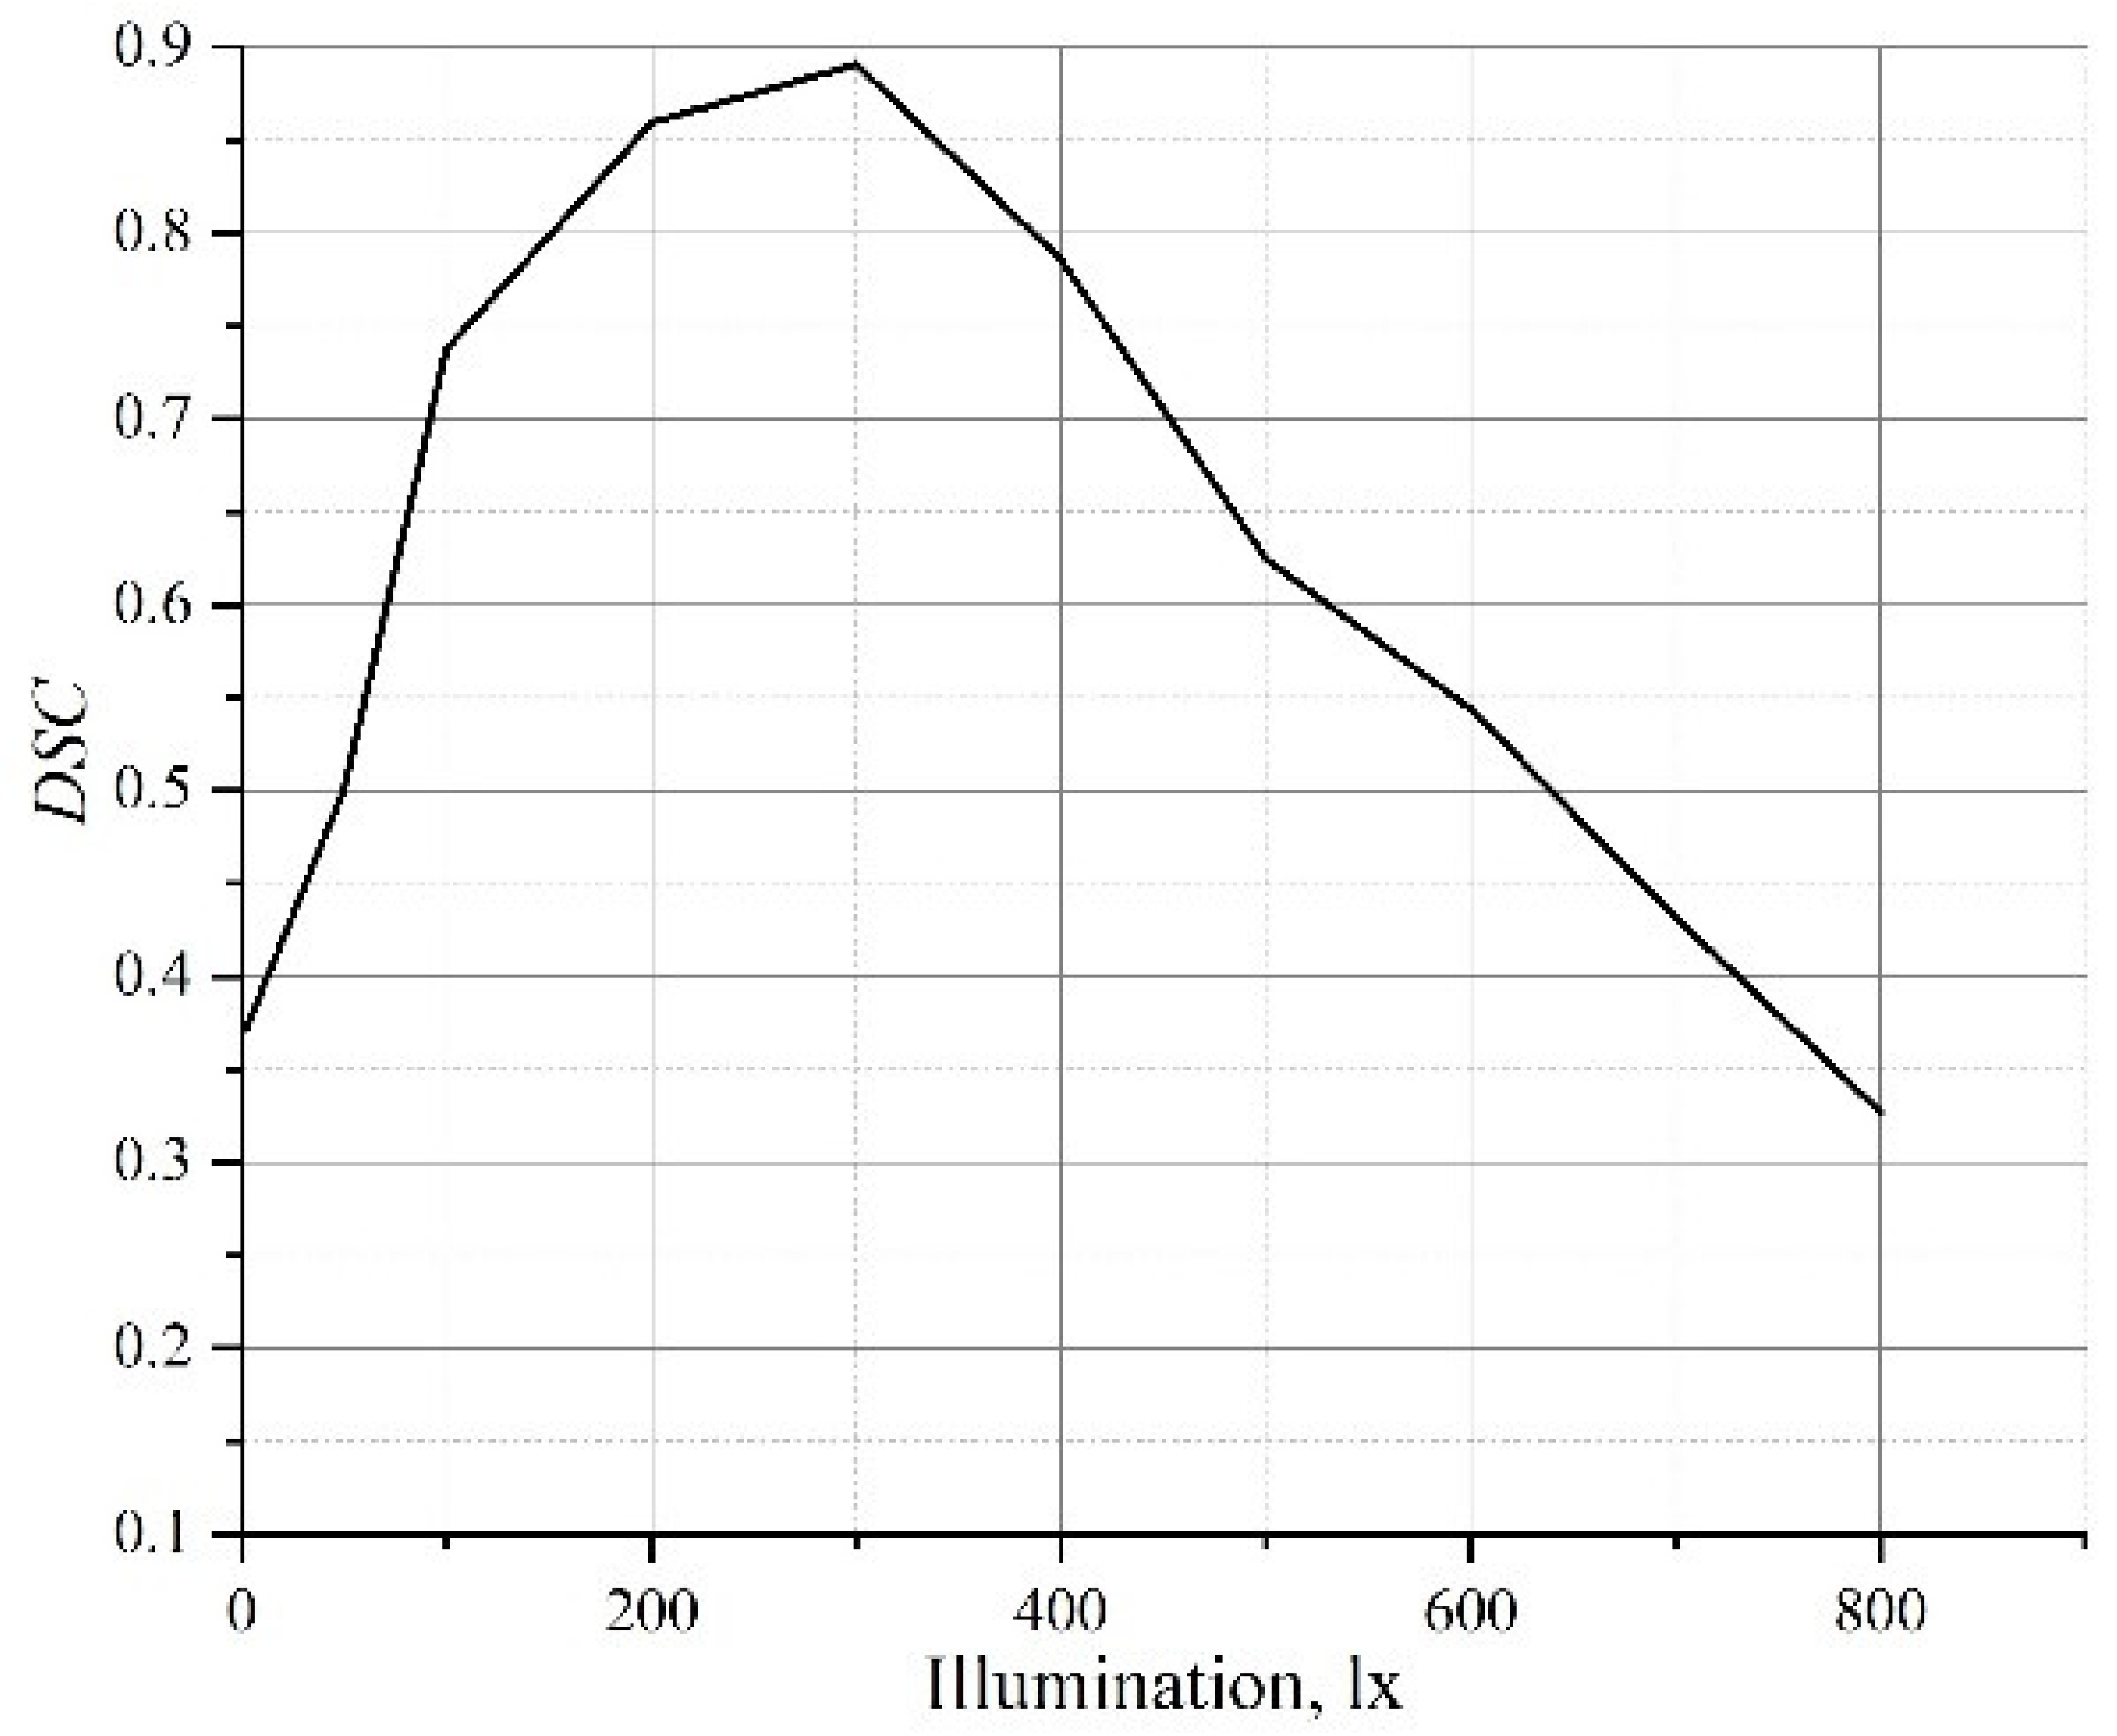
To assess the effect of lighting on the overall accuracy of defect recognition, the results were compared with the expert data, Figure 10. The Dice similarity coefficient (1) was used for evaluation. The DSC coefficient shows the degree to which the area of defects recognized overlaps the area of real defects. Figure 10 shows the dependence of the DSC defect-recognition metric on the light level. The best result was obtained at the light level of 300 lx. A lower DSC with lower light levels means that some defects are not recognized yet. Since objects become more visible, DSC declines at high light levels, resulting in wider fragments being recognized. In addition, more small false-positive fragments appear at high light levels. The dependence of the neural network’s ability to recognize surface defects on the light level in real-time is shown in Summary Table 1.
Thus, given the current statement of the problem, the process of surface defect recognition by the neural network at different light levels has a pronounced staged nature (Table 2).
6. Conclusions
The influence of the level of surface lighting on the quantitative indicators of defects recognized by the neural network is investigated. The area of sections recognized as defects was found to increase under enhanced surface lighting. The number of defect fragments recognized also increases. This is primarily due to small scratches and surface texture elements that become better visible. The high sensitivity of the neural network to defects has been confirmed even at very low light levels: all most pronounced scratches are well recognized. Therefore, in the case where it is necessary to detect only major damage, it is admissible to use even low light. At low lighting, the noise level caused by an increased detalization is much lower.
The recognition results were investigated at light levels of 2, 50, 100, 200, 300, 400, 500, 600, 700, and 800 lx. Two light levels, at which the total area of defects recognized increased, were found to be 50 and 300 lx. A transition from a very low lighting level to a higher one (50 lx) allows detecting a significant number of major and minor defects on the surface. At a light level of 300 lx, almost all defects are clearly visible and recognizable. At a higher light level, the total area of defects recognized becomes relatively stable upon visual observation. We found that the “area” parameter is much more stable to illuminance changes than “orientation”, and therefore, it can be used to assess the damaged surface. The “orientation” parameter is less resistant to lightning change, so it may be used as an additional parameter when assessing the state of damage.
To assess the effect of lighting on the overall accuracy of defect recognition, the results obtained were compared with the expert data. The best result with the Dice similarity coefficient was obtained at the light level of 300 lx. A lower DSC with lower light levels means that some defects are not recognized yet. A lower DSC with higher lighting means rising a count of the false-positive fragments.
Author Contributions
The research was conceptualized by I.K., P.M. and H.K.; the experiments were conducted by I.K. and P.M.; the simulations were performed by H.K. and J.B. (Jakub Brezina), and the results were analyzed and discussed by I.K., P.M., H.K., J.B. (Janette Brezinová), B.N. and Y.S. The manuscript was written and reviewed by I.K., P.M., H.K. and J.B. (Janette Brezinová). All authors have read and agreed to the published version of the manuscript.
Funding
This research was funded by the Scientific Grant Agency, “Application of progressive technologies in restoration of functional surfaces of products” (1/0497/20); the Cultural and Educational Grant Agency KEGA 036TUKE-4/2021 “Distance form of education in the field of engineering technologies using modern IT tools for foreign students“; and the Slovak Research and Development Agency APVV-20-0303 “Innovative approaches to the restoration of functional surfaces by laser weld overlaying”.
Institutional Review Board Statement
Not applicable.
Informed Consent Statement
Not applicable.
Data Availability Statement
The data presented in this study are available upon request from the corresponding author.
Acknowledgments
This contribution is the result of the project implementation: “Innovative approaches to the restoration of functional surfaces by laser weld overlaying” (APVV-20-0303), supported by the Slovak Research and Development Agency and supported by the Ministry of Education of Slovakia Foundation under grant projects VEGA No. 1/0497/20 “Application of progressive technologies in restoration of functional surfaces of products” and KEGA 036TUKE-4/2021 “Distance form of education in the field of engineering technologies using modern IT tools for foreign students”. This support is highly appreciated by the authors.
Conflicts of Interest
The authors declare no conflict of interest.
References
- Neogi, N.; Mohanta, D.K.; Dutta, P.K. Review of vision-based steel surface inspection systems. EURASIP J. Image Video Process. 2014, 1, 50. [Google Scholar] [CrossRef] [Green Version]
- Yun, J.P.; Shin, W.C.; Koo, G.; Kim, M.S.; Lee, C.; Lee, S.J. Automated defect inspection system for metal surfaces based on deep learning and data augmentation. J. Manuf. Syst. 2020, 55, 317–324. [Google Scholar] [CrossRef]
- Guan, S.; Chang, J.; Shi, H.; Xiao, X.; Li, Z.; Wang, X.; Wang, X. Strip steel defect classification using the improved GAN and EfficientNet. Appl. Artif. Intell. 2021, 1–18. [Google Scholar] [CrossRef]
- Papavasileiou, A.; Aivaliotis, P.; Aivaliotis, S.; Makris, S. An optical system for identifying and classifying defects of metal parts. Int. J. Comput. Integr. Manuf. 2021, 35, 326–340. [Google Scholar] [CrossRef]
- Zhang, J.; Li, S.; Yan, Y.; Ni, Z.; Ni, H. Surface defect classification of steel strip with few samples based on dual-stream neural network. Steel Res. Int. 2021, 2100554. [Google Scholar] [CrossRef]
- Chu, M.; Gong, R.; Gao, S.; Zhao, J. Steel surface defects recognition based on multi-type statistical features and enhanced twin support vector machine. Chemom. Intell. Lab. Syst. 2017, 171, 140–150. [Google Scholar] [CrossRef]
- Jeon, Y.-J.; Choi, D.-C.; Lee, S.J.; Yun, J.P.; Kim, S.W. Steel-surface defect detection using a switching-lighting scheme. Appl. Opt. 2016, 55, 47–57. [Google Scholar] [CrossRef] [PubMed]
- Zhao, Y.J.; Yan, Y.H.; Song, K.C. Vision-based automatic detection of steel surface defects in the cold rolling process: Considering the influence of industrial liquids and surface textures. Int. J. Adv. Manuf. Technol. 2017, 90, 1665–1678. [Google Scholar] [CrossRef]
- Wang, D.; Xu, Y.; Duan, B.; Wang, Y.; Song, M.; Yu, H.; Liu, H. Intelligent recognition model of hot rolling strip edge defects based on deep learning. Metals 2021, 11, 223. [Google Scholar] [CrossRef]
- Konovalenko, I.; Maruschak, P.; Brezinová, J.; Viňáš, J.; Brezina, J. Steel surface defect classification using deep residual neural network. Metals 2020, 10, 846. [Google Scholar] [CrossRef]
- Konovalenko, I.; Maruschak, P.; Brevus, V.; Prentkovskis, O. Recognition of scratches and abrasions on metal surfaces using a classifier based on a convolutional neural network. Metals 2021, 11, 549. [Google Scholar] [CrossRef]
- Pernkopf, F.; O’Leary, P. Image acquisition techniques for automatic visual inspection of metallic surfaces. NDT E Int. 2003, 36, 609–617. [Google Scholar] [CrossRef]
- Feng, X.; Gao, X.; Luo, L. An improved vision transformer-based method for classifying surface defects in hot-rolled strip steel. J. Phys. Conf. Ser. 2021, 2082, 012016. [Google Scholar] [CrossRef]
- Mentouri, Z.; Moussaoui, A.; Boudjehem, D.; Doghmane, H. Steel Strip surface defect identification using multiresolution binarized image features. J. Fail. Anal. Prev. 2020, 20, 1917–1927. [Google Scholar] [CrossRef]
- Qiu, K.; Tian, L.; Wang, P. An effective framework of automated visual surface defect detection for metal parts. IEEE Sens. J. 2021, 21, 20412–20420. [Google Scholar] [CrossRef]
- Litvintseva, A.; Evstafev, O.; Shavetov, S. Real-time steel surface defect recognition based on CNN. In Proceedings of the 2021 IEEE 17th International Conference on Automation Science and Engineering (CASE), Lyon, France, 23–27 August 2021; pp. 1118–1123. [Google Scholar]
- Federal Agency for Technical Regulation and Metrology. GOST R 58399-2019, Non-Destructive Testing. Optical Methods. General Requirements; Federal Agency for Technical Regulation and Metrology: Moscow, Russia, 2019; p. 15. Available online: https://www.russiangost.com/p-373948-gost-r-58399-2019.aspx (accessed on 21 January 2022).
- Zhou, A.; Ai, B.; Qu, P.; Shao, W. Defect detection for highly reflective rotary surfaces: An overview. Meas. Sci. Technol. 2021, 32, 062001. [Google Scholar] [CrossRef]
- Jeon, Y.-J.; Choi, D.-C.; Yun, J.P.; Park, C.; Kim, S.W. Detection of scratch defects on slab surface. In Proceedings of the 2011 11th International Conference on Control, Automation and Systems, Gyeonggi-do, Korea, 26–29 October 2011; IEEE: Piscataway, NJ, USA, 2011; pp. 1274–1278. [Google Scholar]
- Bulnes, F.G.; Usamentiaga, R.; García, D.F.; Molleda, J. Vision-Based Sensor for Early Detection of Periodical Defects in Web Materials. Sensors 2012, 12, 10788–10809. [Google Scholar] [CrossRef] [PubMed]
- Konovalenko, I.; Hutsaylyuk, V.; Maruschak, P. Classification of surface defects of rolled metal using deep neural network ResNet50. In Proceedings of the 13th International Conference on Intelligent Technologies in Logistics and Mechatronics Systems, Panevezys, Lithuania, 1 October 2020; pp. 41–48. [Google Scholar]
- Konovalenko, I.; Maruschak, P.; Kozbur, H.; Brezinová, J.; Brezina, J.; Guzanová, A. Defectoscopic and geometric features of defects that occur in sheet metal and their description based on statistical analysis. Metals 2021, 11, 1851. [Google Scholar] [CrossRef]
Figure 1.
The scheme of obtaining images in areas of the metal strip (I–IV) with damage: 1—lamp; 2—camera; 3—metal strip with damage; L is a light meter.
Figure 1.
The scheme of obtaining images in areas of the metal strip (I–IV) with damage: 1—lamp; 2—camera; 3—metal strip with damage; L is a light meter.

Figure 2.
Images of damage in zones I (a,b) and II (c,d) at two light levels: 2 lx (a,c) and 600 lx (b,d).
Figure 2.
Images of damage in zones I (a,b) and II (c,d) at two light levels: 2 lx (a,c) and 600 lx (b,d).

Figure 3.
General architecture of the U-net-based segmentation model.

Figure 4.
The general sequence of operations in the recognition of defects using the neural network in the image of any shape.
Figure 4.
The general sequence of operations in the recognition of defects using the neural network in the image of any shape.

Figure 5.
Initial (a), recognized and synthesized (b), and binary (c) surface image at 50 lx.

Figure 6.
Defect, equivalent ellipse, and its parameters.

Figure 7.
Initial images of zone I (a) and images detected on them (b) at light levels of 2, 50, 100, 500, and 800 lx, respectively.
Figure 7.
Initial images of zone I (a) and images detected on them (b) at light levels of 2, 50, 100, 500, and 800 lx, respectively.

Figure 8.
Diagram of damage fragments area distribution (a) and their total area (b) at various lighting; circles—values exceeding 1.5∙IQR.
Figure 8.
Diagram of damage fragments area distribution (a) and their total area (b) at various lighting; circles—values exceeding 1.5∙IQR.

Figure 9.
Orientation distribution diagram at different light levels; circles—outliers (values whose absolute values exceed 1.5∙IQR).
Figure 9.
Orientation distribution diagram at different light levels; circles—outliers (values whose absolute values exceed 1.5∙IQR).

Figure 10.
Dependence of the DSC coefficient on lighting.


Table 1.
Summary of quantitative indicators of defect recognition in real-time.
| Indicator | Illumination Level, lx | |||||
|---|---|---|---|---|---|---|
| (2; 50) | (50; 200) | (200; 400) | (400; 500) | (500; 700) | (700; 800) | |
| Number of recognized fragments |  | stabilizes |  |  |  |  |
| Average area |  | stabilizes |  |  |  | stabilizes |
| Total area |  | stabilizes |  | stabilizes | stabilizes |  |
| Orientation | about 0 radians | acquires all possible meanings | ||||
Table 2.
Surface defect recognition stages by the neural network.
| Threshold Values of Light Levels | Stage Description |
|---|---|
| ≤200 lx | Major, most visible defects or their fragments are recognized. |
| 300 lx | Major, most visible defects or their fragments of different orientation are recognized, as well as most minor defects. |
| 400 lx | Major, most visible defects or their fragments are recognized, as well as practically all minor defects. |
| ≥500 lx | Defects of complex geometry formed by merging of several defects of linear shape are recognized. There is a slight decrease in the neural network’s ability to recognize defects. |
Publisher’s Note: MDPI stays neutral with regard to jurisdictional claims in published maps and institutional affiliations. |
© 2022 by the authors. Licensee MDPI, Basel, Switzerland. This article is an open access article distributed under the terms and conditions of the Creative Commons Attribution (CC BY) license (https://creativecommons.org/licenses/by/4.0/).
Share and Cite
MDPI and ACS Style
Konovalenko, I.; Maruschak, P.; Kozbur, H.; Brezinová, J.; Brezina, J.; Nazarevich, B.; Shkira, Y. Influence of Uneven Lighting on Quantitative Indicators of Surface Defects. Machines 2022, 10, 194. https://doi.org/10.3390/machines10030194
AMA Style
Konovalenko I, Maruschak P, Kozbur H, Brezinová J, Brezina J, Nazarevich B, Shkira Y. Influence of Uneven Lighting on Quantitative Indicators of Surface Defects. Machines. 2022; 10(3):194. https://doi.org/10.3390/machines10030194
Chicago/Turabian StyleKonovalenko, Ihor, Pavlo Maruschak, Halyna Kozbur, Janette Brezinová, Jakub Brezina, Bohdan Nazarevich, and Yaroslav Shkira. 2022. "Influence of Uneven Lighting on Quantitative Indicators of Surface Defects" Machines 10, no. 3: 194. https://doi.org/10.3390/machines10030194
Note that from the first issue of 2016, this journal uses article numbers instead of page numbers. See further details here.