
A Method for Measurement of Workpiece form Deviations Based on Machine Vision


1
School of Mechanical Engineering, Shandong University of Technology, Zibo 255000, China
2
School of Mechanical Engineering, University of Shanghai for Science and Technology, Shanghai 200093, China
*
Author to whom correspondence should be addressed.
Machines 2022, 10(8), 718; https://doi.org/10.3390/machines10080718
Submission received: 17 July 2022
/
Revised: 3 August 2022
/
Accepted: 5 August 2022
/
Published: 22 August 2022
(This article belongs to the Special Issue Industrial Process Improvement by Automation and Robotics)
Abstract
:Machine vision has been studied for measurements of workpiece form deviations due to its ease of automation. However, the measurement accuracy limits its wide implementation in industrial applications. In this study, a method based on machine vision for measurement of straightness, roundness, and cylindricity of a workpiece is presented. A subsumed line search algorithm and an improved particle swarm optimization algorithm are proposed to evaluate the straightness and roundness deviations of the workpiece. Moreover, an image evaluation method of cylindricity deviation by the least-square fitting of the circle’s center coordinates is investigated. An image acquisition system incorporating image correction and sub-pixel edge positioning technology is developed. The performance of the developed system is evaluated against the measurement results of the standard cylindricity measuring instrument. The differences in the measurement of straightness, roundness, and cylindricity are −4.69 μm, 3.87 μm, and 8.51 μm, respectively. The proposed method would provide a viable industrial solution for the measurement of workpiece form deviations.
1. Introduction
Shafts are one of the most important machinery parts for a wide range of industrial applications. Geometric deviations of a shaft will affect its functional performance. Conventionally, manual inspection and measurement are usually conducted for the measurement of straightness and roundness, which has the disadvantage of larger errors and lower efficiency [1]. Machine vision technology has been employed to measure industrial parts of different sizes with high efficiency and accuracy, which is widely used in automatic measuring [2,3,4]. Many researchers have conducted research on measurements based on machine vision technology. Lu et al. [5] developed a straightness measurement system based on the combination of a laser and machine vision, where multiple groups of vision sensors were adopted to realize on-line detection of seamless steel pipe straightness. Cho et al. [6] explored a new method of support vector regression to detect roundness to improve the accuracy and speed of the fitting algorithm, and it was proved to be more robust to noises, including measurement deviations for the tested problems. Liu et al. [7] proposed a binocular-vision-based deviation detection system and an identification algorithm to achieve deviation detection with three-dimensional measurement capability and to simplify the complex error identification formulations of position-independent geometric deviations in the rotary axis. Xiao et al. [1] proposed an on-line dimensional accuracy measurement method by machine vision, where three surface sources were placed in the positions of left, middle, and right to ensure uniform illumination, which realized the real-time measurement of the straightness and roundness on the conical spun workpiece. Tan et al. [8] studied the measurement of shaft diameter with the structured light system composed of a laser linear light source and a camera. The test results show that when the shaft diameter was 36.162 mm, the speed was 1250 r/min, and the maximum average measurement deviation was 0.019 mm. Li. [9] developed a geometric measurement system for shaft parts by machine vision, and an improved single-pixel edge detection method was proposed by the Canny detection algorithm. The experimental results show that the repeatability deviation of the system was less than 0.01 mm. Luo et al. [10] proposed an improved differential evolution algorithm (IoCoDE) for the accurate evaluation of minimum zone axis straightness deviation. The results indicate that the evaluation accuracy of IoCoDE was better than linking ends, the least-square method (LSM), and other common evaluation algorithms, and it was basically around 1 s. Hao et al. [11] suggested a coded references and geometric-constraints-based method to solve the inconsistency problem of measurement range and accuracy for slender shafts. The systematic deviation of the experimental system was 0.01754 mm. Min et al. [12] measured the high-precision geometric deviation of thread with machine vision and optical enlargement. The geometric deviations of thread were calculated by using the thread cross-sectional image. The linear precision of this system was less than 10μm. Chai et al. [13] proposed a non-contact optical measurement scheme to measure the co-axiality of a composite gear shaft; the least-square circle (LSC) and the particle swarm optimization (PSO) were used, and the measurement deviation range was less than 0.065 mm.
In the literature mentioned above, the machine vision measurement is more precise and efficient as compared with the traditional measurements. However, there is a lack of standard vision detection instrument for form deviations measurement in industry. Therefore, the structure of vision measurement and related algorithms need to be further studied.
In this study, a new method is presented for measuring the form accuracy of a shaft workpiece. In order to obtain images of the shaft, an image acquisition system is designed. The image pre-processing method and form deviations evaluation algorithm are studied. By integrating the computer control and calculation algorithm, form deviations, such as straightness, roundness, and cylindricity deviation of the shaft part, are calculated automatically and efficiently.
2. Image Acquisition System and Camera Calibration
2.1. Composition of the Image Acquisition System
The composition of the form deviation measurement system is depicted in Figure 1 and Figure 2. It is mainly composed of the X, Y, Z linear electrokinetic displacement platform, rotating electric platform, CMOS camera, optical lens, LED light source, three-jaw chuck, tailstock, motion control card, and computer. Information on the main hardware models of the system is provided in Table 1. The parameters of the motion stages are listed in Table 2.
2.2. Camera Calibration
In the process of two-dimensional images, there is nonlinear deformation in different degrees, which is usually called geometric distortion. In addition, there are other factors, such as the instability of the camera imaging process and the quantization deviation caused by the low image resolution. Thus, there is a complex nonlinear relationship between the object points in the image and the corresponding points in the World Coordinate System. Because of the existence of these distortions, the calibration coefficients of different image zones even in one direction are different [14,15].
Figure 3 shows the relationship between the camera coordinate system and the World Coordinate System. Let p be a point in the field of camera view. The homogeneous coordinates of point p in the camera coordinate system and the World Coordinate System are (XC, YC, ZC, 1) and (XW, YW, ZW, 1), respectively. The homogeneous transformation relationship between the World Coordinate System and pixel image coordinate system is as follows:
where R is a 3 × 3 rotation matrix, t is a 3 × 1 translation matrix, M1 is the inner camera parameter matrix, M2 is the outer camera parameter matrix, fu and fv are the equivalent focal lengths in x and y directions, (u0, v0) represents the coordinate of the main point on the camera. The space point p in the camera coordinate system is set as p(XC, YC, ZC). Suppose that the projected coordinates of point p normalized are p(xn, yn), and the projected coordinates of point p after adding distortion are p(xd, yd) [16]; then, the relationship is as follows:
where k1, k2 are radial distortion coefficients.
In order to make vision measurement more accurate, the ceramic calibration board with 1 μm possession precision is selected in this experiment. The sum of the calibration grid is 20 × 16, and the side lengths are 4 mm. The process for camera calibration includes, firstly, the collection of a calibration board image under the same condition on the form deviation measurement, such as focal length, object distance, lighting strength, and then, the collection of nine different orientation board images. The flow chart for camera calibration is shown in Figure 4.
3. Main Algorithms
3.1. Image Correction
Due to deviations of camera installation and equipment assembly, the acquired part image may have a small tilt angle. When evaluating form deviations, it is necessary to obtain the element line coordinates in 360 measuring images, whose coordinate results are affected by the small tilt angle. This increases the detection deviation and detection complexity. In order to improve the detection accuracy and efficiency, it is necessary to rectify the measured part images. We propose an image correction algorithm based on the centerline slope. Firstly, the distorted image is eliminated by camera calibration data, and then, the coordinates of the top and bottom edges on the workpiece image are obtained by the Canny algorithm [17]. The average data are computed as a centerline by the corresponding addition algorithm. The slope of the centerline is obtained by the least-square fitting, by which the rotation angle θ is obtained. Finally, the measured part image is revised by θ. Suppose that the point P0(x0, y0) rotated anticlockwise by θ is P0(x, y), the coordinate point matrix expression after rotation is as follows:
3.2. Sub-Pixel Edge Detection Algorithm
The conventional sub-pixel edge detection methods include: sub-pixel edge detection by moment, sub-pixel edge detection by fitting, sub-pixel edge detection by interpolation, etc. [18,19]. The measured workpiece in this experiment is an axis, so it is assumed there will be no burrs, roughness, etc., in the edge area of the image. The top and bottom edges of the sampling image are in accordance with the image characteristics of a polynomial function. In order to realize the sub-pixel edge position, the parameters describing the edge features in the image can be obtained by establishing equations of polynomial parameters and using the principle of the least-square method [20,21].
The method used is to filter and denoise gray images and use the Otsu method to complete threshold segmentation [22]. The Canny algorithm is used to obtain the rough edges of the part image, selecting rough edges in order to turn them into a single row. An appropriate zoom is chosen, and then, the fine edges are accurately obtained by using the polynomial fitting algorithm. The edge point formula fitted by polynomial y(x) can be expressed as Equation (5):
By calculating the quadratic sum of the least squares and making partial derivatives of am equal to 0, the result is obtained.
By solving the above equations, the fitting polynomial coefficients can be determined.
3.3. Calculation of Straightness Deviation
3.3.1. Axis of workpiece fitting
By extracting the middle line on the top pixel edges and the corresponding bottom pixel edges of a workpiece image as the central axis, the calculation is rendered simple and easy. However, if the workpiece in the image has a tilted angle or straightness deviation, the upper and the corresponding lower edge pixel edges are asymmetric, which leads to a large straightness deviation of the central axis. In order to reduce this deviation, the radial local zone search method is used to determine the position of the shaft axis.
In order to determine the coordinates of the top and bottom edges, the top edge point (xj, yj) closest to the bottom edge point (xi, yi) is shown in Figure 5.
The geometric center coordinates of the workpiece axis are as follows.
To decrease computing time, extract each n point on the left and right of the bottom edges corresponding relatively to the abscission of the top edge point, which is a total of 2n points. According to Equations (8) and (9), the geometric coordinates of a workpiece axis are obtained. Then, the axis of the part is estimated.
3.3.2. Straightness deviation algorithm
The straightness deviation according to ISO 1101 is the difference between the largest and smallest distances between the workpiece line and the reference line. According to ISO 1101, the form tolerance zone has the direction of the minimum [23,24]. The minimum zone method [25] is needed to search for the minimum value of the distance between two parallel lines containing the measured contours according to the minimum condition principle. So, an enveloped line searching algorithm is proposed to obtain the straightness deviation. The algorithm is discussed below.
The least-square method is used to obtain the baseline L1, as shown in Figure 6, and the linear equation is set as
Regarding baseline L2 as the boundary, all sampling points are divided into two category points, i.e., high points and low points, from which the farthest point P1 is found. Serving P1 as the base point, a line L2 is generated with the slope k1. By changing the slope of line L2, the sampling points are located below or on the line, and the critical point P2 is determined.
where a is the minimum value. Calculate the corresponding intercept based on ki using the expression below.
In order to calculate P2, let
All coordinates of the measured points, except P1, are substituted into Equation (13), and the sampling points are calculated when ki varies. In theory, when W is zero, P2 is obtained. However, in an actual situation, by setting small step size a, P2 appears between two scanning lines. In this case, the following requirement should be met:
The enveloped line y = ki x + m1 is confirmed by two points, P1 and P2, and then, the minimum enveloped line y = ki x + m2 is parallel to the line through the farthest point P3. At this point, the three points, P1, P2, and P3, are satisfied with the ‘high-low-high’ rule criterion of the minimum zone. The straightness deviation is calculated by the distance between the two enveloped lines.
In the same way, search for the bottom line and three points of the ‘low-high-low’ criterion to satisfy the minimum zone. The distance of a pair of enveloped lines is also obtained after calculation, according to the similar steps above. The minimum distance value of the two results obtained will be used as the straightness deviation.
3.4. Calculation of Roundness Deviation
3.4.1. Three-Dimensional Reconstruction by Monocular Camera
The workpiece three-dimensional coordinate system xoyz is seen in Figure 7. Let the initial position angle be 0°; the point coordinates on the workpiece contour surface collected by the camera are (x1, y1, z1), and the rotating β point A on the workpiece is moved to point B, whose coordinate is (x2, y2, z2). According to the geometric relationship, as shown in Figure 7 and Figure 8, the relationship is as follows:
Among them, AO is distance between point A and the workpiece axis. The workpiece contour information is collected by the camera through the workpiece rotation, and the 3D contour model of the workpiece surface is established by the camera.
Due to the installation eccentricity of the workpiece, the circle center of a certain section workpiece is changed. In order to eliminate the eccentricity deviation, the half distance between the top and bottom edge is used as a radius value, that is, AO = |y1′−y1|/2, so the radius of the corresponding positions under other rotation angles can be obtained. The radius under every x position can be determined on the corresponding circle, so as to realize the three-dimensional reconstruction of the workpiece contour.
3.4.2. Roundness Deviation Algorithm
The roundness deviation according to ISO 1101 is the difference between the largest and smallest radial distance of the workpiece circumference from the reference circle [23,24]. There are four commonly used methods for evaluating roundness deviation, which are the minimum zone circle method, the minimum circumscribed circle method, the maximum inner circumscribed circle method, and the least-square circle method [26,27]. The minimum zone method is an evaluation method in accordance with the definition, but it is difficult to solve directly because it is a nonlinear problem, and it is complicated to calculate the collected data [28].
As shown in Figure 9, assuming that (xi, yi) are the measured coordinates on the actual contour of the workpiece, and (xk, yk) are the center coordinates of the minimum zone method to be solved, then the distance Hik from the measured point to the center is
The objective function F to be optimized is
What needs to be solved is how to determine the value of (xk, yk), so that F is the minimum. When F = f, f is the roundness deviation.
Particle swarm optimization (PSO) is an intelligent optimization algorithm proposed by Kennedy and Eberhart in 1995, inspired by the movement of flock birds [29]. In this paper, the PSO algorithm of synchronously changing learning factors is used to solve roundness. This algorithm has clear advantages in optimization accuracy and convergence speed.
The synchronous learning factor refers to setting the range of learning factors c1 and c2 as [cmin, cmax], and the value formula of the learning factor in the t-th iteration is as follows:
The algorithm flow chart is shown in Figure 10 as follows.
3.4.3. Cylindricity Deviation Algorithm
The cylindricity deviation according to ISO 1101 is the difference between the largest and smallest radial distances of the workpiece surface from the reference [23,24]. According to the form deviation evaluation principle, when the actual cylindrical surface is compared with the ideal surface, the minimum enveloped zone should be determined according to the actual cylindrical surface. When the actual surface is tightly contained by two identical co-axial cylindrical surfaces, between which the radius difference is the minimum, it is the minimum enveloped zone.
In this paper, a method of spatial cylindricity deviation detection is proposed based on the PSO and the least-square algorithm. Suppose that the circle center coordinate of each cross-section in Figure 11 is obtained by the improved particle swarm algorithm. According to the circle center coordinates, the space axis is fitted by the least-square algorithm. Assume that E1 and E2 are the points with the largest and smallest distances, respectively, from the measured contour points on the fitted straight line. The cylindricity deviation d2 can be expressed as the difference between the maximum distance and the minimum distance from the measured contour points to the spatial axis.
4. Experiment and Results Analysis
4.1. Calibration Results
Camera calibration is performed before image collection. A total of nine images are collected, as shown in Figure 12, for calibration. The corner detection result of the calibration plate is as shown in Figure 13.
The camera is calibrated according to the flow chart in Figure 4, and the inner parameters and distortion matrix are obtained as follows:
Extract subpixel image corrected angular coordinates,. The pixel distance between the adjacent corner point is obtained as h. Internal and external calibration parameters are used to calculate the sub-pixel corner coordinates in the image. Assume the distance between the adjacent corner points is M, according to the pixel distance, the ratio of the proportion relation coefficient k is calculated out, which is shown in Equation (25). The values k in the horizontal direction and vertical direction are 30.32 μm and 30.44 μm, respectively.
After calibration, the measured workpiece is clamped by the three-jaw chuck, and the other end of the part is held by the tail. The X, Y-direction linear electrokinetic displacement stages are moved to the initial position of the camera, and the measured workpiece is moved to the focal plane of the camera lens by controlling the Z-direction linear electrokinetic displacement stage. When the workpiece is rotated by 1°, an image of the workpiece is acquired by the camera. A total of 360 images are obtained and stored in the computer. Before image pre-processing, the image is corrected by the methods described in Section 3.1. Figure 14 is the collected original workpiece image, and Figure 15 is the corrected workpiece image.
4.2. Image Pre-Processing
Since the measurement of the form deviation is only related to the edges, the complex background and noise are present in the collected images. It is necessary to carry out pre-processing, such as region of interest (ROI) extraction, filtering, and image enhancement, to eliminate additional interference in order to precisely measure the workpiece form. When collecting the image, the workpiece, three-jaw chuck, and tailstock part are photographed, so a rectangular area is used for ROI extraction. According to the requirements of form deviation and characteristics of the workpiece image, various filters are used to deal with the same image. After comparison, Gaussian filtering is more suitable for image pre-processing for our study. The processed images are shown in Figure 16. The original workpiece image is obtained by machine vision, as shown in Figure 16a. ROI extraction is performed by a rectangular area, as shown in Figure 16b. Threshold segmentation is completed by the Otsu method, as shown in Figure 16c. Rough edges of the part image are extracted by the Canny algorithm, as shown in Figure 16d. Parts of the upper-edge sub-pixel-position fine edges are accurately obtained by using the polynomial fitting algorithm, as shown in Figure 16e.
4.3. Straightness Deviation Results
According to the vision measurement algorithm of straightness deviation, several measuring experiments are completed on the φ 20 mm × 100 mm shaft workpiece. Results of the containment line search algorithm at the rotation angle of 0° are shown in Figure 17. All fitting axis points are successfully contained by the two containment lines. The straightness deviation is the distance between the two lines multiplied by the calibration coefficient k. The results of 360 straightness measurement are shown in Figure 18, where the maximum straightness deviation is 30.18 μm, the minimum value is 4.71 μm, and the average value is 11.12 μm, respectively.
In Figure 18, the variation in straightness deviation is somewhat large. There are two possible reasons. Firstly, it takes about 3 min to collect 360 images from different angles, during which the image quality may be affected by an unstable illumination. Secondly, the workpiece axis is not the center of rotation. These factors affect the measured results.
4.4. Roundness Deviation Results
Since the images of the entire axis are not detected in the roundness measurement, several cross-sections in the same distance are used to calculate roundness deviation, so that the ROI region required for roundness deviation measurement is smaller than that of straightness deviation. Seven equidistance cross-section positions are selected in group A with 2000 pixels and group B with 1100 pixels in the diameter direction, and the comparison results are shown in Table 3 by using methods described in Section 3.3. Figure 19 shows the graph of the improved particle optimization algorithm (PSO) calculation results for position 1 in group A (the first position).
4.5. Cylindricity Deviation Results
The number of cross-sections usually used in the measuring cylinder should be no less than 5. In this study, by the rotation angle interval of 1°, 10 cylindricity sections and 20 cylindricity sections of the parts are acquired to calculate cylindricity deviation. This calculation process is the same as the roundness deviation calculation. Data fitting results are shown in Figure 20; the cylindricity deviations are 26.91 μm and 29.81 μm, respectively. The cylindricity deviation of the workpiece changes slightly with the different number of sections under the same experimental conditions.
4.6. Verification of Measurement Results
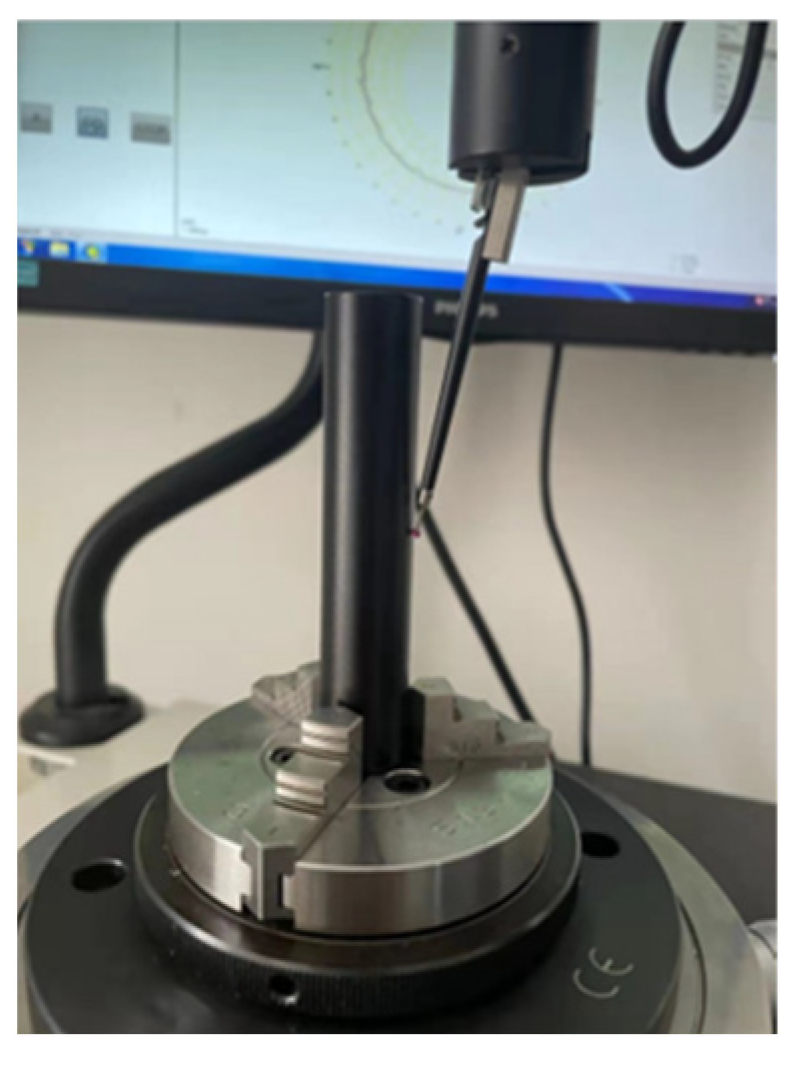
In order to judge whether the measurement proposed is correct, a commercial instrument, RD602 cylindricity measuring instrument, is used to measure the same workpiece, as shown in Figure 21. RD602 cylindricity measuring instrument has a high precision, with the deviation of less than 0.5 μm at full working motion, which is used to verify the accuracy of the on-line measurement system. The repeatability of this instrument is 0.2 μm. The comparison results of form deviation are shown in Table 4.
Through some experiments, the standard deviations of straightness, roundness, and cylindricity measured by this instrument are 0.52, 0.31, and 1.56, respectively. From the comparison results shown in Table 4, it can be concluded that the straightness, roundness, and cylindricity deviations of the form deviation measurement system are −4.69 μm, 3.87 μm, and 8.51 μm, respectively. The various form deviation values were measured accurately, which can reach the measurement accuracy of commonly used three-coordinate measuring machine and provides a reference for testing form deviation in production. When calculating the straightness deviation, in order to use less time, it is not necessary to calculate the 360 data values. Instead, the rotation angle can be appropriately increased to reduce the calculation. When calculating cylindricity, about 20 sections can be selected, which can be time saving and efficient, satisfying the accuracy requirements.
5. Conclusions
In this paper, a new workpiece form deviation measurement method based on machine vision is presented for the measurement of straightness, roundness, and cylindricity of a workpiece. An image acquisition system for obtaining images of shaft workpiece is developed. Edge detection technology and sub-pixel edge positioning technology are used to extract the edge information. A subsumed line search algorithm and an improved particle swarm optimization algorithm are proposed to evaluate the straightness and roundness deviations of the workpiece. Moreover, a method of spatial cylindricity deviation solution based on an improved synchronous PSO algorithm is proposed. The results of straightness, roundness, and cylindricity deviations of the workpiece are obtained by the above algorithms. Their standard deviations are 0.52, 0.31, and 1.56, respectively, implying consistency in the measurement. From the contrast experiments, the differences of straightness, roundness, and cylindricity deviations of the form deviation measurement system are −4.69 μm, 3.87 μm, and 8.51 μm, respectively, which are comparable to the traditional measurement methods. Therefore, the proposed method meets the precision requirements and is applicable for non-contact measurement, which has the advantages in measuring vulnerably scratched workpieces and in quickly obtaining form outlines of the workpieces. The proposed method would provide a viable industrial solution for the measurement of form deviations.
Author Contributions
Conceptualization, W.Z. and Z.H.; Data curation, Z.H. and Y.L.; Formal analysis, H.Z. and X.C.; Funding acquisition, H.Z.; Investigation, Y.L.; Methodology, W.Z.; Project administration, H.Z.; Resources, Z.H.; Validation, W.Z. and X.C.; Writing—original draft, W.Z. and Z.H. All authors have read and agreed to the published version of the manuscript.
Funding
The paper is financially supported by the National Key Research and Development Program of China (2022YFE0199100) and the Natural Science Foundation of Shandong Province (ZR2020ME164, ZR2016FL15).
Institutional Review Board Statement
Not applicable.
Informed Consent Statement
Not applicable.
Data Availability Statement
Not applicable.
Conflicts of Interest
The authors declare no conflict of interest.
References
- Xiao, G.; Li, Y.; Xia, Q.; Cheng, X.; Chen, W. Research on the on-line dimensional accuracy measurement method of conical spun workpieces based on machine vision technology. Measurement 2019, 148, 106881. [Google Scholar] [CrossRef]
- Derganc, J.; Likar, B.; Pernuš, F. A machine vision system for measuring the eccentricity of bearings. Comput. Ind. 2003, 50, 103–111. [Google Scholar] [CrossRef]
- Kakaley, D.E.; Altieri, R.E.; Buckner, G.D. Non-contacting measurement of torque and axial translation in high-speed rotating shafts. Mech. Syst. Signal Process. 2020, 138, 106520. [Google Scholar] [CrossRef]
- Dong, C.Z.; Ye, X.W.; Jin, T. Identification of structural dynamic characteristics based on machine vision technology. Measurement 2018, 126, 405–416. [Google Scholar] [CrossRef]
- Lu, R.S.; Li, Y.F.; Yu, Q. On-line measurement of the straightness of seamless steel pipes using machine vision technique. Sens. Actuators A Phys. 2001, 94, 95–101. [Google Scholar] [CrossRef]
- Cho, S.; Kim, J.-Y.; Asfour, S.S. Machine learning-based algorithm for circularity analysis. Int. J. Inf. Decis. Sci. 2014, 6, 70–86. [Google Scholar] [CrossRef]
- Liu, W.; Li, X.; Jia, Z.; Li, H.; Ma, X.; Yan, H.; Ma, J. Binocular-vision-based error detection system and identification method for PIGEs of rotary axis in five-axis machine tool. Precis. Eng. 2018, 51, 208–222. [Google Scholar] [CrossRef]
- Tan, Q.; Kou, Y.; Miao, J.; Liu, S.; Chai, B. A Model of Diameter Measurement Based on the Machine Vision. Symmetry 2021, 13, 187. [Google Scholar] [CrossRef]
- Li, B. Research on geometric dimension measurement system of shaft parts based on machine vision. EURASIP J. Image Video Process. 2018, 2018, 1–9. [Google Scholar] [CrossRef]
- Luo, J.; Liu, Z.; Zhang, P.; Liu, X.; Liu, Z. A method for axis straightness error evaluation based on improved differential evolution algorithm. Int. J. Adv. Manuf. Technol. 2020, 110, 413–425. [Google Scholar] [CrossRef]
- Hao, F.; Shi, J.; Meng, C.; Gao, H.; Zhu, S. Measuring straightness errors of slender shafts based on coded references and geometric constraints. J. Eng. 2020, 2020, 221–227. [Google Scholar] [CrossRef]
- Min, J. Measurement method of screw thread geometric error based on machine vision. Meas. Control. 2018, 51, 304–310. [Google Scholar] [CrossRef]
- Chai, Z.; Lu, Y.; Li, X.; Cai, G.; Tan, J.; Ye, Z. Non-contact measurement method of coaxiality for the compound gear shaft composed of bevel gear and spline. Measurement 2021, 168, 108453. [Google Scholar] [CrossRef]
- Zhengyou, Z. Camera calibration with one-dimensional objects. IEEE Trans. Pattern Anal. Mach. Intell. 2004, 26, 892–899. [Google Scholar] [CrossRef]
- Lv, Y.; Feng, J.; Li, Z.; Liu, W.; Cao, J. A new robust 2D camera calibration method using RANSAC. Optik 2015, 126, 4910–4915. [Google Scholar] [CrossRef]
- Bu, L.; Huo, H.; Liu, X.; Bu, F. Concentric circle grids for camera calibration with considering lens distortion. Opt. Lasers Eng. 2021, 140, 106527. [Google Scholar] [CrossRef]
- Bao, P.; Lei, Z.; Xiaolin, W. Canny edge detection enhancement by scale multiplication. IEEE Trans. Pattern Anal. Mach. Intell. 2005, 27, 1485–1490. [Google Scholar] [CrossRef] [PubMed] [Green Version]
- Ye, J.; Fu, G.; Poudel, U.P. High-accuracy edge detection with Blurred Edge Model. Image Vis. Comput. 2005, 23, 453–467. [Google Scholar] [CrossRef]
- Xie, X.; Ge, S.; Xie, M.; Hu, F.; Jiang, N. An improved industrial sub-pixel edge detection algorithm based on coarse and precise location. J. Ambient. Intell. Humaniz. Comput. 2019, 11, 2061–2070. [Google Scholar] [CrossRef]
- Sun, Q.; Hou, Y.; Tan, Q. A subpixel edge detection method based on an arctangent edge model. Optik 2016, 127, 5702–5710. [Google Scholar] [CrossRef]
- Li, C.-M.; Xu, G.-S. Sub-pixel Edge Detection Based on Polynomial Fitting for Line-Matrix CCD Image. In Proceedings of the 2009 Second International Conference on Information and Computing Science, Manchester, UK, 21–29 May 2009; pp. 262–264. [Google Scholar]
- Xu, X.; Xu, S.; Jin, L.; Song, E. Characteristic analysis of Otsu threshold and its applications. Pattern Recognit. Lett. 2011, 32, 956–961. [Google Scholar] [CrossRef]
- ISO 1101; Geometrical Product Specification (GPS)—Geometrical Tolerancing—Tolerances of Form, Orientation, Location and Run-Out. ISO: Geneva, Switzerland, 2017.
- Henzold, G. Geometrical Dimensioning and Tolerancing for Design, Manufacturing and Inspection, 2nd ed.; Butterworth-Heinemann: Oxford, UK; Elsevier: Burlington, VT, USA, 2006. [Google Scholar]
- Pratheesh Kumar, M.R.; Prasanna Kumaar, P.; Kameshwaranath, R.; Thasarathan, R. Roundness error measurement using teaching learning based optimization algorithm and comparison with particle swarm optimization algorithm. Int. J. Data Netw. Sci. 2018, 2, 63–70. [Google Scholar] [CrossRef]
- Srinivasu, D.S.; Venkaiah, N. Minimum zone evaluation of roundness using hybrid global search approach. Int. J. Adv. Manuf. Technol. 2017, 92, 2743–2754. [Google Scholar] [CrossRef]
- Rossi, A.; Antonetti, M.; Barloscio, M.; Lanzetta, M. Fast genetic algorithm for roundness evaluation by the minimum zone tolerance (MZT) method. Measurement 2011, 44, 1243–1252. [Google Scholar] [CrossRef] [Green Version]
- Pathak, V.K.; Singh, A.K. Effective Form Error Assessment Using Improved Particle Swarm Optimization. Mapan 2017, 32, 279–292. [Google Scholar] [CrossRef]
- Zhang, Y.; Wang, S.; Ji, G. A Comprehensive Survey on Particle Swarm Optimization Algorithm and Its Applications. Math. Probl. Eng. 2015, 2015, 1–38. [Google Scholar] [CrossRef] [Green Version]
Figure 1.
Schematic diagram of an image acquisition system.

Figure 2.
Form deviation detection system by machine vision.

Figure 3.
Relationship between the camera coordinate system and the World Coordinate System.
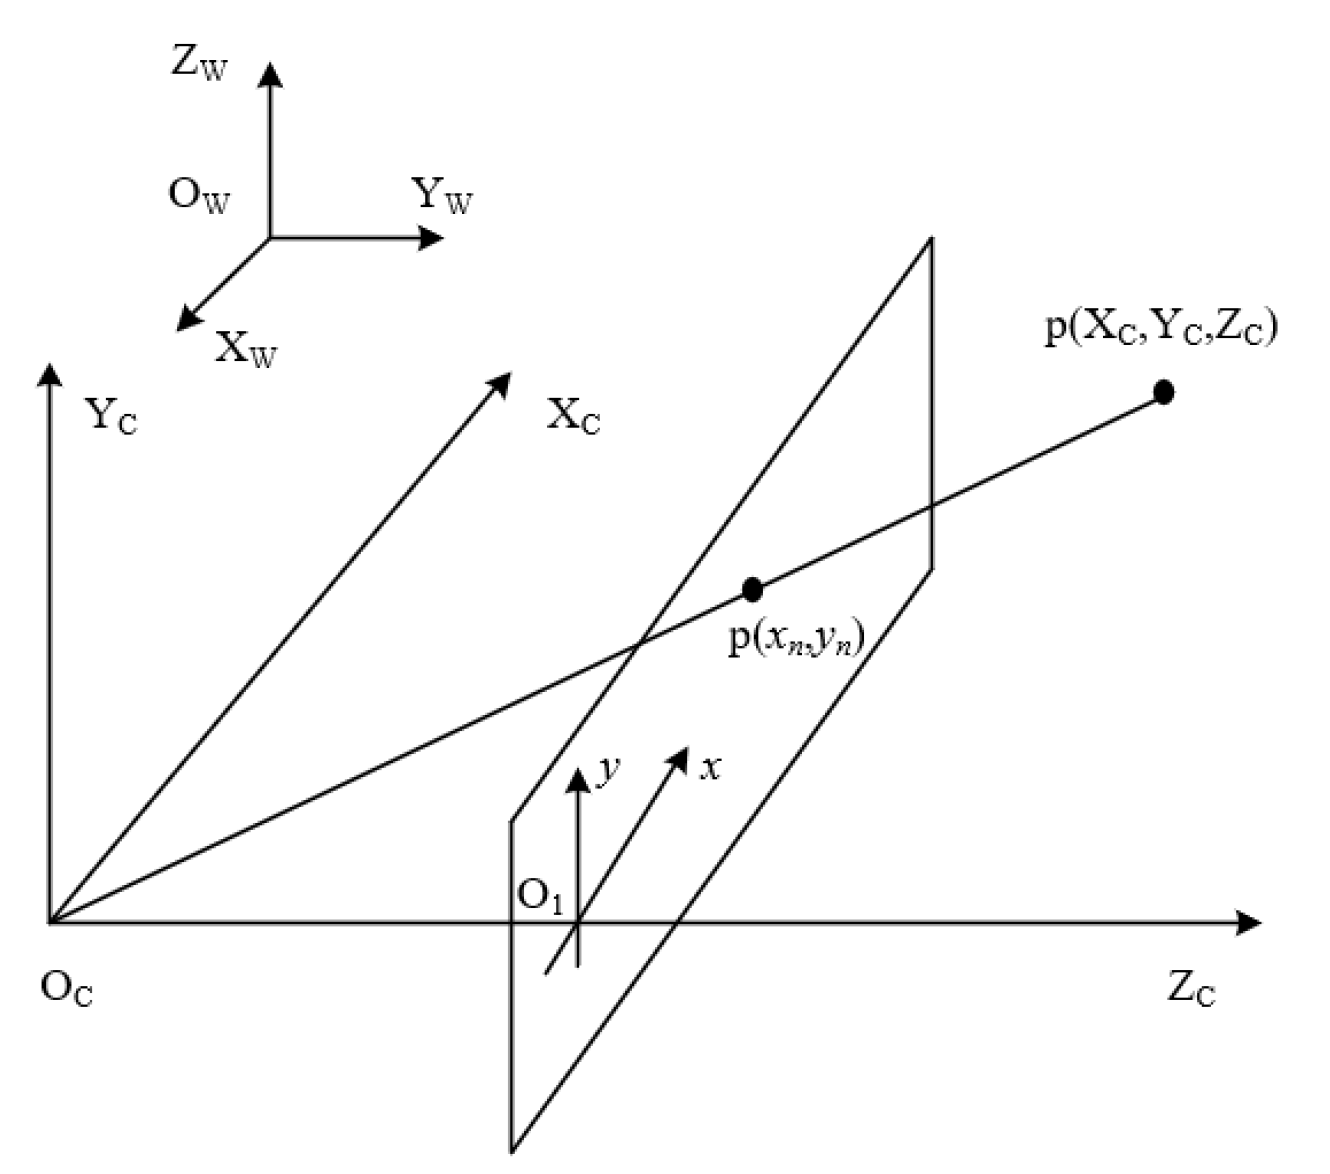
Figure 4.
Flow chart of camera calibration.

Figure 5.
Graphical demonstration of calculating pixel coordinates of the central axis.

Figure 6.
Graphical demonstration of enveloped line search algorithm.

Figure 7.
Position relation of camera and workpiece in the measuring coordinate.
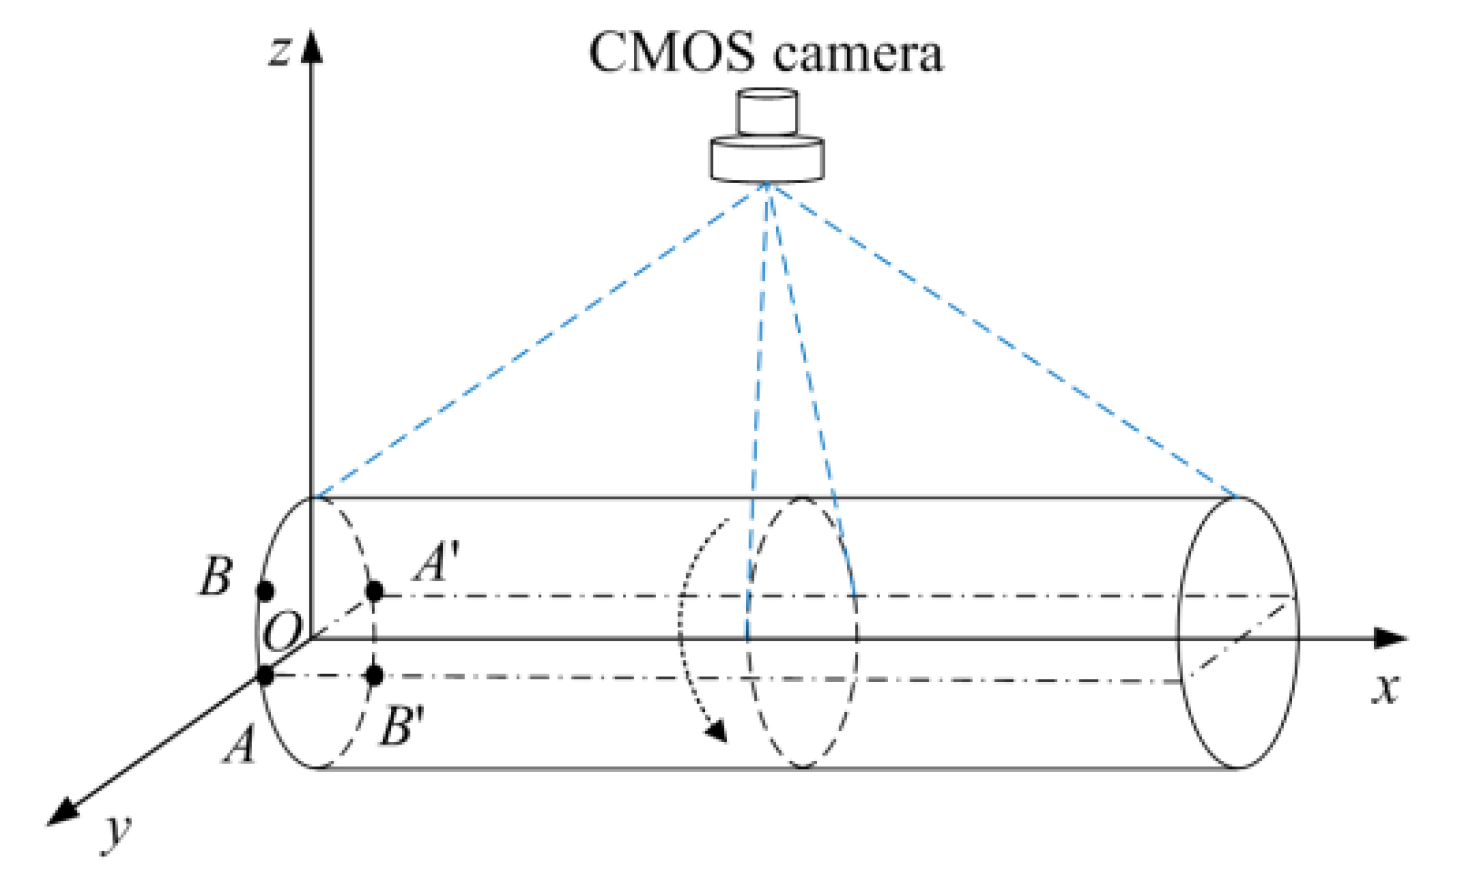
Figure 8.
Graphical demonstration of the axis section acquisition point.
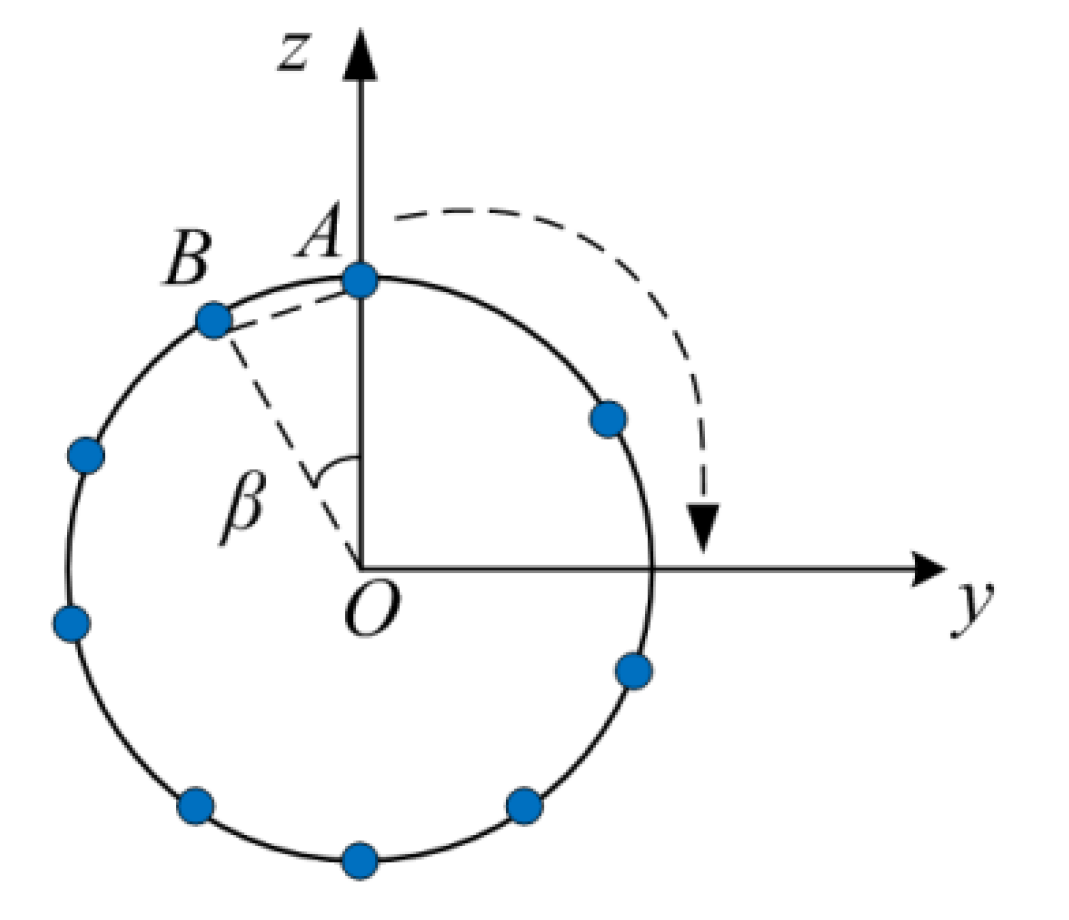
Figure 9.
Schematic of roundness deviation evaluation.
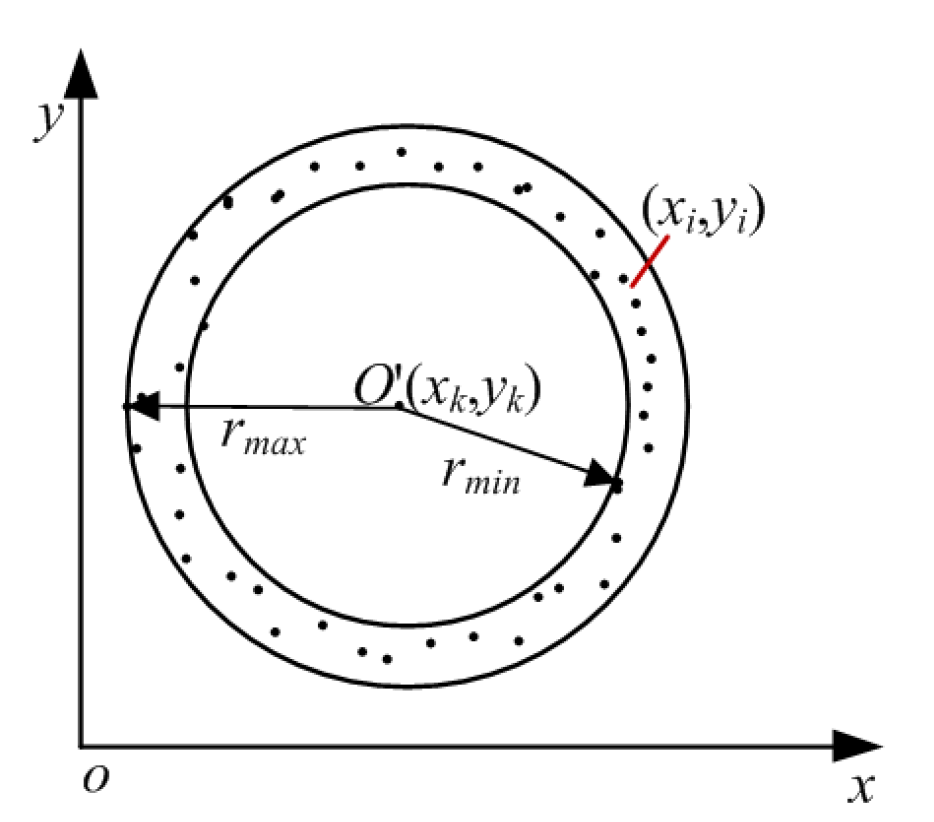
Figure 10.
Improved PSO flow chart.

Figure 11.
Schematic of the space axis fitting.

Figure 12.
Calibration plate image.
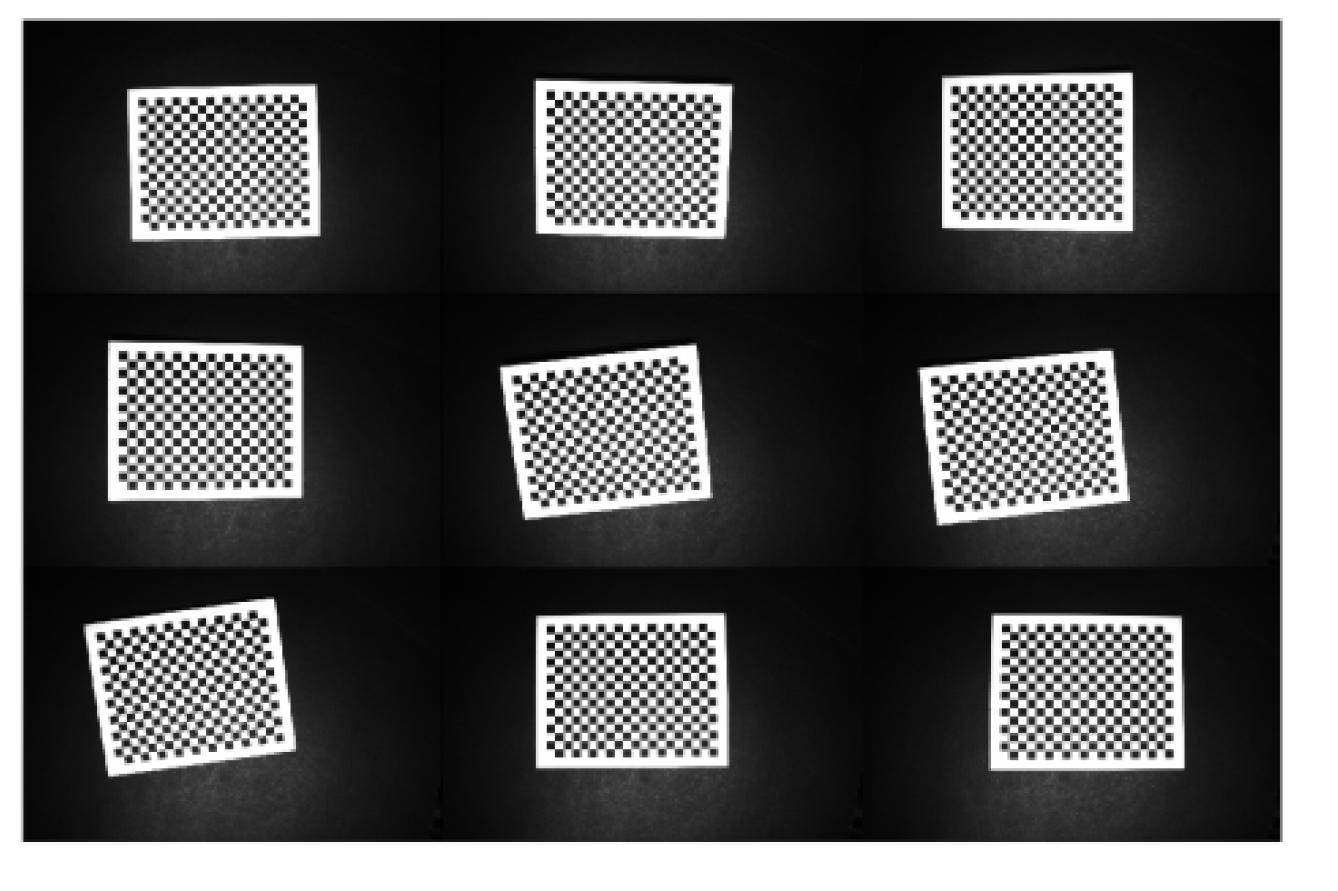
Figure 13.
Corner detection of the calibration plate.

Figure 14.
Original workpiece image.

Figure 15.
Workpiece image after correction.
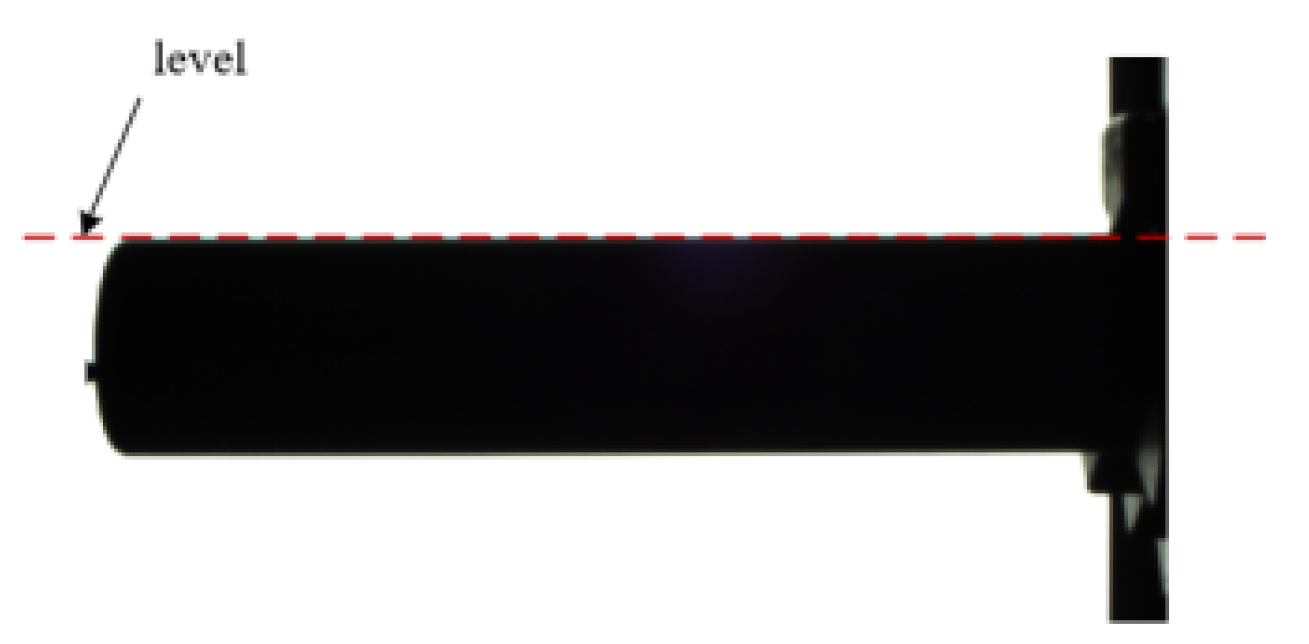
Figure 16.
Images after image processing.
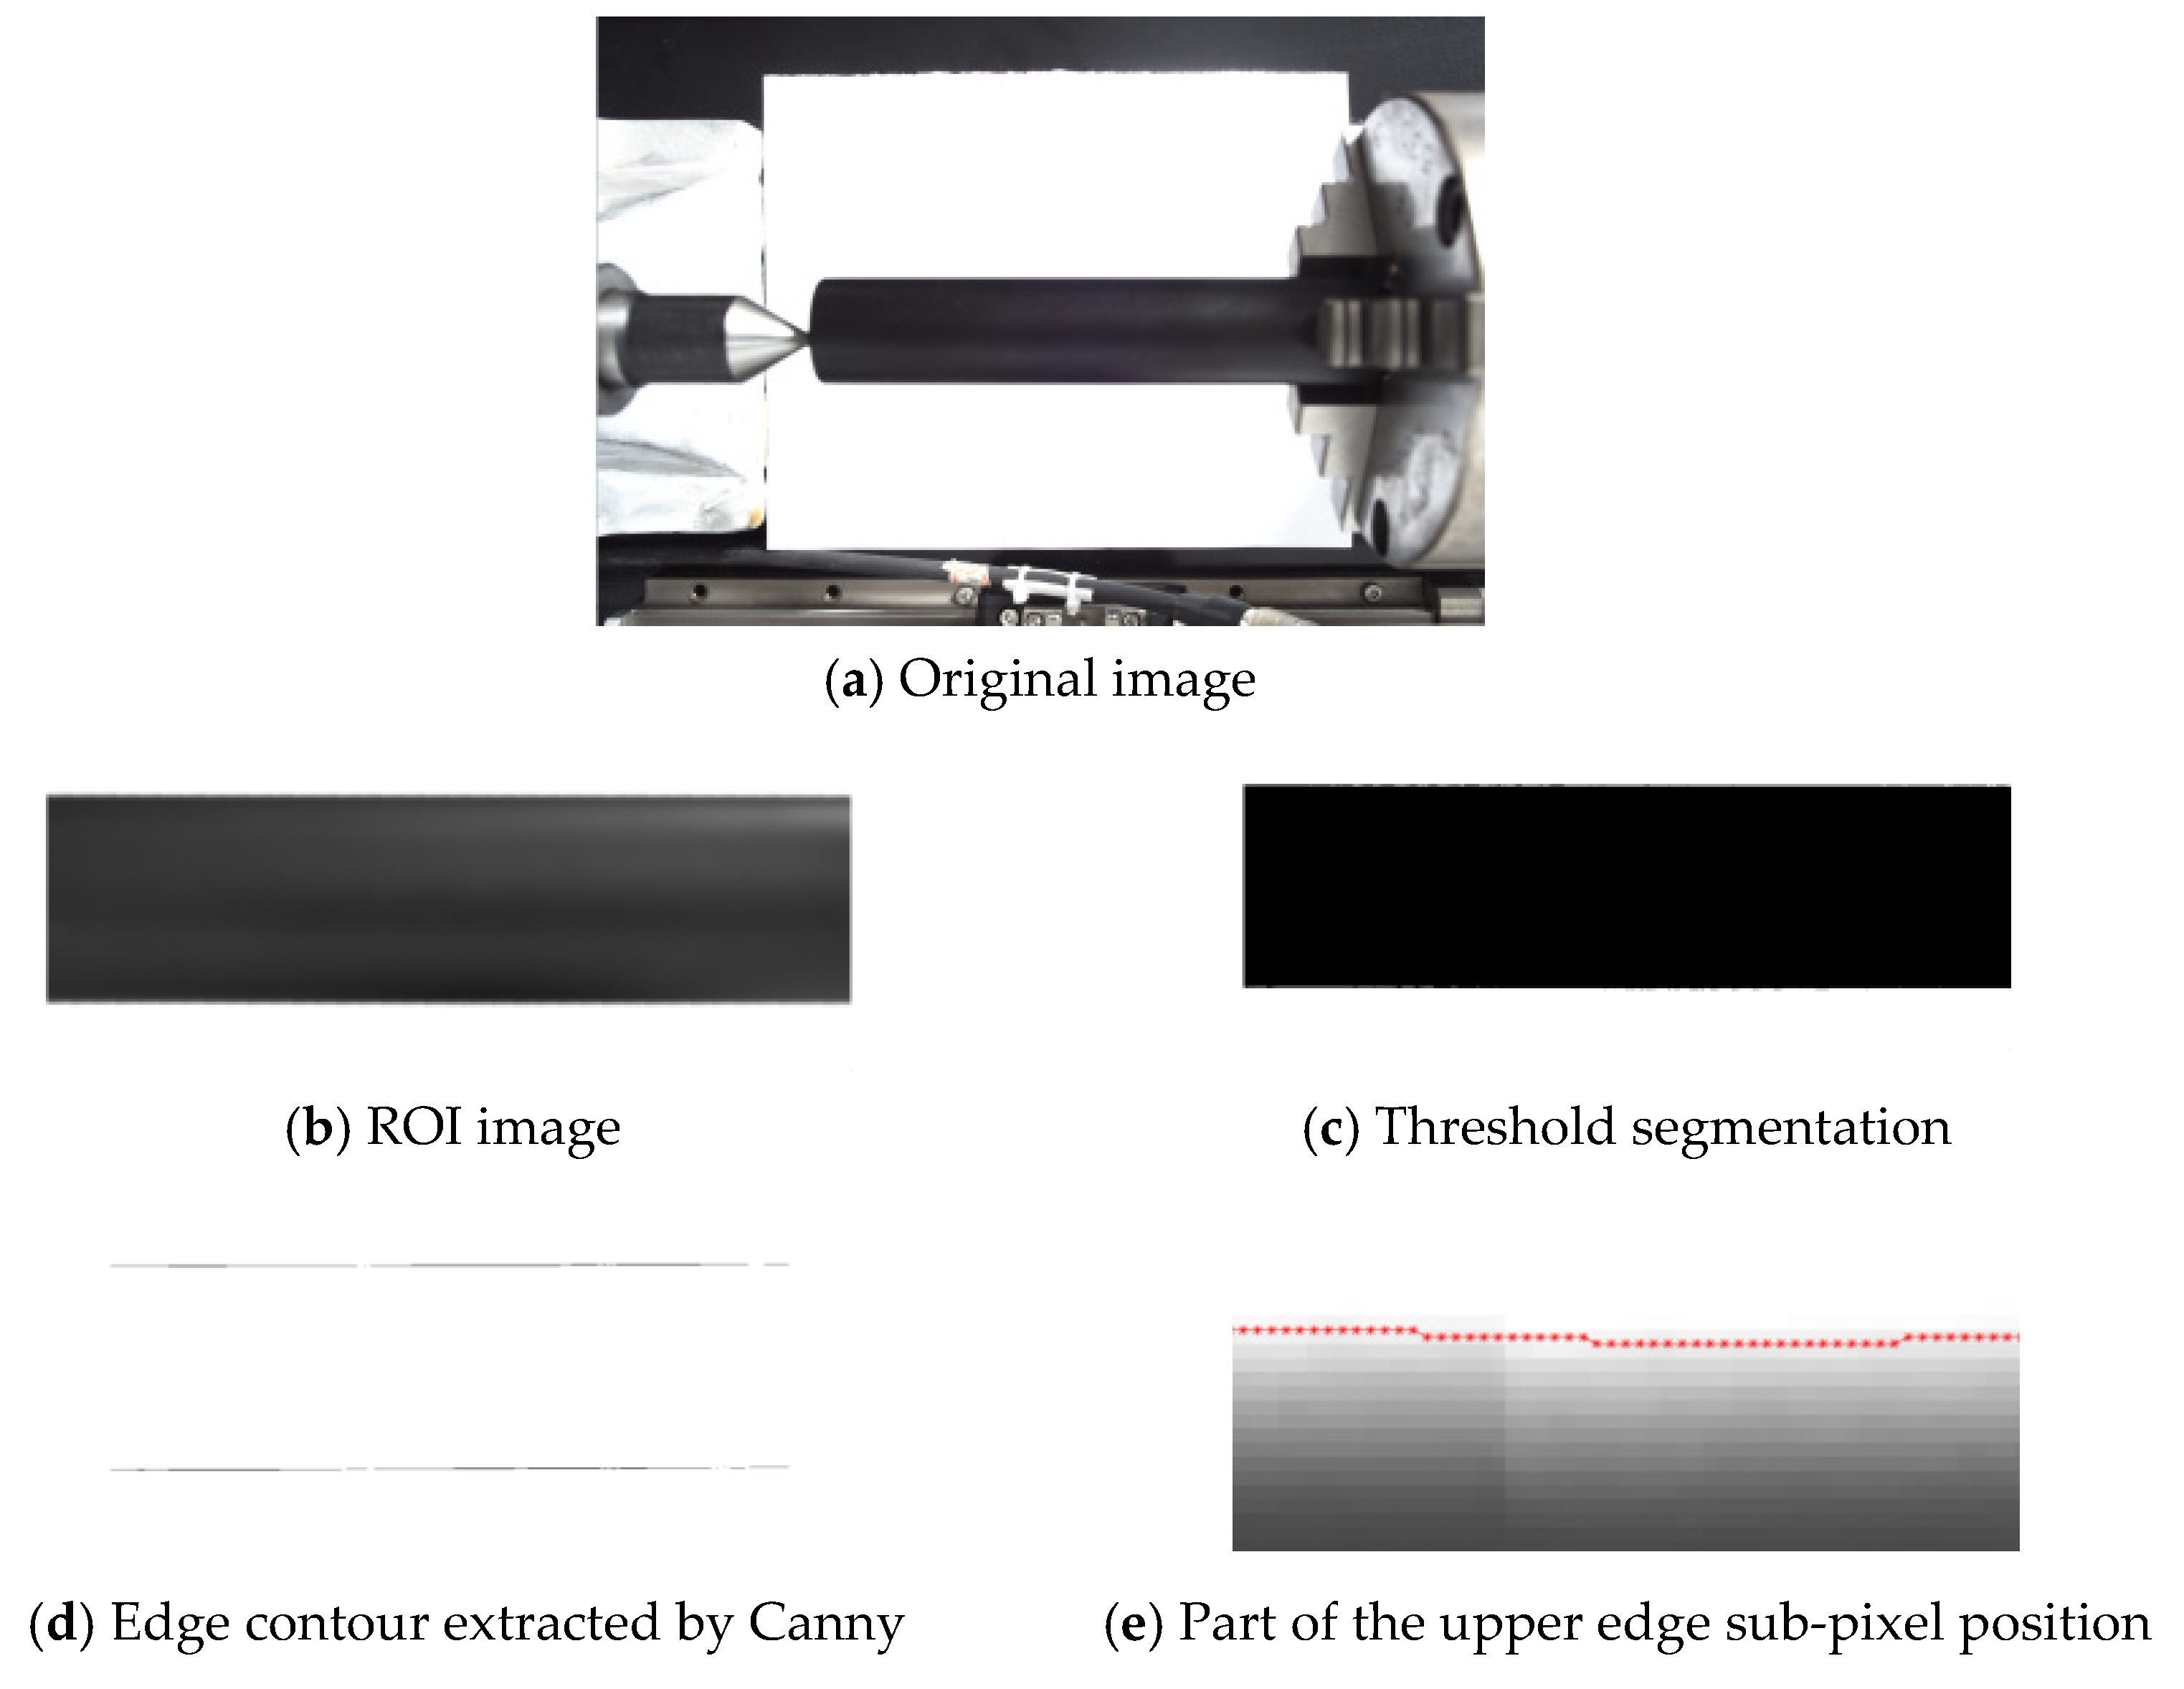
Figure 17.
Graph of straightness deviation evaluation results.

Figure 18.
Graph of 360 straightness deviation results.
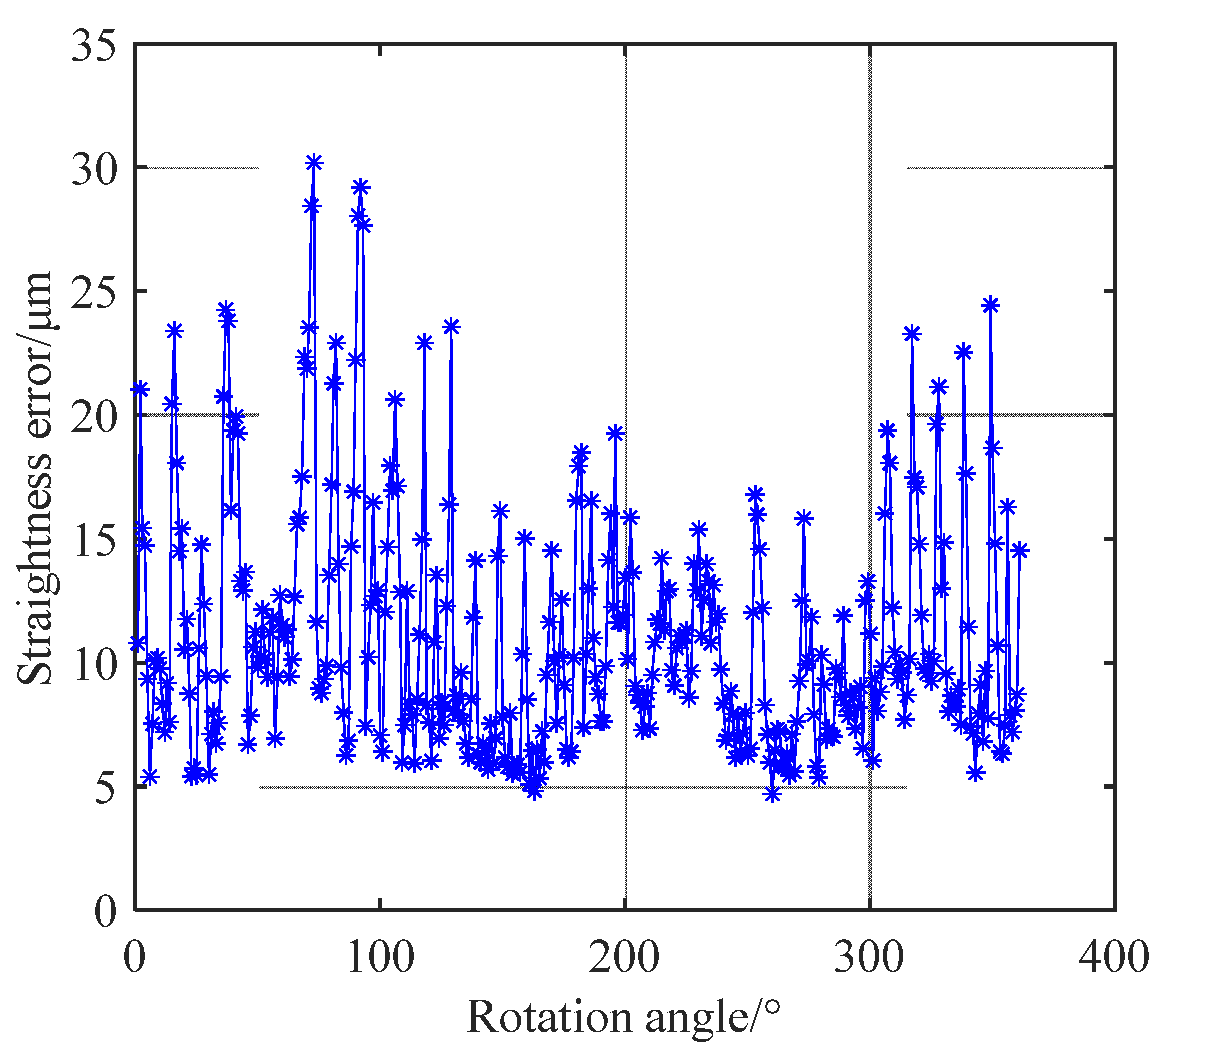
Figure 19.
Graph of the improved PSO calculation results for position 1 in group A.
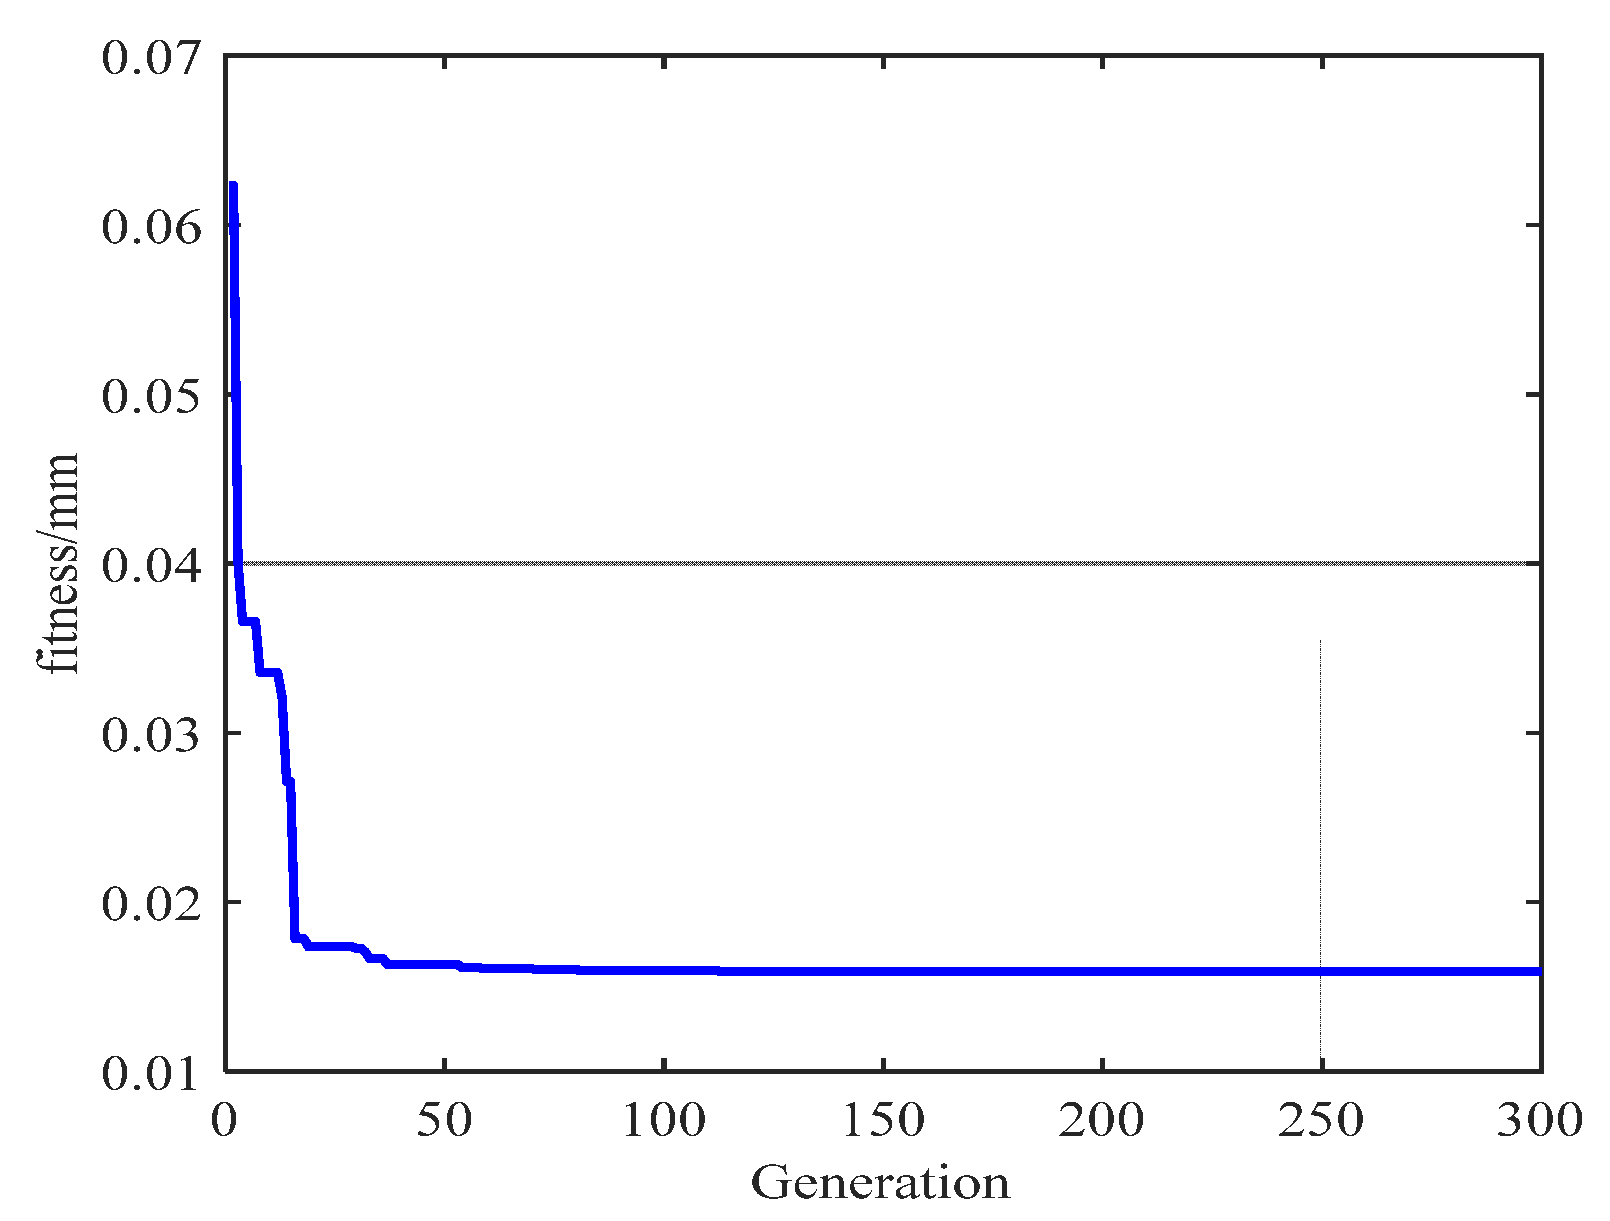
Figure 20.
Graph fitting of workpiece axis and measured points.

Figure 21.
Workpiece form deviation measurement by cylindricity measuring instrument RD602.

Table 1.
Main hardware of the system.
| Computer | CMOS Camera | Lens | Light Source |
|---|---|---|---|
| ADLINK IPC-610 | DAHENG MER-2000-19U3C | Computer V1228-MPY | KOMA JS-LT-180-32 |
Table 2.
Specification of motion stages.
| Motorized Stage | Parameters | |||
|---|---|---|---|---|
| Travel Range (mm) | Resolution (µm) | Repeatability Positioning (µm) | ||
| X | KXL06200-C2-F | 200 | 0.2 | ±1 |
| Y, Z | KXG06030-C | 30 | 0.1 | ±1 |
| Rotating | KS401-40 | 360° | 0.003° | ±0.05° |
Table 3.
Roundness deviation results.
| Section Position | Roundness Deviation of Group A/μm | Roundness Deviation of Group B/μm |
|---|---|---|
| 1 | 15.89 | 14.53 |
| 2 | 14.90 | 14.91 |
| 3 | 13.83 | 13.77 |
| 4 | 13.24 | 13.68 |
| 5 | 12.82 | 13.25 |
| 6 | 13.05 | 12.86 |
| 7 | 12.36 | 13.71 |
| Average value | 13.73 | 13.82 |
Table 4.
Comparison of deviation results.
| Average Value by RD602/μm | Average Value by the Designed Instrument/μm | Error/μm | |
|---|---|---|---|
| Straightness | 15.80 | 11.11 | −4.69 |
| Roundness | 9.95 | 13.82 | 3.87 |
| Cylindricity | 21.30 | 29.81 | 8.51 |
Publisher’s Note: MDPI stays neutral with regard to jurisdictional claims in published maps and institutional affiliations. |
© 2022 by the authors. Licensee MDPI, Basel, Switzerland. This article is an open access article distributed under the terms and conditions of the Creative Commons Attribution (CC BY) license (https://creativecommons.org/licenses/by/4.0/).
Share and Cite
MDPI and ACS Style
Zhang, W.; Han, Z.; Li, Y.; Zheng, H.; Cheng, X. A Method for Measurement of Workpiece form Deviations Based on Machine Vision. Machines 2022, 10, 718. https://doi.org/10.3390/machines10080718
AMA Style
Zhang W, Han Z, Li Y, Zheng H, Cheng X. A Method for Measurement of Workpiece form Deviations Based on Machine Vision. Machines. 2022; 10(8):718. https://doi.org/10.3390/machines10080718
Chicago/Turabian StyleZhang, Wei, Zongwang Han, Yang Li, Hongyu Zheng, and Xiang Cheng. 2022. "A Method for Measurement of Workpiece form Deviations Based on Machine Vision" Machines 10, no. 8: 718. https://doi.org/10.3390/machines10080718
Note that from the first issue of 2016, this journal uses article numbers instead of page numbers. See further details here.