
Impact of Grid-Connected Inverter Parameters on the Supraharmonic Emissions in Distributed Power Generation Systems


1
Research Group EELab/Lemcko, Department of Electromechanical, Systems and Metal Engineering, Faculty of Engineering and Architecture, Ghent University, 8500 Kortrijk, Belgium
2
Department of Electrical Engineering, Faculty of Engineering, Menoufia University, Menoufia 32511, Egypt
*
Author to whom correspondence should be addressed.
Machines 2023, 11(11), 1014; https://doi.org/10.3390/machines11111014
Submission received: 19 October 2023
/
Revised: 3 November 2023
/
Accepted: 6 November 2023
/
Published: 7 November 2023
(This article belongs to the Special Issue Advanced Power Electronic Technologies in Electric Drive Systems)
Abstract
:In this paper, a mathematical analysis is presented to show the effect of grid-connected inverter (GCI) parameters on its emissions in the supraharmonic range. This analysis is extended to explain the effect of asymmetry on the emissions of parallel-connected GCIs on distributed power generation systems. The switching harmonics of a GCI appear as bands around the switching frequency and its multiples. A MATLAB/Simulink model is built to perform two studies. In the first study, we use one GCI to examine the effect of the parameters on the emissions, while in the second study, we examine the effect of the asymmetry of two parallel-connected GCIs on the total emission toward the grid. An actual setup is built to verify the results of the mathematical analysis and the simulation study. It is found that the SHs of single-phase GCI amplitude are strongly dependent on the DC-link voltage and the coupling inductor, while the phases of the sideband harmonics only change with changing the injected power. The variation of the injected power does not have any tangible effect on the carrier harmonics.
1. Introduction
Distributed power generation systems (DPGSs) are becoming gradually more crucial to integrate renewable energy sources in the grid [1,2]. In these systems, numerous grid-connected inverters (GCIs) are connected in parallel at the point of common coupling (PCC). These GCIs work as switching harmonics sources which inject harmonics lying between 2 and 150 kHz, which was recently named as the supraharmonic (SH) range [3,4].
Research efforts have been intensified to identify the problems associated with supraharmonics and to convince the standardization committees to include the SH within the power quality standards. It is reported that the presence of supraharmonics leads to equipment malfunctioning, unintentional switching, audible noise, electrical thermal stress, and reduction in lifetime [5,6]. In [6,7], it is reported that the electronic control unit of LED lamps can interfere with the SHs, causing operation failure. The study in [7] comes to a conclusion that both supraharmonics and modulation of the test profiles, described in IEC 61000-4-19 [8], can reveal light flicker. Multiple studies are conducted to study the interferences between smart meters, touch dimmer lamps and inverters [8,9]. Interferences in AC–DC LED drivers exposed to voltage disturbances in the considered frequency range were presented in [10]. It is concluded from [10] that there are three phenomena that affect the light intensity: earlier conduction/later blocking caused by SH voltage, intermittent conduction depending on the SH impedance of the LED driver, and the reverse-recovery current of the diodes at higher frequency. Further studies show that SHs may interfere with the grid-connected converters, resulting in injecting additional interharmonics below 2 kHz into the grid [11].
The single-phase GCI is considered one of multiple SH emission sources [12]. In [13], the SH emissions of ten low power photovoltaic (PV) GCIs for single-phase and three phase applications are studied experimentally. The study concludes that the-maximum power point tracker as well as the injected power affect the SH emissions. The SH propagation in a system, consisting of a GCI in parallel with LED lamps, is investigated in [14]; the authors found that the lengths of the cables that connect GCI and LED lamps to the PCC as well as the cable that connects the PCC to the grid affect the emissions of each piece of equipment as well as the interferences between both switching devices. A comparative study between the simulation and experimental results of the GCI emissions in the SH range is evaluated in [15]. Selecting a suitable modelling approach, building experimental setups and achieving a compromise between the simplicity and the accuracy of the GCI for SH emissions is discussed in [16].
One of the utmost significant aspects that has attracted the attention of the scientific society to study SHs is that SHs act differently from the harmonics and interharmonics below 2 kHz. The first difference is that while the harmonics below 2 kHz are linked to the grid frequency, the SHs are associated with both the switching frequency and the grid frequency. The second difference is the propagation behavior. The (inter)harmonics below 2 kHz tend to propagate through the grid, while the SHs head for propagating among the neighboring devices as well as the grid. The intensity of the currents is based on the ratio between the input impedance of neighboring devices and the grid impedances. The study performed in [17] is carried out to investigate the effect of the cable impedances of a PV GCI in parallel with LED lamps on the SH propagations among the grid and the components of the system. Moreover, the study performed in [18] gives an analysis of the Bergeron model of transmissions lines in the SH range in order to study the SH propagation and penetration. It is found in [18] that the Bergeron model of transmission lines cannot be used in its current form to study the SH propagation. This is because the transmission line resistances are modeled as lumped in the model instead of being distributed. As a result, the model cannot calculate the impedance of the line accurately around the even-ordered resonances of the transmission line impedance.
As SHs propagate among grid-connected devices as well toward the upstream grid, SH emissions are divided into two categories, i.e., the primary and secondary emissions. The primary emissions of any switching converter are defined as the emissions in the SH range depending on the switching behavior of the converter itself. The secondary emissions are defined as the SH emissions appearing at the converter terminals generated by neighboring converters based on the impedance relation between the converter and the grid [19]. Moreover, the background distortion in the SH range at the PCC may cause additional emissions in that range of the AC–DC converters connected to the same PCC [20].
For the purpose of mitigating the switching harmonics, two solutions are provided in the literature. The first solution is associated with the design of the passive filter that connect the GCI to the grid [21]. This solution is limited to eliminate a specific number of switching bands by designing the passive filter with a specific number of series resonances provided by its impedance. This solution has many drawbacks. When the number of series resonances increase, the complexity of the filter increases, the transient response of the GCI deteriorates and the control parameter selection becomes more challenging. In addition to that, the associated parallel resonances of the filter threaten the system’s stability. Moreover, the filter design depends on the grid impedance, which decreases the design robustness.
The second solution is restricted to parallel-connected GCIs in DPGSs. The mechanism of this solution depends on generating one central carrier signal, and then the carrier signal is distributed among the parallel-connected GCIs with equal phase shifts [22]. This solution is effective only when the parallel-connected GCIs are symmetric. For the asymmetry GCIs, many studies calculate the optimum phase shift to reduce the total switching harmonics injected to the grid [23]. However, the control algorithm becomes much more complicated due to the need to add optimal carrier phase spacing techniques that minimize a particular cost function to the control algorithm. So, this paper is presented in order to determine exactly the parameters that affect the emissions in order to have a deep understanding of the impact of these parameters. This can lead in the future to an efficient solution to lower the emissions of parallel-connected GCIs.
This paper provides an insightful exploration into the parameters that affect the high-frequency emissions in the SH range of single-phase GCIs. The main parameters found are the DC-link voltage, the coupling filter and the injected power. Since the aforementioned parameters affect the SH emissions of the GCIs, the carrier-phase shift asymmetry in parallel GCIs in DPGSs reduces the filtering behavior of the system.
The main contributions of this paper follow:
- Giving mathematical expressions that present the parameters that affect the SH emissions of GCIs;
- Studying the effect of some of the parameters on the emissions of GCIs mathematically by simulation and by experimental studies;
- Studying the effect of parameters’ symmetry and asymmetry of parallel-connected GCIs on the total emissions to the grid;
- Giving a corner stone for studying the propagations and penetration of SH emissions of GCIs in single-phase installations in addition to filtering them out and preventing them from flowing into the grid.
It is found from the study that the carrier harmonics, which occur exactly at the switching frequency and its integer multiples, are independent of the variations on the injected power from the GCI into the grid. The variation of the power affects only the phase of the sideband harmonics, while the amplitude of all switching harmonics in the SH range is independent of the active power variations. The amplitude of the switching harmonics is affected by the variations of the DC-link voltage and by the coupling filter inductance. The amplitude of these harmonics has a non-linear relationship with the DC-link voltage, while the relationship between these harmonics and the coupling filter inductance is an inverse one. The main findings in the mathematical analysis are supported by a MATLAB/Simulink simulation and validated through an experimental study on a laboratory setup.
The remainder of the paper is organized as follows. The emissions of a single-phase GCI are presented in Section 2. Section 3 and Section 4 give an analysis of the parameter effect on the SH emissions of the GCI and the effect of that on parallel-connected GCIs, respectively. Simulation and experimental studies are provided in Section 5 and Section 6, respectively.
2. SH Emissions of Single-Phase GCI
Figure 1 shows the structure of a single-phase GCI. It consists of a DC-link, H-bridge single-phase inverter and a coupling inductor as a filter. For any stand-alone single-phase inverter driven by the sinusoidal-triangle Pulse Width Modulation (PWM) scheme illustrated in Figure 2, the output voltage of the inverter can be fully described by the following equation [24]:
Here, is the inverter output voltage; is the DC-link voltage; is the order of harmonics generated from the carrier signal; n is the order of harmonics generated by the reference signal within each carrier sideband harmonic; is the Bessel function of the first kind; is the phase shift of the reference signal, which also is the phase shift of the fundamental component of the output voltage; is the carrier phase shift; is the modulation index; is the angular frequency of the carrier signal, which represents the switching angular frequency; and is the angular frequency of the reference signal, which represents the power frequency.
Consider the grid voltage as ideal sinusoidal:
Here, is the instantaneous value of the grid voltage and is the amplitude. Then, Equation (1) becomes:
Here, is the load angle. Appendix A provides the definition of the load angle in power systems. For the purpose of simplifying the analysis, since , consider . Also, let . So, Equation (2) is modified as:
Due to the load angle δ in the fundamental component of Equation (4), the inverter injects active current to the grid. Unfortunately, the harmonic components in the inverter voltage inject high-frequency (HF) current harmonics, which are power dependent. To reduce the harmonic content injected into the grid, a passive filter is connected between the inverter and the grid. Applying the superposition theorem determines the current injected to the grid by the inverter voltage:
Here, is the current injected to the grid; is the fundamental current of the GCI current; is the carrier switching harmonics in the SH range of the GCI current, and is the sideband current switching harmonics in the SH range of the GCI current. The three current equations are as follows:
where , and are the filter and grid inductances, respectively, and is the grid resistance. Neglecting the value of with respect to for the high-frequency components of the current, Equations (7) and (8) yield:
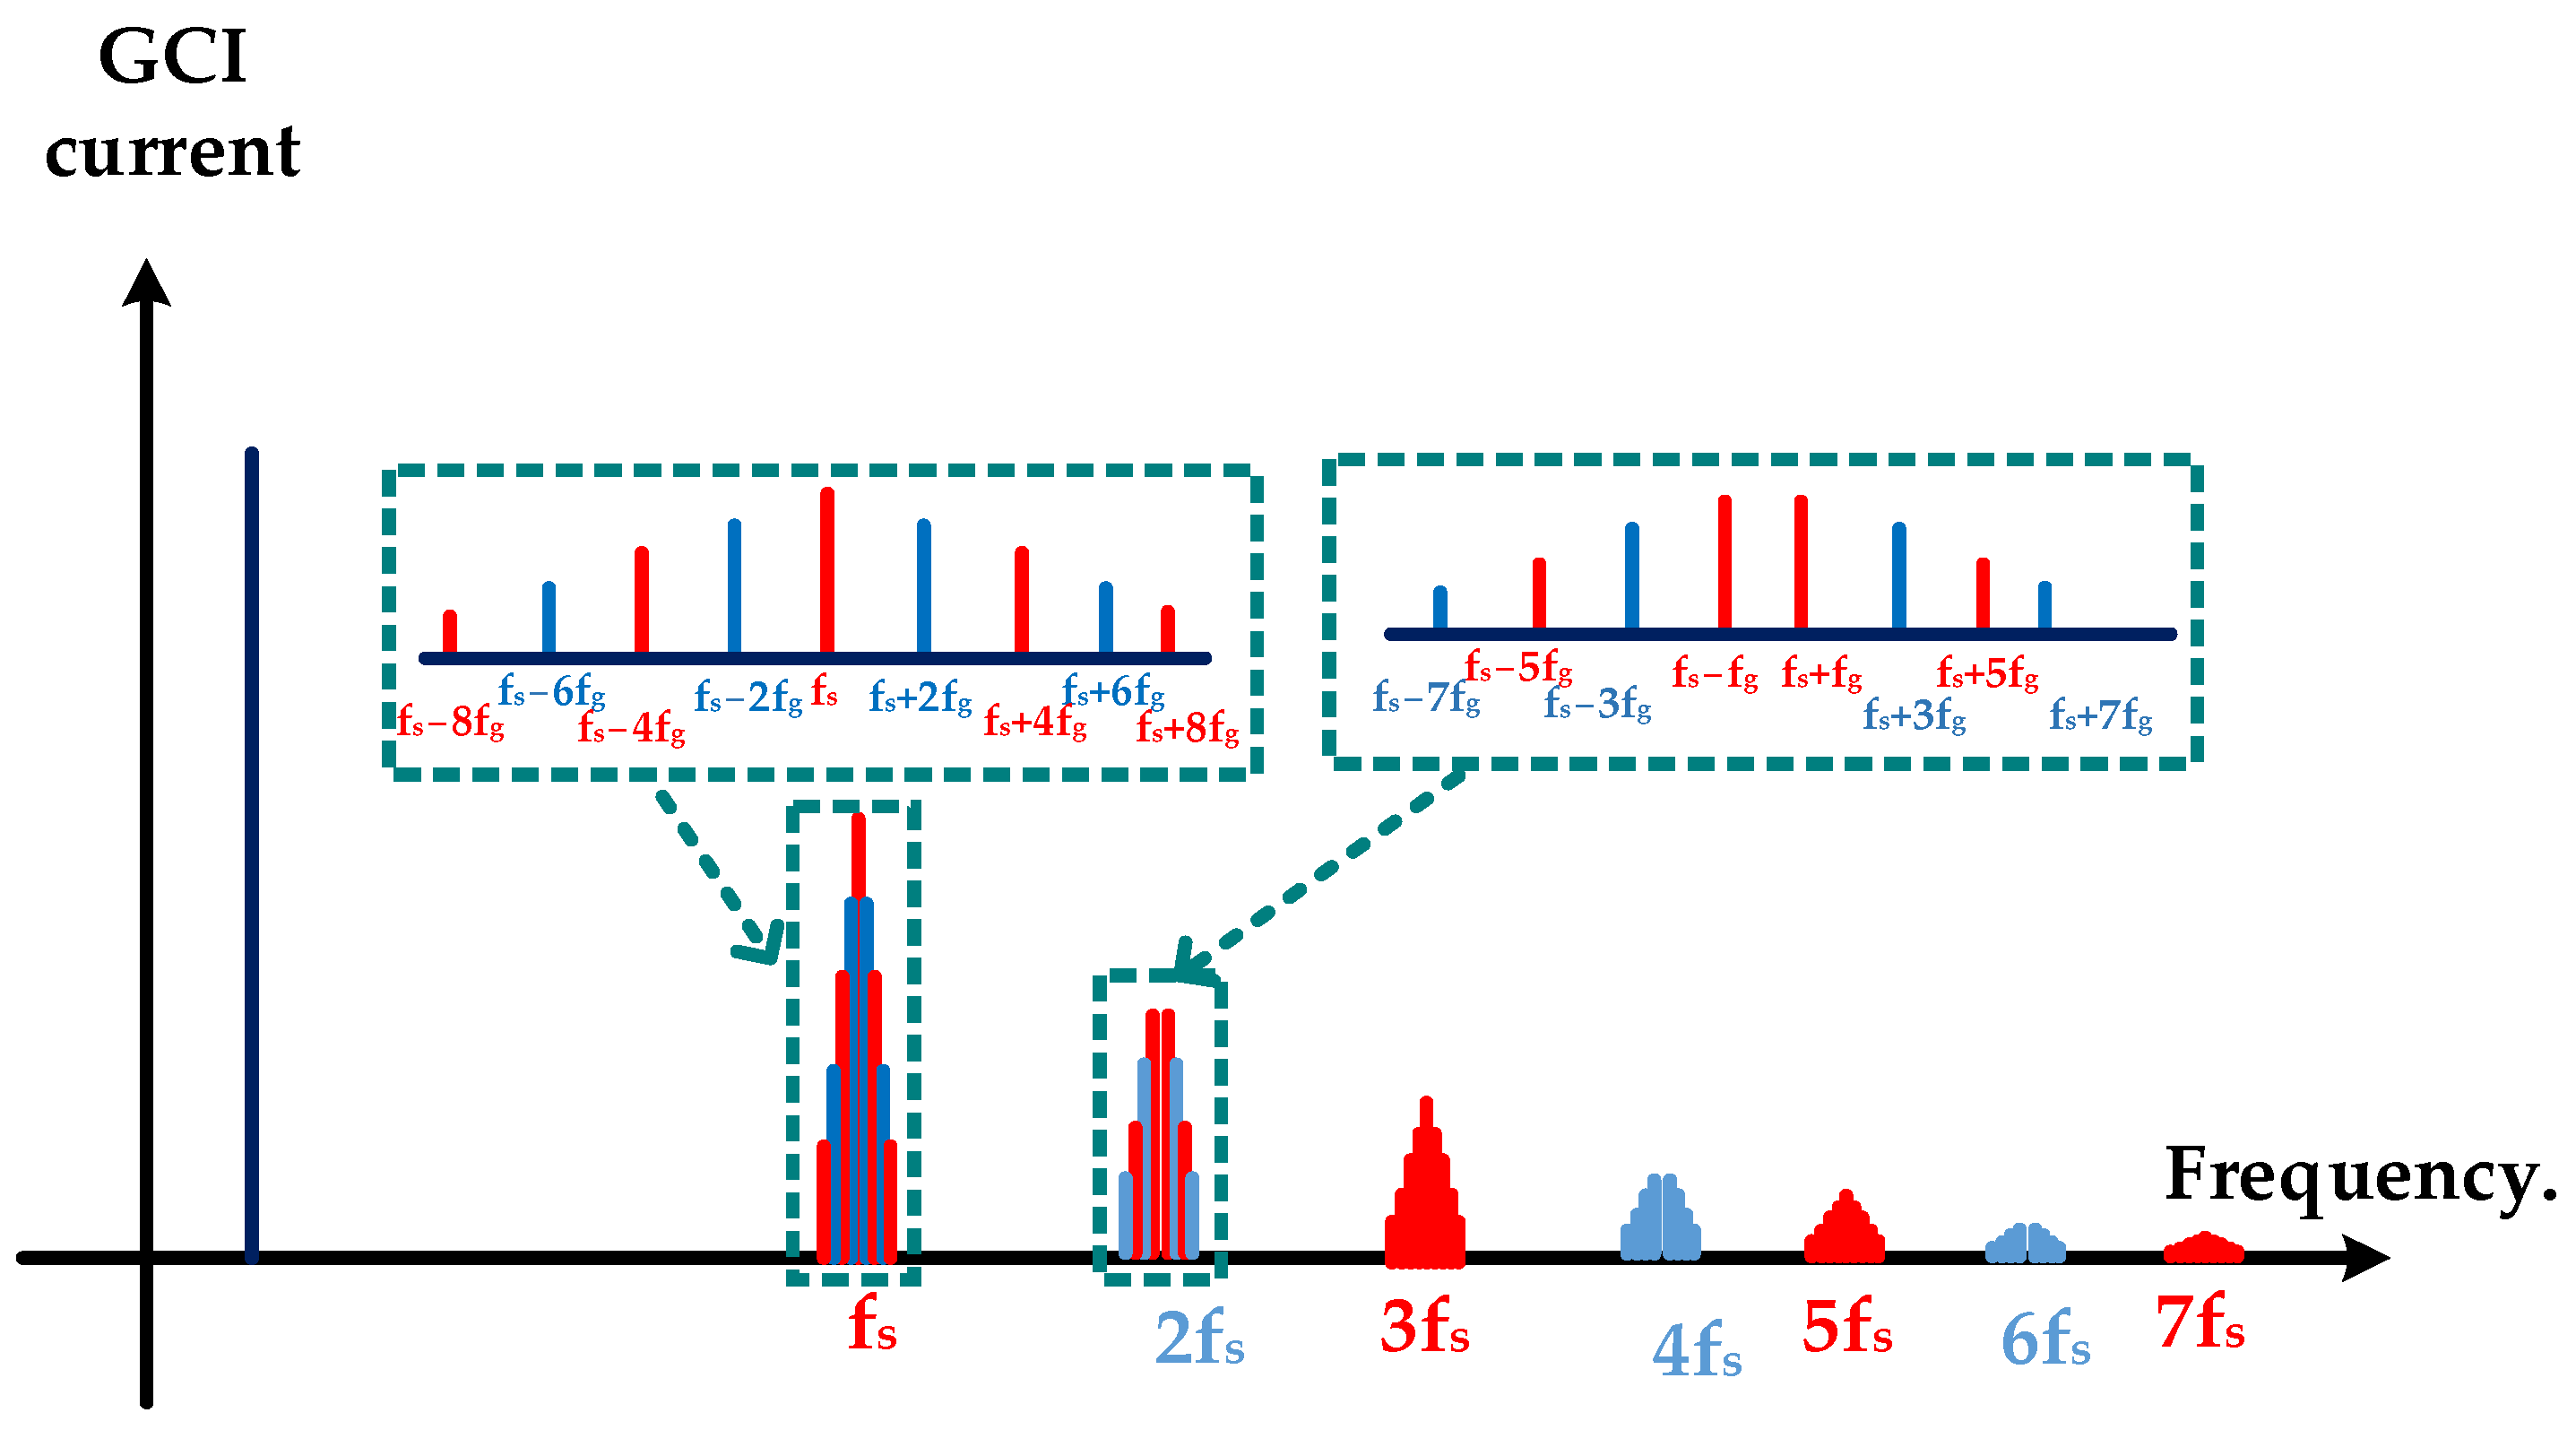
For the currents in Equations (9) and (10), the term increases linearly with the frequency, which in turn highlights the importance of the coupling filter in mitigating the flow of the SHs from GCIs into the grid. Figure 3 gives a graphical representation of the GCI current introduced by Equations (5), (6), (9) and (10).
3. GCI Parameter Effect on the High Frequency Emissions
In case no reactive power is injected into the grid and only active power is generated from the GCI, from power flow rules and from Equation (6), the following is deduced:
Since M is less than one for under modulation, is greater than . As far as is kept constant, is constant. Inversely, changes only when changes under the condition of no reactive power generation.
From Equations (9) and (10), it is clear that the high-frequency harmonic components of the current, located in the SH range, depend on the DC-link voltage, coupling filter inductance and the active power injected represented by the load angle δ in the equations. The carrier harmonics and the sideband harmonics amplitudes in (9) and (10) are affected by the DC-link voltage. Since M is also a function of the DC-link voltage as stated in (11), the relationship between the harmonics amplitude and the DC-link voltage is a non-linear one. This means the amplitude of the harmonics may increase or decrease when the DC-link voltage increases based on the combined effect of the DC-link voltage and the modulation index. But from Equations (9) and (10), there is no effect of the DC-link voltage on the phases of these harmonics.
The effect of the coupling inductance on the amplitude is clearly obvious from Equations (9) and (10). The amplitude of the harmonics and the inductance value are with an inverse relation. The effect of the inductance on the phases of the harmonics is neglected as the filter resistance is neglected with respect to the filter inductance in the SH range.
The active power has no effect on the amplitudes of the harmonics as well as the phases of the carrier harmonics. The only effect of the active power is seen on the phases of the sideband harmonics, as it adds a positive phase shift to the right sideband harmonics (i.e., with positive order n) and a negative phase shift to the left sideband harmonics (i.e., with negative order n).
4. Carrier Phase-Shift Concept to Reduce the Total SH Emissions of Parallel GCIs in DPGSs
In DPGSs, multiple GCIs are connected in parallel to the same PCC to integrate renewable energy sources in the grid (Figure 4). The aggregated SH emissions injected to the grid by means of the parallel GCIs represent one of the main problems of such systems.
The phases of the carrier and sideband harmonics depend mainly on the carrier phase. Then, the switching harmonics phases of the parallel-connected GCIs can be controlled to cancel out each other at the PCC. As a result, the SHs generated from the GCIs flow among the GCIs instead of flowing to the grid. Let N be the number of GCIs connected in parallel to the same PCC, as shown in Figure 4. In order to cancel out N-1 consecutive switching bands and their multiples, the same centralized carrier generator should provide all the GCI controllers with the same carrier but with a phase shift of distributed among them. The concept is effective for the scenario of having symmetric parallel-connected GCIs. In other words, they must have the same value of the DC-link voltage, coupling inductor inductance and injected power. If any of the aforementioned parameters are not the same, the mitigation of the harmonics is not optimal, as discussed in Section 2.
5. Simulation Studies
5.1. GCI Model
The study of the parameters’ effects on the emissions of GCIs in the SH range and their effects on the total emissions of parallel-connected GCIs are studied through two simulations. The simulation studies are carried out through MATLAB/Simulink. The first simulation contains the system shown by Figure 1; the simulation parameters are as listed in Table 1. The controller of the GCI is built using a proportional–resonance (PR) controller to control the current of the GCI. The second simulation contains two parallel GCIs connected to the same PCC. The second simulation is used to study the effect of the parameters symmetry and asymmetry on the total emissions to the grid. The base parameters for both GCIs are listed in Table 1.
5.2. Simulation with One GCI
The simulated current of the GCI in both time and frequency domains under the base parameters is demonstrated in Figure 5. The emissions appear as bands around the switching frequency and its multiples. The current in the time domain is rising and falling linearly with time during the ON and OFF periods, respectively. This in turn confirms the assumption made in the mathematical analysis by neglecting the effect of the inductor and the grid resistances with respect to the coupling filter reactance in the high-frequency range. The value of the resistor is negligible with respect to the inductive reactance in the SH range. The FFT analysis of the GCI current shows that the GCI current contains multiple HF emissions in the SH range. These emissions are divided into the carrier harmonics, which are located at exactly the switching frequency and its odd integer multiple. The remaining HF emissions are located at frequencies affected by both the switching frequency and the grid frequency. These emissions are deduced mathematically by Equations (5), (9) and (10). For purpose of comparison, the harmonics at the 16 kHz switching frequency, 15.9 kHz and 16.1 kHz as sideband harmonics, are taken as examples to monitor while the parameters change.
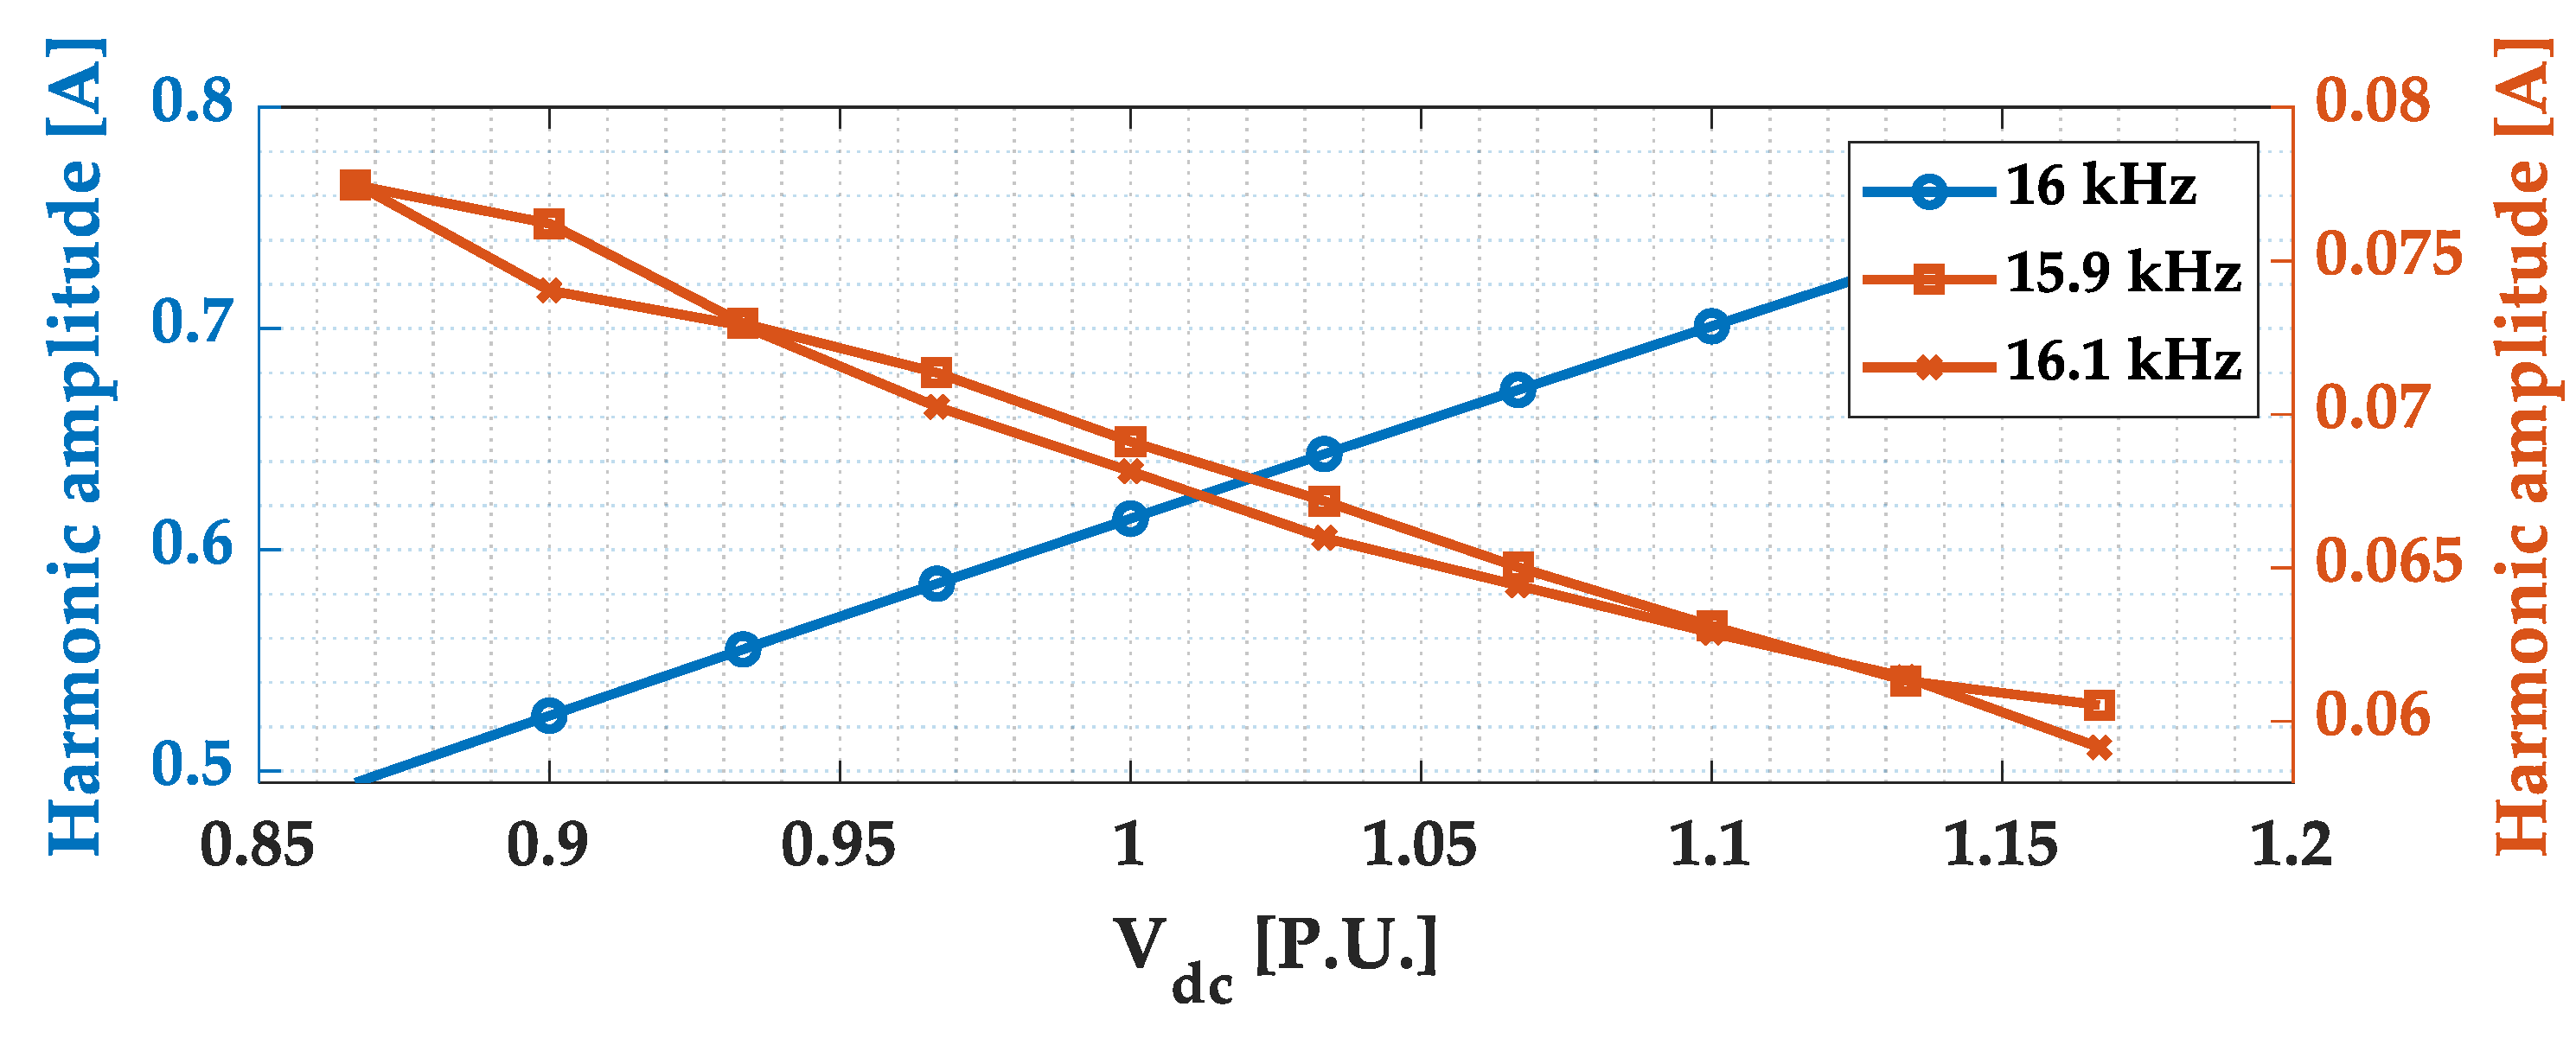
The impact of the DC-link voltage on the harmonics amplitudes is illustrated in Figure 6. It is clear that the sideband harmonics decrease and the carrier harmonics increase as the DC-link voltage increases. This can be explained by the effect of the modulation index on the Bessel function of the first kind found in the equations of the sideband harmonics and carrier harmonics.
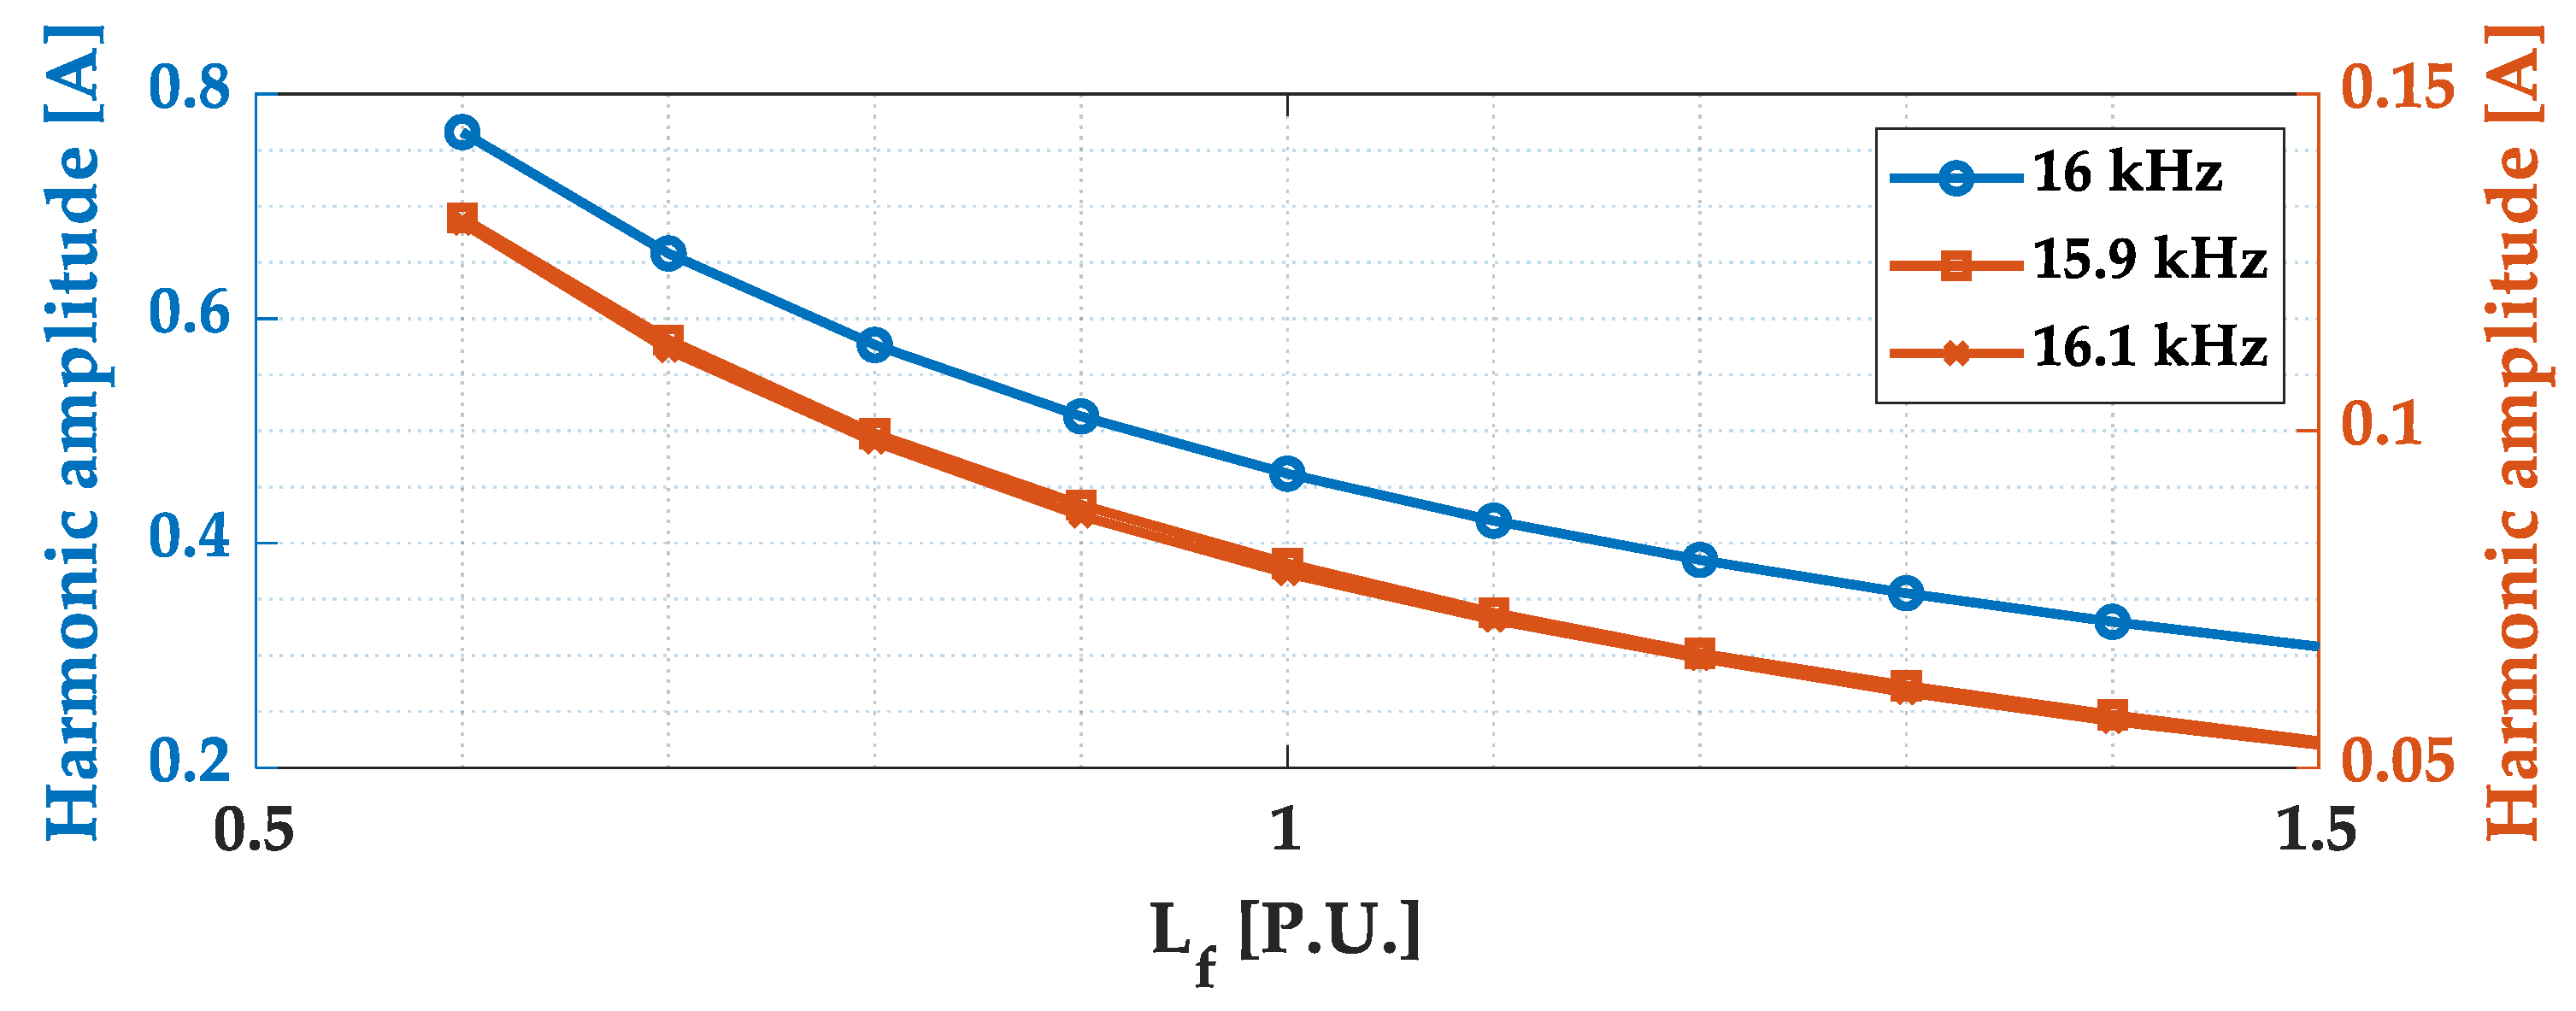
Figure 7 illustrates the effect of the inductance on the chosen harmonics amplitudes. It is obvious from the figure that as the inductance increases, the harmonic amplitudes decrease. The relationship between the inductance and the harmonic amplitudes is an inverse relationship. This is exactly what is concluded by Equations (9) and (10).
The effect of the active power injected into the grid on both the amplitude and the phase of the chosen harmonics is clarified in Figure 8 and Figure 9, respectively. The active power does not have any effect on the amplitudes of the switching harmonics and on the phase of the carrier harmonics. However, the change in the active power affects the phase of the sideband harmonics by adding a positive phase shift for the sideband harmonics with the positive order and a negative phase shift to the ones with the negative order .
The following can be concluded from the simulation study.
- The amplitude of the SH emissions of single-phase GCIs depends on the DC-link voltage and the coupling filter inductance.
- The relationship between the DC-link voltage and SH emissions amplitudes of GCIs is non-linear.
- The amplitudes of the SH emissions of GCIs are in an inverse relationship with the coupling filter inductance.
- The amplitude of the SH emissions of single-phase GCIs are independent of the active power variation.
- The phase of the carrier harmonics is independent of the active power variations
- The active power variation affects only the phase of the sideband harmonics.
5.3. Simulation with Two Parallel GCIs
Two parallel GCIs are now connected to the grid via the same PCC, i.e., . The carrier is generated centrally and distributed among the two GCIs with a phase shift of between them. Each GCI current and the total current injected into the grid is shown in Figure 10 and Figure 11. In Figure 10, the GCIs are under symmetrical condition (1st scenario). This means the DC-link voltages are equal. It is clear that the first switching harmonics band and its odd multiples have been totally cancelled. Only the switching harmonics band around the even multiples of the switching frequency appear in the total grid current. Although the switching frequencies are present in each inverter, the switching frequency and sidebands that are present in the grid are at double switching frequency.
For the asymmetrical scenario (2nd scenario), is changed from 600 to 500 V. The result of this scenario is illustrated in Figure 11. It is clear that the asymmetry in the DC-link voltage leads to an SH emissions asymmetry between the GCIs. This in turn increases the emission to the grid of Scenario 2 when it is compared with Scenario 1.
To study the effect of asymmetry between the parallel-connected GCIs on the total emissions, the weighted total harmonic distortion (WTHD) is used, as introduced in [24]. It is similar to the total harmonic distortion defined in [25] with the assumption that the coupling inductor resistance is neglected with respect to its reactance. The WTHD can be calculated as shown below:
Here, and are the root mean square (RMS) values of fundamental and n-order harmonic components, respectively.
The impact of the DC-link voltage is presented in Figure 12 when the filters inductances and the injected active power are the same. It is apparent that the lower WTHD in the total current occurs only when the two parallel-connected GCIs are symmetric. Moreover, as the asymmetry increases, the WTHD increases.
The effect of changing the coupling filter inductance of the second GCI is presented in Figure 13, keeping the DC-link voltages and active powers symmetric. It is obvious that the lower WTHD occurs only for the symmetric coupling filter. The WTHD increases with the increase in the coupling filter inductance asymmetry.
6. Experimental Verifications
6.1. System Description
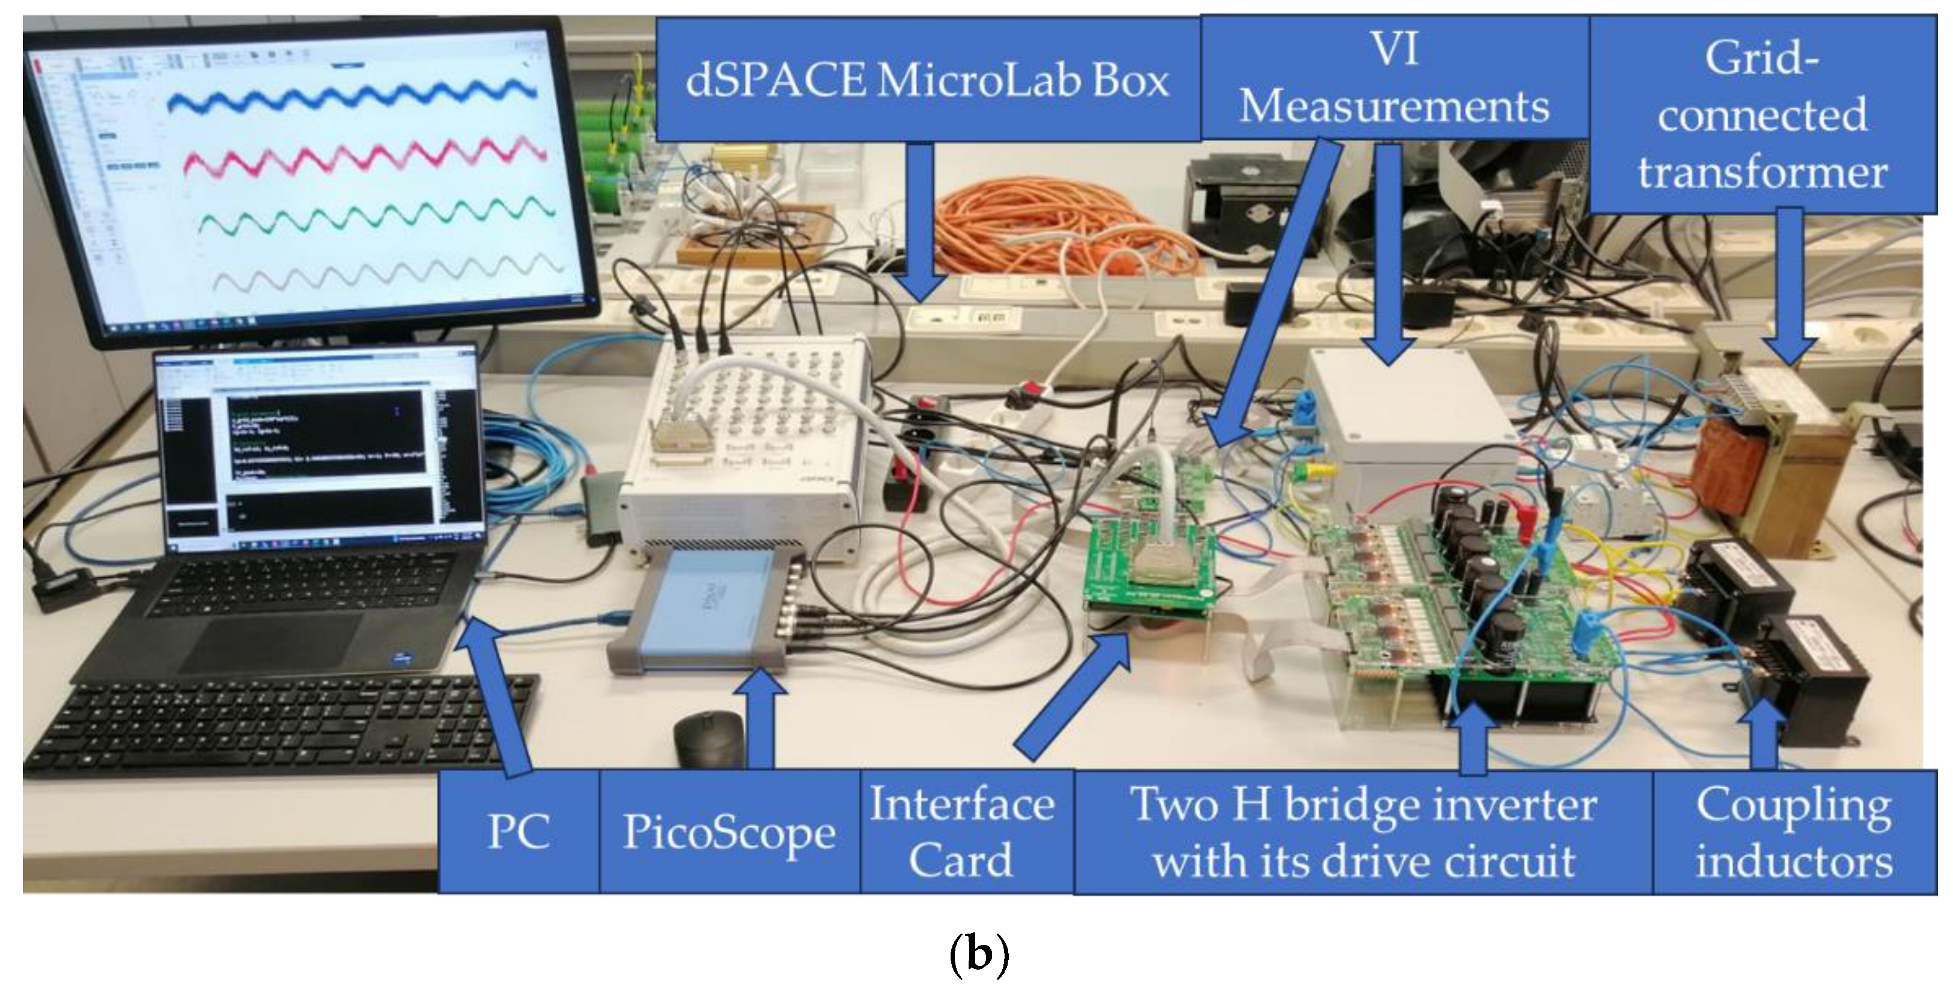
Two experimental setups were built to validate the results of the two simulations (Figure 14). The first model consists of a Taraz inverter with a DC-link energized from a power rectifier. The DC-link capacitor is . A coupling inductor with a base value of is used to connect the inverter to the grid. The DC-link of the inverter is energized with from the same grid. Since the grid voltage peak must be lower than the DC-link voltage, a grid-connected transformer is used to reduce the grid voltage on the inverter side and to provide the isolation function between the DC-link and the grid. The grid voltage on the inverter side is . The voltages and currents are measured by a Taraz VI measurement module with and bandwidths for the current sensors and voltage sensors, respectively. The control algorithm is built using dSPACE rti1102 MicroLabBox. The switching frequency used is . The results are captured by a PicoScope 4000 series with bandwidth. Then, the results are analyzed by MATLAB 2021b software. The second system is a duplicate of the first system except that there are two GCIs connected in parallel.
6.2. Study 1: One GCI
The GCI switches are driven by pulses generated from a sine-triangle modulation. The results in time and frequency domains are illustrated in Figure 15. It is clear that the switching harmonic bands around the odd multiple of the switching frequency contain the carrier harmonic side by side with the sideband harmonics, while only sideband harmonics exist in the switching harmonics bands around the even multiple of the switching frequency. To study the effect of the parameters on the switching harmonics in the SH range, three harmonic examples are taken into account: as a carrier harmonic and and as sideband harmonics.
The first parameter under investigation is the impact of the inductor value. The base value is ; different values are then chosen. The impact on the harmonics is depicted in Figure 16. It is noticeable that as the inductance value increases, the amplitude of the harmonics decreases. The second parameter is the injected power generated by the GCI. The base value is The results are presented in Figure 17. It is clear that the amplitudes of the harmonics are almost constant, and they are independent of the injected active power. The results obtained by simulation and experimental studies meet what is concluded by the mathematical analysis. This in turn confirms the possibility of applying the four assumptions made in the mathematical analysis.
6.3. Study 2: Two Parallel GCIs
Study 2 is carried out by connecting two GCIs in parallel. The GCIs are symmetric in Scenario 1 with . The measured results in both the time and frequency domain are introduced by Figure 18. The carrier harmonic is not totally eliminated due to some small timing differences between the control signals and the response time of the system. But overall, the filtering performance is good with approximately −11.8335 dB. As more GCIs are connected in parallel, lower emissions in the SH range are attained.
Scenario 2 considers two asymmetrical GCIs connected in parallel. This is completed by changing the inductance value of the coupling filter of the second GCI to be , while inductance is used for the first GCI. The variation of the DC-link voltage is omitted from the experimental study due to some practical limitations. The measured result is shown in Figure 19. It is obvious that the filtering performance has deteriorated, and this can be seen clearly in both the time and frequency domains.
7. Conclusions and Future Work
In this paper, a comprehensive analysis of the high-frequency emissions of GCIs in the SH range has been presented. A mathematical analysis has been carried out in order to investigate the parameters that affect the SH amplitudes as well as their phases. It has been concluded that three main factors affect the emissions: the DC-link voltage, the coupling inductance value and the amount of active power injected. The following conclusions have been found:
- The amplitude of the SH emissions of single-phase GCIs depends on the DC-link voltage and the coupling filter inductance.
- The amplitude of the SH emissions of single-phase GCIs is independent of the active power variation.
- The phase of the carrier harmonics is independent of the active power variations
- The active power variation affects only the phase of the sideband harmonics.
Furthermore, as an application of that, the effect of the parameters has been studied for parallel-connected GCIs in DPGSs with equal carrier phase shift. The mathematical analysis has been confirmed through simulation and experimental studies. It is worth mentioning that this study is applicable for GCIs with different sizes and ratings, GCIs based on PWM, and GCIs in DPGSs where the inverters are geographically nearby. Meanwhile, this study is applicable for GCIs based on hysteresis controlling and GCIs that are geographically far apart. Knowing the behavior of these harmonics would help in future research scope, which includes the following:
- Studying deeply the propagations and penetrations of SH of single-phase GCIs in low-voltage grids.
- Studying the interference between single-phase GCIs and any other switching converter, such as switched-mode power supplies and LED lamps, at any residential installation.
- Developing active filters to mitigate the emissions of GCIs in the SH range.
Author Contributions
Conceptualization, A.M.A. and J.K.; methodology, A.M.A. and J.K.; software, A.M.A.; formal analysis, A.M.A. and J.K.; investigation, A.M.A., J.D. and J.K.; resources, A.M.A., J.D. and J.K.; data curation, A.M.A., J.D. and J.K.; writing—original draft preparation, A.M.A.; writing—review and editing, J.D. and J.K.; visualization, A.M.A., J.D. and J.K.; supervision, J.D. and J.K.; project administration, J.K.; funding acquisition, J.K.; All authors have read and agreed to the published version of the manuscript.
Funding
This research is funded by Flanders Innovation & Entrepreneurship (VLAIO) and is part of the cSBO project IMPERFECT (HBC.2021.0175).
Data Availability Statement
Not Applicable.
Conflicts of Interest
The authors declare no conflict of interest.
Abbreviations
The following abbreviations are used in this manuscript:
| DPGS | Distributed power generation system |
| GCI | Grid-connected inverters |
| PCC | Point of common coupling |
| SH | Supraharmonic |
| PV | Photovoltaic |
| PWM | Pulse width modulation |
| HF | High frequency |
| PR | Proportional resonance |
| WTHD | Weighted total harmonic distortion |
Variables
The following variables are used in this manuscript:
| Inverter output voltage | |
| DC-link voltage | |
| Grid angular frequency—reference signal angular frequency | |
| Grid phase—reference signal phase | |
| Carrier angular frequency | |
| Carrier phase | |
| Modulation index | |
| Bessel function of the first kind | |
| Instantaneous value of the grid voltage | |
| The amplitude of the grid voltage | |
| The load angle | |
| The instantaneous current injected to the grid | |
| The instantaneous fundamental current | |
| The instantaneous carrier switching harmonics | |
| The instantaneous sideband current switching harmonics | |
| The coupling filter inductance | |
| The grid inductance | |
| The coupling filter resistance | |
| The grid resistance | |
| RMS | Root mean square |
| RMS values of fundamental | |
| RMS values of n-order harmonic components |
Appendix A. Load Angle Definition in Power Systems
This appendix is added to explain the definition of the load angle mentioned in Equation (3). Let a two bus system be connected through an inductive reactance . The phasor voltage of the first bus is , while the phasor voltage of the second bus is . The conditions needed to have only an active power, flowing from bus 1 to bus 2:
In this case, the load angle is defined as the phase difference between the and as:
Figure A1.
Two-bus power system.

For the mathematical analysis in Section 2, the inverter output voltage is considered as bus 1, while the grid voltage is considered as bus 2, and the coupling filter works as inductance that connects the two buses. As the power flows from the GCI into the grid, then the fundamental voltage of leads the grid voltage by the load angle .
References
- Blaabjerg, F.; Teodorescu, R.; Liserre, M.; Timbus, A.V. Overview of control and grid synchronization for distributed power generation systems. IEEE Trans. Ind. Electron. 2006, 53, 1398–1409. [Google Scholar] [CrossRef]
- Blaabjerg, F.; Chen, Z.; Kjaer, S.B. Power electronics as efficient interface in dispersed power generation systems. IEEE Trans. Power Electron. 2004, 19, 1184–1194. [Google Scholar] [CrossRef]
- Meyer, J.; Bollen, M.; Amaris, H.; Blanco, A.M.; de Castro, A.G.; Desmet, J.; Klatt, M.; Kocewiak, Ł.; Rönnberg, S.; Yang, K. Future work on harmonics-some expert opinions Part II-supraharmonics, standards and measurements. In Proceedings of the 2014 16th International Conference on Harmonics and Quality of Power (ICHQP), Bucharest, Romania, 25 May 2014; IEEE: Piscataway, NJ, USA; pp. 909–913. [Google Scholar]
- Alfalahi, S.T.; Alkahtani, A.A.; Al-Shetwi, A.Q.; Al-Ogaili, A.S.; Abbood, A.A.; Mansor, M.B.; Fazea, Y. Supraharmonics in power grid: Identification, standards, and measurement techniques. IEEE Access 2021, 9, 103677–103690. [Google Scholar] [CrossRef]
- CLC/TR 50669:2017; Investigation Results on Electromagnetic Interference in the Frequency Range Below 150 kHz. NSAI Standards, Irish Standard Recommendation, S.R. Gelenec: Dublin, Ireland, 2018.
- CLC/TR 50627; Study Report on Electromagnetic Interference between Electrical Equipment/Systems in the Frequency Range Below 150 kHz. NSAI Standards, Irish Standard Recommendation, S.R. NSAI: Dublin, Ireland, 2013.
- Sakar, S.; Rönnberg, S.; Bollen, M.H. Immunity test of LED lamps based on IEC 61000-4 19 and unexpected consequence. In Proceedings of the 2018 18th International Conference on Harmonics and Quality of Power (ICHQP), Ljubljana, Slovenia, 13 May 2018; IEEE: Piscataway, NJ, USA; pp. 1–6. [Google Scholar]
- IEC 61000-4-19:2014; Part 4-19: Testing and Measurement Techniques—Test for Immunity to Conducted, Differential Mode Disturbances and Signalling in the Frequency Range 2 kHz to 150 kHz at a.c. Power Ports. International Electrotechnical Commission: Geneva, Switzerland, 2014.
- Kirchhoff, J.; Klein, G. Results of the OPTINOS project-deficits and uncertainties in photovoltaic inverter test procedure. In Proceedings of the 24th European Photovoltaic Solar Energy Conference and Exhibition 2009, Hamburg, Germany, 21–25 September 2009. [Google Scholar]
- Sakar, S.; Rönnberg, S.; Bollen, M. Interferences in AC–DC LED drivers exposed to voltage disturbances in the frequency range 2–150 kHz. IEEE Trans. Power Electron. 2019, 34, 11171–11181. [Google Scholar] [CrossRef]
- Sakar, S.; Rönnberg, S.K.; Bollen, M. Interharmonic emission in AC–DC converters exposed to nonsynchronized high-frequency voltage above 2 kHz. IEEE Trans. Power Electron. 2020, 36, 7705–7715. [Google Scholar] [CrossRef]
- Wang, Y.; Luo, D.; Xiao, X. Evaluation of supraharmonic emission levels of multiple grid-connected VSCs. IET Gener. Transm. Distrib. 2019, 13, 5597–5604. [Google Scholar] [CrossRef]
- Darmawardana, D.; Perera, S.; Robinson, D.; Ciufo, P.; Meyer, J.; Klatt, M.; Jayatunga, U. Investigation of high frequency emissions (supraharmonics) from small, grid-tied, photovoltaic inverters of different topologies. In Proceedings of the 2018 18th International Conference on Harmonics and Quality of Power (ICHQP), Ljubljana, Slovenia, 13 May 2018; IEEE: Piscataway, NJ, USA; pp. 1–6. [Google Scholar]
- Espín-Delgado, Á.; Rönnberg, S. Modeling and Analysis of Supraharmonic Propagation for Stochastic Studies. IEEE Trans. Power Deliv. 2022, 37, 4899–4910. [Google Scholar] [CrossRef]
- Menti, A.; Barkas, D.; Kaminaris, S.; Psomopoulos, C.S. Supraharmonic emission from a three-phase PV system connected to the LV grid. Energy Rep. 2021, 7, 527–542. [Google Scholar] [CrossRef]
- Darmawardana, D.; Perera, S.; Robinson, D.; Meyer, J.; Jayatunga, U. Important Considerations in Development of PV Inverter Models for High Frequency Emission (Supraharmonic) Studies. In Proceedings of the 2020 19th International Conference on Harmonics and Quality of Power (ICHQP), Dubai, United Arab Emirates, 6 July 2020; IEEE: Piscataway, NJ, USA; pp. 1–6. [Google Scholar]
- Espín-Delgado, Á.; Busatto, T.; Ravindran, V.; Rönnberg, S.K.; Meyer, J. Evaluation of supraharmonic propagation in LV networks based on the impedance changes created by household devices. In Proceedings of the 2020 IEEE PES Innovative Smart Grid Technologies Europe (ISGT-Europe), The Hague, The Netherlands, 26 October 2020; IEEE: Piscataway, NJ, USA; pp. 754–758. [Google Scholar]
- Aboutaleb, A.M.; Roumeliotis, G.G.; Desmet, J.; Knockaert, J. Analysis of transmission line modelling in the MATLAB/Simscape software package. In Proceedings of the 27th International Conference on Electricity Distribution (CIRED 2023), Rome, Italy, 12–15 June 2023; Institution of Engineering and Technology (IET): London, UK, 2023; pp. 4009–4013. [Google Scholar] [CrossRef]
- Rönnberg, S.; Bollen, M. Measurements of primary and secondary emission in the supraharmonic frequency range, 2–150 kHz. In Proceedings of the International Conference and Exhibition on Electricity Distribution, Guangzhou, China, 15–18 June 2015. [Google Scholar]
- Rönnberg, S.K.; Bollen, M.H.J.; Amaris, H.; Chang, G.W.; Gu, I.Y.H.; Kocewiak, Ł.H.; Meyer, J.; Olofsson, M.; Ribeiro, P.F.; Desmet, J. On waveform distortion in the frequency range of 2–150 kHz-Review and research challenges. Electr. Power Syst. Res. 2017, 150, 1–10. [Google Scholar] [CrossRef]
- Solatialkaran, D.; Khajeh, K.G.; Zare, F. A novel filter design method for grid-tied inverters. IEEE Trans. Power Electron. 2020, 36, 5473–5485. [Google Scholar] [CrossRef]
- He, S.; Liu, B. Distributed Carrier Phase Shifting Control Method for Modular Interleaved Parallel Inverters. IEEE Trans. Transp. Electrif. 2022, 9, 2497–2508. [Google Scholar] [CrossRef]
- Poon, J.; Johnson, B.; Dhople, S.V.; Rivas-Davila, J. Decentralized carrier phase shifting for optimal harmonic minimization in asymmetric parallel-connected inverters. IEEE Trans. Power Electron. 2020, 36, 5915–5925. [Google Scholar] [CrossRef]
- Holmes, D.G.; Lipo, T.A. Pulse Width Modulation for Power Converters: Principles and Practice; John Wiley & Sons: Hoboken, NJ, USA, 2003. [Google Scholar]
- IEEE Std 519-2014 (Revision of IEEE Std 519-1992); IEEE Recommended Practice and Requirements for Harmonic Control in Electric Power Systems. IEEE: Piscataway, NJ, USA, 2014; pp. 1–29. [CrossRef]
Figure 1.
Single-phase GCI structure. Here, is the DC-link voltage; and are the switches of the inverter; is the instantaneous value of the GCI current; is the coupling filter inductance, is the instantaneous value of the inverter output voltage between points A and B; and are the grid resistance and inductance, respectively; and is the instantaneous value of the grid voltage.

Figure 2.
Sine-triangle modulation for driving the semiconductor switches of the single-phase GCI. Here, is the modulation index; is the reference signal angular frequency; is the control signal phase; is the carrier signal angular frequency.
Figure 2.
Sine-triangle modulation for driving the semiconductor switches of the single-phase GCI. Here, is the modulation index; is the reference signal angular frequency; is the control signal phase; is the carrier signal angular frequency.

Figure 3.
GCI current spectrum based on sine-triangle modulation.

Figure 4.
Parallel GCIs in a DPGS.

Figure 5.
GCI current (a) in the time domain, (b) in the frequency domain.

Figure 6.
Effect of the DC-link voltage on the amplitude of the chosen harmonic examples.

Figure 7.
Effect of the coupling filter inductance on the amplitude of the harmonics.

Figure 8.
Effect of the active power on the amplitude of the chosen harmonic examples.

Figure 9.
Effect of the active power on the phase of the chosen harmonic examples.

Figure 10.
GCIs and the total grid currents under symmetry scenario (a) in time and (b) in frequency.
Figure 10.
GCIs and the total grid currents under symmetry scenario (a) in time and (b) in frequency.

Figure 11.
GCIs and the total grid currents under asymmetry scenario (a) in time and (b) in frequency.
Figure 11.
GCIs and the total grid currents under asymmetry scenario (a) in time and (b) in frequency.

Figure 12.
Effect of changing GCI2 DC-link voltage value on the grid current WTHD.

Figure 13.
Effect of changing GCI2 inductance value on the grid current WTHD.

Figure 14.
Experimental setup. (a) Study 1, and (b) Study 2.


Figure 15.
Measured GCI current (a) in time domain and (b) in frequency domain.

Figure 16.
Effect of changing the coupling inductance on the amplitude of the chosen harmonic examples.
Figure 16.
Effect of changing the coupling inductance on the amplitude of the chosen harmonic examples.

Figure 17.
Effect of changing the active power on the amplitude of the chosen harmonic examples.

Figure 18.
The results of two symmetric parallel-connected GCIs (a) as a function of time and (b) as a function of frequency.
Figure 18.
The results of two symmetric parallel-connected GCIs (a) as a function of time and (b) as a function of frequency.

Figure 19.
The results of two asymmetric parallel-connected GCI (a) as a function of time and (b) as a function of frequency.
Figure 19.
The results of two asymmetric parallel-connected GCI (a) as a function of time and (b) as a function of frequency.


Table 1.
Simulation parameters.
| Parameter | Value |
|---|---|
| DC-link voltage | 600 V |
| Switching frequency | 16 kHz |
| Coupling filter inductance | , 10 mH |
| Injected active power | 1.6263 kW |
| Grid impedance | |
| Grid voltage and frequency | 230 Vrms, 50 Hz |
Disclaimer/Publisher’s Note: The statements, opinions and data contained in all publications are solely those of the individual author(s) and contributor(s) and not of MDPI and/or the editor(s). MDPI and/or the editor(s) disclaim responsibility for any injury to people or property resulting from any ideas, methods, instructions or products referred to in the content. |
© 2023 by the authors. Licensee MDPI, Basel, Switzerland. This article is an open access article distributed under the terms and conditions of the Creative Commons Attribution (CC BY) license (https://creativecommons.org/licenses/by/4.0/).
Share and Cite
MDPI and ACS Style
Aboutaleb, A.M.; Desmet, J.; Knockaert, J. Impact of Grid-Connected Inverter Parameters on the Supraharmonic Emissions in Distributed Power Generation Systems. Machines 2023, 11, 1014. https://doi.org/10.3390/machines11111014
AMA Style
Aboutaleb AM, Desmet J, Knockaert J. Impact of Grid-Connected Inverter Parameters on the Supraharmonic Emissions in Distributed Power Generation Systems. Machines. 2023; 11(11):1014. https://doi.org/10.3390/machines11111014
Chicago/Turabian StyleAboutaleb, Abdellatif M., Jan Desmet, and Jos Knockaert. 2023. "Impact of Grid-Connected Inverter Parameters on the Supraharmonic Emissions in Distributed Power Generation Systems" Machines 11, no. 11: 1014. https://doi.org/10.3390/machines11111014
Note that from the first issue of 2016, this journal uses article numbers instead of page numbers. See further details here.