Article

Influence of Loading Rate on the Hydrogen-Assisted Micro-Damage in Bluntly Notched Samples of Pearlitic Steel

Fracture & Structural Integrity Research Group, University of Salamanca, 37008 Salamanca, Spain
*
Author to whom correspondence should be addressed.
These authors contributed equally to this work.
Metals 2016, 6(1), 11; https://doi.org/10.3390/met6010011
Submission received: 30 October 2015 / Revised: 21 December 2015 / Accepted: 25 December 2015 / Published: 4 January 2016
(This article belongs to the Special Issue The Role of MnS Inclusions in the Localized Corrosion of Carbon Steel)

Abstract

:
The influence of loading rate (crosshead speed) on the fracture process of bluntly notched samples of pearlitic steel under hydrogen environment is analyzed in this paper. Results indicate that the location of the zone where fracture initiates (fracture process zone) in pearlitic steel samples with a blunt notch directly depends on the loading rate or crosshead speed. For slow testing rates, such a zone is placed in the specimen center due to hydrogen diffusion towards the prospective fracture places located in the central area of the section. On the other hand, in the case of high testing rates, the process of hydrogen-assisted fracture initiates near the sample periphery, i.e., in the vicinity of the notch tip, because in such quick tests hydrogen does not have enough time to diffuse towards inner points of the specimen.

Graphical Abstract

1. Introduction

Prestressing steel wires are highly susceptible to hydrogen embrittlement (HE) or hydrogen assisted fracture (HAF) in cathodic environments [1,2,3,4,5]. Under such environmental conditions, hydrogen diffuses towards the internal regions of the material sample and can reach a critical concentration dependent on the stress-stain state at a given point and at a specific time [6].
With regard to the influence of the loading rate, previous analyses [7,8,9,10] showed the inverse relationship between HE susceptibility and strain rate, i.e., the lower the loading rate, applied displacement rate or crosshead speed during the test, the higher the hydrogen degradation in the sample. In this paper, the influence of the loading rate is shown in the micro-fracture maps (MFMs) appearing after fracture in bluntly notched samples of high-strength pearlitic steel tested in a hydrogenating environment.
MFMs of notched samples of the same material were shown in a previous paper by the authors containing experimental results [11] for high loading rates (0.01 mm/min). This paper goes further in the analysis, including several new contributions: (i) a new MFM appearing after fracture after testing at low loading rates (0.001 mm/min); and (ii) a numerical explanation of this MFM by using stress-assisted hydrogen diffusion models.
Although the notch machining in the wires could affect the generation of dislocations in the material at the very local level (just at the close vicinity of the notch tip), the main dislocations presented in the material are due to cold drawing. According to [12], the local stress in the notch vicinity is not affected by screw dislocations but the position of edge dislocations influences the stress state distribution. Anyway, the key issue in the studies with notched geometries is the triaxial stress state generated in the material when an external loading is applied [13], which directly affects the distribution of stresses within the material, and thereby the hydrogen diffusion and fracture behaviour.

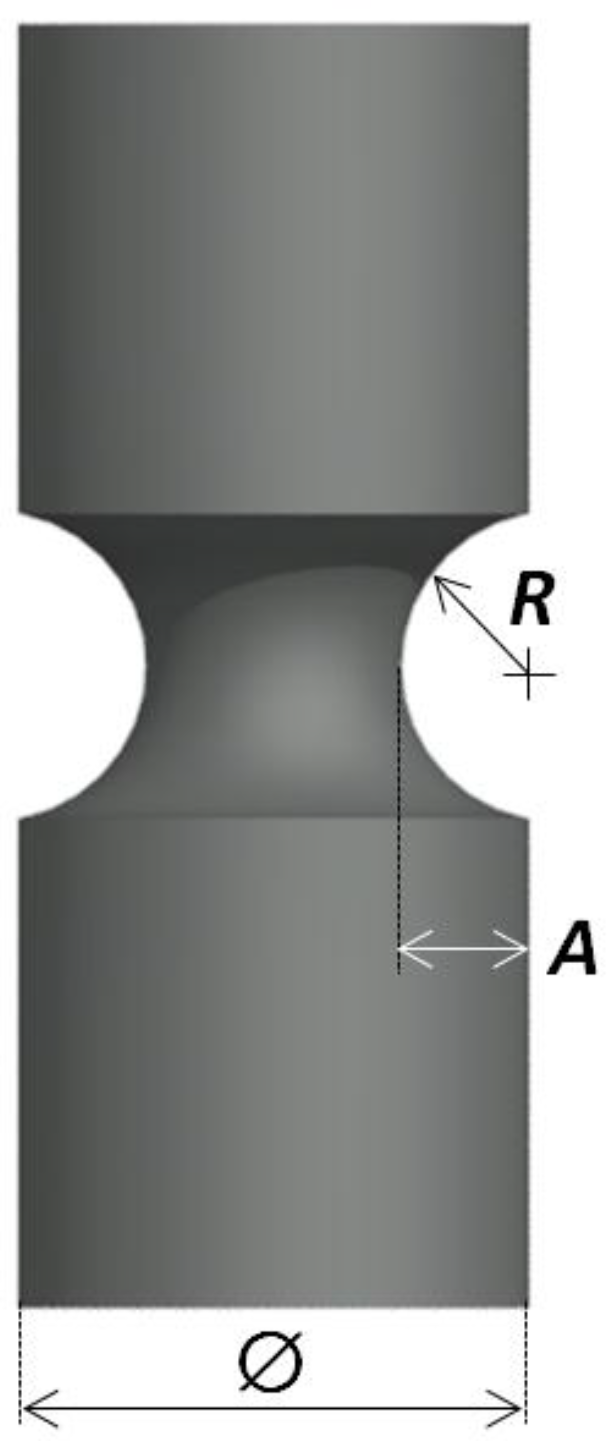
2. Experimental Procedure
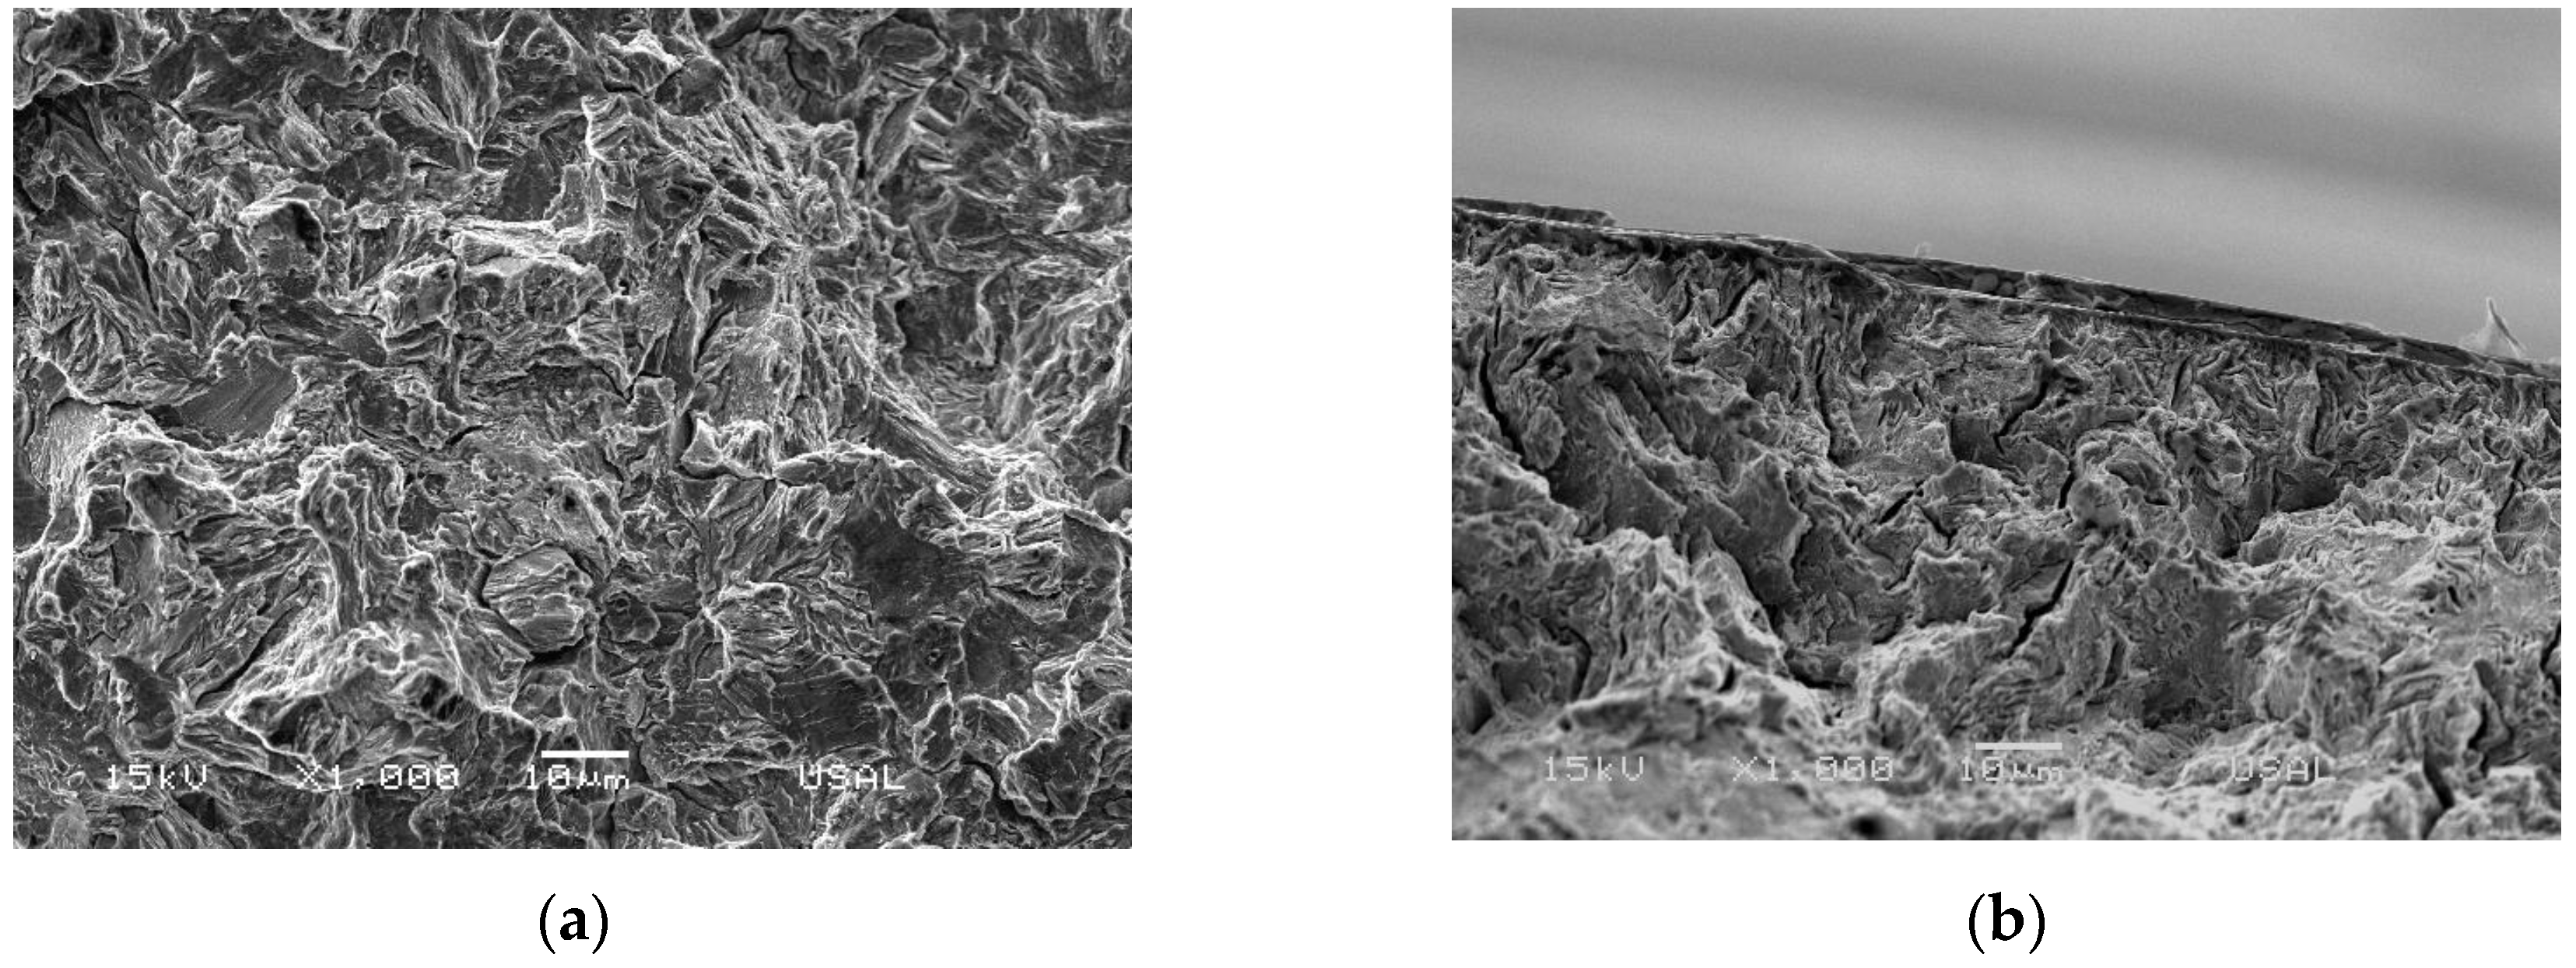
Pearlitic steel samples were used in this work. Different degrees of cold drawing were chosen from the initial hot rolled bar up to the commercial prestressing steel wire (C 0.800%, Mn 0.690%, Si 0.230%, P 0.012%, S 0.009%, Al 0.004%, Cr 0.265%, V 0.060%). Cold drawing consists of the pass of the steel wire through a hard die, thus obtaining a new wire with a smaller transverse section [14]. To obtain commercial prestressing steels, it is necessary to carry out several progressive reductions, i.e., cold drawing is a multi-pass process.
Cumulative straining by cold drawing induces material microstructure changes [15,16,17,18,19] in the form of progressive slenderizing and orientation of pearlitic colonies in the cold drawing direction [20,21], as well as densification and orientation of pearlite (ferrite/cementite) lamellae in that direction [22,23].
The aforesaid microstructural changes directly affect hydrogen diffusion in the steel, as shown in Figure 1 where three drawing levels appear: hot rolled bar (0 steps of cold drawing, Figure 1a), prestressing steel wire (6 steps of cold drawing, Figure 1c), and an intermediate steel in the drawing chain (3 steps of cold drawing, Figure 1b). A metallographic study with scanning electron microscopy (SEM, JEOL model JSM-SG 20LV, Tokyo, Japan) was carried out to obtain the micrographs observed in Figure 1. Previously, the material was polished and chemically etched with Picral during 4–5 s.
Apart from the microstructural orientation of pearlite, another factor affecting hydrogen diffusion in the different steels is the density of non-metallic inclusions due to the interactions between inclusions and hydrogen [24,25]. In the matter of mechanical properties, yield strength (σY) and ultimate tensile strength (UTS) are shown in Figure 1 for the three selected drawing levels.
Figure 1. Micrographs of longitudinal (L) and transverse (T) sections of steels at different levels of cold drawing: (a) 0 steps, hot rolled bar; (b) 3 steps; (c) 6 steps, prestressing steel.
Metals 06 00011 g001
Specimens for testing were axisymmetric bluntly-notched bars (see Figure 2) with the relative dimensions A/Ø = 0.30 and R/Ø = 0.40, where A is the notch depth, R the notch radius and Ø the wire diameter (changing with cold drawing from 12 mm in the hot rolled bar to 7 mm in the commercial prestressing steel wire, 8.9 mm being the diameter on the intermediate wire). Notches were machined in each wire after cold drawing, maintaining in all cases the same relative dimensions (those given at the beginning of this paragraph).
Figure 2. Round notched geometry used in the tests.
Metals 06 00011 g002
The specimens were subjected to constant extension rate tensile (CERT) tests in which the cathodic electrochemical conditions promoted HE. An aqueous solution of Ca(OH)2 with 0.1 g/L of NaCl (pH 12.5) was used in a cell connected to a potentiostat applying a constant potential of −1200 mV SCE. In Figure 3 a scheme of the experimental setup is shown, including the three electrodes: saturated calomel electrode (SCE), working electrode (steel specimen) and auxiliary electrode (Pt). According to previous studies [26], these electrochemical conditions promote HE. Two crosshead speeds (or applied displacement rates) were chosen in this work: (i) 0.001 mm/min (relatively low speed: quoted as type 1), and (ii) 0.01 mm/min (relatively high speed: quoted as type 2).
Figure 3. Constant extension rate tensile (CERT) test under cathodic electrochemical conditions including a detailed view of the electrochemical cell.
Metals 06 00011 g003

3. Fractography

In a previous paper by the authors [11], different fracture topographies were found in notched samples of progressively drawn steel under HE environmental conditions, namely: (i) the so-called tearing topography surface or TTS [27,28] associated with hydrogen-assisted micro-damage in pearlitic steels [29]; (ii) ductile microvoid coalescence (MVC); (iii) a non-conventional microscopic mode called quasi-MVC (and noted as MVC* throughout this paper), consisting of a partially ductile zone with particular appearance resembling MVC that could be seen as candidate to TTS in which hydrogenation is not enough [30,31] and (iv) brittle cleavage (C).
This paper goes further in the fractographic analysis to study the kinematic effects on the MFMs, i.e., the influence of the loading rate (or crosshead speed) on the micromechanisms of fracture. Figure 4 and Figure 5 show the fractographs for speeds type 1 and type 2, respectively. They were obtained by means of a SEM and using a low magnification factor, thereby providing enlarged views of the real fracture surfaces after the CERT tests. In all pictures the first digit represents the drawing degree (0, 3 and 6 indicating the number of drawing steps undergone by the steel) and the second one the crosshead speed (1 and 2 indicating respectively the low and high loading rates).
Figure 4. Micro-fracture maps (MFMs) for low loading rate (crosshead speed type 1 of 0.001 mm/min): (a) hot rolled steel (base material that is not cold drawn at all); (b) three drawing steps; (c) six drawing steps (heavily-drawn commercial prestressing steel).
Metals 06 00011 g004
The location of the MVC* region in the fracture surface depends on the crosshead speed. In the case of high speed (type 2, Figure 5), fracture initiation by TTS takes place at the sample periphery. Figure 6 shows the fractographic appearance of the TTS zone obtained by SEM for two drawing degrees (hot rolled bar and prestressing steel). In previous analyses [29,30] it was clearly demonstrated that the TTS region is associated with hydrogen-assisted micro-damage in pearlite at the finest microscopical level, its size being linked to the mechanical (geometry and type of loading) and electrochemical (pH and potential) characteristics of the HE tests [29]. Therefore, the TTS domain is an experimental evidence of the fracture process zone (FPZ) due to hydrogen effects, i.e., such an area is precisely where fracture initiates by a HE mechanism. Later, subcritical cracking advances towards the inner points, creating MVC* regions, up to reaching a critical instant of fracture in which sudden final fracture happens by brittle cleavage (C) with isolated MVC areas. This fully agrees with the three MFM schemes described in previous research [11].
Figure 5. Micro-fracture maps (MFMs) for high loading rate (crosshead speed type 2 of 0.01 mm/min): (a) hot rolled steel (base material that is not cold drawn at all); (b) three drawing steps; (c) six drawing steps (heavily-drawn commercial prestressing steel).
Metals 06 00011 g005
On the other hand, in the case of cold drawn steels tested at low speed (type 1, Figure 4), the FPZ appears at the wire core (center of the sample) and progresses towards the periphery, i.e., just the opposite of the MFM schemes described previously in [11]. Figure 4 shows how the FPZ is placed in the internal area, exhibiting a mixed fractography consisting of both TTS and MVC*. This experimental fact suggests that, in this case of slow loading rate, hydrogen diffuses towards the inner points and promotes fracture initiation in that area up to reaching the critical concentration. At the critical instant, final fracture takes place by a micromechanism similar to that obtained in standard tension tests, i.e., cup and cone ductile fracture.
Figure 6. Hydrogen-assisted micro-damage (TTS) in wires after CERT tests: (a) hot rolled steel, speed type 1 (Figure 4a); (b) prestressing steel, speed type 2 (Figure 5c).
Metals 06 00011 g006
Figure 7 summarizes the four models of MFM found in the fractographic analysis. The first three are in agreement with previous research [11]: model I (Figure 7a), model II (Figure 7b) and model III (Figure 7c) and all of them are associated with surface (peripherical) initiation of HAF in the vicinity of the notch tip. In the fourth model (IV) represented in Figure 7d the HAF process initiates at the center of the cross-sectional area of the specimen and propagates radially towards the periphery.
Figure 7. Schemes of the different models of micro-fracture map (MFM) in bluntly-notched samples of pearlitic steel under hydrogen embrittlement (HE) environmental conditions: (a) model I; (b) model II; (c) model III; (d) model IV.
Metals 06 00011 g007
The four models of MFM appearing in the different HE tests on bluntly-notched specimens of pearlitic steel are given in Table 1 for each loading rate (crosshead speed) and all drawing degrees (microstructural orientation). For hot rolled material and slightly drawn steels undergoing only one drawing step, the FPZ is localized in the form of surface flaw (model I of MFM) or shallow quasi-circumferential crack (model II of MFM).
Table 1. Models of MFM for each loading rate (crosshead speed) and drawing degree.
Loading Rate (Crosshead Speed)Cold Drawing Step
0123456
Type 1 (0.001 mm/min)IIIIVIVIVIVIV
Type 2 (0.01 mm/min)IIIIIIIIIIIIIIIIII
As the drawing degree increases, the MFMs evolve towards an axisymmetric shape due to a double effect [11]: (i) increase of material anisotropy produced by microstructural orientation (barrier effect created by cementite alignment tending to the wire axis or cold drawing direction); and (ii) more uniform microstructure as a consequence of the aforesaid orientation, thereby promoting an axisymmetric FPZ of the models III and IV.
For cold drawn steels undergoing at least two drawing steps and subjected to quick HE tests (type 2), the MFM corresponds to model III, i.e., HAF initiates at the sample surface or periphery (notch tip), whereas the same drawn steels subjected to slow HE tests (type 1) exhibit central HAF initiation at the inner points (model IV) due to the fact that hydrogen does have enough time to diffuse towards such inner areas of the sample.
To evaluate the HE susceptibility of the analyzed steels, Figure 8 plots the variation with the drawing degree of the ratio FHE/F0 where FHE is the critical force (maximum value; fracture instant) in cathodic environment and F0 is the same in air, considering the two loading rates used in the tests (0.001 mm/min and 0.01 mm/min). The role of the loading rate in CERT tests is only noticeable after the fourth drawing step, with a clear effect on the final commercial prestressing steel wire. Thus, samples tested with the lower loading rate (0.001 mm/min) exhibit a higher HE susceptibility than those tested with higher loading rate (0.01 mm/min).
There is no clear relationship between the fracture surface morphologies (models I to IV, Table 1) and the degree of susceptibility to HE (Figure 8). In addition, the visual aspect of the fracture surface after testing similar specimens in an inert environment is quite similar to that appearing after CERT tests under low loading rates (0.001 mm/min) [32], i.e., the fracture path follows a transversal plane of the wire (mode I in the fracture mechanics sense). On the other hand, a deflected fracture surface (mixed mode I-II) appears in heavily drawn wires during CERT test under high loading rate (0.01 mm/min). Thus the hydrogen concentration in the material is not the unique factor affecting the fracture surface in notched wires, as discussed in the next section of the paper.
Figure 8. Variation with the cold drawing degree of the hydrogen embrittlement (HE) susceptibility of the progressively drawn steels for the two loading rates.
Metals 06 00011 g008

4. Hydrogen Diffusion

The key role of hydrostatic stress (σ) in hydrogen diffusion is well known [33,34,35]. The equation describing stress-assisted diffusion of hydrogen can be formulated as follows [36,37]:
C t = D ( 2 C V H R T C σ V H R T C 2 σ )
where C is the hydrogen concentration, D is the hydrogen diffusion coefficient, VH the partial molar volume of hydrogen, R the universal gases constant and T the absolute temperature.
In this paper, the analysis of hydrogen diffusion was performed for a representative of the whole family of cold drawn steels: the wire undergoing three steps of drawing (steel number 3). The following values were used for the computations of hydrogen diffusion in the notched samples: VH = 2 × 10⁶ m3/mol [38]; D = 3.21 × 10⁻¹¹ m2/s [39], obtained after linear interpolation between the values for the hot rolled bar (not cold drawn at all, D = 6.6 × 10⁻¹¹ m2/s [40]) and the fully drawn wire (commercial prestressing steel, D = 4.99 × 10⁻¹² m2/s [41]).
In the bluntly-notched geometry analyzed in this paper (see Figure 1) the distribution of hydrostatic stress σ reaches its maximum value at the center of the cross sectional area of the sample, so that hydrogen will be “pumped” to such a location according to Equation (1). The hydrogen concentration C profile in the transverse section of the notched specimen at the final instant of the test t = tHE is represented in Figure 9 in dimensionless terms (Cr as the relative hydrogen concentration, i.e., the ratio C/C0 where C0 is the initial equilibrium concentration for the stress-free metal).
It is seen that the hydrogen concentration profile (numerically computed) allows one to explain the experimental results of the HE tests, and particularly the effect of the loading rate (or crosshead speed) on the initiation of HAF.
In the case of slow tests (crosshead speed type 1, 0.001 mm/min) hydrogen does have enough time to diffuse towards the inner points located at the center of the cross-sectional area of the specimen, so that the maximum hydrogen concentration is achieved in that central region (specimen axis) due to the inwards positive gradient of hydrostatic stress driving (or “pumping”) hydrogen towards such an area. This experimental evidence is fully consistent with a MFM of the model IV (Figure 7d), associated with HAF initiation in the core or central area (Figure 4b; steel 3; low crosshead speed).
On the other hand, in the case of quicker tests (crosshead speed type 2, 0.01 mm/min) hydrogen does not have enough time to reach sufficient concentration at the inner points located at the center of the cross-sectional area of the specimen, so that the maximum hydrogen concentration is achieved at the periphery (just at the notch tip), which is fully consistent with a MFM of the model III (Figure 7c), associated with HAF initiation with ring shape in the vicinity of the notch tip (Figure 5b; steel 3; high crosshead speed).
Local fracture event in the particular steel takes place at a certain locus (x) when hydrogen concentration, C, reaches a critical value which is itself time dependent: C(x, t) = Ccr(σ(x, t)) [6,36]. According to the model of hydrogen diffusion assisted by the stress field in the material, Equation (1), two driving forces govern hydrogen diffusion towards prospective damage places: the gradient of hydrogen concentration and the gradient of hydrostatic stress.
Thus, for low loading rates in CERT tests of wires undergoing three steps of cold drawing, the critical hydrogen concentration happens at the wire core, so that initiation of fracture is central (MFM model IV). However, for CERT tests under high loading rates applied on the same wire, the time is not high enough for hydrogen to diffuse towards the inner points and reach the central area, so that the maximum concentration is reached at the surface and the fracture initiation is located at the wire periphery (MFM model III). This is explained in Figure 9, where the radial distribution of relative hydrogen concentration (Cr) is shown at the instant of final failure during a CERT test (t = tHE) of a steel undergoing three steps of cold drawing during manufacturing. Depth is defined in radial direction from the notch tip, and the relative hydrogen concentration is derived from Equation (1).
Figure 9 reveals a key issue: whereas in the fastest test (0.01 mm/min) the hydrogen concentration profile is decreasing (maximum at the surface), in the slowest one (0.001 mm/min) such a profile is increasing (reaching its maximum just at the specimen center). This way, in steels tested under low loading rate hydrogen has more time for diffusing until reaching the wire core before provoking final fracture of the specimen. This is demonstrated with the analysis of the fracture mechanisms shown in Figure 4, where it is shown that the TTS zone appears only at the sample centre in these slow CERT tests. On the contrary, in the steels tested under high loading rates the hydrogen-assisted micro-damage appears in the specimen surface, just at the notch tip (peripheral TTS) precisely where the hydrogen concentration reaches its maximum, so that hydrogen does not have enough time to diffuse towards the core region and the remaining material does not seem to be markedly affected by hydrogen (C < Ccr).
Figure 9. Radial distribution of relative hydrogen concentration for both loading rates at the instant of final failure during a CERT test (t = tHE) of a steel undergoing three steps of cold drawing. Depth is defined in radial direction from the notch tip.
Metals 06 00011 g009

5. Conclusions

The following conclusions may be drawn on the basis of the analysis performed in this paper:
(i)
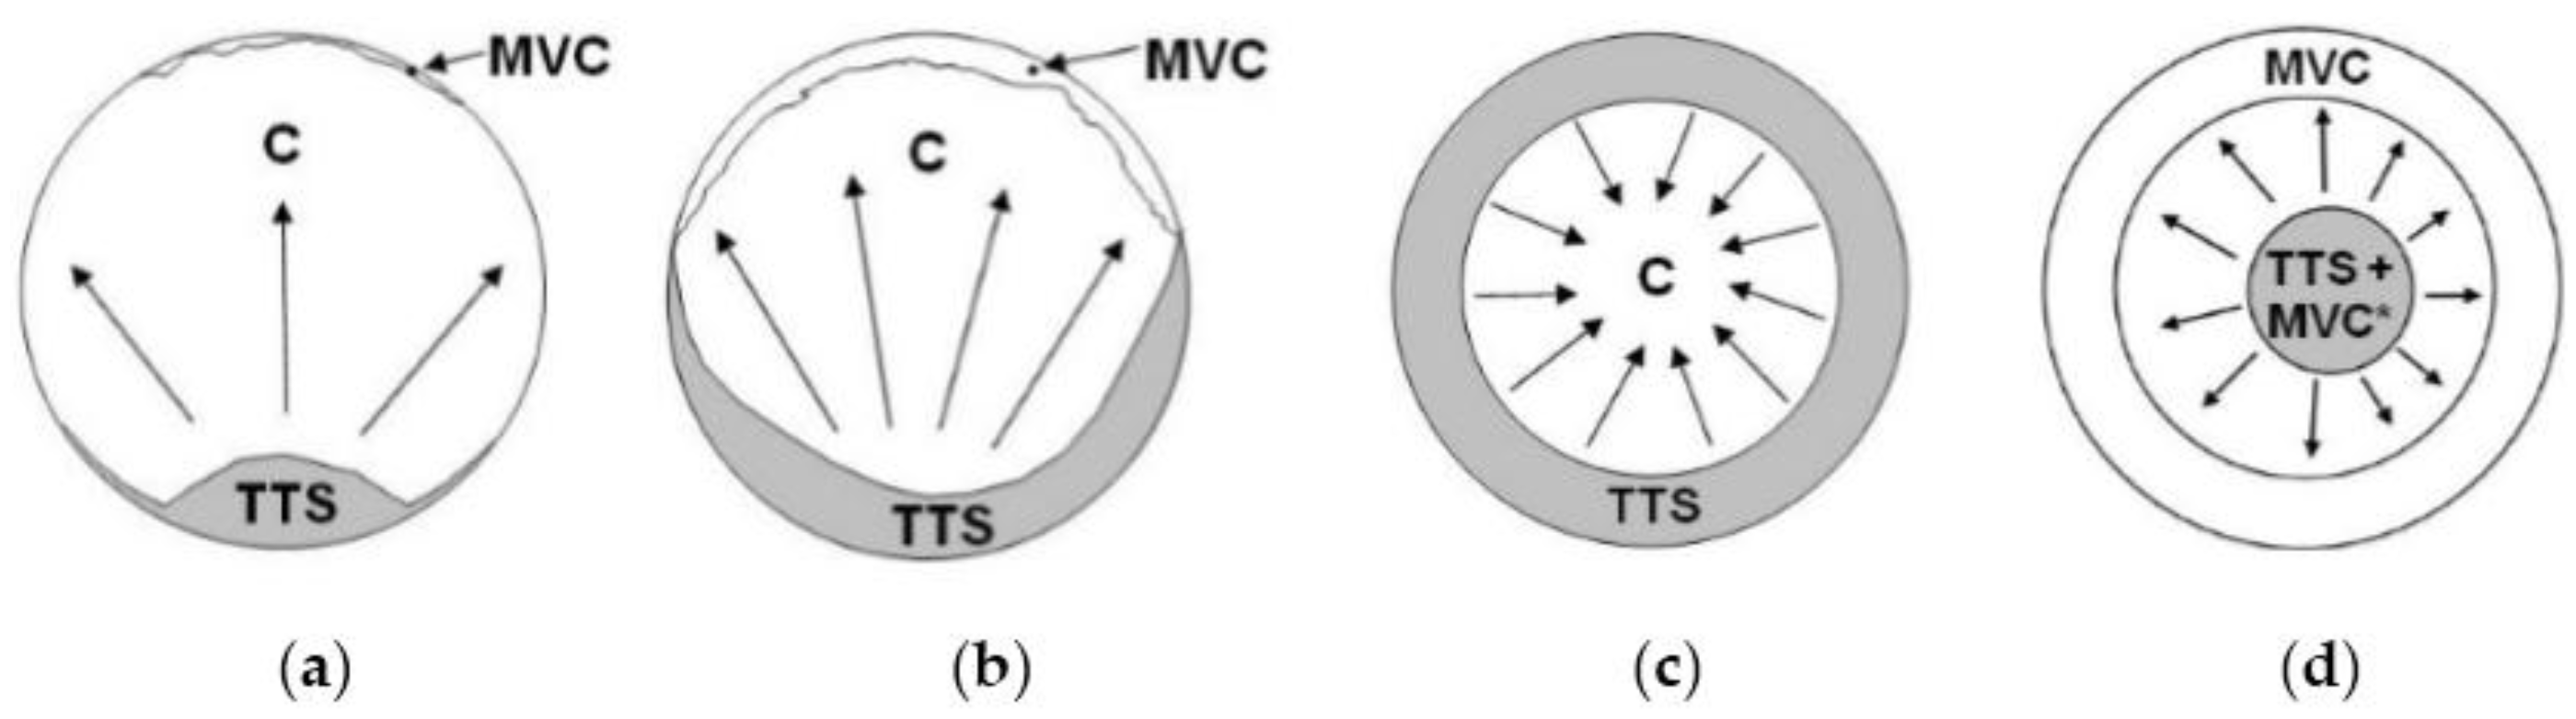
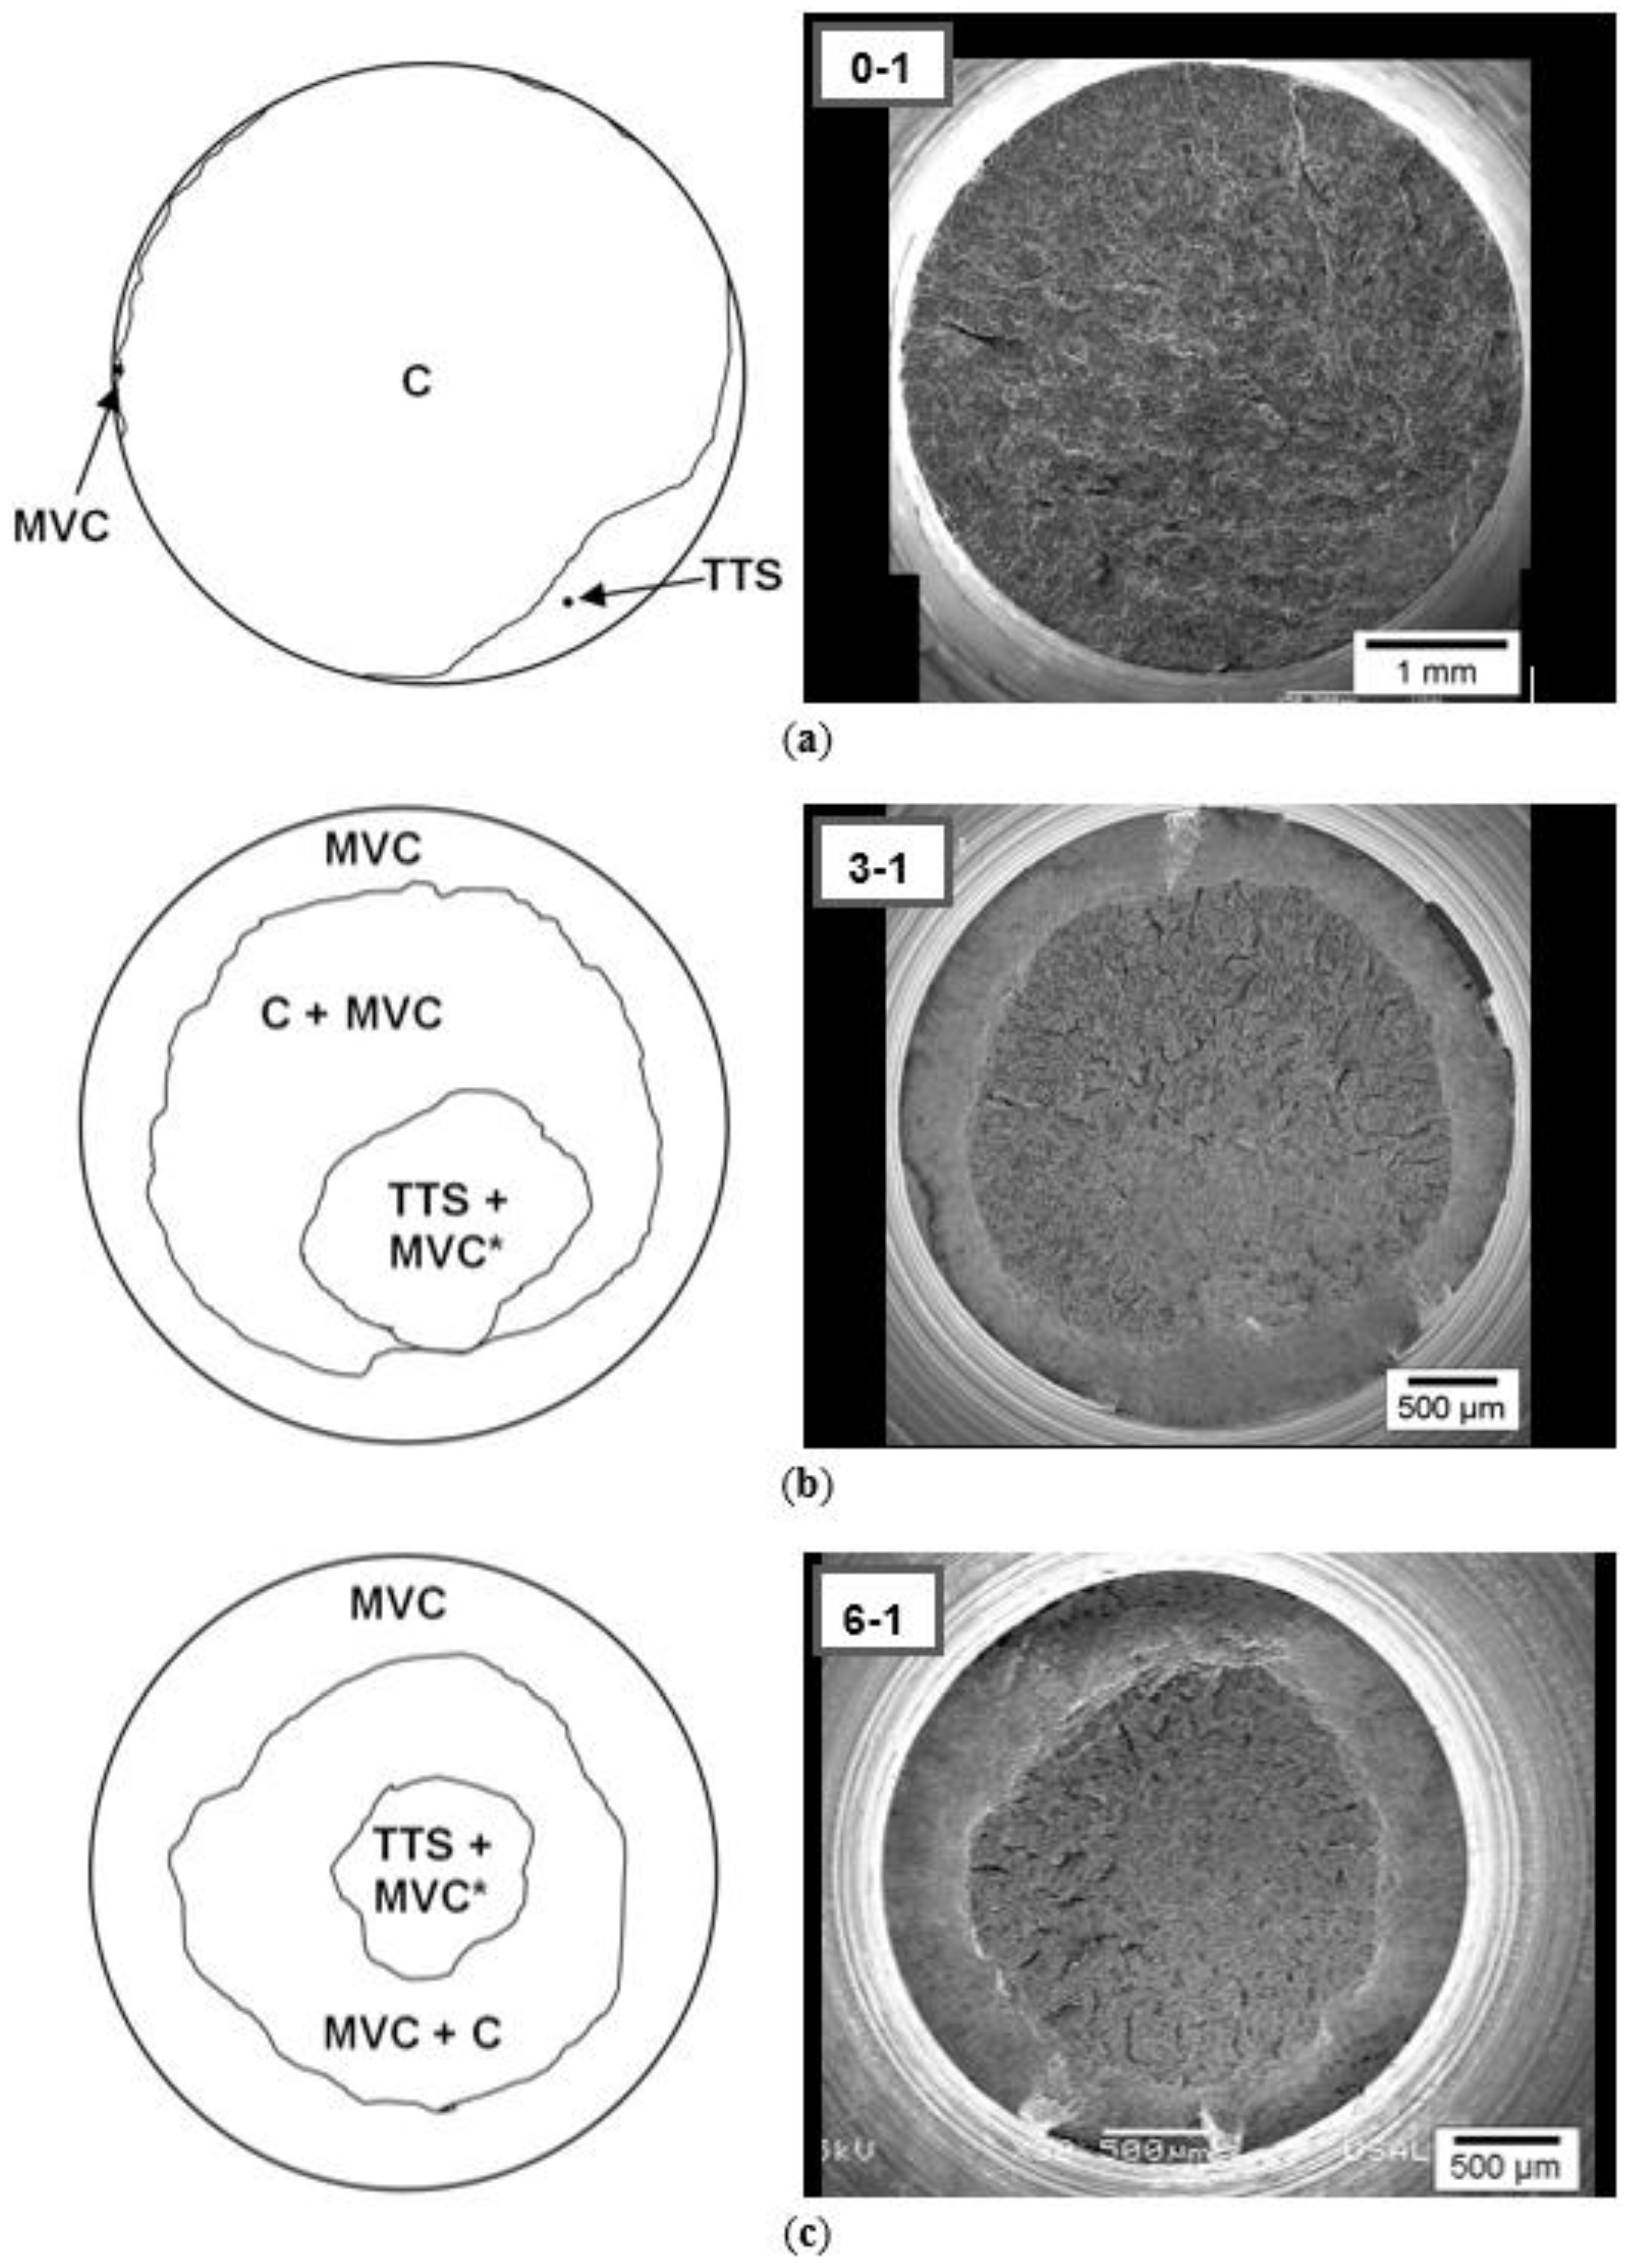
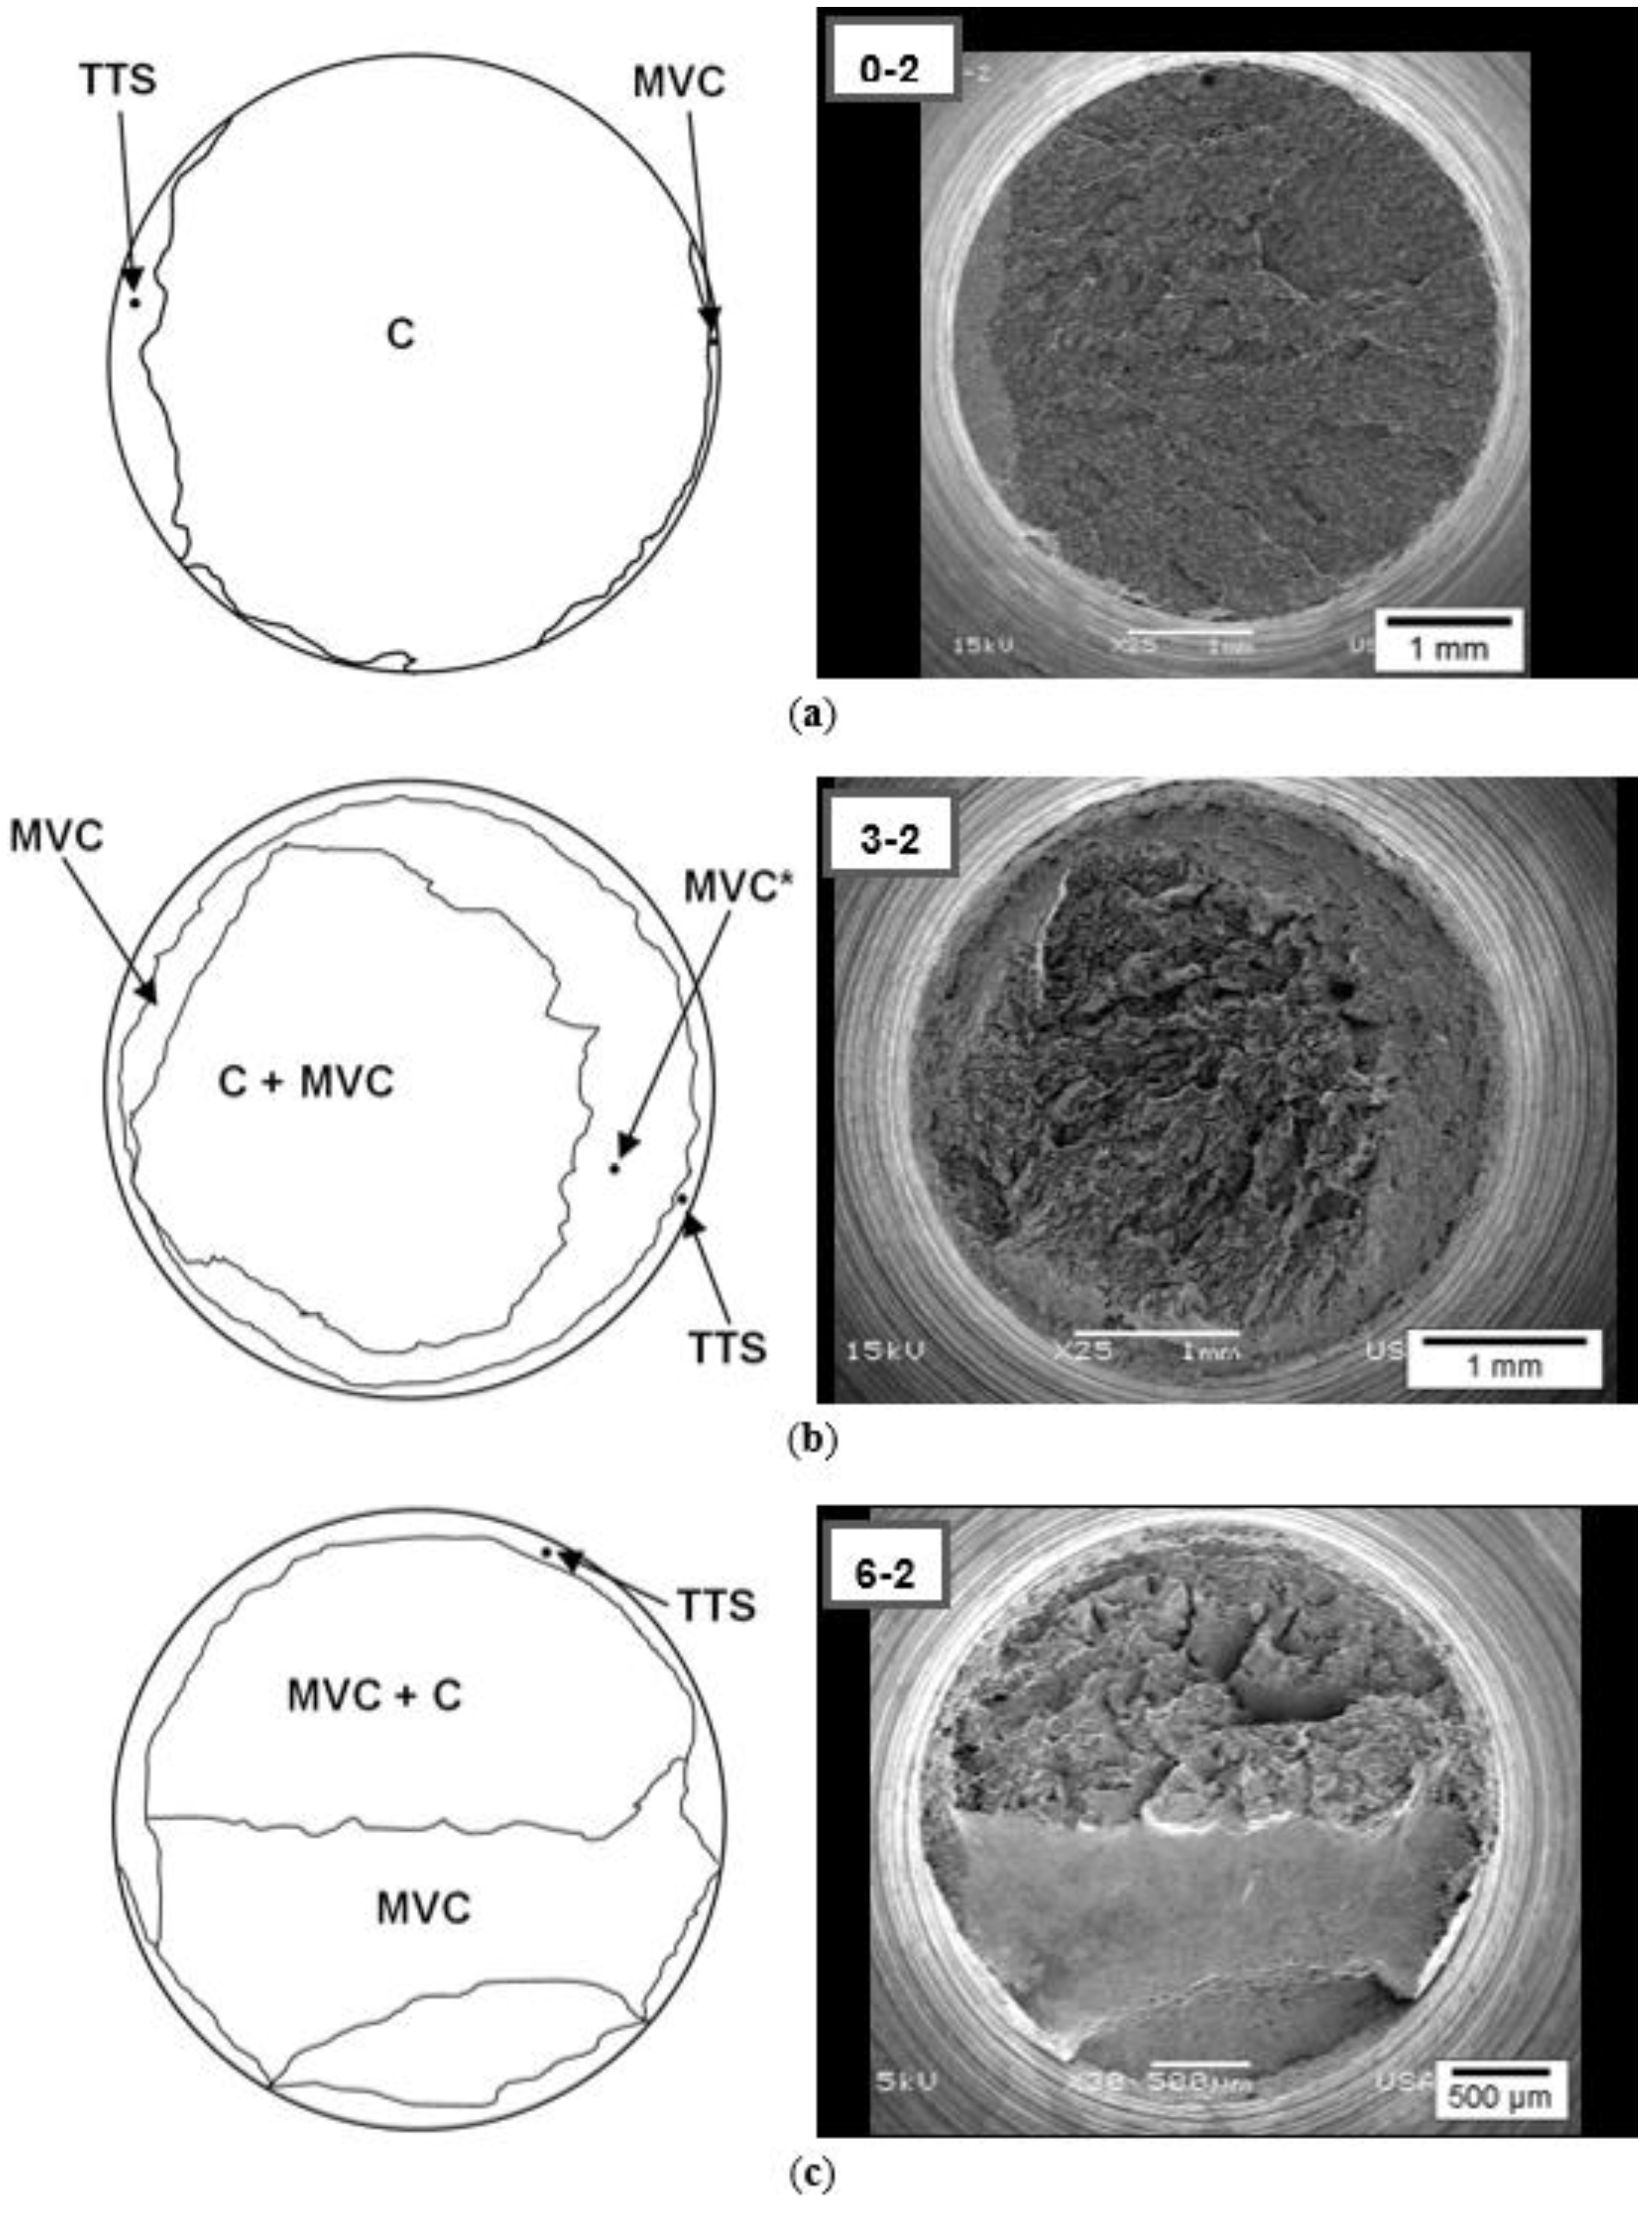
The fracture surfaces in bluntly notched samples of pearlitic steel subjected to constant extension rate tensile (CERT) tests in an environment promoting hydrogen embrittlement (HE) may be classified into four schematic micro-fracture maps (MFMs).
(ii)
In all MFMs the fracture process zone (FPZ) is associated either with tearing topography surface (TTS) or with an area resembling micro-void coalescence (MVC* or quasi-MVC), i.e., a candidate to TTS that is not fully hydrogenated.
(iii)
Cold drawing produces microstructural orientation in the pearlitic steel and therefore anisotropic fracture behavior under hydrogen environments, thus promoting axisymmetric shape of the FPZ (TTS alone or a mixture of TTS and MVC*).
(iv)
For low loading rates (slow HE tests) a special MFM appears in which hydrogen-assisted fracture (HAF) initiates in the central core of the cross-sectional area of the bluntly notched specimen of pearlitic steel.
(v)
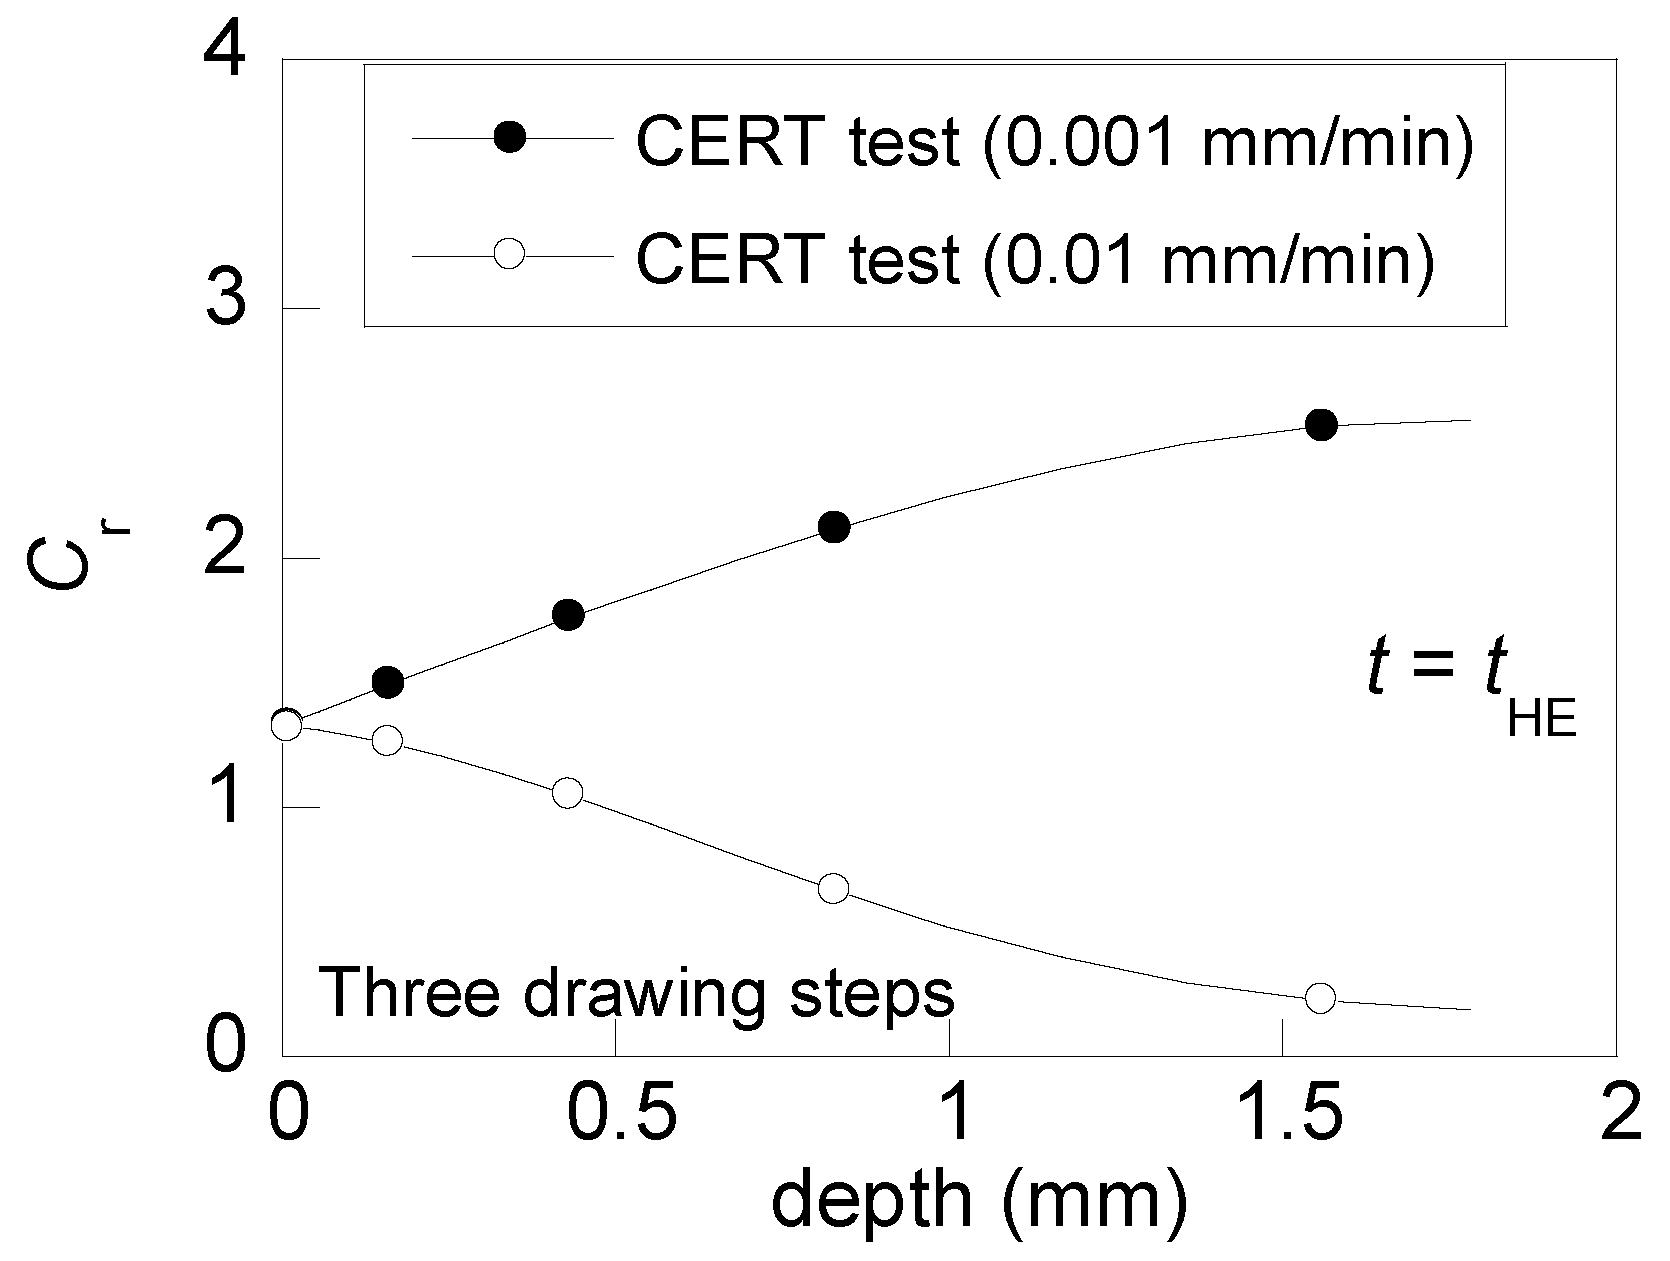
For high loading rates (quick HE tests) all MFMs show experimental evidence of surface (peripherical) initiation of HAF due to the short time for hydrogen diffusion and penetration towards the inner zone.

Acknowledgments

The authors wish to acknowledge the financial support provided by the following Spanish Institutions: Ministry for Science and Technology (MCYT; Grant MAT2002-01831), Ministry for Education and Science (MEC; Grant BIA2005-08965), Ministry for Science and Innovation (MICINN; Grants BIA2008-06810 and BIA2011-27870), Junta de Castilla y León (JCyL; Grants SA067A05, SA111A07 and SA039A08), and the steel supplied by Emesa Trefilería (La Coruña, Spain).

Author Contributions

J.T. and D.V. conceived and designed the experiments; D.V. performed the experiments; D.V. and M.L. carried out the numerical simulations; J.T., D.V. and M.L. analyzed the data and wrote the paper.

Conflicts of Interest

The authors declare no conflict of interest.

References

  1. Enos, D.G.; Williams, A.J.; Scully, J.R. Long-term effects of cathodic protection of prestressed concrete structures: Hydrogen embrittlement of prestressing steel. Corrosion 1997, 53, 891–908. [Google Scholar] [CrossRef]
  2. Vehovar, L.; Kuhar, V.; Vehovar, A. Hydrogen-assisted stress-corrosion of prestressing wires in a motorway viaduct. Eng. Fail. Anal. 1998, 5, 21–27. [Google Scholar] [CrossRef]
  3. Tkachov, V.I. Problems of hydrogen degradation of metals. Mater. Sci. 2000, 36, 481–488. [Google Scholar] [CrossRef]
  4. Perrin, M.; Gaillet, L.; Tessier, C.; Idrissi, H. Hydrogen embrittlement of prestressing cables. Corros. Sci. 2010, 52, 1915–1926. [Google Scholar] [CrossRef]
  5. Mallick, A.; Das, S.; Mathur, J.; Bhattacharyya, T.; Dey, A. Internal reversible hydrogen embrittlement leads to engineering failure of cold drawn wire. Case Stud. Eng. Fail. Anal. 2013, 1, 139–143. [Google Scholar] [CrossRef]
  6. Toribio, J.; Kharin, V.; Vergara, D.; Lorenzo, M. Optimization of the simulation of stress-assisted hydrogen diffusion for studies of hydrogen embrittlement of notched bars. Mater. Sci. 2011, 46, 819–833. [Google Scholar] [CrossRef]
  7. Toribio, J.; Elices, M. The role of local strain rate in the hydrogen embrittlement of round-notched samples. Corros. Sci. 1992, 33, 1387–1409. [Google Scholar] [CrossRef]
  8. Wang, M.; Akiyama, E.; Tsuzaki, K. Crosshead speed dependence of the notch tensile strength of a high strength steel in the presence of hydrogen. Scr. Mater. 2005, 53, 713–718. [Google Scholar] [CrossRef]
  9. Merson, E.D.; Krishtal, M.M.; Merson, D.L.; Eremichev, A.A.; Vinogradov, A. Effect of strain rate on acoustic emission during hydrogen assisted cracking in high carbon steel. Mater. Sci. Eng. A 2012, 550, 408–417. [Google Scholar] [CrossRef]
  10. Raykar, N.R.; Raman, R.K.S.; Maiti, S.K.; Choudhary, L. Investigation of hydrogen assisted cracking of a high strength steel using circumferentially notched tensile test. Mater. Sci. Eng. A 2012, 547, 86–92. [Google Scholar] [CrossRef]
  11. Toribio, J.; Vergara, D. Role of microstructural anisotropy in the hydrogen-assisted fracture of pearlitic steel notched bars. Int. J. Fract. 2013, 182, 149–156. [Google Scholar] [CrossRef]
  12. Smith, E. The elastic stress distribution near a circular cylindrical notch due to external dislocations. Int. J. Eng. Sci. 2004, 42, 1841–1846. [Google Scholar] [CrossRef]
  13. Sanyal, G.; Das, A.; Singh, J.B.; Chakravartty, J.K. Effect of notch geometry on fracture features. Mater. Sci. Eng. A 2015, 641, 210–214. [Google Scholar] [CrossRef]
  14. Toribio, J.; Lorenzo, M.; Vergara, D.; Kharin, V. Hydrogen degradation of cold-drawn wires: A numerical analysis of drawing-induced residual stresses and strains. Corrosion 2011, 67, 075001:1–075001:8. [Google Scholar] [CrossRef]
  15. Nam, W.J.; Bae, C.M. Void initiation and microstructural changes during wire drawing of pearlitic steels. Mater. Sci. Eng. A 1995, 203, 278–285. [Google Scholar] [CrossRef]
  16. Zelin, M. Microstructure evolution in pearlitic steels during wire drawing. Acta. Mater. 2002, 50, 4431–4447. [Google Scholar] [CrossRef]
  17. Sauvage, X.; Guelton, N.; Blavette, D. Microstructure evolutions during drawing of a pearlitic steel containing 0.7 at. % copper. Scri. Mater. 2002, 46, 459–464. [Google Scholar] [CrossRef]
  18. Guo, N.; Luan, B.; Wang, B.; Liu, Q. Microstructure and texture evolution in fully pearlitic steel during wire drawing. Sci. China Technol. Sci. 2013, 56, 1139–1146. [Google Scholar] [CrossRef]
  19. Guo, N.; Luan, B.; Wang, B.; Liu, Q. Deformation bands in fully pearlitic steel during wire drawing. Sci. China Technol. Sci. 2014, 57, 796–803. [Google Scholar] [CrossRef]
  20. Toribio, J.; Ovejero, E. Microstructure evolution in a pearlitic steel subjected to progressive plastic deformation. Mater. Sci. Eng. A 1997, 234–236, 579–582. [Google Scholar] [CrossRef]
  21. Toribio, J.; Ovejero, E. Microstructure orientation in a pearlitic steel subjected to progressive plastic deformation. J. Mater. Sci. Lett. 1998, 17, 1037–1040. [Google Scholar] [CrossRef]
  22. Toribio, J.; Ovejero, E. Effect of cumulative cold drawing on the pearlite interlamellar spacing in eutectoid steel. Scr. Mater. 1998, 39, 323–328. [Google Scholar] [CrossRef]
  23. Toribio, J.; Ovejero, E. Effect of cold drawing on microstructure and corrosion performance of high-strength steel. Mech. Time-Depend. Mater. 1998, 1, 307–319. [Google Scholar] [CrossRef]
  24. Dua, X.S.; Caoa, W.B.; Wanga, C.D.; Lib, S.J.; Zhao, J.Y.; Sun, Y.F. Effect of microstructures and inclusions on hydrogen-induced cracking and blistering of A537 steel. Mater. Sci. Eng. A 2015, 646, 181–186. [Google Scholar] [CrossRef]
  25. Inés, M.N.; Asmus, C.A.; Mansilla, G.A. Influence of total strain amplitude on hydrogen embrittlement of high strength steel. Procedia Mater. Sci. 2015, 8, 1039–1046. [Google Scholar] [CrossRef]
  26. Parkins, R.N.; Elices, M.; Sánchez-Gálvez, V.; Caballero, L. Environment sensitive cracking of pre-stressing steels. Corros. Sci. 1982, 22, 379–405. [Google Scholar] [CrossRef]
  27. Thompson, A.W.; Chesnutt, J.C. Identification of a fracture mode: the tearing topography surface. Metall. Trans. 1979, 10A, 1193–1196. [Google Scholar] [CrossRef]
  28. Costa, J.E.; Thompson, A.W. Hydrogen cracking in nominally pearlitic 1045 steel. Metall. Trans. 1982, 13A, 1315–1318. [Google Scholar] [CrossRef]
  29. Toribio, J.; Lancha, A.M.; Elices, M. The tearing topography surface as the zone associated with hydrogen embrittlement processes in pearlitic steel. Metall. Trans. 1992, 23A, 1573–1584. [Google Scholar] [CrossRef]
  30. Toribio, J.; Vasseur, E. Hydrogen-assisted micro-damage evolution in pearlitic steel. J. Mater. Sci. Lett. 1997, 16, 1345–1348. [Google Scholar] [CrossRef]
  31. Gamboa, E.; Atrens, A. Environmental influence on the stress corrosion cracking of rock bolts. Eng. Fail. Anal. 2003, 10, 521–558. [Google Scholar] [CrossRef]
  32. Toribio, J.; Vergara, D.; Lorenzo, M. Role of microstructural anisotropy of prestressing steel on the fractographic appearance of hydrogen-assisted micro-damage. In Proceedings of the Corrosion 2011, Houston, TX, USA, 13–17 March 2011; NACE International: Houston, TX, USA; pp. 2759–2767.
  33. Toribio, J. Role of hydrostatic stress in hydrogen diffusion in pearlitic steel. J. Mater. Sci. 1993, 28, 2289–2298. [Google Scholar] [CrossRef]
  34. Panasyuk, V.V.; Ivanyts’kyi, Y.L.; Hembara, O.V.; Boiko, V.M. Influence of the stress-strain state on the distribution of hydrogen concentration in the process zone. Mater. Sci. 2014, 50, 315–323. [Google Scholar] [CrossRef]
  35. Raykar, N.R.; Maiti, S.K.; Raman, R.K.S. Influence of hydrostatic stress distribution on the modelling of hydrogen assisted stress corrosion crack growth. Blucher Mech. Eng. Proc. 2014, 1, 1–15. [Google Scholar]
  36. Toribio, J.; Kharin, V.; Vergara, D.; Lorenzo, M. Two-dimensional numerical modelling of hydrogen diffusion in metals assisted by both stress and strain. Adv. Mater. Res. 2010, 138, 117–126. [Google Scholar] [CrossRef]
  37. Toribio, J.; Kharin, V.; Vergara, D.; Lorenzo, M. Hydrogen diffusion in metals assisted by stress: 2D Numercal Modelling and Analysis of Directionality. Solid State Phenom. 2015, 225, 33–38. [Google Scholar] [CrossRef]
  38. Hirth, J.P. Effects of hydrogen on the properties of iron and steel. Metall. Trans. 1980, 11A, 861–890. [Google Scholar] [CrossRef]
  39. Toribio, J.; Kharin, V.; Lorenzo, M.; Vergara, D. Role of drawing-induced residual stresses and strains in the hydrogen embrittlement susceptibility of prestressing steels. Corros. Sci. 2011, 53, 3346–3355. [Google Scholar] [CrossRef]
  40. Lillard, R.S.; Enos, D.G.; Scully, J.R. Calcium hydroxide as a promoter of hydrogen absorption in 99.5% Fe and a fully pearlitic 0.8% C steel during electrochemical reduction of water. Corros. Sci. 2000, 56, 1119–1132. [Google Scholar] [CrossRef]
  41. Toribio, J.; Elices, M. Influence of residual stresses on hydrogen embrittlement susceptibility of prestressing steels. Inter. J. Solids Struct. 1991, 25, 791–803. [Google Scholar] [CrossRef]

