Abstract
Compared to other alloys, Ti6Al4V is the most used in medicine. In recent years, concerns regarding the toxicity of Al and V elements found in the composition of Ti6Al4V have drawn the attention of the scientific community, due to the release of Al or V ions after long term exposure to human body fluids which can lead to a negative response of the human host. Based on this, the aim of the paper was to manufacture a Ti25Nb10Zr alloy consisting of biocompatible elements which can replace Ti6Al4V usage in medical applications. In order to prove that this alloy possessed improved properties, the mechanical, wear and corrosion resistance, wettability, and cell viability were performed in comparison with those of the Ti6Al4V alloy. The corrosion behavior of this new alloy in simulated body fluid (SBF) and Hank solutions is superior to that of Ti6Al4V. The cast Ti25Nb10Zr alloy has a good tribological performance in SBF, while annealed Ti25Nb10Zr alloy is better in Hank solution. Cell viability and proliferation assay after five days indicated that Ti25Nb10Zr presented a good viability and proliferation with values of approximately 7% and 10% higher, respectively, than the ones registered for pure Ti. When compared with Ti6Al4V, the obtained results for Ti25Nb10Zr indicated smaller values with 20% in the case of both tests. Overall, it can be concluded that cell proliferation and viability tests indicated that the biocompatibility of the Ti25Nb10Zr alloy is as good as pure Ti and Ti6Al4V alloy.
1. Introduction
Over the last several decades, an increase in life expectancy has raised the average age of the world’s population. In 2001, the Department of Economic and Social Affairs Population Division (USA) published a report namely “World Population Ageing: 1950–2050”, in which it is claimed that the overall median age rose from 29.0 in 1950 to 37.3 in 2000 and is forecast to rise to 45.5 by 2050 [1]. This worldwide increase in the average age of the population has led to a quickly increasing number of surgical procedures involving prosthesis implantation, because as the human body ages, the load-bearing joints become more prone to disease. In addition, young people suffer many sports injuries related to partaking in winter sports, basketball, biking, football, soccer, skateboarding etc. According to the National Safety Council, in 2003 the most dangerous sport was basketball (533,509 people), followed by biking (521,578) and football (420,581) and many of those people were young people aged 5–24 [2]. All these statistical values have resulted in an urgent need for improved biomaterials and implant processing technologies, especially for orthopedic and dental applications. Thus, especially in the case of young patients, it is necessary that implants function properly, in order to increase the life quality and the normal life expectancy, by decreasing the number of surgical revisions. Based on this, the mechanism of implant failure is nowadays the target of intensive research, aiming to increase the implant’s service life, especially since the bone fixation devices and artificial joints comprise 44% of all medical devices. Commonly, the requirements imposed to materials used in medical applications consist of good clinical behavior, accessible manufacturing process, cost-effectiveness, and possessing better performance related to the revision period. Since the 1960s, titanium alloys have been the most commonly used materials in medical applications together with other biomaterials such as stainless steel, cobalt chromium, and shape memory alloys [3,4,5,6].
The most important markets for medical products are the United States. According to a study published in 1976 by Smith and Black it was reported that in a period of 35 years (between 1940 and 1975) approximately 100 million metallic implants were inserted in the human body [7]. BCC Research published in 2011 a study regarding the market for advanced orthopedic technology and products, classifying the markets in three general segments: (1) bone repair and regenerative products; (2) cartilage and soft tissue repair joint replacement and (3) implants and regenerative products [8]. It was shown that the total market for advanced orthopedic technology and products increased from $28 billion in 2010 to $32.4 billion in 2015, a five-year compound annual growth rate of 2.7%, due to an increasingly older population. Based on these results, the Medical Device market seems to have evolved as an essential sector of the world economy [9].
Compared to other alloys, Ti6Al4V is the most used in medicine, especially for shoulder and total hip implants. For this reason, many research studies have focused on analyzing the Ti6Al4V alloys. Azevedo and Hippert proved that in Brazil the failures of Ti6Al4V oral maxillofacial plate occurred by corrosion-fatigue promoted by the presence of intense localized corrosion and intergranular cracking [10]. Although, there are many concerns regarding the toxicity of Al and V elements, found in Ti6Al4V alloys, it has been reported that after long term exposure to human body fluid, the releasing of metallic ions can lead to a significant toxicity of the targeted areas such as lungs and/or brain, thus inducing a negative tissue response. Moreover, other drawbacks of Ti6Al4V alloy are their high and unstable friction coefficient and low wear resistance in contact with human environments [11,12]. In the literature, it is reported that the tribological performance and biocompatibility of titanium alloys can be improved by two approaches. One is the biomimetic deposition of coatings such as hydroxyapatite [13,14]. Another one is the introduction of nano- or micro-structures on the surfaces [15,16]. Steinemann et al. [17] investigated the toxicity of V element and recommended the replacement of Ti6Al4V alloy with other Ti-based alloys. As a solution for this problem, a variety of alloys which consist mainly of non-toxic and non-allergic elements such as Nb, Ta, Zr, Mo, Hf, Pt, Fe have been developed [18,19]. It is of utmost importance to test the applicability of a TixNbyZr alloy. Long and Rack showed that Nb and Zr are nontoxic elements with high biocompatibility, which have a great influence on the microstructure and properties of TiNbZr-based alloys [20]. Moreover, it was reported that α and near-α Ti-based alloys exhibit superior corrosion resistance, with low strength at ambient temperature, while β-alloys possesses high strength, good formability, high hardenability, low elastic modulus, and high corrosion resistance [20]. Thus, by controlling the α/β phase ratio and the conditions of thermal and thermo-mechanical processing treatments, the properties of the TiNbZr based alloys can be controlled [21].
Mechanical properties and biocompatibility are the primary considerations in the design of a new alloy used as biomaterial. It has been observed that the mechanical properties, structure, and morphology are sensitive to Nb content as follows: the alloy with 15 wt % or less of Nb exhibits α′ martensite (hexagonal); with 17–25 wt % Nb, the α″ martensite phase (orthorhombic) predominates [22]. In the case of alloys consisting of Ti and Zr elements, only α phase was obtained, which usually increased the mechanical strength (such as tensile strength, hardness, and flexural strength) and improved the corrosion potential and wear resistance of Ti alloy [23]. According to the results reported by Correa et al., the addition of 5%–10% in mass of Zr into pure Ti (cpTi) initially decreased the hardness, while a concentration higher than 15% increased the hardness above that of cpTi. These variations can be explained by referring to the distance between the atoms of the alloy components, which is caused by the higher atomic radius of Zr (1.60 nm). This ultimately leads to modifications of the binding force between atoms, influencing the elastic modulus. The incorporation of Nb into a Ti-Zr alloy also showed an increase in hardness, which was raised even more by aging heat treatment, responsible for the formation of a biphasic α + β microstructure [24].
In order to develop safe Ti-based alloys for biomedical applications, Nb and Zr are preferably added as they enhance the ability to achieve biological passivity and the ability to reduce the elastic modulus [25]. The search for a balance between strength and elastic modulus is important to improve the performance of implants compared with those made of cpTi and Ti6Al4V.
Cvijović-Alagić et al. investigated the tribological and corrosion behavior for Ti13Nb13Zr in comparison to Ti6Al4V alloy in Ringer’s solution. The results indicated that Ti6Al4V alloy could be successfully replaced by Ti13Nb13Zr [26]. Huang et al. modified the surface of Ti25Nb25Zr alloy by a simple electrochemical anodization process and evaluated the contact angle, proteins adsorption (fibronectin and albumin) as well as cell response. The β-type Ti25Nb25Zr alloy presented good results, hence indicating that its use is suitable for bone implant applications [27].
The aim of this work was to investigate the Ti25Nb10Zr alloy as a possible candidate for the replacement of Ti6Al4V alloy used as orthopedic implants. The alloys were cast by the cold crucible levitation melting technique and characterized in terms of elemental and phase composition, microstructure, roughness, hardness and Young modulus, friction and wear performance, corrosion resistance, wettability, and cell viability. The properties of the Ti25Nb10Zr alloy were assessed in comparison to those of the Ti6Al4V alloy.
2. Materials and Methods
2.1. Preparation of the Alloy
The Ti25Nb10Zr alloy was obtained by the cold crucible levitation melting technique (CCLM), using a FIVES CELES—CELLES MP 25 furnace (Fives Celes, Lautenbach, France) with 25 kW nominal powers and a melting capacity of 30 cm3. This type of fusion, which avoids the contact between alloy and crucible, is particularly attractive, because the melting is conducted under very clean conditions (no reaction with the crucible), making it ideal for synthesis of biocompatible alloys with high melting point. The alloy was produced starting from elemental components, using ultra-pure raw metals. The thermal annealing treatment of Ti25Nb10Zr was achieved at 900 °C for 5 h using a thermal treatment furnace (Caloris, Bucharest, Romania), after which the alloy was cooled in air. In this paper Ti6Al4V was used as reference sample. The alloy was supplied by Bibus Metals AG (Fehraltorf, Switzerland). According to their quality certificate, the alloy was annealed at 730 °C for 1 h, then hot rolled, machined and pickled. In the present paper, the investigated samples were codified as follows: Ti6Al4V—T1; cast Ti25Nb10Zr—T2 and annealed Ti25Nb10Zr—T3.
2.2. Composition and Structure of the Alloy
The elemental composition of the T2 alloys was investigated by energy dispersive X-ray spectroscopy (EDS) using a scanning electron microscope (SEM, TableTop 3030PLUS, Hitachi, Tokyo, Japan) equipped with an energy dispersive X-ray (EDX) system (Quantax70, Bruker, Billerica, MA, USA).
For metallographic investigations, the samples were prepared as follows: ground on abrasive paper with grit from 320 to 1200, polished with alumina slurry, and etched using the Kroll etchant (5 mL HF + 5 mL HNO3 + 90 mL H2O). Jena NEOPHOT 21 optical microscope was used to determine the alloy’s microstructure.
The phase composition of the studied alloys was identified by X-ray diffraction (XRD, Rigaku, Tokyo, Japan) using a Rigaku Miniflex II diffractometer. The diffractometer with CuKα radiation (α = 1.5406 nm) was operated at 35 kV and 15 mA in a Bragg-Brentano geometry.
2.3. Mechanical Properties of the Alloy
The surface roughness was investigated by Dektak 150 surface profilometer using a low-inertia stylus sensor (2.5 mm radius) on 4 mm scan length with 49 µN contact force and 50 μm/s scan speed. The roughness was measured on five samples at different areas for each alloy, and the following roughness parameters were determined: Ra—the arithmetic average deviation from the mean line, Rq—the root-mean-square value of the deviation profile by the medium value and Ssk—the skewness, which is the asymmetry of the deviation profile by the medium value.
The mechanical properties of the alloys were evaluated by uniaxial tensile tests using a module GATAN MicroTest 2000 N (Gatan, Pleasanton, CA, USA) equipped on Microscope Tescan VegaII (Tescan, Brno, Czech Republic). The standard ASTM E8 was used to determine the ultimate tensile strength, 0.2% proof stress and elongation, and ASTM E111 for the initial elastic modulus. Furthermore, the stress-strain relationship was studied based on the Ramberg-Osgood equation, in the elastic region, of which parameters were used to determine the tangent and secant modulus. The hardness was measured using a microhardness tester model FM-700, by applying a force of 50 gf.
Friction and wear behavior of the alloys in SBF and Hank solution were determined using a ball-on-disc tribometer (CSM Instruments SA, Peseux, Switzerland) with a 6 mm diameter sapphire ball. The chemical composition and reagents, used for the preparation of the media used for the testing, are presented in Table 1.

Table 1.
Chemical composition and reagents of the liquids used for surface free energy determination.
Friction tests were performed on 400 m sliding distance at a constant normal load of 3 N with 0.15 m/s sliding velocity. The profilometer was used to measure the wear track in four different areas of the cross-sectional profiles. The wear rate was calculated with the formula [28]:
where k = wear rate, V = worn volume, F = normal load and d = sliding distance. The tribological tests for each type of alloy were run on three samples, to ensure the tests’ reproducibility. The worn surfaces were analyzed by scanning electron microscope (SEM, TableTop 3030PLUS, Hitachi, Tokyo, Japan).
2.4. In Vitro Corrosion Resistance of the Alloy
The corrosion resistance of T1, T2, and T3 alloys was investigated at human body temperature (37 ± 0.5 °C) in SBF and Hank solution using a Potentiostat/Galvanostat PARSTAT 4000 equipped with VersaSTAT LC Low Current Interface. The electrochemical cell consisted of a conventional three-electrode system: a reference electrode (saturated calomel electrode, SCE), a counter electrode (platinum sheet), and a working electrode (samples) with an exposed area of 1 cm2. The open circuit potential (EOC) was continuously monitored during the 24 h, immediately after immersion in the electrolyte. The potentiodynamic polarization curves were performed from −0.5 (vs. EOC) to 1 V (vs. SCE) at a scan rate of 1 mV/s. Based on the polarization curves, the following electrochemical parameters were estimated: open circuit potential (EOC), polarization resistance (Rp), corrosion current density (icorr), and corrosion potential (Ecorr). For each sample, the corrosion procedure was repeated twice in order to verify the reproducibility of the results. Corrosion rate (CR) was calculated according to the standard ASTM G102-89 (2004) [29], using the formula:
where: Ki—constant that defines the units for the corrosion rate (3.27 × 10⁻³); ρ—density (g/cm3); icorr—corrosion current density (µA/cm2); EW—equivalent weight (grams/equivalent).
2.5. Wettability of the Alloy
The contact angle measurements were carried out using a KSV-Instruments Attention TL101 device (Biolin Scientific, Stockholm, Sweden) at room temperature (23 ± 1 °C). A micro-syringe (Hamilton Company, Reno, NV, USA) was used to weep the liquids (deionized water, ethylene glycol, and di-iodomethane) on the surfaces of the Ti alloys. The surface tension components for all used liquids are presented in Table 2 [30]. Each sample was subjected to three measurements.
Table 2.
The surface tension parameters of the liquids used for surface free energy determination.
The contact angle measurements were obtained by averaging all the registered values. Fowkes method was used for surface tension components estimation (the total—γstot, polar—γsp and dispersive—γsd) [31,32]. The alloy’s work of adhesion (wadh) was also calculated using the formula [31,32]:
where: γSL—surface energy of the liquid on the solid surface; θ—the contact angle between the liquid and the solid surface; —the polar component of the solid phase; —the dispersive component of the solid phase; —the polar component of the liquid phase; —the dispersive component of the liquid phase.
2.6. In Vitro Biological Properties of the Alloy
For cell culture, the alloy samples were first sterilized by maintaining in 70% v/v ethanol and then kept for 24 h in the culture medium. The biological compatibility testing was performed using osteoblast-like cells of the human osteosarcoma cell line MG 63. The cells were seeded at a density of 5000 cells/cm2 and the culture was made in Dulbecco's Modified Eagle's Medium (DMEM) with 1‰ glucose, 10% heat-inactivated fetal bovine serum, and antibiotics: penicillin (100 U/mL), streptomycin (72 U/mL), and neomycin (50 U/mL). After 3 days, the following assays were performed: viability assay, alkaline phosphatase activity, cell proliferation quantification, and Reverse Transcription Polymerase Chain Reaction (RT-PCR) for detection of osteonectin and osteocalcin genes expression. The morphology and cell attachment on the alloy surface were also examined by fluorescence microscopy (Zeiss, Jena, Germany) and scanning electron microscopy (SEM TableTop 3030PLUS, Hitachi, Tokyo, Japan).
Cell viability assay is based on the colorimetric quantification of the amount of produced formazan. NAD (P) H-dependent oxidoreductases enzymes reduce the tetrazolium salts (MTT) to an insoluble purple formazan. The cells grown on the alloy samples were incubated at 37 °C and 5% CO2 concentration for 3 h with 0.5 mg/mL MTT solution (Sigma Aldrich, Taufkirchen, Germany) made in DMEM culture medium without phenol red. The insoluble formazan was dissolved with a 0.1 N HCl solution in anhydrous isopropanol, and the color intensity of the resulted homogeneous solution was determined by measuring the absorbance at 570 nm from which was subtracted the absorbance recorded at 690 nm (background absorbance).
Cell proliferation was evaluated after 3 days of cell growth on T1, T2, and T3 samples. This method is based on the quantification of nuclear DNA. In order to break the cell membranes and release the nuclear DNA, the cells were subjected to several large temperature variations using liquid nitrogen. To mark the released DNA, the cell lysate was incubated with a 10 μg/mL Hoechst 33258 fluorochrome solution in TNE buffer (10 mM Trizma Base, 1 mM EDTA, 2M NaCl, pH = 7,4), for 1 h at 37 °C and then the fluorescence was measured. For fluorochrome excitation, the wavelength λ = 350 nm was used and the emission was measured at λ = 460 nm. The recorded fluorescence values were converted to DNA quantities using a standard curve made with salmon DNA (Invitrogen, Carlsbad, CA, USA).
Alkaline phosphatase (ALP) activity was examined after the cells were cultured for 3 days by measuring the transformation of p-nitrophenyl-phosphate (pNPP) into p-nitrophenol (pNP). It is known that para nitrophenyl phosphate (pNPP) is a substrate for ALP and is transformed by this enzyme into yellow paranitrophenol (pNP). The samples with cell culture were transferred into clean plates and washed with warm PBS. A 9.88 mM pNPP solution made in a suitable buffer (Trizma Base 0.08 M, anhydrous magnesium chloride 0.5 mM, dissolved in water, pH 9.86) was added and the cells were incubated at 37 °C, 5% CO2 for 1 h. The amount of paranitrophenol produced by the cells cultured on sample surface indicates the ALP activity level. After incubation the supernatant was collected and the paranitrophenol concentration was determined by absorbance measuring at 405 nm and by interpolation using a 20 μM to 200 μM pNP standard curve. In order to eliminate the cell proliferation interference, the calculated values for ALP activity were normalized to DNA content recorded for each sample in the proliferation assay.
For gene expression quantification, the cells grown on alloy samples were first lysed with Trizol reagent (Invitrogen, Carlsbad, CA, USA) and then total RNA was extracted with a suitable protocol. MMLV reverse transcriptase (Fermentas) was used to obtain cDNA starting from mRNA. This cDNA served as template for Polymerase Chain Reaction (PCR) reaction in order to determine the transcription level of genes encoding for osteonectin and osteocalcin, two important markers for osteoblast activity. The resulted PCR products were visualized by gel agarose electrophoresis in the presence of Midori Green fluorochrome and quantified by measuring the fluorescence intensity of the resulting bands. The recorded values were normalized to the beta actin quantified value. For all the determinations above, the obtained values were divided by the corresponding value recorded for cells cultured on the Ti6Al4V sample, considered as control, the results reflecting the fold increase to these values.
The morphology and attachment uniformity of the cells to the sample surface were examined by fluorescence microscopy and scanning electron microscopy. For fluorescence microscopy, cells were first fixed with PFA (paraformaldehyde) 4% in PBS (Phosphate Buffer Solution) and then treated with fluorescein isothiocyanate (FITC)-labeled Phalloidin (1 μg/mL) and Hoechst 33258 (10 μg/mL) for highlighting actin filaments and the nucleus. After each step two PBS washes were made. Cell examination was performed using a Zeiss Axio Observer microscope (Zeiss, Jena, Germany) equipped with AxioCam MRc 5 camera (Zeiss, Jena, Germany). For scanning electron microscopy, the cultured cells were fixed with 2.5% glutaraldehyde in sodium cacodylate buffer + subsequent metallization treatment. The data resulted from all of the in vitro biological tests were statistically analyzed by paired Student’s t-test (α = 0.005, as significant level of confidence).
3. Results and Discussion
3.1. Microchemical and Microstructural Properties
The EDS elemental composition of the T2 alloy was 25 ± 1.2 wt % Nb, 10 ± 0.9 wt % Zr and rest Ti. For T2 alloy, the metallographic investigations showed typically biphasic microstructures consisting of α (light) and β (dark) phases, where polyhedral grains of α and β phases at the boundaries can be distinguished (Figure 1a,c). The average of β grains is 55.1 µm (±15 µm). Figure 1a showed that the microstructure of cast Ti25Nb10Zr (T2) is majorly formed of α phase and a dispersion of β phase. After annealing, enlarged dark grains appear delimited by a light network (Figure 1b). At higher magnifications (Figure 1d), inside the delimited area, an acicular microstructure assigned to martensite with the needles oriented in the same direction was observed. Thus, because of the annealing in the β domain and cooling in the air, the diffusion processes take place on grain boundaries where the separating network corresponds to α phase. Although inside the grain, the diffusion coefficients are smaller, and the β phase transformation was conducted by martensitic mechanism.
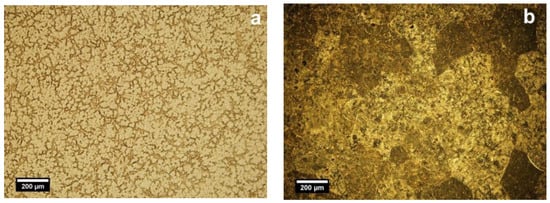
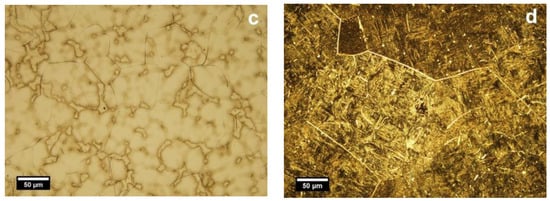
Figure 1.
Optical microstructures of cast (a,c) and annealed (b,d) Ti25Nb10Zr alloy: α (light) and β (dark) phases. Etched state, light microscope.
The phase composition of T1, T2, and T3 alloys was investigated by X-ray diffraction (Figure 2). The T1 alloy is characterized by the presence of α + β phases [20]. The XRD results for T2 and T3 samples revealed the existence of α and β phases. The β phase intensities in T2 alloy are significantly higher compared to α phase. In the literature, it was demonstrated that Nb is responsible for the β phase stabilization in titanium alloys [33,34,35,36] while Liu et al. demonstrated that addition of Zr in the Ti-Nb system has no influence on the formation of α and β phases [20,37]. All diffraction peaks positions were in agreement with the ones reported in the literature for the Ti-Nb-Zr system of different atomic concentrations (Ti4Nb4Zr, Ti22Nb6Zr, Ti36Nb5Zr) [38,39,40]. The identified α and β phases through XRD are consistent with the obtained optical images (Figure 1).
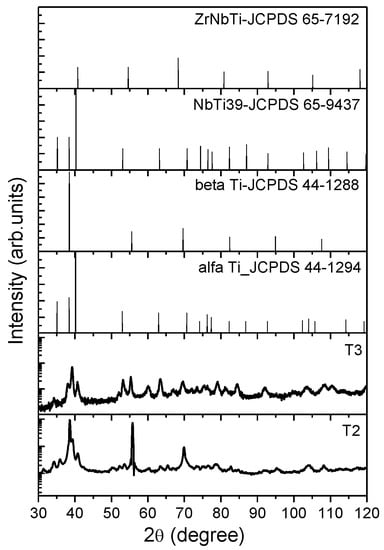
Figure 2.
X-ray diffraction patterns of cast (T2) and annealed (T3) TiNbZr alloy.
The grain sizes of both phases of the alloy were also calculated based on XRD peak broadening using the Debye–Scherrer formula [41] as: for α phase: 15.5 nm in cast alloy and 15.7 nm in annealed alloy; and for β phase: 47.6 nm in cast alloy and 15.3 nm in annealed alloy. These values were determined and averaged based peak broadening located at 40.9°, 63.5°, and 55.6°, 109.1° for α and β phases, respectively.
3.2. Mechanical Properties
The mechanical properties (roughness, hardness, Young modulus, ultimate tensile strength, yield strength—0.2% proof stress, elongation to fracture) of the cast and annealed alloy are shown in Table 3.
Table 3.
Roughness and mechanical parameters for T1, T2, and T3 alloys. Data show the mean and SD values. For each sample, the measurements were performed on three replicates, the results being averaged (arithmetic mean).
In order to eliminate the influence of roughness, the investigated alloys were prepared until they presented very close values. In general, the wettability, anticorrosive, tribological, and biocompatibility properties are influenced by surface roughness. After the evaluation of surface roughness it was observed that the skewness exhibited small differences between the values obtained for T1 and T2 alloys. The skewness value of T2 alloy is lower than T1, indicating that the new alloy has a more symmetrical surface (Table 3).
The hardness was measured in six distinctive areas on three different samples of each alloy. The average hardness of as-cast T2 alloy was 2.3 GPa, being lower than that of Ti6Al4V (3.3 GPa) [42]. Similar results were also obtained by Cvijović-Alagić et al. in a study in which Ti13Nb13Zr and Ti6Al4V were studied [26]. After Ti25Nb10Zr thermal treatment, the hardness increased with 1.8 GPa. Our experimental results indicate an increase in the alloy’s hardness after annealing. This increase can be accounted to the defect hardening mechanism and grain size [43]. Over the years, several complex mechanisms were proposed to explain the reason behind the superior hardness in the alloys such as Hall–Petch [44], and Orowan [45,46,47] models, the coherency strain mechanism, as well as the defect hardening mechanism and it is difficult to measure each separate strengthening contribution. For β phase, a decrease of grain size was found, thus the increase in hardness of alloy can be accounted to the Hall–Petch effect (H = d−1/2), while the results for α phase exhibited the inverse Hall–Petch effect. On the other hand, according to the Orowan model, the increase of hardness can be attributed to the small volume fraction of second phase (β), whatever the grain size. Moreover, if the volume fraction of second phase is small, the grain size of second phase is similar or larger than those of grains of main phase (α), the hardness can be ascribed to the rule of mixtures. The size mismatch between alloying elements plays also an important role which can influence the lattices which can be severely strained, leading to different effects on the mechanical properties of alloy. Thus, the enhancement of hardness after annealing can be attributed to combined effects of different strengthening mechanisms (Hall–Petch and Orowan models, coherency strain effects etc.) and it is difficult to measure each separate strengthening contribution.
The experimental stress-strain curves for the as-cast and annealed alloy are plotted in Figure 3a,b. According to Niinomi [48], the values of elastic moduli and ultimate tensile strength of the Ti-based alloys suitable for biomedical applications are found to be in the range from 55 MPa to 85 GPa and from 596 MPa to 1080 MPa, respectively. He also found that the Ti–35.3Nb–5.1Ta–7.1Zr exhibited low elastic modulus (55 GPa) and low ultimate tensile strength (596.7 MPa) compared to other types of Ti-based alloys. The investigated Ti25Nb10Zr alloys showed 57.4 GPa (casted) and 52.3 GPa (annealed), being lower when compared to Ti6Al4V and other Ti-based alloys [48]. The yield strength of biomedical titanium alloys is distributed between 500 and 1000 MPa [48]. The investigated Ti25Nb10Zr alloys showed the yield strength in the range from 427.2 MPa (casted) to 488.6 MPa (annealed), being lower than those of Ti6Al4V and other Ti-based alloys.
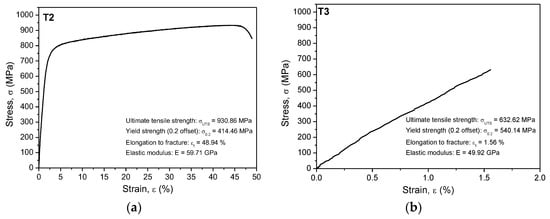
Figure 3.
Stress-strain curves for (a) TiNbZr cast (T2) and (b) annealed (T3) alloys; the presented results are only for one of replicate.
A significant decrease of elongation to fracture was observed after the thermal treatment. In general, the plasticity of martensite depends on the secondary martensite microstructure. The low value of elongation to fracture can be explained by the presence of martensitic phase as major secondary microstructure in Ti25Nb10Zr alloy. Table 3 presents the characteristic roughness parameters (Ra, Rq and Ssk) and the mechanical parameters such as hardness (H), Young modulus (E), ultimate tensile strength (), yield strength 0.2% proof stress () and elongation to fracture . Figure 3 presents the characteristic stress-strain curves obtained for T2 and T3 alloys.
Overall one may observe that the annealing treatment decreases the strength, probably due to the increase of the dislocation density. In the literature, it is a phenomenon known as “annealing hardening”, being opposite to the classical states of coarse-grained metals, where annealing generates a decrease of strength [49]. Over the years, this phenomenon was explained by several possible mechanisms. During annealing, the dislocation density decreases because of the annihilation of dislocations with opposite Burger's vectors and the absorption of dislocation at grain boundaries. At the nanoscale, the dislocations starvation may have high strength. Moreover, after annealing, the state of grain boundaries reaches equilibrium and become sharper, developing a barrier to dislocation emission and grain boundaries sliding, leading to a high hardness and low strength.
3.3. Tribological Performance
The tribological performance of the samples was evaluated by determining the friction coefficient and wear rate. The evolution of the friction coefficient µ as a function of sliding distance is presented in Figure 4. In SBF medium, the friction coefficient for T2 alloy gradually increased up to ≈270 m (Figure 4a). After the aforementioned distance, the friction coefficient for T1 and T2 alloys was stabilized to a ≈ 0.35 value (Figure 4a). It seems that in SBF, the friction coefficient values are almost similar for T1 and T2 alloys (Figure 4a). The test performed in Hank solution for T2 alloy led to an increased friction coefficient when compared to the values registered in SBF, while the T3 alloy had a constant evolution of the friction coefficient in both corrosive media as follows in SBF (µ ≈ 0.70) (Figure 4a) and Hank solution (µ ≈ 0.65) (Figure 4b). If we compare it with the cast T2 alloy, one may see that this alloy exhibits lower µ in SBF than that of annealed T3 alloy. The annealed Ti25Nb10Zr alloy (T3) has similar values of µ in both solutions (µ ≈ 0.70).
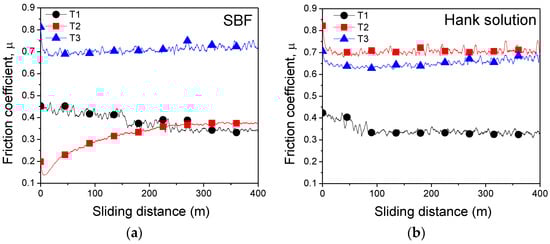
Figure 4.
Evolution of the friction coefficients for T1, T2, and T3 alloys vs. sliding distance in (a) simulated body fluid (SBF) and (b) Hank solution.
Figure 5 presented the wear rate k of the investigated alloys, calculated after 400 m sliding distance. In Hank solution, the wear rate for T2 and T3 alloys ranged between 858 ÷ 1418 × 10−6 mm3·N−1·m−1 values. The highest wear rate was obtained in Hank solution for T2 alloy (1418 × 10−6 mm3·N−1·m−1). In Hank solution, after annealing the wear rate of the Ti25Nb10Zr (858 × 10−6 mm3·N−1·m−1) alloy decreased, indicating an improvement of the wear resistance. In SBF, the low wear rate was found for T2 alloy (0.07 × 10⁻⁶ mm3·N−1·m−1), followed by Ti6Al4V (413 × 10−6 mm3·N−1·m−1) and annealed Ti25Nb10Zr alloy (797 × 10−6 mm3·N−1·m−1). It can be seen that the annealing treatment leads to an increase of wear rate, meaning that the wear resistance decreased. As a conclusion, the cast Ti25Nb10Zr alloy has a low wear rate in SBF, while annealed Ti25Nb10Zr alloy has better wear rate in Hank solution.
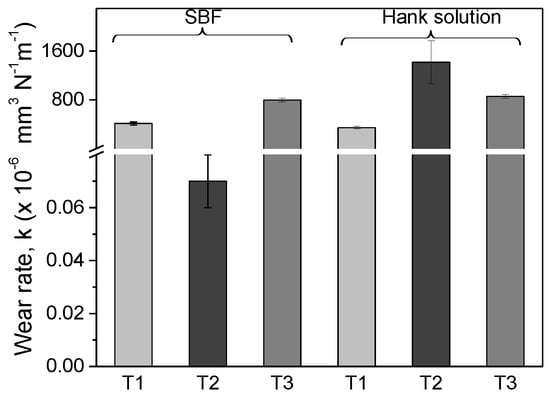
Figure 5.
Mean value of wear rate for T1, T2, and T3 alloys, calculated in four areas on each sample.
SEM images of the wear track after the tribological test in Hank solution of the investigated alloys are presented in Figure 6a–c. For all alloys the images taken at lower magnification evidenced the differences between the worn surfaces of the samples. Note that T1 alloy was much less affected by the wear in Hank solution, results being in good agreement with friction coefficient and wear rate values. After the tribological tests, on the T2 (Figure 6b) and T3 (Figure 6c) surfaces, the presence of the adhered material was found as oxidized material due to immersion in the corrosive solution. These results are also sustained by friction coefficient results. In Hank solution, the oscillations in friction coefficient of T2 surface are more pronounced than those of T3 sample, indicating that the formation and removal of wear debris are more pronounced on this material. On all the alloys, pits appeared, suggesting a decrease of the wear resistance. On T3 surface (Figure 6c), more oxidized areas were observed compared to T1 (Figure 6a) and T2 (Figure 6b) alloys. This behavior could indicate an increase friction coefficient value of the T3 alloy in the corrosion environment [50].
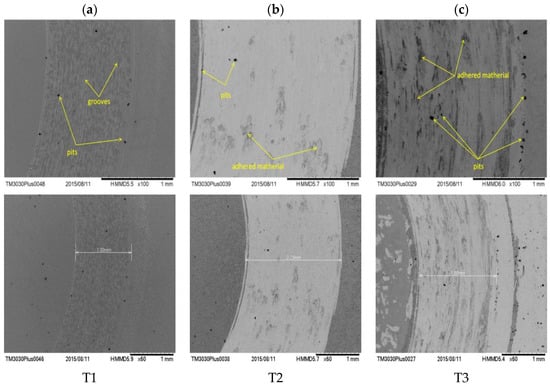
Figure 6.
Scanning electron microscopy (SEM) micrographs of the wear tracks for the T1 (a), T2 (b), and T3 (c) alloys after the tribological tests in Hank solution.
3.4. In Vitro Corrosion Resistance
After implantation of the metallic materials in the human body, the biological environment affects their surfaces, especially since this environment is a highly oxygenated saline electrolyte with a pH of ≈ 7.4 and a temperature of 37 °C. It is well known that the human environment consists of a high content of chloride ions, which are very aggressive and corrosive to metals. When the metal is in direct contact with the corrosive solutions, various metallic ions can be released, which can affect the body’s function mechanism. Thus, before the use of a new material as implant, the corrosion behavior should be evaluated in the laboratory.
The open circuit potential recorded for 24 h and potentiodynamic polarization curves for the investigated alloys in SBF and Hank solutions are shown in Figure 7 and Figure 8, respectively. The electrochemical parameters are presented in Table 4.
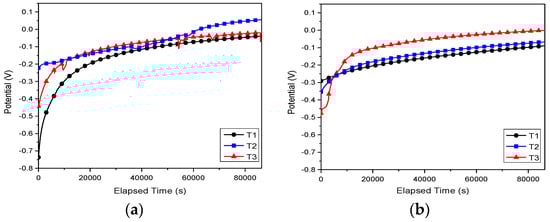
Figure 7.
Open circuit potential vs. time curves of the investigated alloys in (a) SBF and (b) Hank solution.
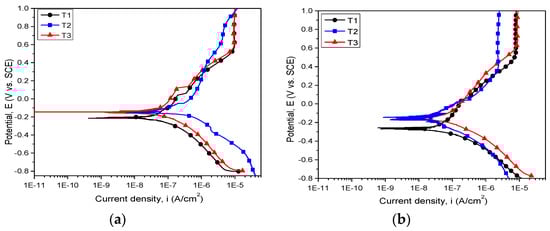
Figure 8.
Potentiodynamic polarization curves of the investigated alloys in (a) SBF and (b) Hank solution.
Table 4.
Electrochemical parameters of the T1, T2, and T3 alloys in SBF and Hank solution: open circuit potential (EOC), corrosion potential (Ecorr), corrosion current density (icorr), polarization resistance (Rp), corrosion rate (CR).
Independent of the electrolyte, both cast and annealed Ti25Nb10Zr alloys showed values of open circuit potential that were more electropositive than the Ti6Al4V alloy (Figure 7). In Hank solution, all investigated alloys exhibited stable open circuit potentials after 5 h of immersion (Figure 7b). In the case of T3 sample immersed in SBF, one may observe some fluctuation of open circuit potentials, indicating the formation/destruction of oxide layer formed during the immersion in electrolyte (Figure 7a). In SBF solution, cast alloy (T2) showed the noblest open circuit potential (55.4 mV). In Hank electrolyte, the most electropositive value of open circuit potential was found for T3 alloy (−0.7 mV).
The evaluation of corrosion behavior can be performed based on certain criteria, as follows. A material with a more electropositive corrosion potential (Ecorr) value is more resistant to corrosive attack. Taking into account this criterion, both T2 and T3 samples proved to be more resistant to SBF and Hank attacks than the Ti6Al4V alloy. In SBF electrolyte, T2 showed the most electropositive value of corrosion potential (−138 mV). On the other hand, in Hank solution, the T2 and T3 samples exhibited similar values of Ecorr (≈ −155 mV). It is stated that a surface with low icorr value presents a high corrosion resistance. According to this state, it can be seen that the low icorr values were found in SBF for T3 (68.07 nA/cm2) and in Hank for T2 (46.25 nA/cm2). Considering the Rp values, it is well know that a high value indicates high corrosion resistance. The highest value of Rp was found for T2 in Hank solution.
Baboian [51] and Mansfeld [52] claimed that a material is resistant to corrosion when it exhibits electropositive values of Ecorr, high Rp, and low icorr values. Based on these criteria, it can be seen that Ti25Nb10Zr alloy is nobler when compared with the Ti6Al4V alloy, independent of their metallurgical conditions. The new alloy’s corrosive behavior is significantly influenced by the nature of the corrosive solution. In SBF solution (Figure 8a), the corrosion resistance of Ti25Nb10Zr alloy is enhanced after annealing (T3). In Hank solution (Figure 8b), the cast Ti25Nb10Zr alloy (T2) possessed better corrosion resistance, while the corrosion resistance of T3 alloy was close to the T2 one.
Comparing the aspect of the potentiodynamic curves, it is obvious that for all the investigated alloys the passivation process takes place. The passivation domain started from 403 mV for T2, from 531 mV for T1, and from 632 mV for T3, T2 being the first surface which starts to passivate (Figure 8b). In SBF solution, a clear passivation domain is observed in the case of T1 and T3, while T2 started to passivate approximately 150 mV earlier (Figure 8a).
3.5. Wettability
It has been reported that the wettability properties influence the corrosion resistance and biocompatibility of metallic implants [53,54]. Moreover, by adjusting the wettability, the anticorrosive and biological properties can be controlled.
The wettability parameters are summarized in Table 5. The contact angle of Ti6Al4V alloy was of approximately 64.8°. In the literature, the contact angle for Ti6Al4V alloy ranged from 70° to 75° [33,55]. A slight difference between our values and the results available in the literature can be observed. A possible explanation would be the differences between the roughness values of the investigated samples, the roughness of T1 being slightly higher when compared with T2 or T3. It is known that the wettability is strongly influenced by the surface roughness [56].
Table 5.
Contact angle values, the surface free energy components and the work of adhesion for deionized water (Wadhwater).
According to Berg and co-authors when a contact angle is below 65°, the surface possesses a repulsive force, being a hydrophilic surface [57]. The contact angle of cast and annealed Ti25Nb10Zr alloy ranged from 55.2° to 57.7°, being smaller than those of Ti6Al4V alloy. The Ti25Nb10Zr tends to a hydrophilic surface. One may observe that the contact angles for T2 and T3 alloys are similar, indicating that the annealing treatment does not influence the wettability properties.
As known, a low contact angle indicates good wettability (the liquid must flow easily over the entire surface and adhere to the solid surface). According to this statement, it can be seen that both cast and annealed Ti25Nb10Zr alloy exhibited low contact angle, indicating good wetting.
Surface energy at the surface of a solid is greater than its interior energy. The outer atoms are not equally attracted to each other and the energy is greatest on the outermost atomic layer due to the unsaturated bonds which generate surface energies. When a liquid is placed on a lower-energy surface, the contact angle will be higher as compared with a higher-energy surface metal. In biomedical applications, the implant’s surface properties are responsible for the biological response at the implant-host interface.
The wettability and the surface energy of the implant surface influenced the biocompatibility of the metallic implants. The investigated Ti25Nb10Zr alloys exhibited a hydrophilic character. The surface energy plays an important role in the relation between the cells and metallic implant surface. A good cell adhesion was found on those surfaces with low surface energy [58]. Our experiments showed that the T2 exhibited the same surface tension, while for T3 it is a little bit higher than of Ti6Al4V alloy. By determining the work of adhesion, the interaction of cells with the metallic implant surfaces can be predicted. In the literature, it was reported that a higher value of work adhesion than 60 mN/m indicated a high adhesion of the cell to implant surface [59]. Moreover, it was demonstrated that the osteonectine and osteocalcin genes were more attached to the hydrophilic surfaces with high work adhesion [59,60]. Thus, we can predict that cast alloy (T2) can be a promising candidate for biomedical applications.
Our experiment revealed that the Ti25Nb10Zr alloy has a higher surface energy than Ti6Al4V alloy. Usually, the hydrophilic surfaces present a superior corrosion behavior and high biocompatibility than hydrophobic surfaces, possibly due to their higher surface energy [61]. According to Sullivan et al. protein will adhere to surfaces with high surface energy and good wettability, leading to a strong cell adhesion [62].
3.6. In Vitro Biological Properties
For a better comparison of the biological properties of Ti25Nb10Zr alloy, the most used metals in implant manufacturing were chosen: pure Ti (cpTi) and Ti6Al4V alloy (Grade 5 ELI). The viability of cultured osteoblasts on the pure Ti, Ti6Al4V and the new alloy is shown in Figure 9a,b at 3- and 5-days, respectively, as measured by the MTT assay. After 3-days the viability of cells grown on Ti25Nb10Zr (Figure 9a) is higher than that recorded for the other two samples (pure Ti and Ti6Al4V) and on day 5 the level remains comparable to that recorded for pure Ti sample (Figure 9b).
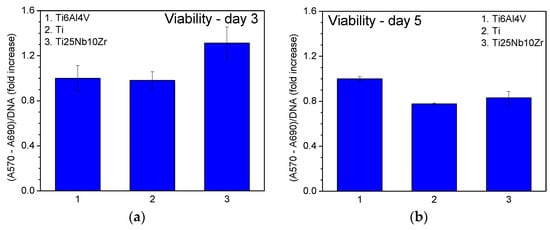
Figure 9.
Cell viability of the samples measured after 3 (a) and 5 (b) days of culture.
Actin labelling in osteoblast cells has shown a cytoskeleton composed of intracellular filaments (stress fibers) with parallel orientation in cells grown on alloys and pure Ti surface (Figure 10a). It can be observed that some of the stress fibers crossed the totality of the cells and some of them ended in a focal contact. SEM analysis of MG 63 cells grown on pure Ti and Ti alloys showed that, in all cases, the cells were uniformly spread and presented a flattened polygonal morphology (Figure 10b). The average results of cell proliferation tests are represented in Figure 11. On day 3 (Figure 11a) and day 5 (Figure 11b), the cell proliferation level recorded for Ti25Nb10Zr sample is comparable to that of pure Ti sample and slightly lower than the one recorded for Ti6Al4V. On day 5 alkaline phosphatase activity (ALP) (Figure 12b), is similar to that of the other two samples, though on day 3 it is slightly higher (Figure 12a).
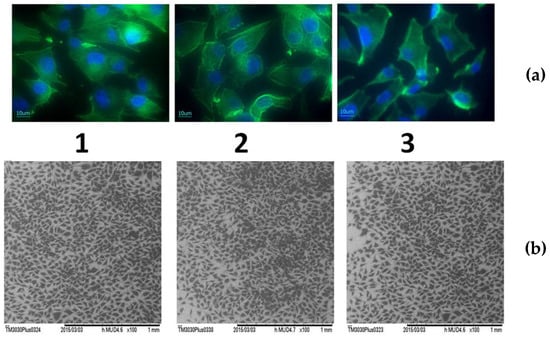
Figure 10.
Cellular morphology of osteoblasts grown for 3 days on pure Ti and Ti alloys: (a)—Immunofluorescence labelling of actin (green) and nucleus (blue) of osteoblast cells cultured for 3 days on the: 1—Ti6Al4V, 2—pure Ti, 3—Ti25Nb10Zr; (b)—Scanning electron micrograph of osteoblasts after 3 days culture on the: 1—Ti6Al4V, 2—pure Ti, 3—Ti25Nb10Zr.
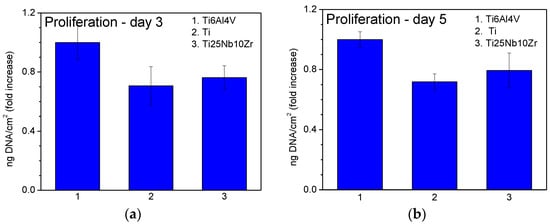
Figure 11.
Cell proliferation of the samples measured after 3 (a) and 5 (b) days of culture.
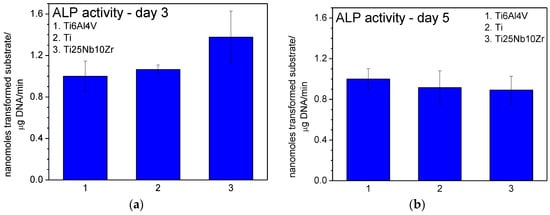
Figure 12.
Alkaline phosphatase (ALP) activity in cells grown on the samples measured after 3 (a) and 5 (b) days of culture.
The levels of osteoblastic gene expression after 3 and 5 days of incubation are shown in Figure 13. On both day 3 and day 5, for all the samples, osteocalcin and osteonectin messenger RNA is expressed. On day 3 the value of osteocalcin recorded for the sample Ti25Nb10Zr is comparable to that recorded for pure Ti sample and higher than that recorded for Ti6Al4V. On day 5 osteocalcin expression level is comparable to that recorded for the pure Ti and Ti6Al4V samples and the osteonectin expression level is slightly higher than them.
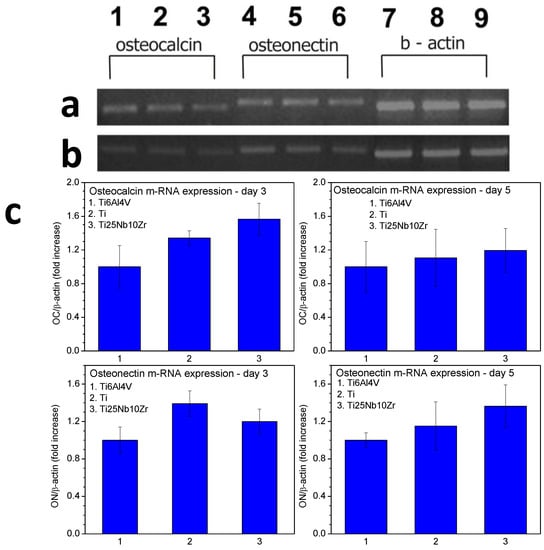
Figure 13.
Osteocalcin and osteonectin gene expression of MG63 cells grown on pure Ti and two kinds of alloys (Ti25Nb10Zr and Ti6Al4V) by RT-PCR. (a) Osteocalcin gene expression in cells grown for 3 days on: 1—Ti25Nb10Zr, 2—pure Ti, 3—Ti6Al4V, osteonectin gene expression in cells grown for 3 days on: 4—Ti25Nb10Zr, 5—pure Ti, 6—Ti6Al4V, β actin gene expression in cells grown for 3 days on: 7—Ti25Nb10Zr, 8—pure Ti, 9—Ti6Al4V; (b) Osteocalcin gene expression in cells grown for 5 days on: 1—Ti25Nb10Zr, 2—pure Ti, 3—Ti6Al4V, osteonectin gene expression in cells grown for 3 days on: 4—Ti25Nb10Zr, 5—pure Ti, 6—Ti6Al4V, β actin gene expression in cells grown for 3 days on: 7—Ti25Nb10Zr, 8—pure Ti, 9—Ti6Al4V; (c) The semiquantitative RT-PCR results expressed as relative mRNA levels.
4. Discussions
The in vivo cells attachment to a metallic implant is a complex process which is influenced by various factors such as structural-physico-chemical characteristics, surface topography and roughness of implant surfaces, characteristics of the surface oxide layer formed on top of the implant after immersion in human environments, as well as the constituents of implant materials etc. In the case of our results, the correlation between the mechanical, anticorrosive, tribological, and biological characteristics can be described as follows.
Surface roughness governs the topography of the surface, while the nature and height of asperity are two factors which play an important role on the corrosion, tribological, and biological behavior of the implant after insertion into the human body as follows. It was reported that the smoother surfaces are related to lower friction coefficient and good corrosion resistance. A possible explanation could be due to the high asperity and the distance between them. In the case of a surface with many and high asperities, the distance between them will be larger and the actual area of the solution-surface contact will be larger, leading to an increase of the interface between solution and implant surface.
However, there is limited information concerning the influence of surface roughness and topography on the corrosion behavior of Ti alloys or vice versa. Nevertheless, most of the published papers are related to the analysis of surface behavior under corrosive conditions. Thus, the correlation between the roughness and corrosion behavior of a material is not well understood. For example, Conradi et al. reported that the superior corrosion resistance of composite coating is due to their high surface roughness and higher hydrophobicity [63]. Toloei et al. polished to different roughness values the surface of nickel in order to investigate which is the effect of surface roughness on the corrosion in 0.5 M H2SO4 at 23 ± 1 °C. They found that the corrosion rate of nickel increased with an increase of surface roughness [64]. They demonstrated that the depth of the valleys found for the rougher surfaces is a suitable place for an active localized corrosion because inside them there is a higher accumulation of aggressive species which will accelerate the corrosive process [64]. The same results were obtained by Burstein and Vines in the case of investigation of stainless steel in chloride solution [65]. Thus, the published results regarding the correlation of roughness and corrosion resistance are controversial.
If we take into account our results, a slight increase in roughness of Ti25Nb10Zr alloy after annealing was observed. Thus, the superior corrosion of annealed alloy in SBF could be probably attributed to this roughness increase. However, the superior corrosion behavior in Hank solution of coated Ti25Nb10Zr alloy is probably due to other factors which affect the corrosion process such as the alloy structure and/or corrosion products. According to our experiments, the grain refinement could be a reason for a good corrosion resistance of the alloy after annealing, but only in the case of the alloy investigated in SBF solution. In Hank solution, the cast alloy proved to have the best corrosion resistance, even if this alloy exhibited higher grain size than of annealed alloy. The poor corrosion resistance of annealed alloy (T3) in Hank solution can be probably attributed to the coarse microstructure of alloy. Visible grain boundaries were observed on the surface of annealed alloy (Figure 1) where the segregation of impurities can take place and susceptibility to intergranular corrosion can increase. Moreover, the density of grain boundaries of the alloys increased after annealing (Figure 1) which can be another reason for poor corrosion. Balakrishnan et al. reported that a high density of grain boundaries promotes the increase of adhesion of a passive film to the alloy surface, leading to the corrosion resistance enhancement [66]. It can be difficult to prove that the good corrosion of Ti25Nb10Zr alloy is due exclusively to its microstructure.
The nature of electrolyte may play an important role in aggressiveness and corrosion mechanisms. The Hank solution is less aggressive than SBF, due to the ion concentration (27 mmol/L) which is six times less than in SBF (4.09 mmol/L), being a reason for the differences in corrosive behavior of the alloy. Moreover, the NaH2PO4 and KH2PO4 acts as an inhibitor for the corrosion process [67]. For example, Liang and Mou investigated the effects of different electrolytes (Ringer’s, PBS, and Hank’s solution) on corrosion of 316L stainless steel, Co-Cr alloy, and Ti6Al4V, finding that the corrosion caused by the Ringer’s solution is more active, followed by the PBS and Hank’s solution [67].
At the contact of material surface with corrosive solution, chemical reactions take place, some of which involve the formation/dissolution of various oxides and the differences in amounts of these oxides will influence the corrosion performance. Corrosion resistance of the metallic surface is also ascribed to the presence of a passive oxide layer formed on top of the surface that limits susceptibility to corrosive attack in the human body. To sum up, the differences in corrosion behavior of cast and annealed Ti25Nb10Zr alloy may be due to the combined effects of several factors, but for establishing the role played by each one, further investigations are needed, especially with regard to a better understanding of the phenomena taking place at the surface - solution interfaces.
Xiong and Deng showed that after Ti6Al4V annealing, the contact angle decreased and the tribological behavior in water and bovine serum increased [33]. Thus, the low contact angle can indicate a good tribological performance. This conclusion is also in good agreement with our experiments, which showed that the friction performance of annealed Ti25Nb10Zr is inferior to that of the untreated alloy, while the contact angle is lower.
The biocompatibility of metallic surfaces is affected by many factors such as surface energy, roughness, wettability, nature of material etc. For example, low surface energy is desired for superior hemocompatibility, as in the case of the materials used for stents [68]. Moreover, the low energy facilitates adhesion of albumin and inhibits adhesion of fibrinogen [68,69]. Baier et al. demonstrated that at the contact between blood and implants, two well-recognized processes may take place: the adsorption of proteins which leads to coagulation and the adhesion of platelets, at first to the implant surface and then to each other [70]. A thrombus is formed by developing platelets, which adhere to the implant surface. Moreover, Baier et al. agree that adhesion and spreading of cells in contact with implant surface can be a direct function of the solid surface energy [70].
In the literature, there are several studies which revealed that the rougher surface promoted osteoblast differentiation, increased bone-to-implant contact in vivo and improved clinical rates of wound healing [71,72]. Gittens et al. showed that the nanoscaled surface roughness could be more proper for osteoblast differentiation and tissue regeneration, because the size of proteins and cell membrane receptors are nanometric [71]. Some scientists explained that a high osteoblast proliferation on nanoscale rougher surfaces could be explained by the increase in alkaline phosphatase (ALP) synthesis and higher immunostaining of osteocalcin and osteonectin [71,73]. Our experimental results showed that osteonectin and osteocalcin gene expression of MG63 cells grown after 5 days on Ti25Nb10Zr alloy is higher compared with Ti6Al4V and pure Ti surfaces. An increase in alkaline phosphatase was also observed for Ti25Nb10Zr alloy. Thus, Ti25Nb10Zr alloy can be a possible candidate for replacing the pure Ti and Ti6Al4V alloy in biomedical applications.
To summarize, a rougher surface enhanced cell attachment, spreading and proliferation, while a smoother surface provided a small surface area for corrosion attack, leading to an improvement of the corrosion resistance. A hydrophilic surface provides high corrosion resistance. Therefore, due to all of the requirements imposed by the uses of metallic material for biomedical applications, it is necessary to make a compromise between biocompatibility, corrosion resistance, and tribological performance.
5. Conclusions
In this study, Ti25Nb10Zr alloy is proposed to replace Ti6Al4V in biomedical applications. The novel alloy consists only of highly biocompatible elements (Ti, Nb, Zr), in order to avoid adverse reactions of the human body. Conducted investigations showed the following:
- The cast Ti25Nb10Zr alloy is characterized by the presence of α + β phases. After annealing, enlarged dark grains appear delimited by a light network. Inside the delimited area, an acicular microstructure assigned to martensite with the needles oriented in the same direction was observed.
- The average hardness of the cast alloy was 2.3 GPa. After thermal treatment, the hardness increased by 1.8 GPa.
- The investigated alloy showed a low elastic modulus, 57.4 GPa (as-cast) and 52.3 GPa (annealed), being lower as compared to Ti6Al4V alloy (110 GPa).
- The yield strength of Ti25Nb10Zr alloy ranged from 427.2 MPa (as-cast) to 488.6 MPa (annealed), being lower than of Ti6Al4V alloy (930 MPa).
- The cast Ti25Nb10Zr alloy exhibits a lower friction coefficient in SBF (0.37) than that of annealed Ti25Nb10Zr alloy (0.70).
- The annealed Ti25Nb10Zr alloy has similar values of friction coefficient in both SBF and Hank solutions (µ ≈ 0.70).
- In SBF, a low wear rate was found for cast Ti25Nb10Zr alloy (0.07 × 10⁻⁶ mm3·N−1·m−1), followed by Ti6Al4V (413 × 10−6 mm3·N−1·m−1) and annealed Ti25Nb10Zr alloy (797 × 10−6 mm3·N−1·m−1).
- In Hank solution, the wear rate for cast and annealed Ti25Nb10Zr alloy ranged between 858 ÷ 1418 × 10−6 mm3·N−1·m−1 values, being higher than the values obtained in SBF solution.
- Independent of the electrolyte, both cast and annealed Ti25Nb10Zr alloys showed values of open circuit potential and corrosion potential that were more electropositive than the Ti6Al4V alloy. The low current density values were found in SBF for annealed (68.07 nA/cm2) and in Hank for cast 46.25 nA/cm2) alloy. The highest value of polarization resistance was measured for cast alloy tested in Hank solution. A material is resistant to corrosion when exhibiting electropositive values of Ecorr, high Rp and low icorr values. Taking into account these criteria, it can be seen that Ti25Nb10Zr alloy is more resistant to corrosion in SBF and Hank solutions when compared to the Ti6Al4V alloy, independent of their metallurgical conditions (cast or annealed).
- Cell viability and proliferation assay after five days showed that the Ti25Nb10Zr alloy exhibited good viability and proliferation with values of approximately 10% higher, respectively, than the ones registered for pure Ti.
- Osteocalcin and osteonectin gene expression of MG63 cells grown after three days on Ti25Nb10Zr surface is comparable to that recorded for pure Ti and higher than of Ti6Al4V alloy. After five days of culture, the osteocalcin expression level of Ti25Nb10Zr alloy is comparable to that recorded for the pure Ti and Ti6Al4V alloy, while the osteonectin expression level is slightly higher than both of them.
Overall, it can be said that the mechanical, anticorrosive, tribological, and biocompatibility properties of Ti25Nb10Zr alloy are superior or as good as Ti6Al4V alloy, being a promising candidate for replacing it in biomedical applications.
Acknowledgments
The work was supported under the grant of the Romanian National Authority for Scientific Research, CNCS—UEFISCDI, project number PN-II-PT-PCCA-2014-212 (OSSEOPROMOTE). SEM&EDS analysis were carried out using the equipment acquired by the infrastructure project INOVA-OPTIMA SMIS code 49164, contract No. 658/2014.
Author Contributions
C.M.C., I.T., D.M.V., A.V. analyzed the data and wrote the paper; A.P., A.I.G., I.P., D.C., V.P., D.M.V. performed the experiments; I.D. obtained the alloy; A.I.G., L.C. contributed reagents/materials/analysis tools; C.M.C. and A.V. provided expertise and editing, conceived and designed the experiments.
Conflicts of Interest
The authors declare no conflict of interest. The founding sponsors had no role in the design of the study; in the collection, analyses, or interpretation of data; in the writing of the manuscript, and in the decision to publish the results.
References
- United Nations Department of Economic; Social Affairs Population Division. World Population Ageing: 1950–2050; United Nations: New York, NY, USA, 2001.
- Itasca, I. National Safety Council—Injury Fact; National Safety Council: Itasca, IL, USA, 2015. [Google Scholar]
- Özcan, M.; Hämmerle, C. Titanium as a reconstruction and implant material in dentistry: Advantages and pitfalls. Materials (Basel) 2012, 5, 1528–1545. [Google Scholar] [CrossRef]
- Niinomi, M. Recent research and development in titanium alloys for biomedical applications and healthcare goods. Sci. Technol. Adv. Mater. 2003, 4, 445–454. [Google Scholar] [CrossRef]
- Liu, X.; Chu, P.; Ding, C. Surface modification of titanium, titanium alloys, and related materials for biomedical applications. Mater. Sci. Eng. R Rep. 2004, 47, 49–121. [Google Scholar] [CrossRef]
- De Almeida, L.H.; Bastos, I.N.; Santos, I.D.; Dutra, A.J. B.; Nunes, C.A.; Gabriel, S.B. Corrosion resistance of aged Ti-Mo-Nb alloys for biomedical applications. J. Alloy. Compd. 2015, 615, S666–S669. [Google Scholar] [CrossRef]
- Weinstein, A.; Horowitz, E.; Ruff, A.W. Retrieval and Analysis of Orthopaedic Implants; US Government printing office: Washingtin, DC, USA, 1977; pp. 23–30.
- BCC Research. Advanced Orthopedic Technologies, Implants and Regenerative Products; BCC Research: Wellesley, MA, USA, 2011. [Google Scholar]
- Biomaterials Market Overview. Avaliable online: https://www.alliedmarketresearch.com/biomaterials-market (accessed on 25 November 2016).
- Azevedo, C.R.F.; Hippert, E. Failure analysis of surgical implants in Brazil. Eng. Fail. Anal. 2002, 9, 621–633. [Google Scholar] [CrossRef]
- Miller, P.D.; Holladay, J.W. Friction and wear properties of titanium. Wear 1958, 2, 133–140. [Google Scholar] [CrossRef]
- Qu, J.; Blau, P.J.; Watkins, T.R.; Cavin, O.B.; Kulkarni, N.S. Friction and wear of titanium alloys sliding against metal, polymer, and ceramic counterfaces. Wear 2005, 258, 1348–1356. [Google Scholar] [CrossRef]
- Mao, C.; Li, H.; Cui, F.; Ma, C.; Feng, Q. Oriented growth of phosphates on polycrystalline titanium in a process mimicking biomineralization. J. Cryst. Growth 1999, 206, 308–321. [Google Scholar] [CrossRef]
- Mao, C.; Li, H.; Cui, F.; Feng, Q.; Ma, C. The functionalization of titanium with EDTA to induce biomimetic mineralization of hydroxyapatite. J. Mater. Chem. 1999, 9, 2573–2582. [Google Scholar] [CrossRef]
- Ning, C.; Yu, P.; Zhu, Y.; Yao, M.; Zhu, X.; Wang, X.; Lin, Z.; Li, W.; Wang, S.; Tan, G.; et al. Built-in microscale electrostatic fields induced by anatase–rutile-phase transition in selective areas promote osteogenesis. NPG Asia Mater. 2016, 8, e243. [Google Scholar] [CrossRef] [PubMed]
- Ning, C.; Wang, S.; Zhu, Y.; Zhong, M.; Lin, X.; Zhang, Y.; Tan, G.; Li, M.; Yin, Z.; Yu, P.; et al. Ti nanorod arrays with a medium density significantly promote osteogenesis and osteointegration. Sci. Rep. 2016, 6, 19047. [Google Scholar] [CrossRef] [PubMed]
- Steinemann, S.G. Corrosion of surgical implants—In vivo and in vitro tests. In Evaluation of Biomaterials; Winter, D., Leray, L.J., de Groot, K., Eds.; John Wiley & Sons: New York, NY, USA, 1980; pp. 1–34. [Google Scholar]
- Geetha, M.; Singh, A.K.; Asokamani, R.; Gogia, A.K. Ti based biomaterials, the ultimate choice for orthopaedic implants—A review. Prog. Mater. Sci. 2009, 54, 397–425. [Google Scholar] [CrossRef]
- Braic, M.; Vladescu, A.; Braic, V.; Cotrut, C.M.; Stanciu, D. Corrosion behaviour of Ti-10Nb-10Zr-5Ta alloys in artificial saliva solution with fluoride content. Mater. Corros. 2015, 66, 1331–1337. [Google Scholar] [CrossRef]
- Long, M.; Rack, H.J. Titanium alloys in total joint replacement—A materials science perspective. Biomaterials 1998, 19, 1621–1639. [Google Scholar] [CrossRef]
- Wang, X.; Zhang, L.; Guo, Z.; Jiang, Y.; Tao, X.; Liu, L. Study of low-modulus biomedical β Ti-Nb-Zr alloys based on single-crystal elastic constants modeling. J. Mech. Behav. Biomed. Mater. 2016, 62, 310–318. [Google Scholar] [CrossRef] [PubMed]
- Lee, C.M.; Ju, C.P.; Chern Lin, J.H. Structure-property relationship of cast Ti-Nb alloys. J. Oral Rehabil. 2002, 29, 314–322. [Google Scholar] [CrossRef] [PubMed]
- Correa, D.R.N.; Vicente, F.B.; Donato, T.A.G.; Arana-Chavez, V.E.; Buzalaf, M.A.R.; Grandini, C.R. The effect of the solute on the structure, selected mechanical properties, and biocompatibility of Ti-Zr system alloys for dental applications. Mater. Sci. Eng. C 2014, 34, 354–359. [Google Scholar] [CrossRef] [PubMed]
- Kobayashi, E.; Doi, H.; Yoneyama, T.; Hamanaka, H.; Gibson, I.R.; Best, S.M.; Shelton, J.C.; Bonfield, W. Influence of aging heat treatment on mechanical properties of biomedical Ti-Zr based ternary alloys containing niobium. J. Mater. Sci. Mater. Med. 1998, 9, 625–630. [Google Scholar] [CrossRef] [PubMed]
- Yang, G.; Zhang, T. Phase transformation and mechanical properties of the Ti50Zr30Nb10Ta10 alloy with low modulus and biocompatible. J. Alloy. Compd. 2005, 392, 291–294. [Google Scholar] [CrossRef]
- Cvijovic-Alagic, I.; Cvijovic, Z.; Mitrovic, S.; Panic, V.; Rakin, M. Wear and corrosion behaviour of Ti-13Nb-13Zr and Ti-6Al-4V alloys in simulated physiological solution. Corros. Sci. 2011, 53, 796–808. [Google Scholar] [CrossRef]
- Huang, H.H.; Wu, C.P.; Sun, Y.S.; Yang, W.E.; Lin, M.C.; Lee, T.H. Surface nanoporosity of β-type Ti-25Nb-25Zr alloy for the enhancement of protein adsorption and cell response. Surf. Coat. Technol. 2014, 259, 206–212. [Google Scholar] [CrossRef]
- BS-EN1071-13:2010 Advanced Technical Ceramics. Methods of Test for Ceramic Coatings. Determination of Wear Rate by the Pin-on-Disk Method. Available online: http://shop.bsigroup.com/ProductDetail/?pid=000000000030170505 (accessed on 6 March 2017).
- ASTM G102-89 (2004), Standard Practice for Calculation of Corrosion Rates and Related Information from Electrochemical Measurements. Available online: www.astm.org/database.cart/historical/g102-89r04e1 (accessed on 6 March 2017).
- Pinzari, F.; Ascarelli, P.; Cappelli, E.; Mattei, G.; Giorgi, R. Wettability of HF-CVD diamond films. Diam. Relat. Mater. 2001, 10, 781–785. [Google Scholar] [CrossRef]
- Fowkes, F.M. Additivity of intermolecular forces at interfaces. I. Determination of the contribution to surface and interfacial tensions of dispersion forces in various liquids. J. Phys. Chem. 1963, 67, 2538–2541. [Google Scholar] [CrossRef]
- Zenkiewicz, M. Methods for the calculation of surface free energy of solids. J. Achiev. Mater. Manuf. Eng. 2007, 24, 137–145. [Google Scholar]
- Zhao, X.; Niinomi, M.; Nakai, M.; Miyamoto, G.; Furuhara, T. Microstructures and mechanical properties of metastable Ti-30Zr-(Cr, Mo) alloys with changeable Young’s modulus for spinal fixation applications. Acta Biomater. 2011, 7, 3230–3236. [Google Scholar] [CrossRef] [PubMed]
- Li, S.J.; Jia, M.T.; Prima, F.; Hao, Y.L.; Yang, R. Improvements in nonlinear elasticity and strength by grain refinement in a titanium alloy with high oxygen content. Scr. Mater. 2011, 64, 1015–1018. [Google Scholar] [CrossRef]
- Guo, S.; Meng, Q.; Cheng, X.; Zhao, X. Microstructural evolution and mechanical behavior of metastable β-type Ti-30Nb-1Mo-4Sn alloy with low modulus and high strength. Prog. Nat. Sci. Mater. Int. 2015, 25, 414–418. [Google Scholar] [CrossRef]
- Guo, S.; Chen, B.; Meng, Q.; Zhao, R.; Zhao, X. Peculiar aging response of near β Ti-25Nb-2Mo-4Sn alloy for biomedical applications. Prog. Nat. Sci. Mater. Int. 2013, 23, 1–6. [Google Scholar] [CrossRef]
- Liu, Q.; Meng, Q.; Guo, S.; Zhao, X. α′ Type Ti-Nb-Zr alloys with ultra-low Young’s modulus and high strength. Prog. Nat. Sci. Mater. Int. 2013, 23, 562–565. [Google Scholar] [CrossRef]
- Meng, Q.; Guo, S.; Liu, Q.; Hu, L.; Zhao, X. A β-type TiNbZr alloy with low modulus and high strength for biomedical applications. Prog. Nat. Sci. Mater. Int. 2014, 24, 157–162. [Google Scholar] [CrossRef]
- Lai, M.; Gao, Y.; Yuan, B.; Zhu, M. Indirect determination of martensitic transformation temperature of sintered nickel-free Ti-22Nb-6Zr alloy by low temperature compression test. Mater. Des. 2014, 60, 193–197. [Google Scholar] [CrossRef]
- Anbarasan, V.; Jeya Ganesh, B.; Raju, S.; Murugesan, S.; Mohandas, E.; Kamachi Mudali, U.; Manivasagam, G. Thermal property characterization of a Ti-4 wt. %Nb-4 wt. %Zr alloy using drop and differential scanning calorimetry. J. Alloy. Compd. 2008, 463, 160–167. [Google Scholar] [CrossRef]
- Cullity, B.D.; Stock, S.R. Elements of X-ray Diffraction, 3rd ed.; Prentice Hall: Upper Saddle River, NJ, USA, 2001. [Google Scholar]
- Vladescu, A.; Braic, V.; Balaceanu, M.; Braic, M.; Parau, A.C.; Ivanescu, S.; Fanara, C. Characterization of the Ti-10Nb-10Zr-5Ta alloy for biomedical applications. Part 1: Microstructure, mechanical properties, and corrosion resistance. J. Mater. Eng. Perform. 2013, 22, 2389–2397. [Google Scholar] [CrossRef]
- Cottrell, A.H.; Artman, R.A. Mechanical Properties of Matter. Am. J. Phys. 1968, 36, 68–69. [Google Scholar] [CrossRef]
- Fan, Z.; Tsakiropoulos, P.; Smith, P.A.; Miodownik, A.P. Extension of the Hall-Petch relation to two-ductile-phase alloys. Philos. Mag. A 1993, 67, 515–531. [Google Scholar] [CrossRef]
- Galindo-Nava, E.I.; Rae, C.M.F. Microstructure-sensitive modelling of dislocation creep in polycrystalline FCC alloys: Orowan theory revisited. Mater. Sci. Eng. A 2016, 651, 116–126. [Google Scholar] [CrossRef]
- Scattergood, R.O.; Koch, C.C.; Murty, K.L.; Brenner, D. Strengthening mechanisms in nanocrystalline alloys. Mater. Sci. Eng. A 2008, 493, 3–11. [Google Scholar] [CrossRef]
- Hou, F.Q.; Li, S.J.; Hao, Y.L.; Yang, R. Nonlinear elastic deformation behaviour of Ti-30Nb-12Zr alloys. Scr. Mater. 2010, 63, 54–57. [Google Scholar] [CrossRef]
- Niinomi, M. Mechanical properties of biomedical titanium alloys. Mater. Sci. Eng. A 1998, 243, 231–236. [Google Scholar] [CrossRef]
- Tong, X.; Zhang, H.; Li, D.Y. Effect of Annealing Treatment on Mechanical Properties of Nanocrystalline α-iron: an Atomistic Study. Sci. Rep. 2015, 5, 8459. [Google Scholar] [CrossRef] [PubMed]
- Billi, F.; Onofre, E.; Ebramzadeh, E.; Palacios, T.; Escudero, M.L.; Garcia-Alonso, M.C. Characterization of modified Ti6Al4V alloy after fretting-corrosion tests using near-field microscopy. Surf. Coat. Technol. 2012, 212, 134–144. [Google Scholar] [CrossRef]
- Baboian, R. Corrosion Tests and Standards: Application and I nterpretation, 2nd ed.; ASTM International: West Conshohocken, PA, USA, 2005. [Google Scholar]
- Mansfeld, F. The Polarization Resistance Technique for Measuring Corrosion Currents; In Mars, G., Fontana, R.W.S., Eds.; Springer: New York, NY, USA, 1976; Volume 6. [Google Scholar]
- Kaibara, Y.; Sugata, K.; Tachiki, M.; Umezawa, H.; Kawarada, H. Control wettability of the hydrogen-terminated diamond surface and the oxidized diamond surface using an atomic force microscope. Diam. Relat. Mater. 2003, 12, 560–564. [Google Scholar] [CrossRef]
- Van Kooten, T.G.; Schakenraad, J.M.; van der Mei, H.C.; Busscher, H.J. Influence of substratum wettability on the strength of adhesion of human fibroblasts. Biomaterials 1992, 13, 897–904. [Google Scholar] [CrossRef]
- Wang, S.; Liu, Y.; Zhang, C.; Liao, Z.; Liu, W. The improvement of wettability, biotribological behavior and corrosion resistance of titanium alloy pretreated by thermal oxidation. Tribol. Int. 2014, 79, 174–182. [Google Scholar] [CrossRef]
- Bartell, F.E.; Shepard, J.W. Surface roughness as related to hysteresis of contact angles. I. The system paraffin-water-air. J. Phys. Chem. 1953, 57, 211–215. [Google Scholar] [CrossRef]
- Berg, J.M.; Eriksson, L.G.T.; Claesson, P.M.; Borve, K.G.N. Three-Component Langmuir-Blodgett Films with a Controllable Degree of Polarity. Langmuir 1994, 10, 1225–1234. [Google Scholar] [CrossRef]
- Wang, S.; Zhang, Y.; Abidi, N.; Cabrales, L. Wettability and Surface Free Energy of Graphene Films. Langmuir 2009, 25, 11078–11081. [Google Scholar] [CrossRef] [PubMed]
- Yang, Y.; Ao, H.; Wang, Y.; Lin, W.; Yang, S.; Zhang, S.; Yu, Z.; Tang, T. Cytocompatibility with osteogenic cells and enhanced in vivo anti-infection potential of quaternized chitosan-loaded titania nanotubes. Bone Res. 2016, 4, 16027. [Google Scholar] [CrossRef] [PubMed]
- Wall, I.; Donos, N.; Carlqvist, K.; Jones, F.; Brett, P. Modified titanium surfaces promote accelerated osteogenic differentiation of mesenchymal stromal cells in vitro. Bone 2009, 45, 17–26. [Google Scholar] [CrossRef] [PubMed]
- Bruschi, M.; Steinmüller-nethl, D.; Goriwoda, W.; Rasse, M. Composition and Modifications of Dental Implant Surfaces. J. Oral Implant. 2015, 2015, 14. [Google Scholar] [CrossRef]
- Sullivan, D.Y.; Sherwood, R.L.; Mai, T.N. Preliminary results of a multicenter study evaluating a chemically enhanced surface for machined commercially pure titanium implants. J. Prosthet. Dent. 1997, 78, 379–386. [Google Scholar] [CrossRef]
- Conradi, M.; Kocijan, A.; Zorko, M.; Verpoest, I. Damage resistance and anticorrosion properties of nanosilica-filled epoxy-resin composite coatings. Prog. Org. Coat. 2015, 80, 20–26. [Google Scholar] [CrossRef]
- Toloei, A.S.; Stoilov, V.; Northwood, D.O. The effect of different surface topographies on the corrosion behaviour of nickel. WIT Trans. Eng. Sci. 2013, 77, 193–204. [Google Scholar]
- Burstein, G.T.; Vines, S.P. Repetitive nucleation of corrosion pits on stainless steel and the effects of surface roughness. J. Electrochem. Soc. 2001, 148, B504–B516. [Google Scholar] [CrossRef]
- Balakrishnan, A.; Lee, B.C.; Kim, T.N.; Panigrahi, B.B. Corrosion Behaviour of Ultra Fine Grained Titanium in Simulated Body Fluid for Implant Application. Trends Biomater. Artif. Organs 2008, 22, 58–64. [Google Scholar]
- Liang, C.-H.; Mou, Z. Effects of different simulated fluids on anticorrosion biometallic materials. Trans. Nonferr. Met. Soc. China 2001, 11, 579–582. [Google Scholar]
- Narayanan, T.S.N.S. Surface Modification of Magnesium and its Alloys for Biomedical Applications; Woodhead Publishing: Cambridge, UK, 2015. [Google Scholar]
- Webb, K.; Hlady, V.; Tresco, P.A. Relative importance of surface wettability and charged functional groups on NIH 3T3 fibroblast attachment, spreading, and cytoskeletal organization. J. Biomed. Mater. Res. 1998, 41, 422–430. [Google Scholar] [CrossRef]
- Baier, R.E.; Shafrin, E.G.; Zisman, W.A. Adhesion: Mechanisms that assist or impede it. Science 1968, 162, 1360–1368. [Google Scholar] [CrossRef] [PubMed]
- Gittens, R.A.; McLachlan, T.; Olivares-Navarrete, R.; Cai, Y.; Berner, S.; Tannenbaum, R.; Schwartz, Z.; Sandhage, K.H.; Boyan, B.D. The effects of combined micron-/submicron-scale surface roughness and nanoscale features on cell proliferation and differentiation. Biomaterials 2011, 32, 3395–3403. [Google Scholar] [CrossRef] [PubMed]
- Zhao, G.; Raines, A.L.; Wieland, M.; Schwartz, Z.; Boyan, B.D. Requirement for both micron- and submicron scale structure for synergistic responses of osteoblasts to substrate surface energy and topography. Biomaterials 2007, 28, 2821–2829. [Google Scholar] [CrossRef] [PubMed]
- Dalby, M.J.; McCloy, D.; Robertson, M.; Wilkinson, C.D.W.; Oreffo, R.O.C. Osteoprogenitor response to defined topographies with nanoscale depths. Biomaterials 2006, 27, 1306–1315. [Google Scholar] [CrossRef] [PubMed]
© 2017 by the authors. Licensee MDPI, Basel, Switzerland. This article is an open access article distributed under the terms and conditions of the Creative Commons Attribution (CC BY) license ( http://creativecommons.org/licenses/by/4.0/).