Article

Application of a GTN Damage Model Predicting the Fracture of 5052-O Aluminum Alloy High-Speed Electromagnetic Impaction

State Key Laboratory of Materials Processing and Die & Mould Technology, College of Materials Science and Engineering, Huazhong University of Science and Technology, Wuhan 430074, China
*
Author to whom correspondence should be addressed.
Metals 2018, 8(10), 761; https://doi.org/10.3390/met8100761
Submission received: 4 September 2018 / Revised: 22 September 2018 / Accepted: 22 September 2018 / Published: 25 September 2018
(This article belongs to the Special Issue Computational Methods in Manufacturing Processes)

Abstract

:
An increasing demand exists within the automotive industry to utilize aluminum alloy sheets because of their excellent strength-weight ratio and low emissions, which can improve fuel economy and reduce environmental pollution. High-speed automobile impactions are complicated and highly nonlinear deformation processes. Thus, in this paper, a Gurson-Tvergaard-Needleman (GTN) damage model is used to describe the damage behavior of high-speed electromagnetic impaction to predict the fracture behavior of 5052-O aluminum alloy under high-speed impaction. The parameters of the GTN damage model are obtained based on high-speed electromagnetic forming experiments via scanning electron microscopy. The high-speed electromagnetic impaction behavior process is analyzed according to the obtained GTN model parameters. The shape of the high-speed electromagnetic impaction in the numerical simulations agrees with the experimental results. The analysis of the plastic strain and void volume fraction distributions are analyzed during the process of high-speed impact, which indicates the validity of using the GTN damage model to describe or predict the fracture behavior of high-speed electromagnetic impaction.

1. Introduction

Low-density materials with good strength properties, such as aluminum alloys, are favored in the automotive, aircraft, and aerospace industries for improving fuel economy and reducing environmental pollution [1]. It is important to characterize the strain rate sensitivity of any material that will be used in a structure that can undergo high rate deformation (e.g., automobile crashes) as well as during the high-velocity forming processes (e.g., electromagnetic forming or electrohydraulic forming). Electromagnetic forming [2,3,4,5,6,7,8] is a powerful and high-speed forming technique wherein a strain rate of 103/s is achieved. It can promote significant increases in strain, causing failure flow-ductility materials and reducing spring-back and wrinkling. Due to electromagnetic forming being a high-speed forming process, the deformation time is extremely short. The temperature has little influence on forming process. Therefore, the temperature effect can be ignored [9]. Automobile high-speed impaction is a complex and nonlinear high-speed deformation process, wherein the stress and strain rates change over the time and ductile fracture may occur in the material. Therefore, establishing a damage model for high strain rate to describe or predict the sheet high-speed failure behavior is important.
Numerous scholars have proposed Gurson-Tvergaard-Needleman (GTN) damage models for different materials. The GTN models were used to predict the ductile fracture of various materials. Young [10] determined the parameters of the GTN model from fracture toughness data and simulated crack growth in through-wall cracked pipes using the GTN model. Butcher et al. [11] proposed a GTN constitutive model to describe DP600 straight-tube hydroforming. The formability and fracture location for two different end-feed loads were in good agreement with the experimental values. Shahzamanian [12] extended the GTN damage criterion to cover Hill’s quadratic anisotropy to predict plastic and damage responses of anisotropic ductile metals. Cricrì [13] used the GTN model to calculate the R-curve in an aeronautical aluminum-based alloy. The simulation procedure produced results in very good agreement with the experimental data. Uthaisangsuk et al. [14] applied the GTN model to predict the two-step forming test and hole expanding test. The hole expansion ratios calculated using the GTN model deviated from the experimental results by less than 3%. Lemiale et al. [15] used the GTN damage model to simulate blanking. This approach has been shown to provide much better results than classical elastoplastic models in terms of blanking force. Zhang et al. [16] introduced a complete Gurson model, and a method that proposed the use of tension specimens, including smooth and notched cylindrical specimens, to determine the micro void nucleation parameters. Abdolvahed [17] used a damage model to determine the forming limit curve of an AA6016-T4 sheet under the quasi-static condition. Teng [18] determined the damage parameters mainly using in-situ tensile tests, verifying the results with experimental studies on hydro-bulging semi-ellipsoidal shells with different aspect ratios. Although many scholars obtained GTN damage models, the model parameters were determined under quasi-static conditions.
Most of the damage deformation to 5052 aluminum alloys are based on quasi-static forming. Damage evolution under quasi-static conditions has been studied [19], and the damage parameters under quasi-static conditions have been obtained by in-situ tensile experiments. However, the strain rate exceeds 103/s under electromagnetic forming. The damage evolution with a high strain rate is different from quasi-static conditions. The damage parameters for a high strain rate are difficult to obtain due to the extremely short deformation time. Additionally, the high strain rate damage model is essential for describing the fracture behavior during high-speed deformation. However, a GTN damage model for 5052-Oaluminum alloy at a high strain rate has not yet been reported. Therefore, determining the damage parameters of 5052-O aluminum alloy at a high strain rate is required.
We mainly aimed to determine the GTN damage model parameters of 5052-O aluminum alloy at a high strain rate. The reliability of the damage model parameters of the 5052-O aluminum alloy at high strain rate was verified through high-speed electromagnetic impaction with different die shapes. The GTN damage model was also used to analyze damage behavior of the 5052-O aluminum alloy sheet during the process of high-speed impaction. The high strain rate damage model predicts the fracture behavior on electromagnetic impaction forming and can be applied to predict the forming limit of high-speed impaction forming. The model fills a gap in the aluminum alloy sheet damage models for high strain rates. This study also lays the foundation for applying the damage mechanics model as a sheet metal failure criterion for high-speed forming of car body aluminum alloy.

2. Damage Modeling

2.1. Gurson’s Model

The model proposed by Gurson [20] was one of the first micromechanical-based models for the description of ductile damage and fracture, which introduced the strong coupling between plastic strain and damage. The governing equations of the model were established by assuming an elliptic sphere embedded into the matrix material. The damage to the void volume fraction was introduced into the plastic yield criterion. The damage occurs when the sheet is subjected to a high-speed impaction. Figure 1a shows the ductile fracture that forms microvoids distributed around two-phase particles, and the coalescence of microvoids. Microvoids coalescence, and local necking visually precedes the fracture of the material. Figure 1b shows the final rupture of the material and the formation of a macroscopic crack. The damage results are reflected in the macroscopic mechanical behavior of the materials. The damage process is associated with macro fracture, which helps to more deeply understand the physical phenomenon.
According to the internal relationship between the microvoids evolution and the plastic potential, Gurson’s model was based on the microvoid damage effect on the plastic deformation of the material. The plastic yield surface equation can be determined [20] for the spherical microvoid element:
Φ = ( σ e q σ y ) 2 + 2 f cosh ( 3 σ H 2 σ y ) ( 1 + f 2 ) = 0
where Φ is the yield function, σ e q is the von Mises equivalent stress, σ H is the hydrostatic pressure, σ y is yield stress, and f is the void volume fraction of the material.

2.2. Gurson-Tvergaard-Needleman (GTN) Model

The Gurson damage model is a single-stage void model that considers the influence of void expansion on the material’s plastic behavior. However, the model does not consider the interaction between the equative void and there differently equative void. Therefore, in order to enhance this model, the void volume fraction of equivalent f is introduced and several mechanisms for damage nucleation have been proposed so that voids can interact with each other. The Gurson model was modified by Tvergaard and Needleman [21,22]. One of the most well-known GTN models was then proposed. The GTN model is expressed as:
Φ = ( σ e q σ y ) 2 + 2 f q 1 cosh ( 3 q 2 σ H 2 σ y ) ( 1 + q 3 ( f ) 2 ) = 0
The void volume fraction of equivalent f is determined by the following function:
f = { f ( f f c ) f c + f u f c f u + f c f u ( f f F ) ( f f c ) ( f c < f < f F )
where f c is the critical volume fraction where rapid coalescence occurs, f F represent the void volume fraction corresponding to failure, q i (I = 1, 2, 3) is the void model coefficients of GTN, q1, q2, and q3 are the constants introduced by Tvergaard [23,24], and f u = 1 / q 1 .
The damage is considered to be isotropic in the GTN model, and the damage variable is the void volume fraction, which is a scalar. The rate of volume void fraction f , which is given by the sum of the nucleation and growth mechanism, is [25]:
f = f g r o w t h + f n u c l e a t i o n
where f g r o w t h represents the rate of void volume fraction caused by void growth and f n u c l e a t i o n is the rate of void volume fraction caused by void nucleation. The growth rate of the voids is proportional to the hydrostatic component of the plastic strain rate ε k k p , as follows:
f g r o w t h = ( 1 f ) ε k k p
The void nucleation rate equation was proposed according to the statistics method by Chu and Needleman [26]:
f n u c l e a t i o n = f N S N 2 π exp [ 1 2 ( ε p ε N S N ) ] ε P
where f N represents the void volume fraction of void nucleating particles, ε N is the mean strain for nucleation, S N is standard deviation of ε p represents the von Mises plastic strain, and ε P is the von Mises plastic strain rate.

3. Experimental Material and Methods

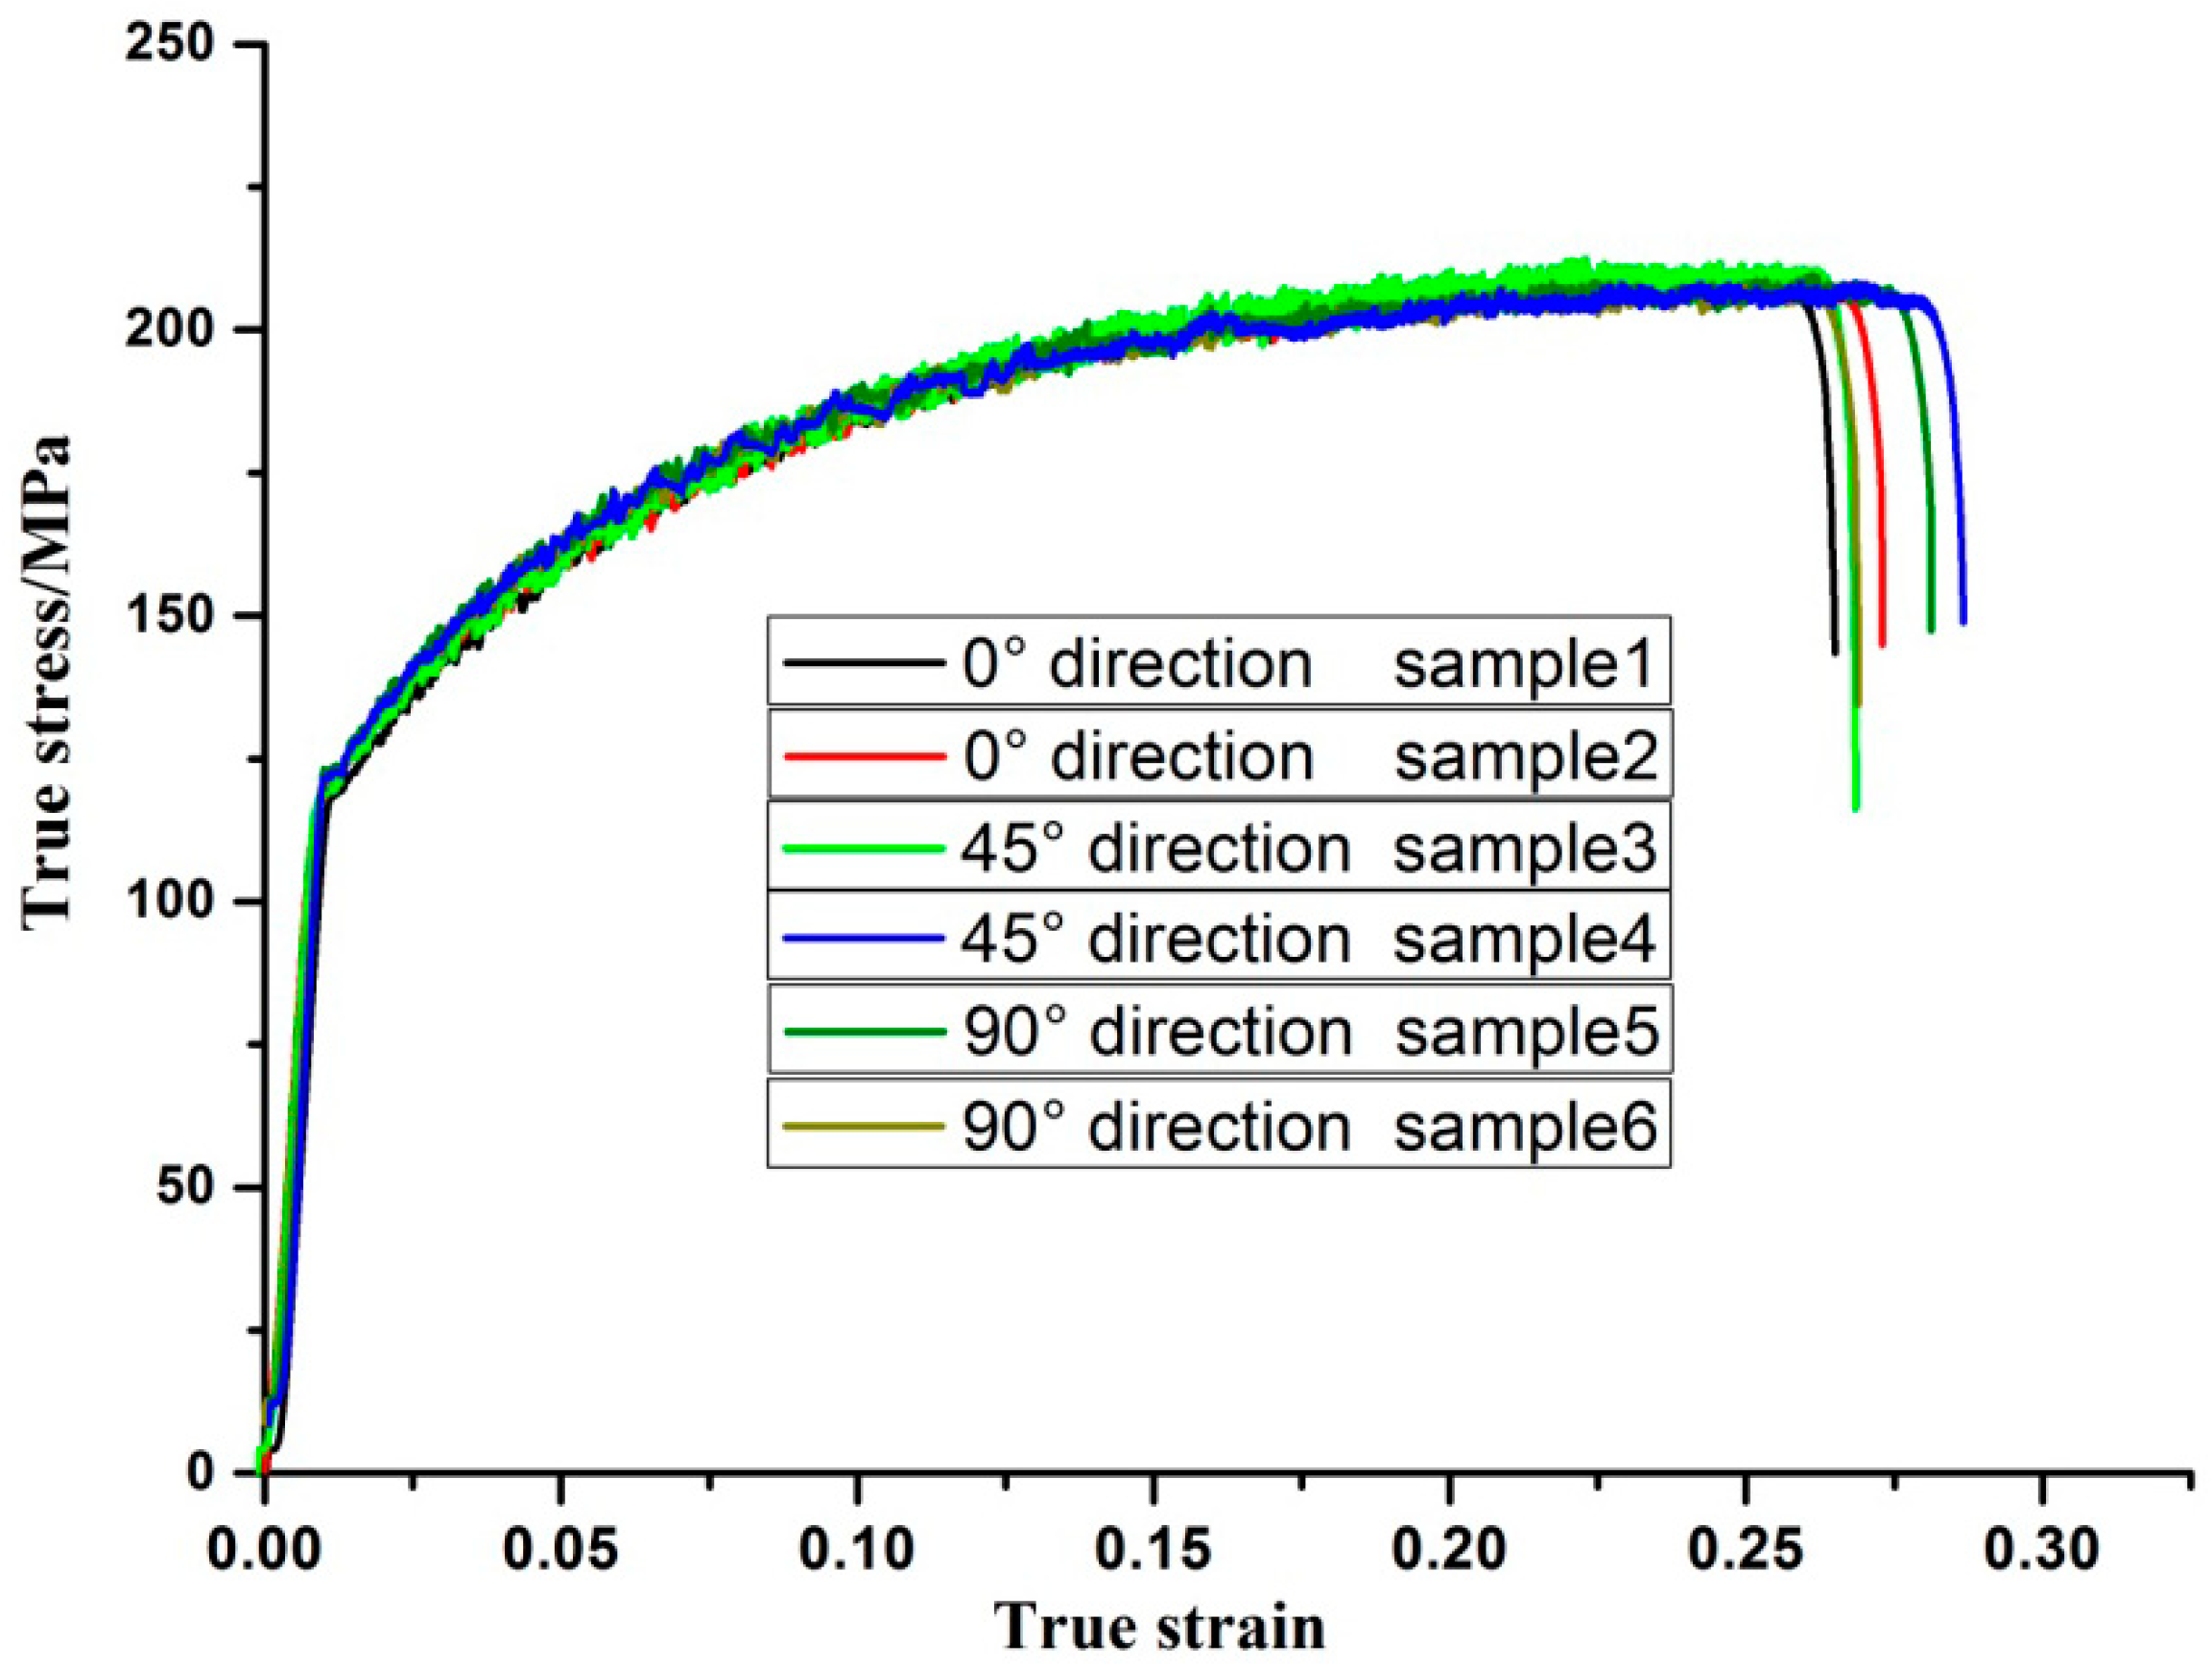
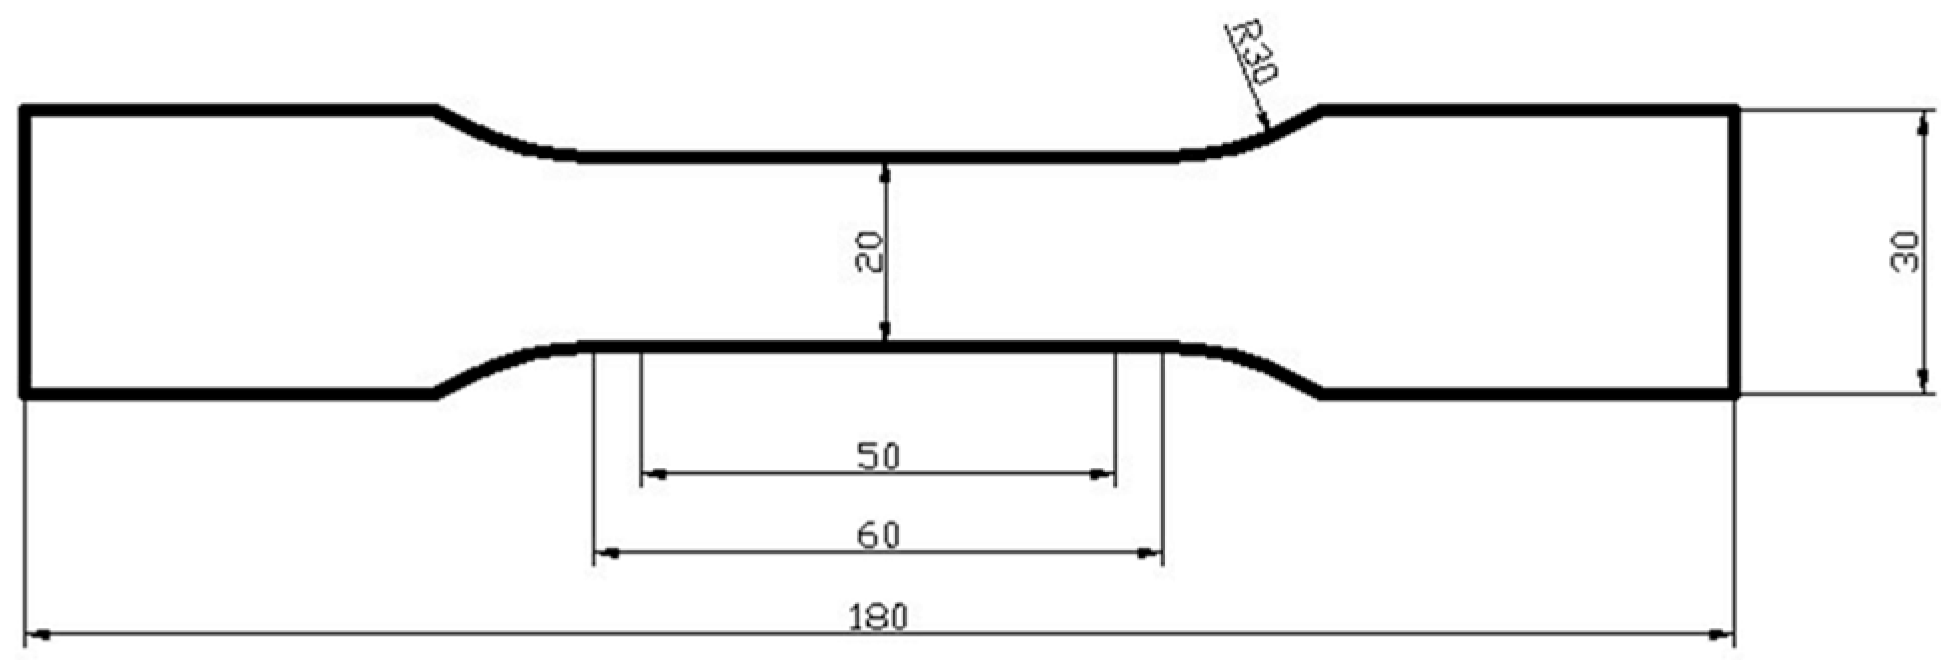
3.1. Experiment Material

The material used in this experiment was commercial 5052-O aluminum alloy. The chemical composition of the1.0-mm-thick 5052-O aluminum alloy sheets are listed in Table 1.

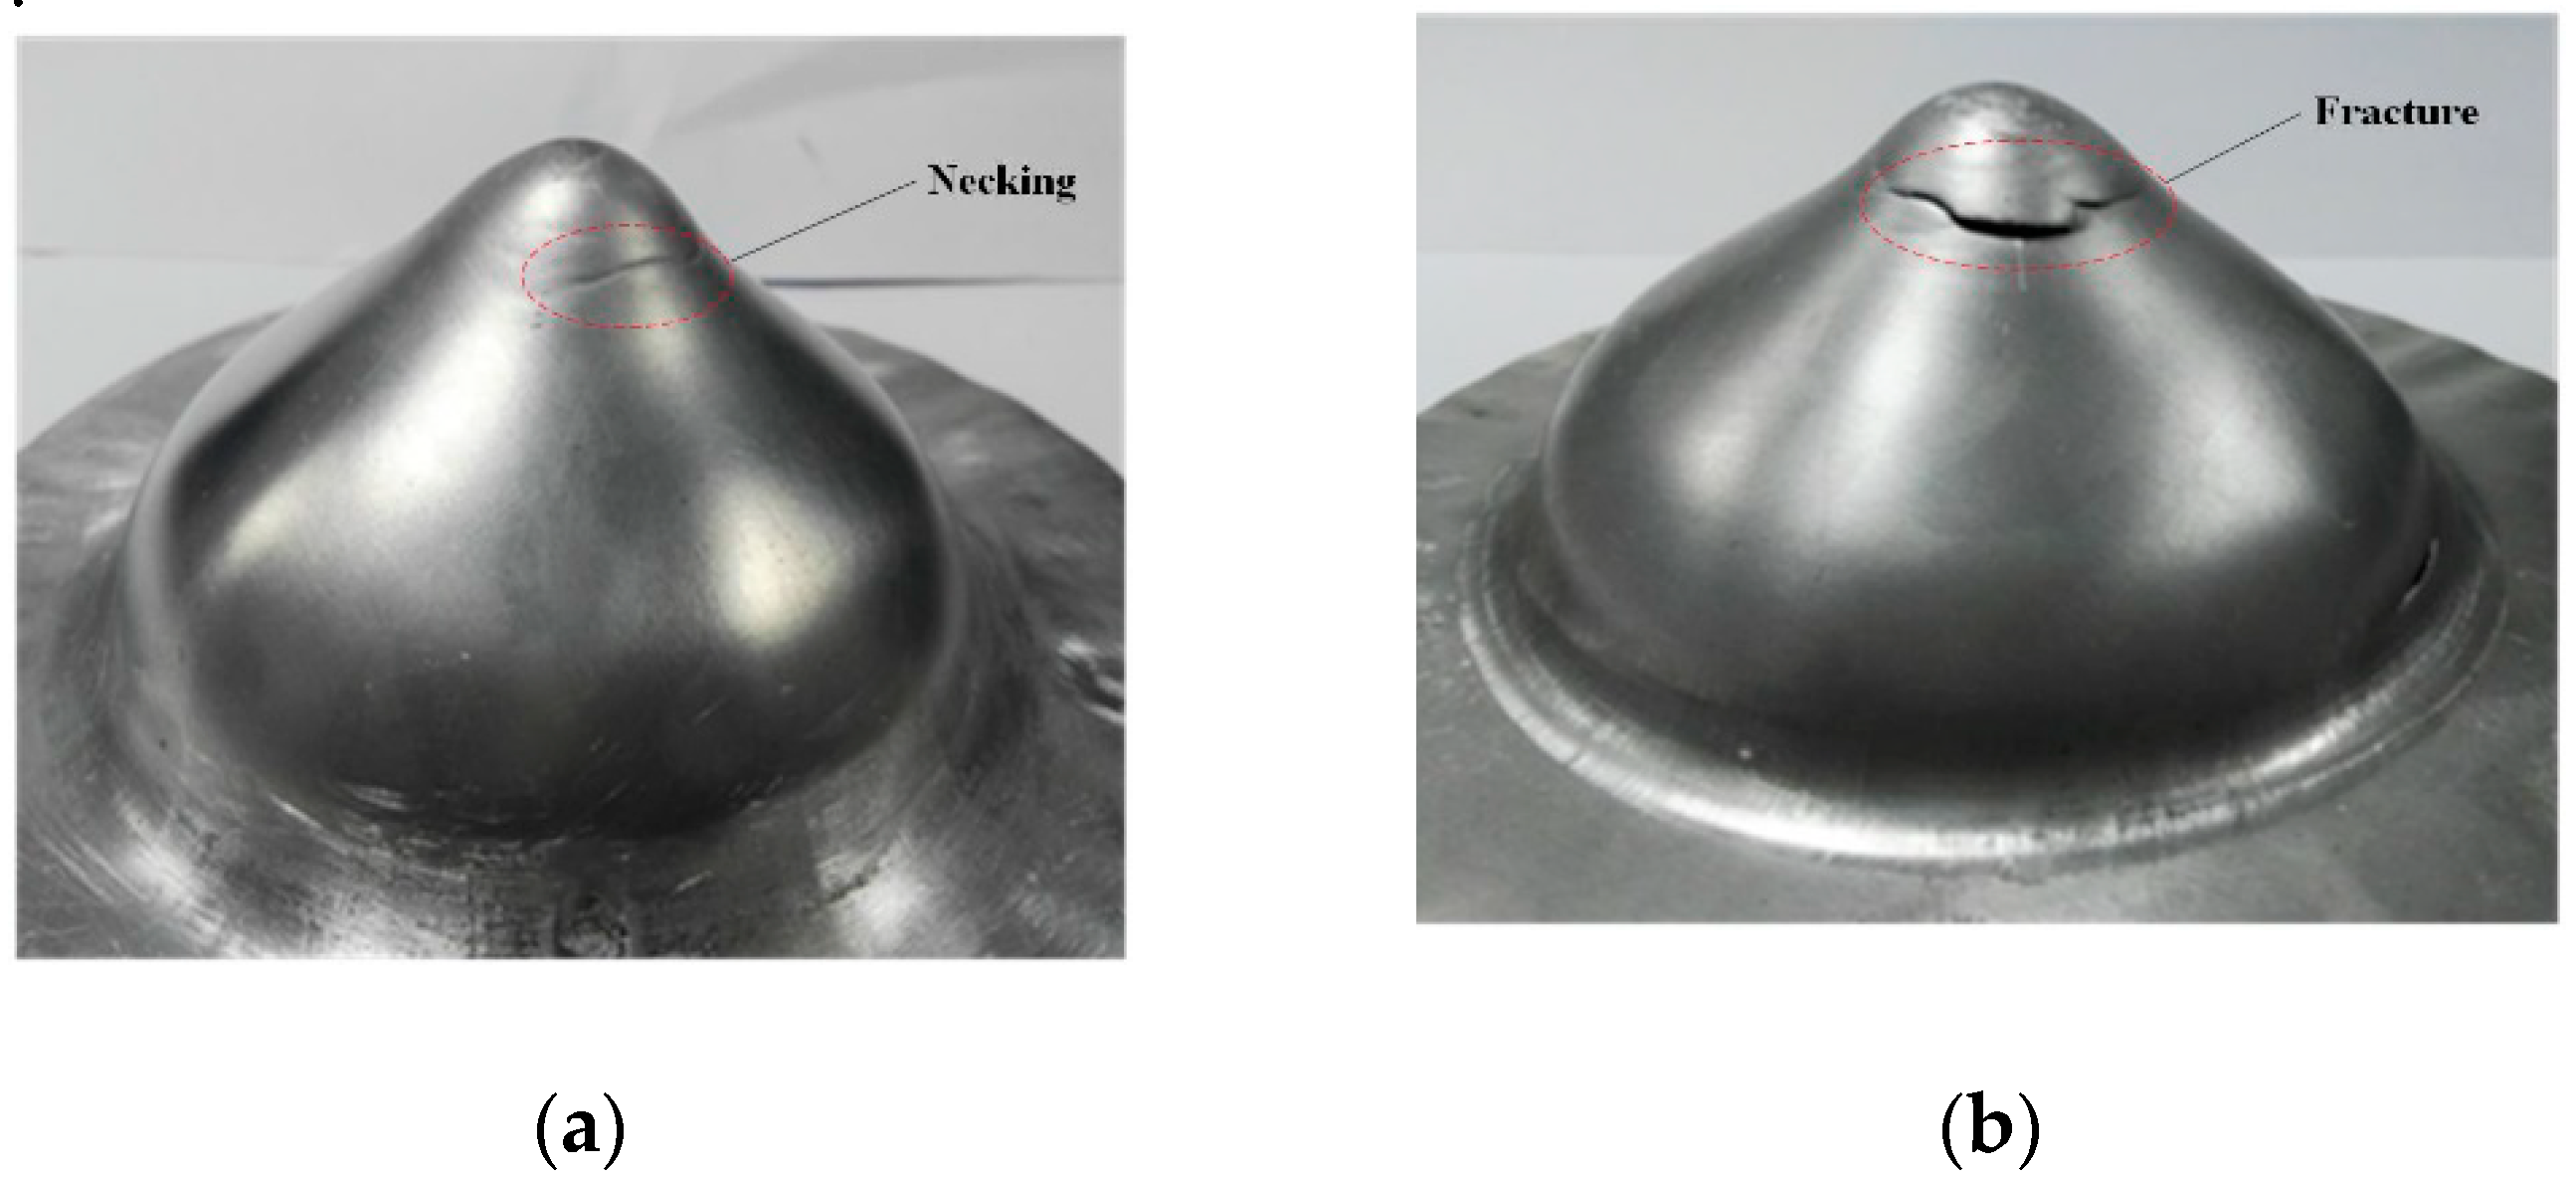
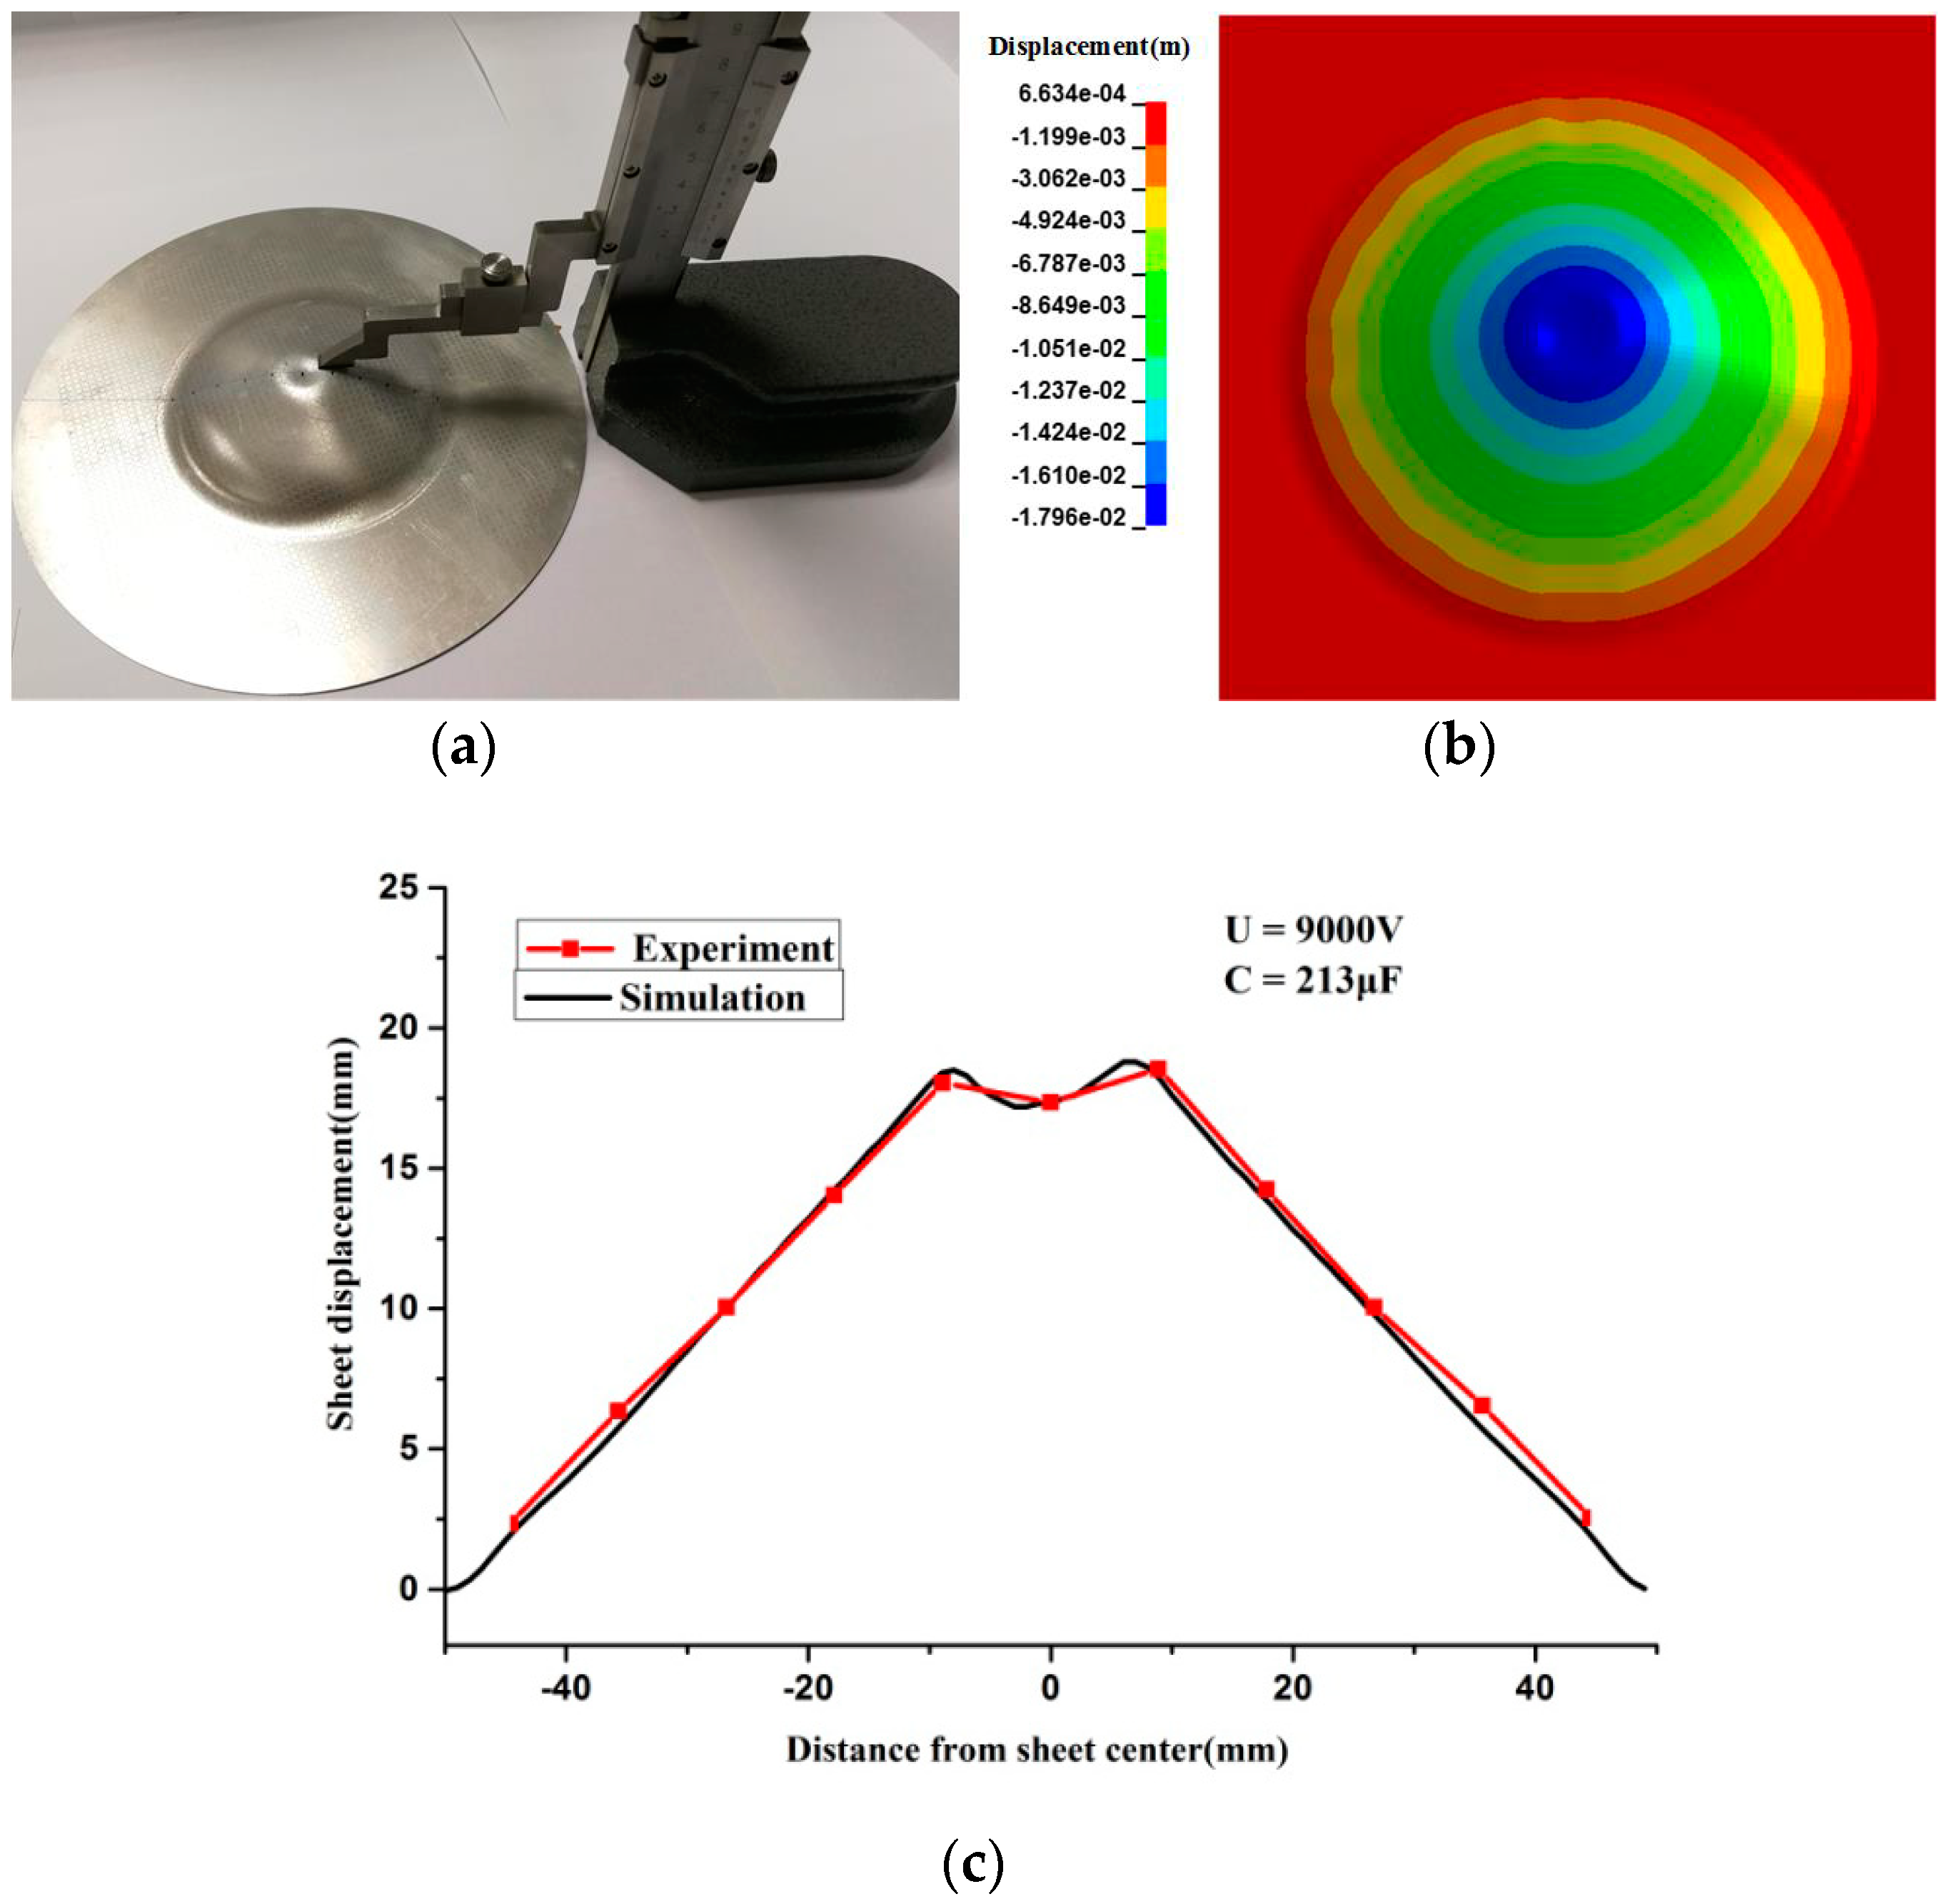
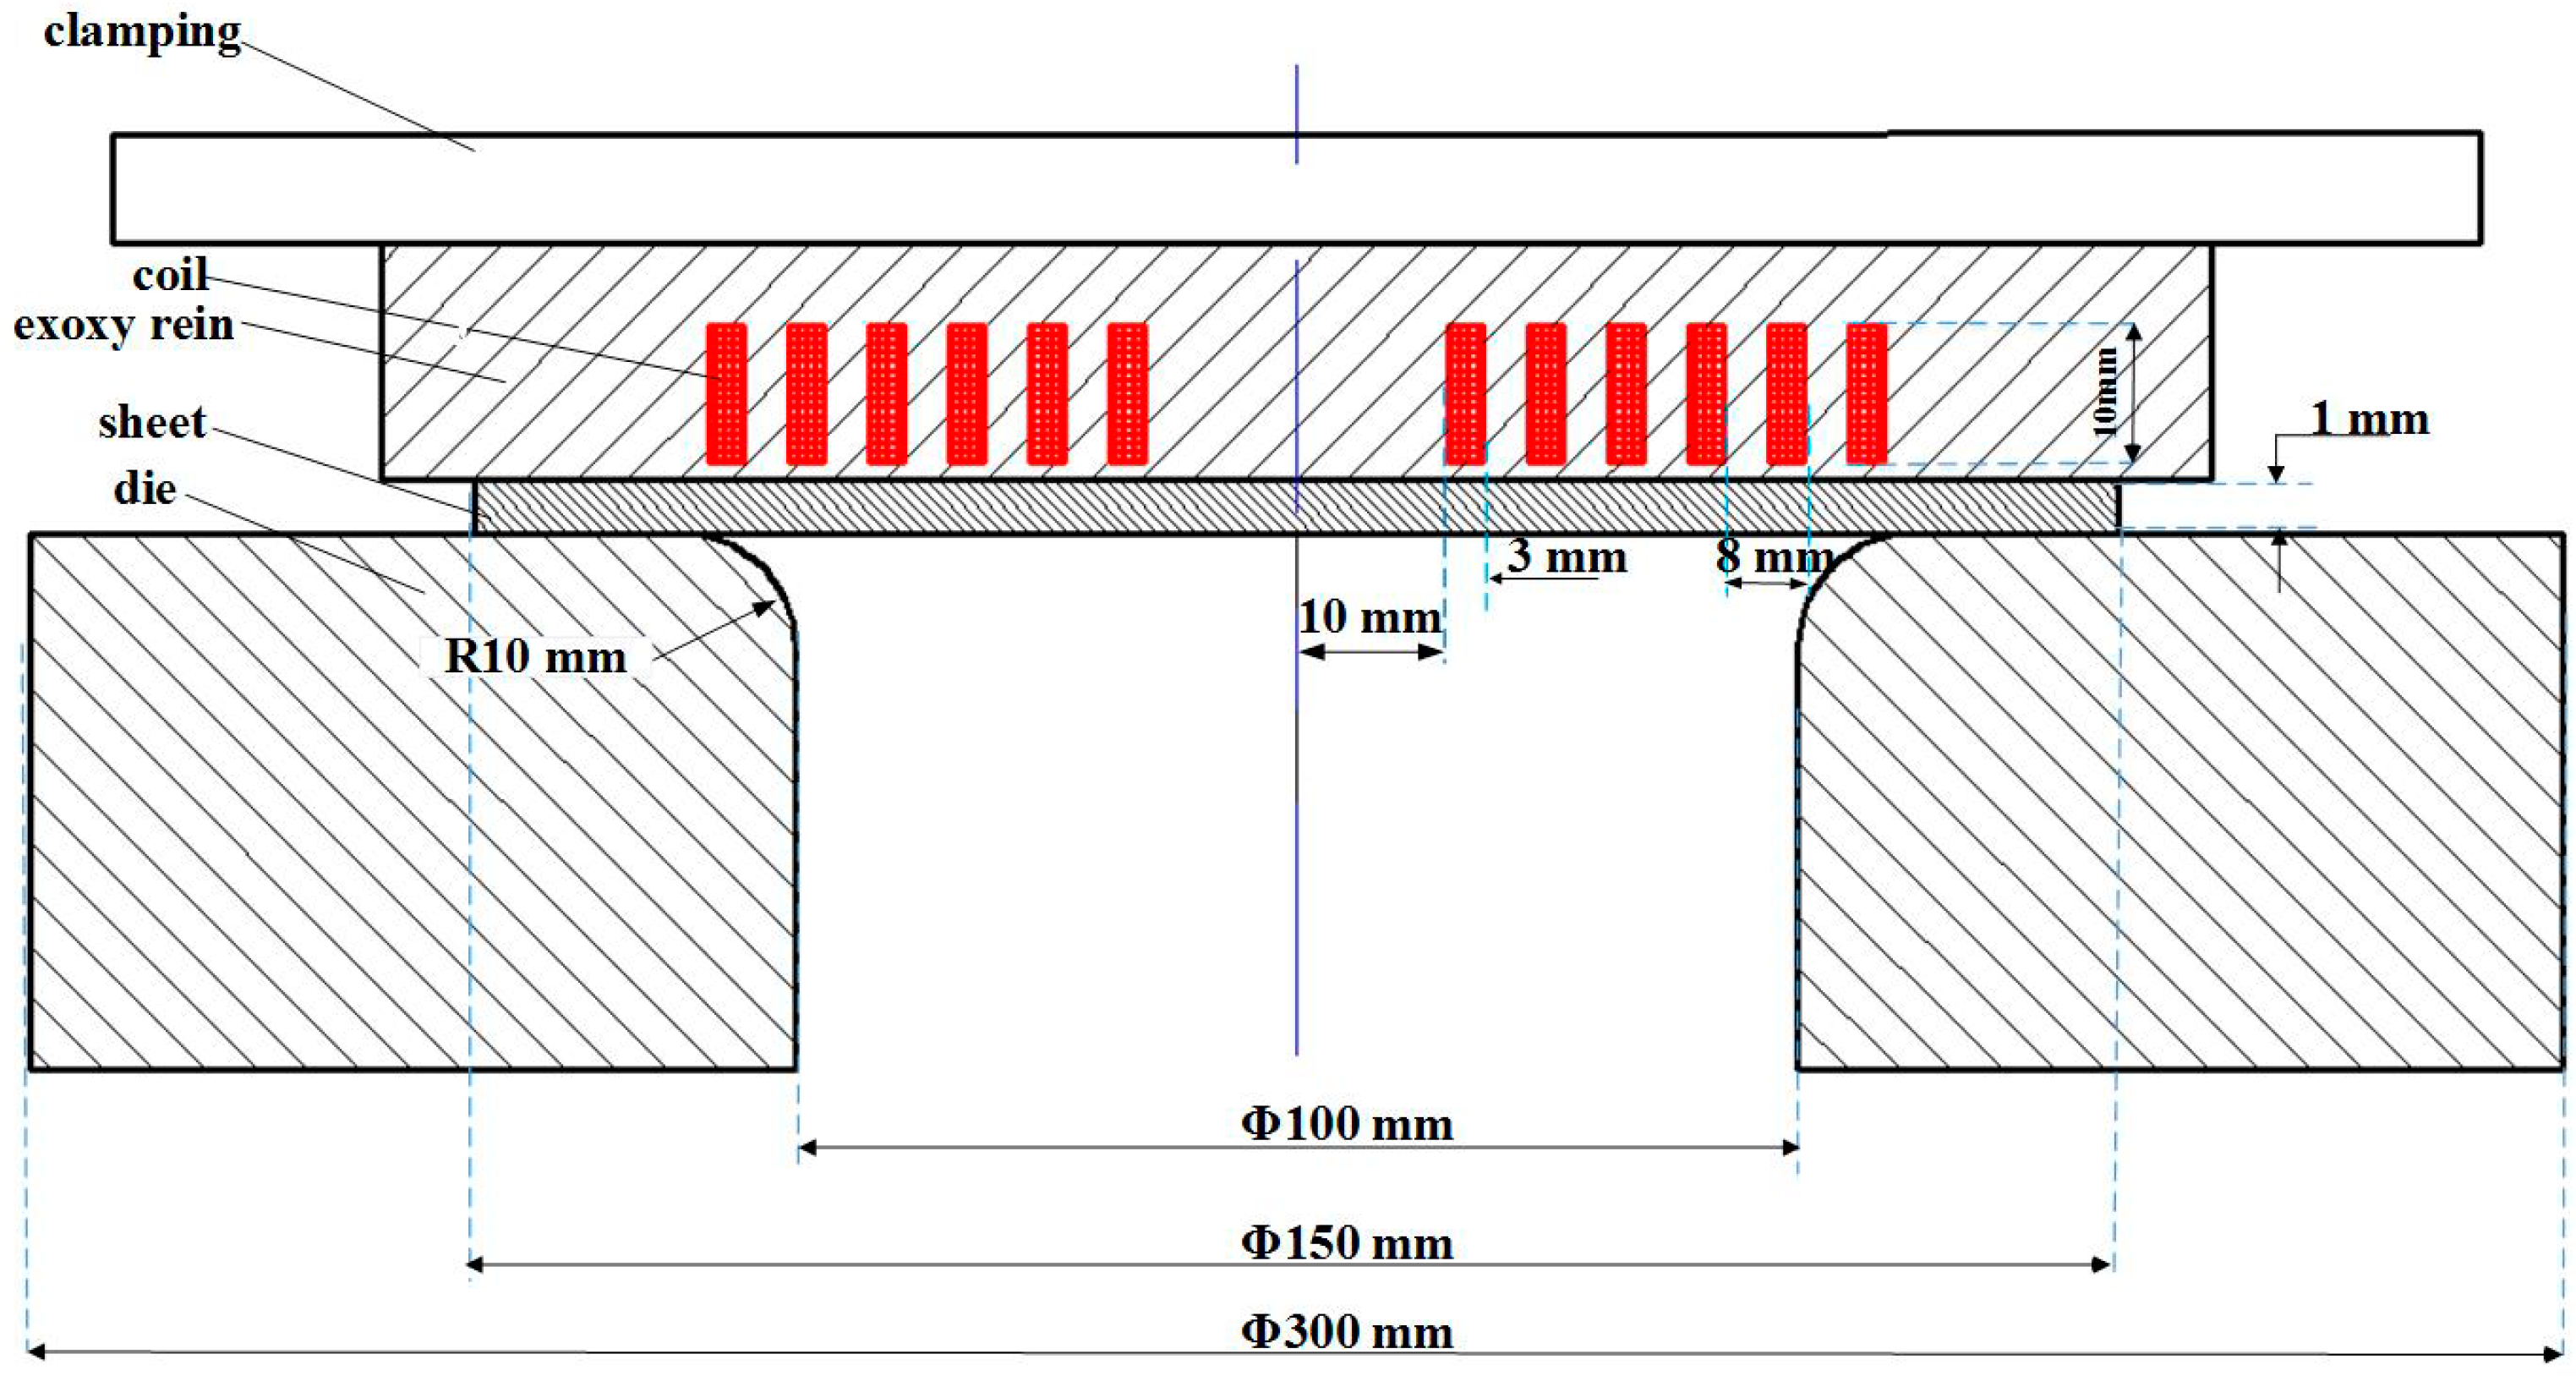
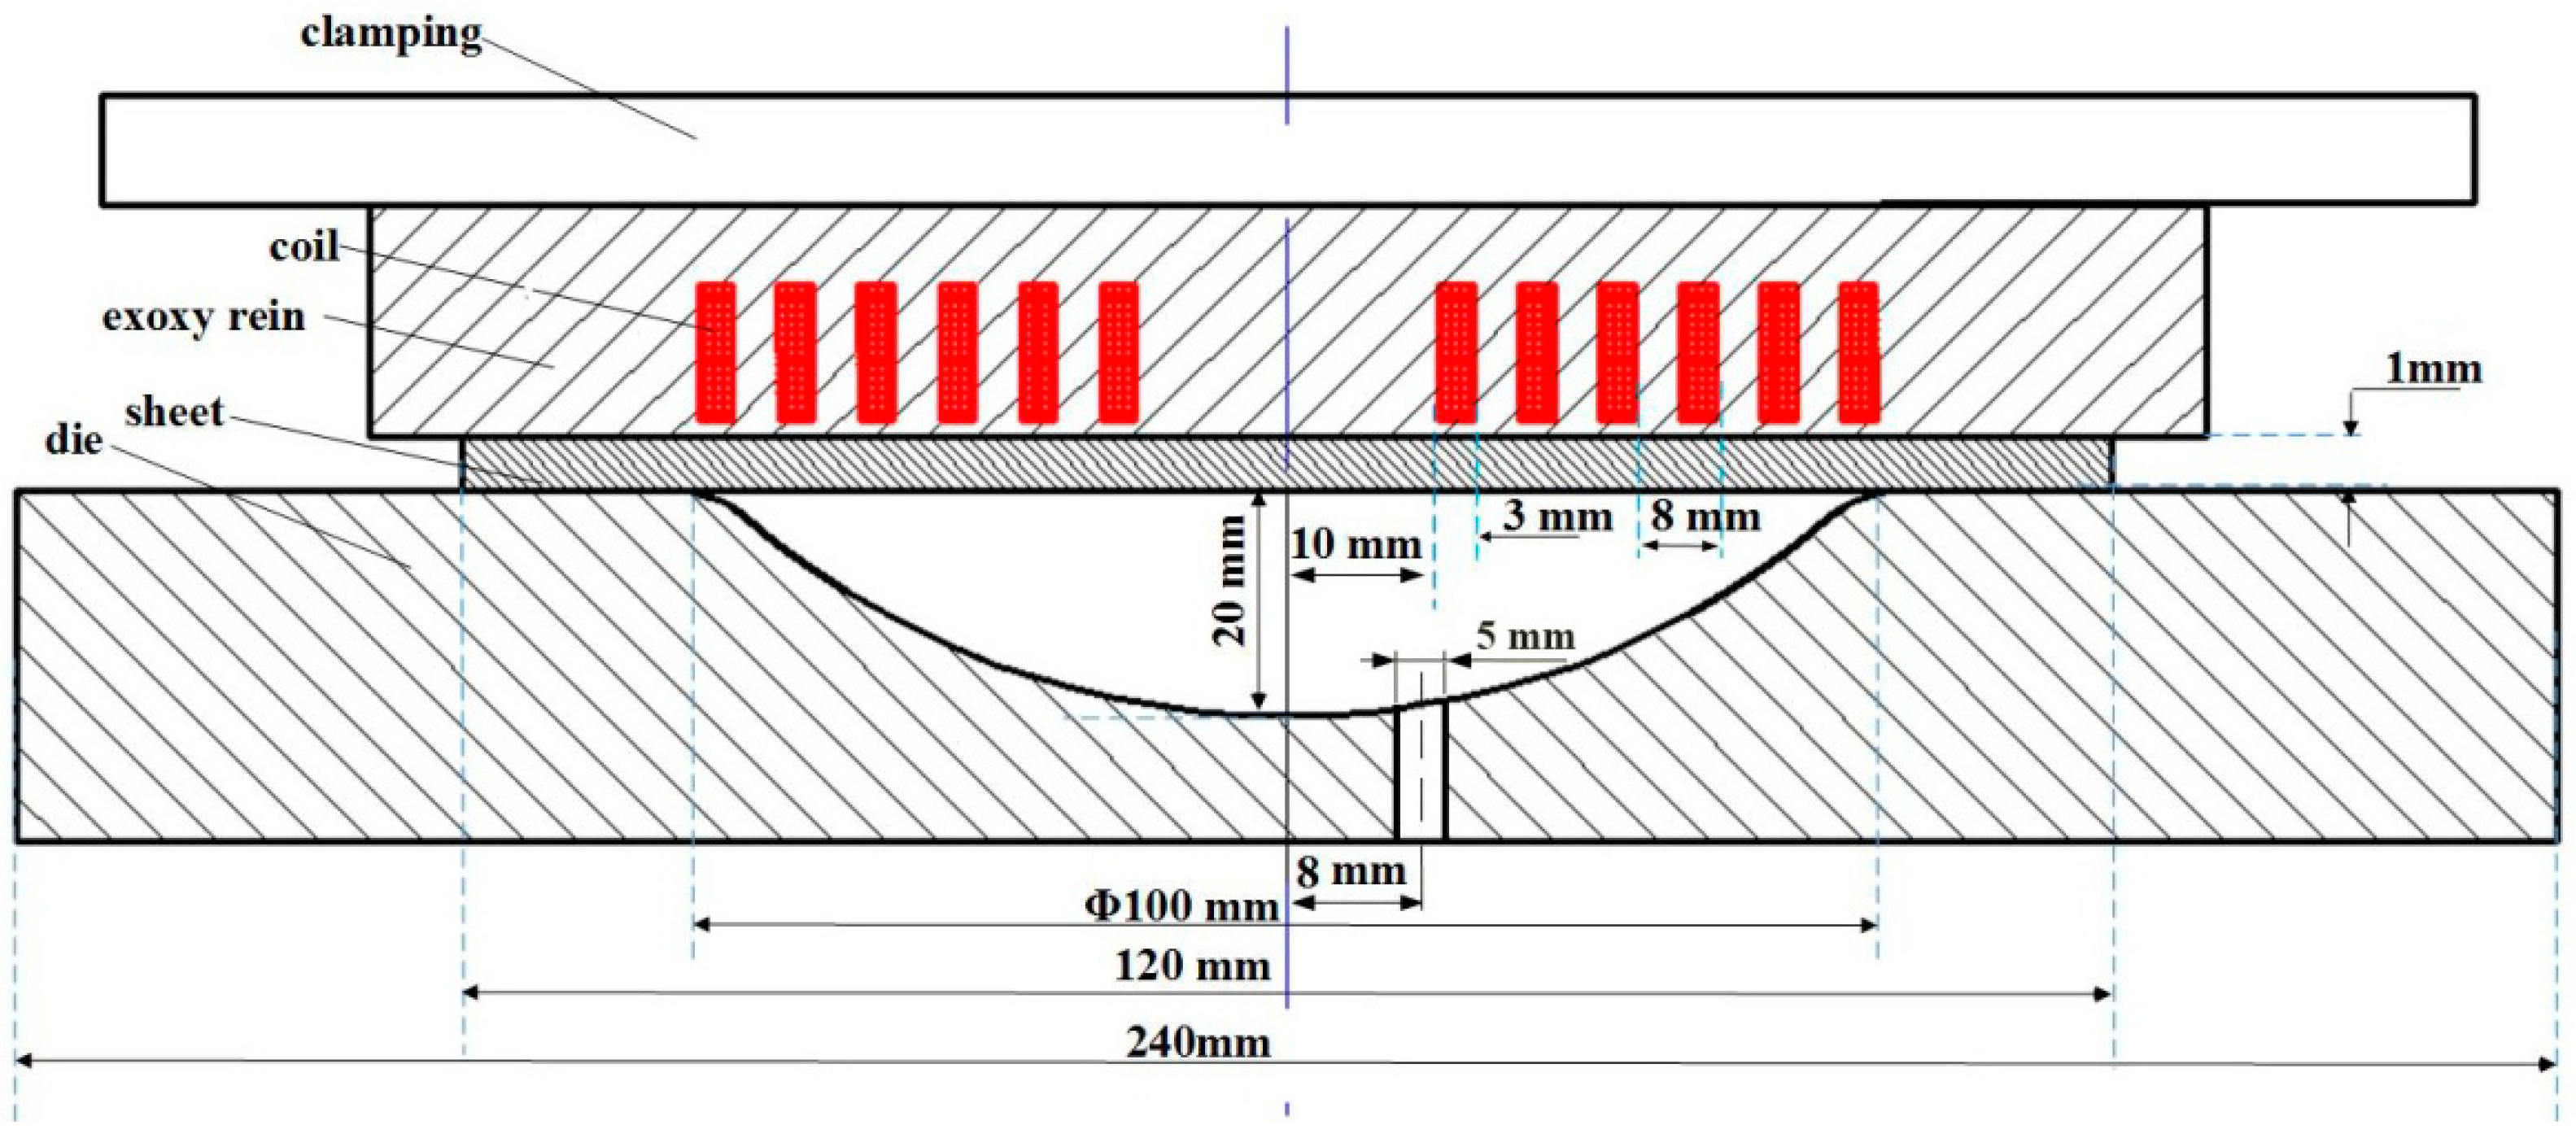
3.2. Electromagnetic Free Forming Experiment

The electromagnetic free forming experiments were performed on a self-developed electromagnetic forming machine, the technological parameters of which are presented in Table 2.
A tool diagram of the electromagnetic free forming 5052-O aluminum alloy sheet using a flat spiral coilis shown in Figure 2. The 5052 aluminum alloy sheet was placed below the flat spiral coil and the coil was then pressed by the hydraulic equipment to restrain the coil and sheet sliding. Six coil turns were completed, the coil separation was 5 mm, the cross-sectional area of the coil was 3 × 10 mm, and the inductance of the coil was 2.5 μH. During the electromagnetic free bulging of the 5052-O aluminum alloy, a pulse current was generated in the coil after capacitor discharging, and a repulsive force developed between the coil and the sheet, thereby producing sheet deformation. Adjusting the discharge voltage resulted in the occurrence of necking and fracture in the deformed specimens, as shown in Figure 3.
The necking and fracture specimens from the electromagnetic free forming experiments are shown in Figure 3. The necking and fracture sections were obtained from the corresponding specimens. The microscopic void evolution of the necking and fracture specimens were observed via scanning electron microscopy (SEM). Necking occurred in the top region of the sheet with the increase in discharge voltage. The microvoids surrounding the deformation area began to grow and a new microvoid started to nucleate. The microvoids were substantially connected and coalesced when fracture occurred in the specimen. The original voids of the material originated from the material itself and the second-phase particle occurred due to material defects in the 5052-O aluminum alloy sheet. Figure 4 shows the initial distribution of voids in the 5052-O aluminum alloy. The critical size of the microvoid was 0.1 μm.
The necking stage corresponded to the growth of microvoids, which then coalesced. With increasing plastic strain, the microvoids that surrounded the deformation area increased gradually and then began to elongate and propagate. Figure 5 shows the propagation and coalescence of microvoids. When necking occurred in the specimen, the microvoids caused coalescence and plastic instability.
Numerous microvoids coalesced when a fracture occurred in the specimen. The fracture stage was a micro-crack that expanded and produced macroscopic cracking in the microvoid interconnections (Figure 6).

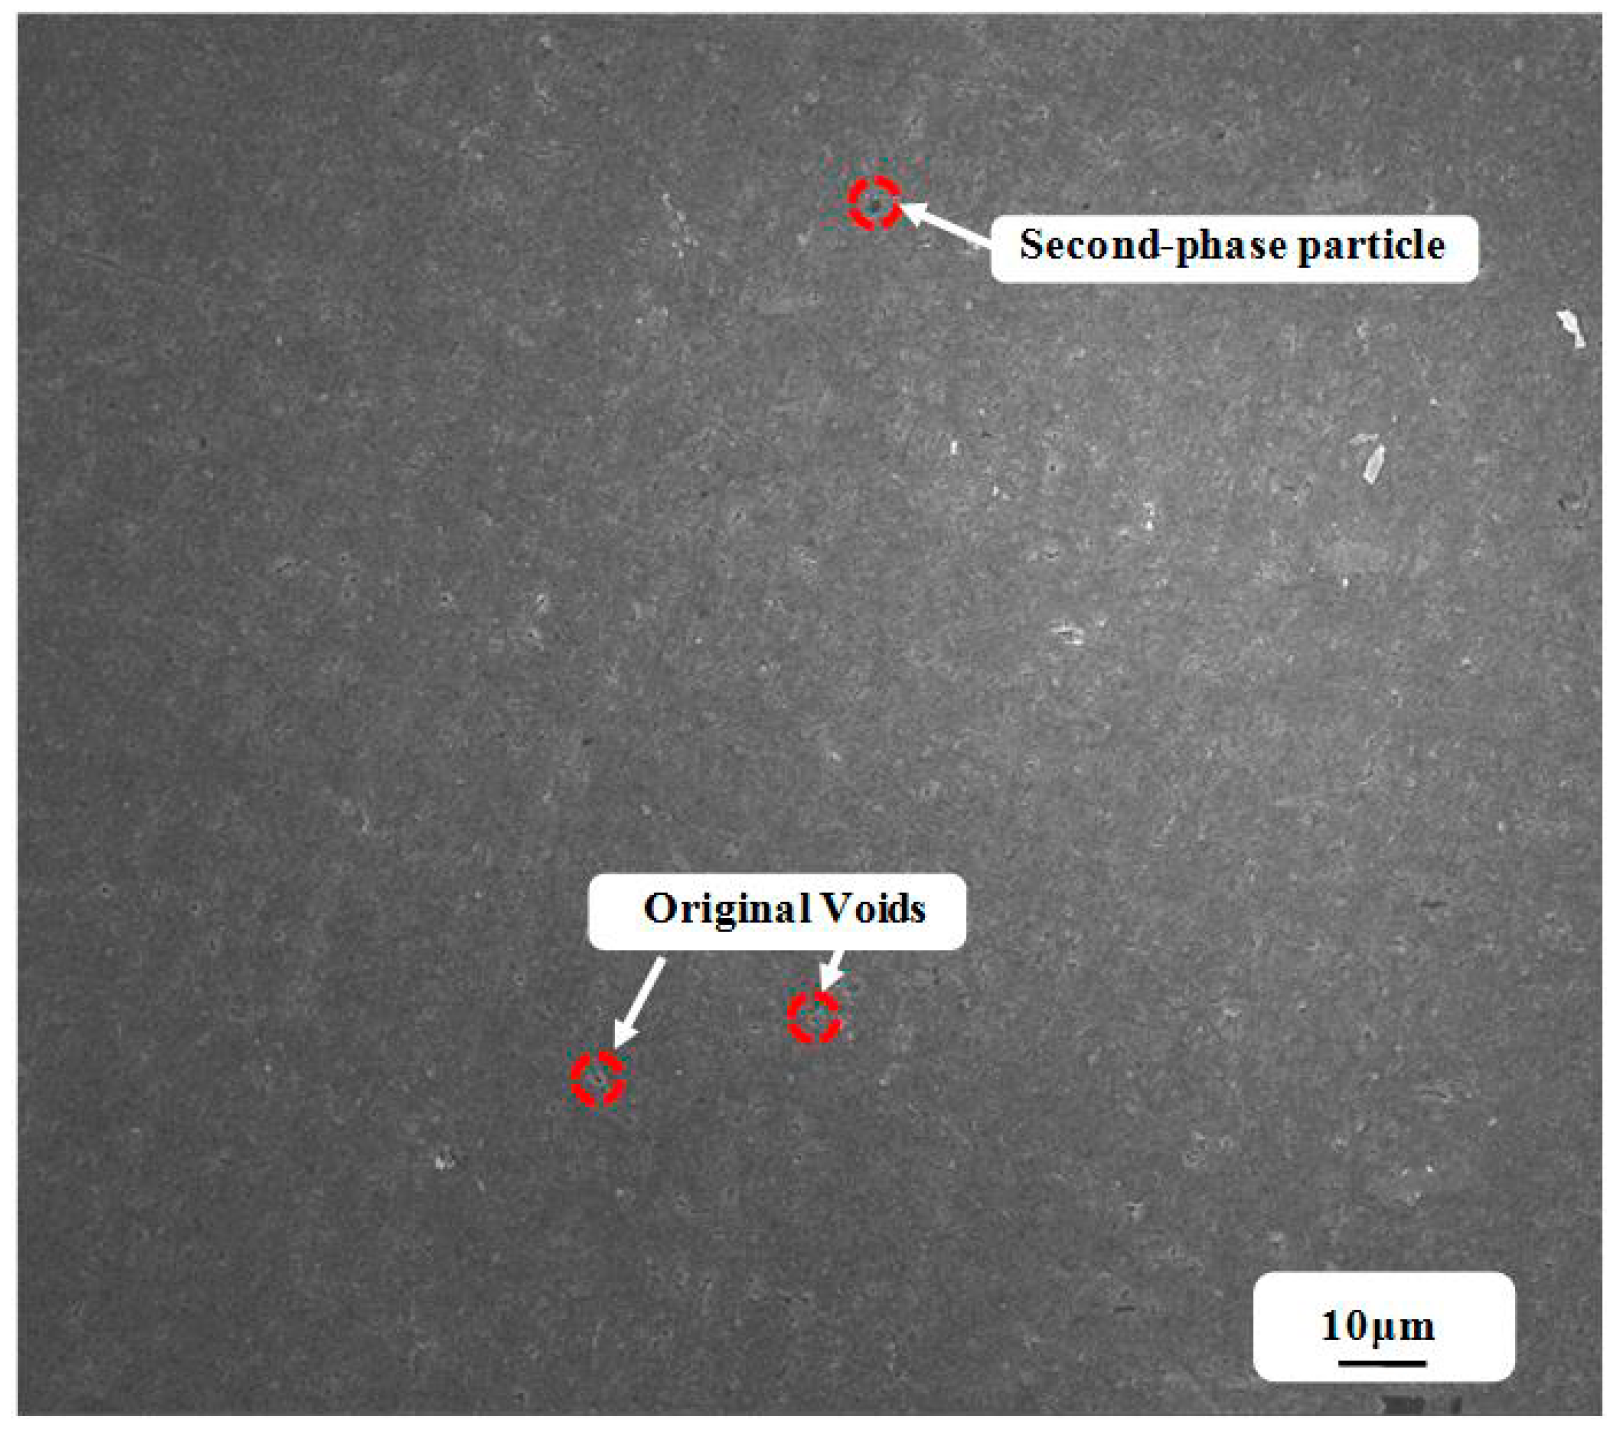
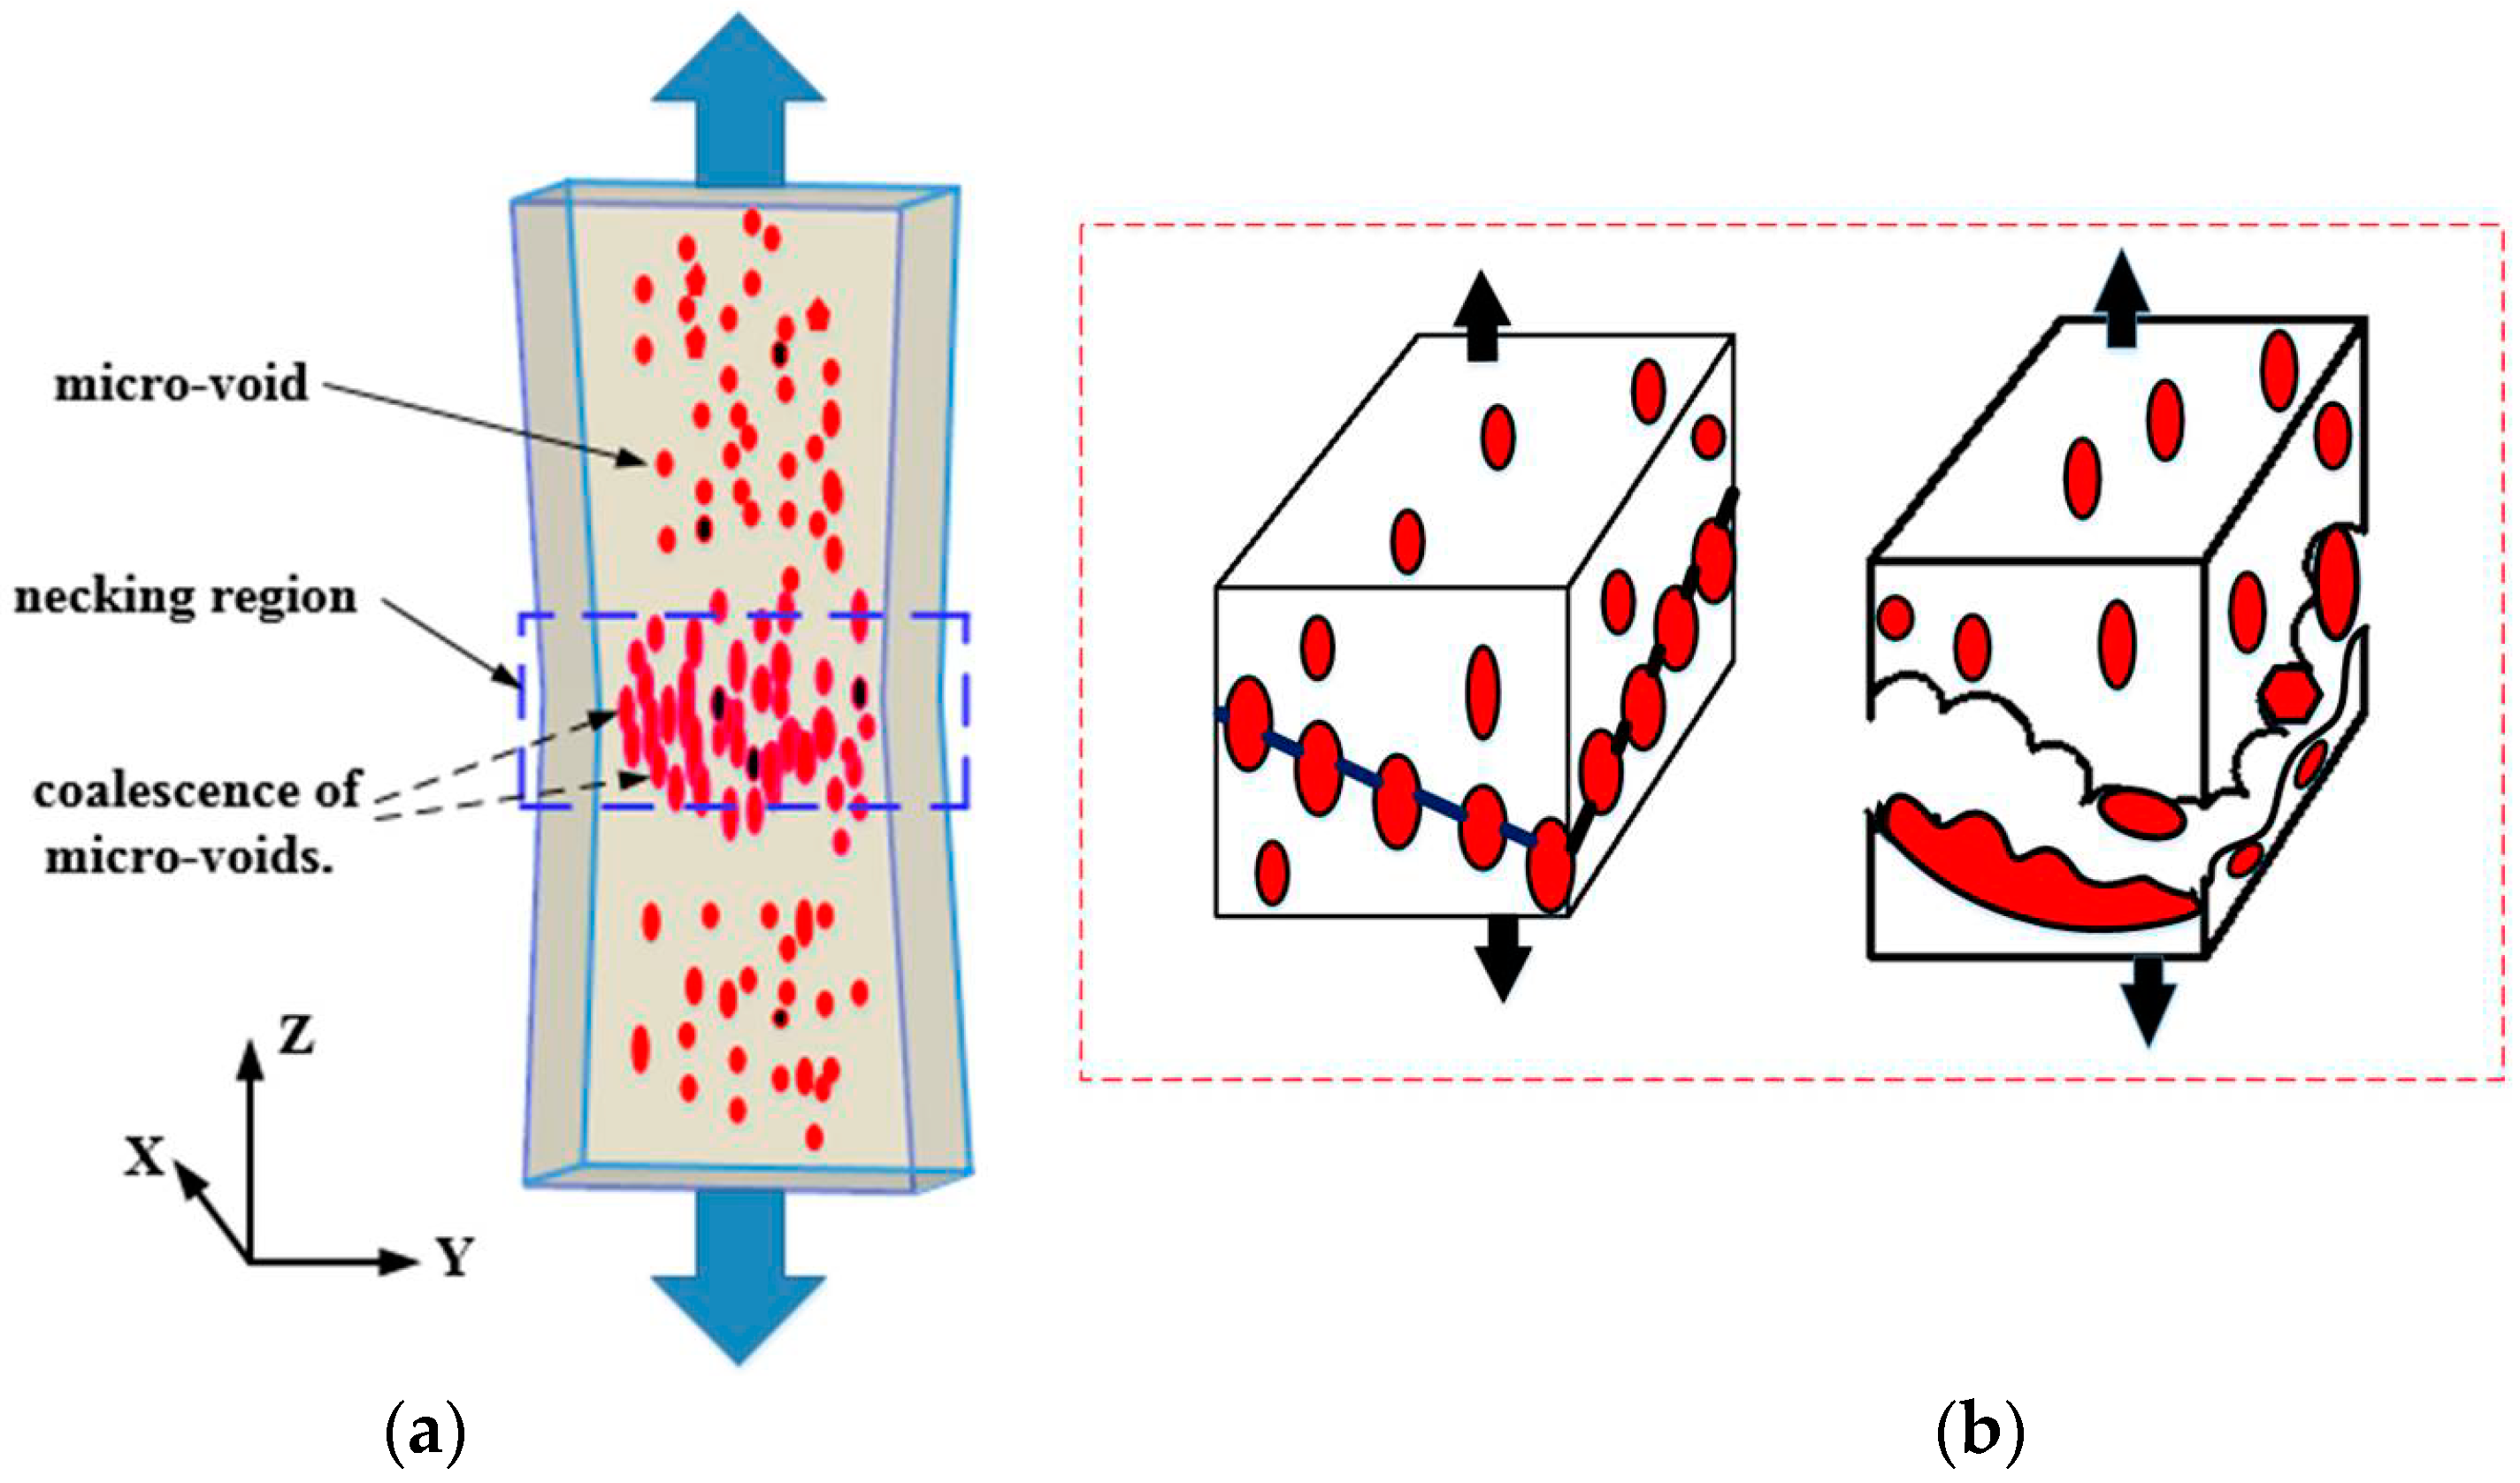
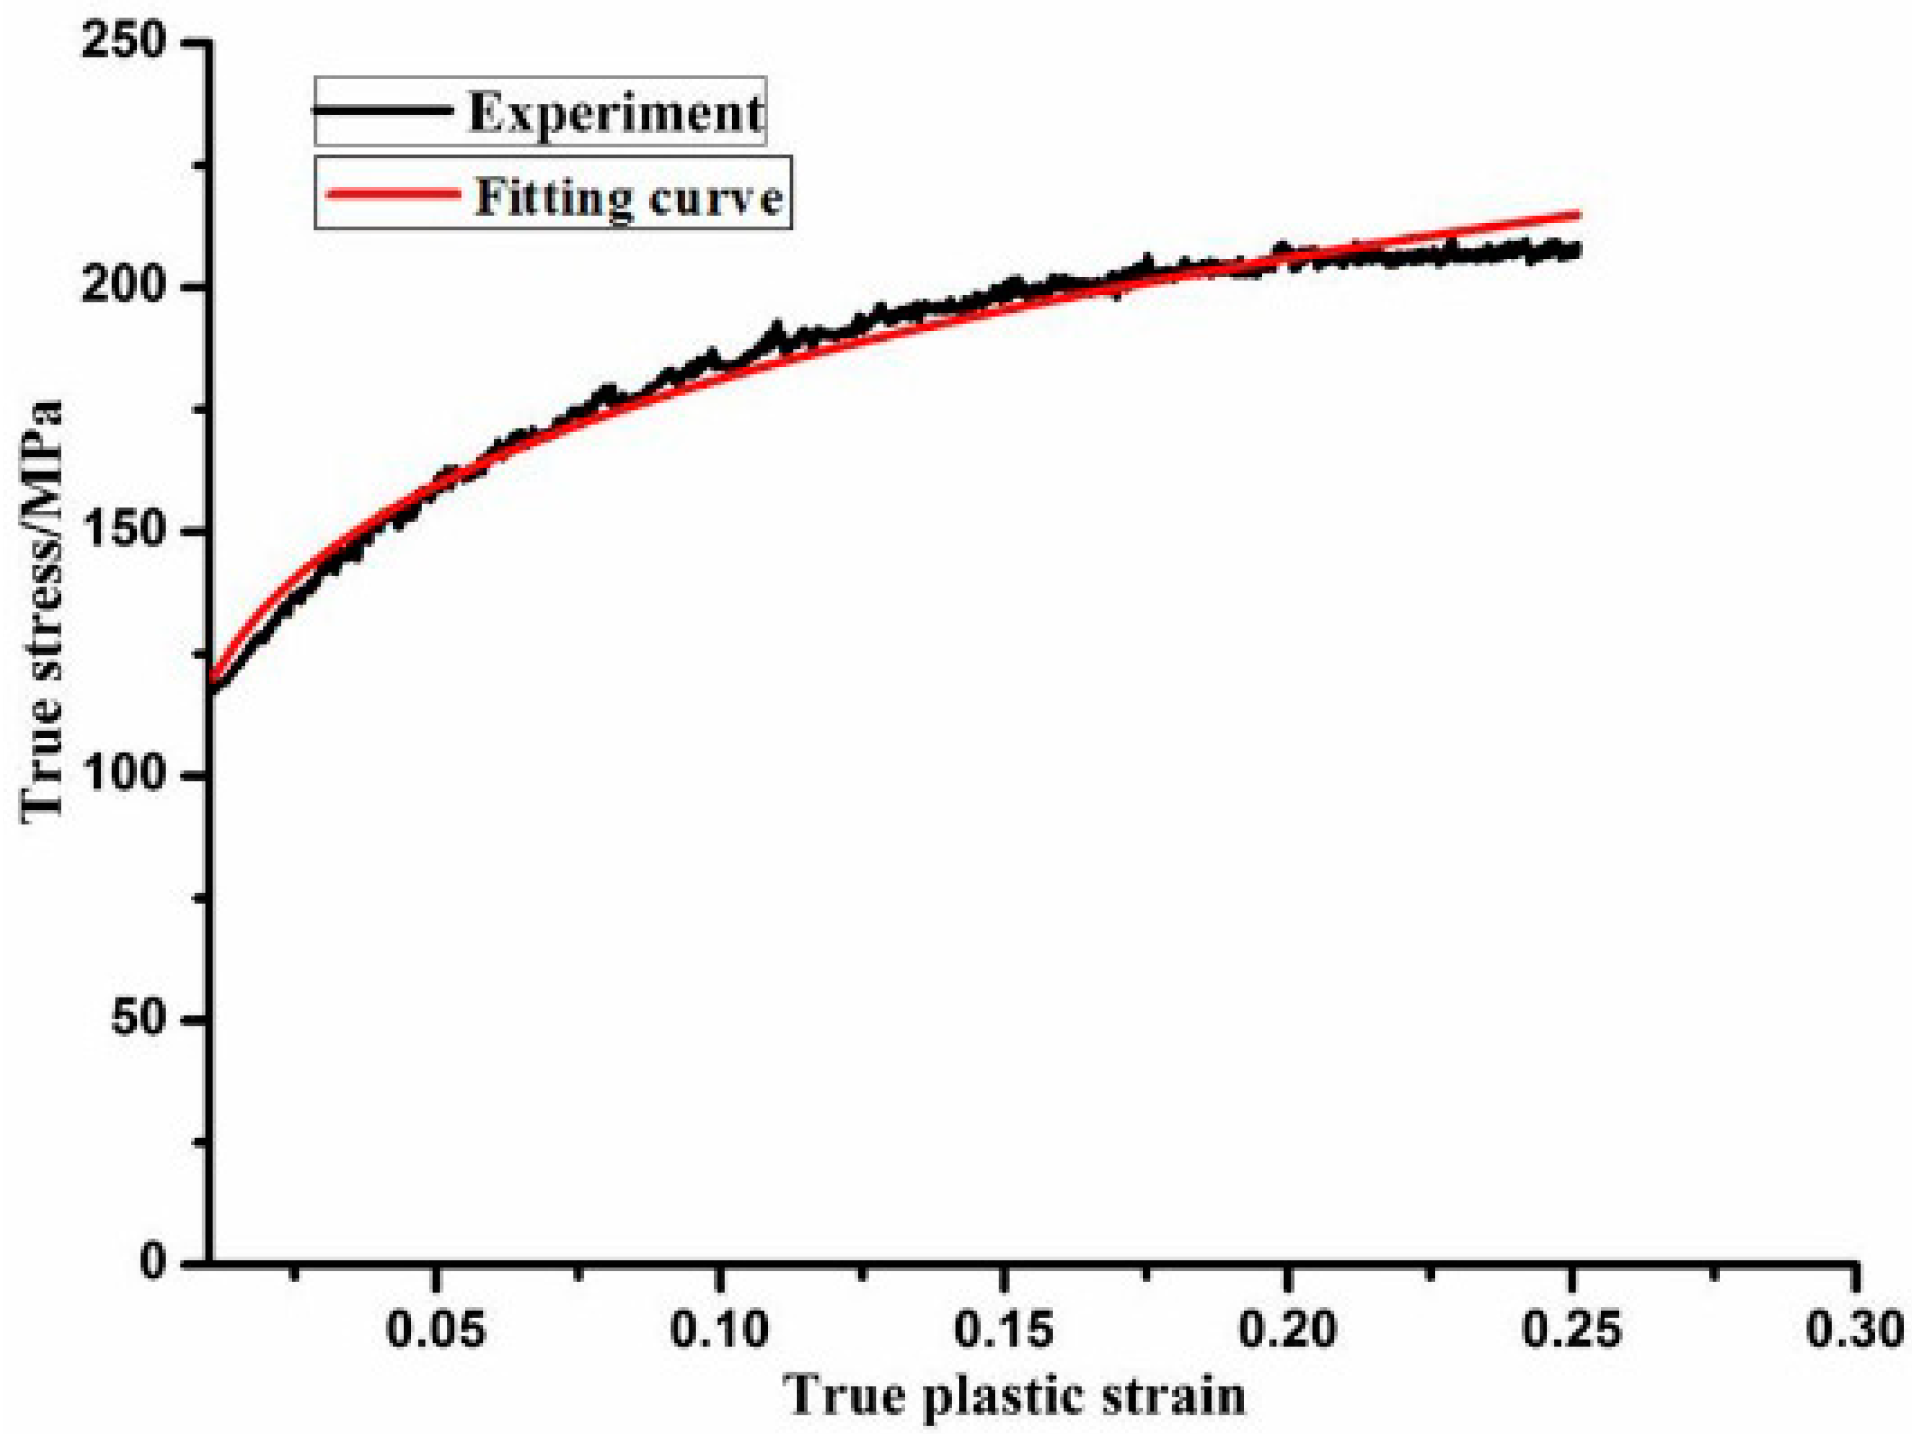
3.3. Determination of GTN Material Constants

The void volume fractions of three morphologies of 5052-O aluminum alloy were identified by Image-Pro Plus software using the SEM microstructure. The two-dimensional images were obtained by SEM. However, the voids in the material were three-dimensional, so only the area percentage of voids can be obtained through SEM images using Image-Pro Plus software; the volume percent of voids cannot be obtained using SEM images. Assumed the shape of the void is spherical, the number of voids is Ns per unit area and NL per unit length in an arbitrary cross-section of material. The radius of arbitrary void is r, so the average area of voids in this cross-section is expressed as:
S = 2 3 π r 2
r is expressed as:
r = 2 N L π N S
The volume percentage of voids per unit volume is express as
f v = 8 N L 3 π N S 2
The area percentage of voids per unit area is expressed as:
f S = 2 3 π r 2 N S = 2 3 π ( 2 N L π N S ) 2 N S = 8 N L 2 3 π N S = f v
So, the area percentage of voids is equal to the volume percentage of voids, and the area percentage of voids was calculated instead of volume percentage of voids using Image-Pro Plus software.
The microvoid areas of the different necking and fracture specimens were calculated. The average microvoid area of different necking and fracture specimens in the different zone were obtained, as shown in Table 3.
The calculation of the volume fraction of voids is shown in Table 4. The area fraction of voids was calculated as follows:
η = A V o i d A T o t a l
where AVoid is the void area of the different deformation stages, and ATotal is the pixel of the image. The void area was calculated using Image-Pro Plus software. The image resolution of Figure 7a was 932 × 702 pixels. The green numbers represent the number of microvoids. The average microvoid area of the coalescence stage was 13,478, as determined by the Image-Pro Plus software. Therefore, the area fraction was calculated during the necking stage. The average microvoid area during the fracture stage was 18,520. The image resolution of Figure 7b was 909 × 682 pixels. Therefore, the area fraction was calculated during the fracture stage. The values for the three specimens were calculated during the different deformation stages by following the same method. The average volume fraction of the three specimens in the different zones was calculated at the same deformation stage. An average volume fraction of 0.00112 for the initial voids was calculated in different zones of the three specimens. Therefore, the average volume fraction during the different deformation stages was obtained. Table 4 shows the average volume fraction at the different deformation stages.

4. Application

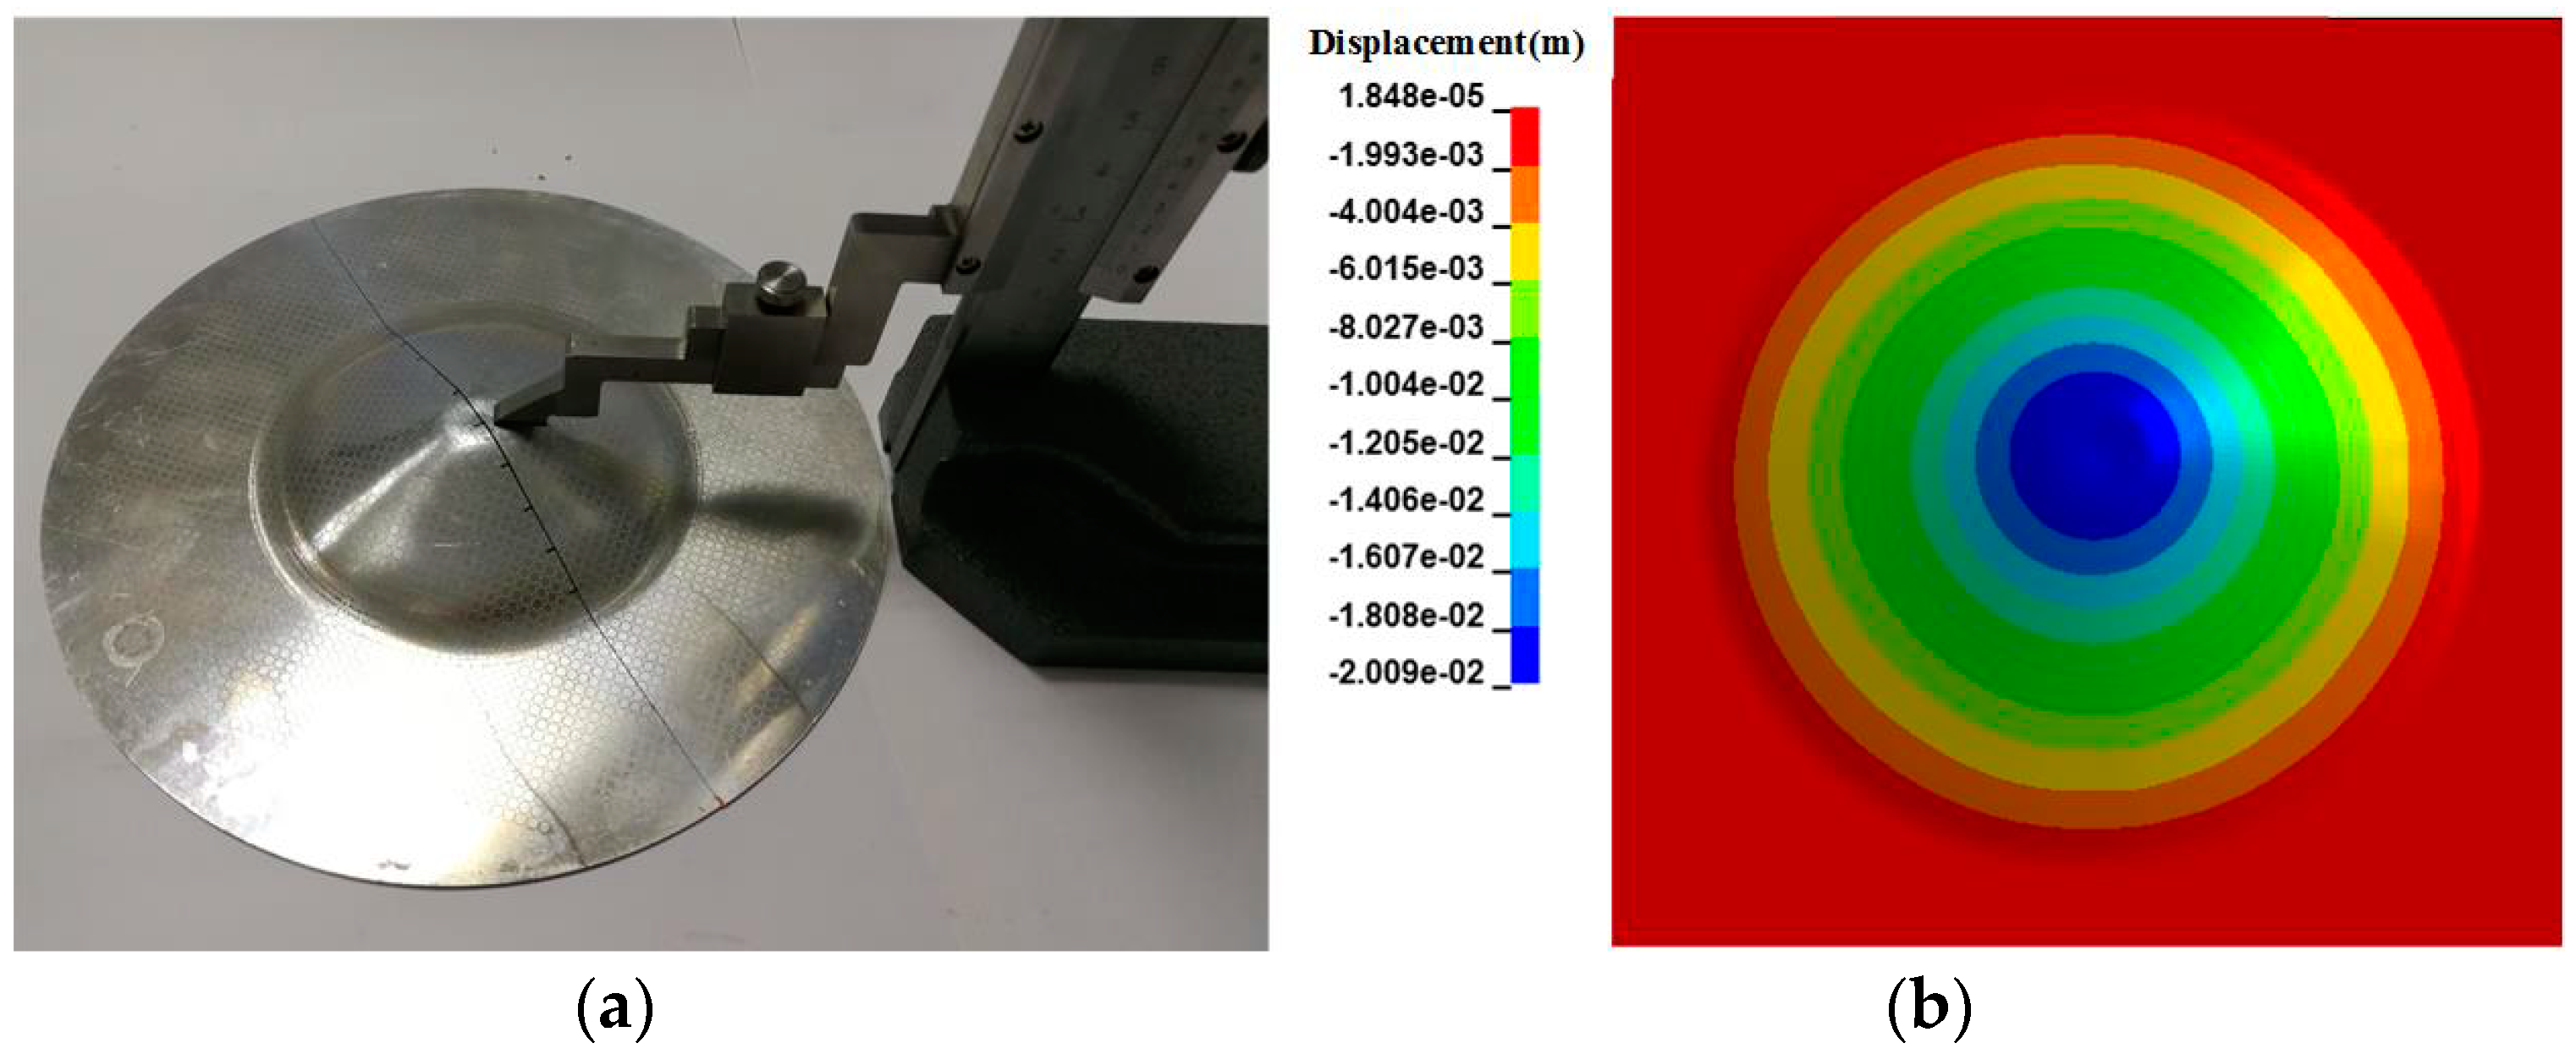
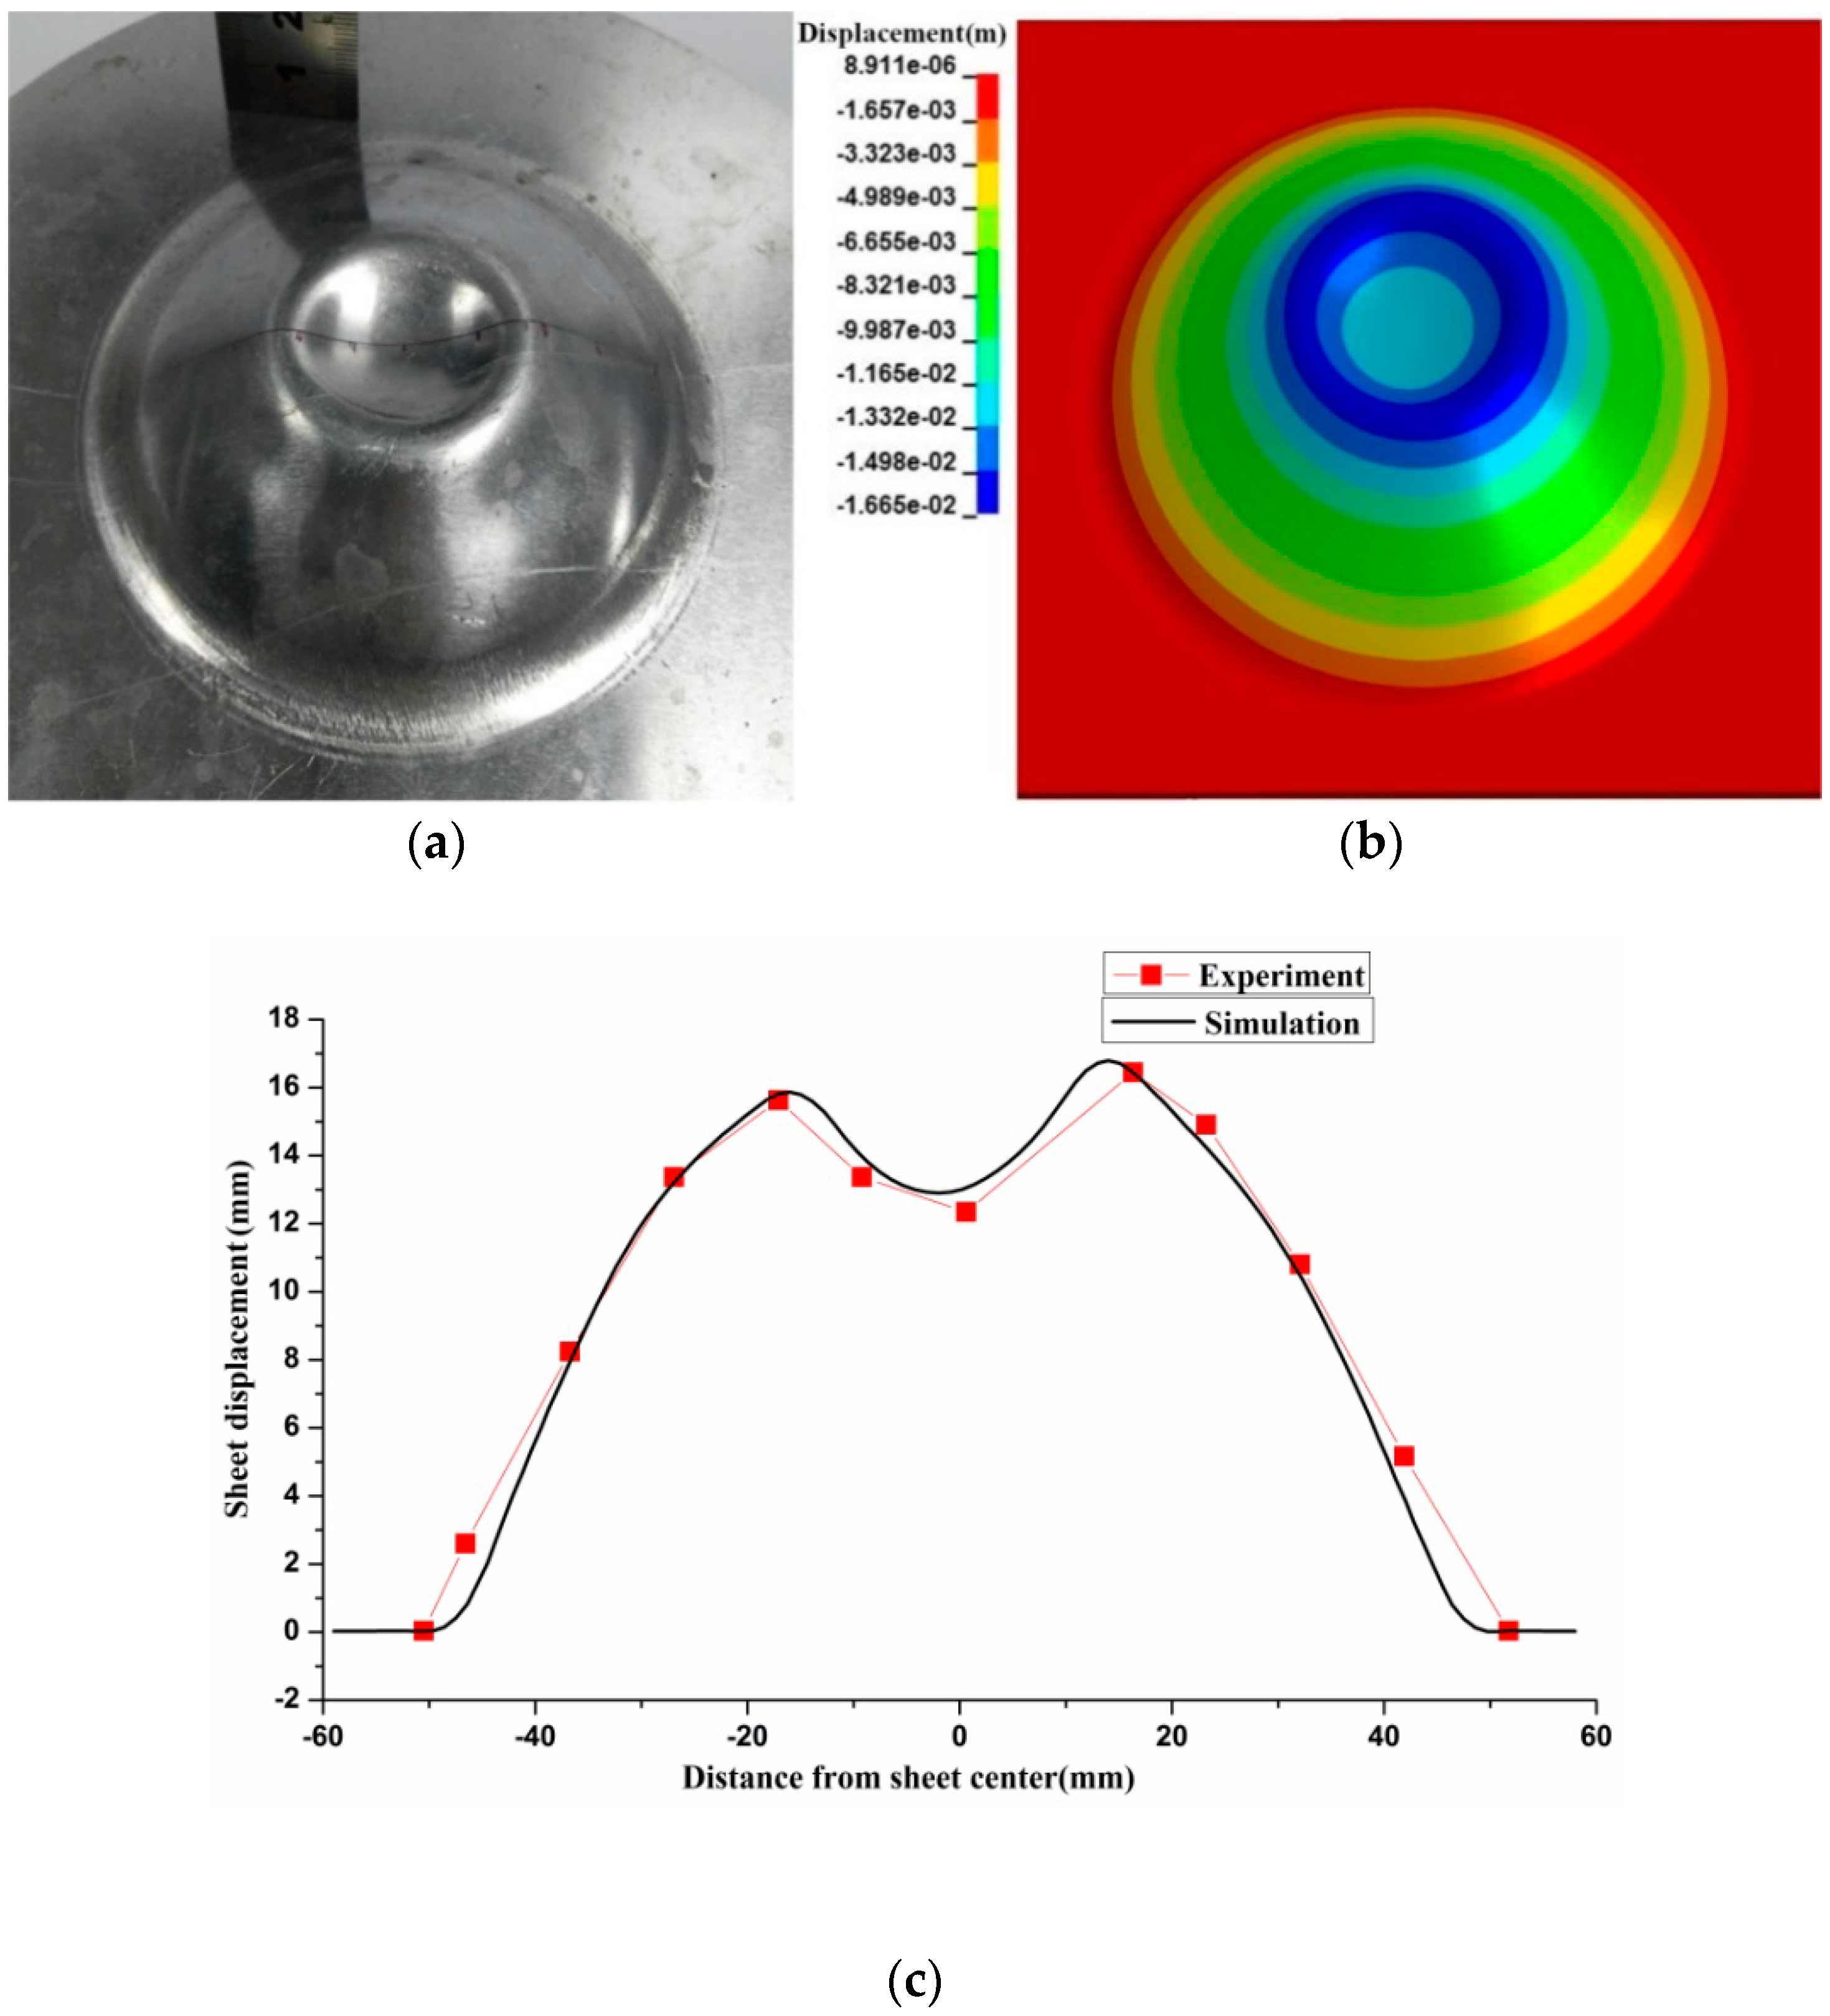
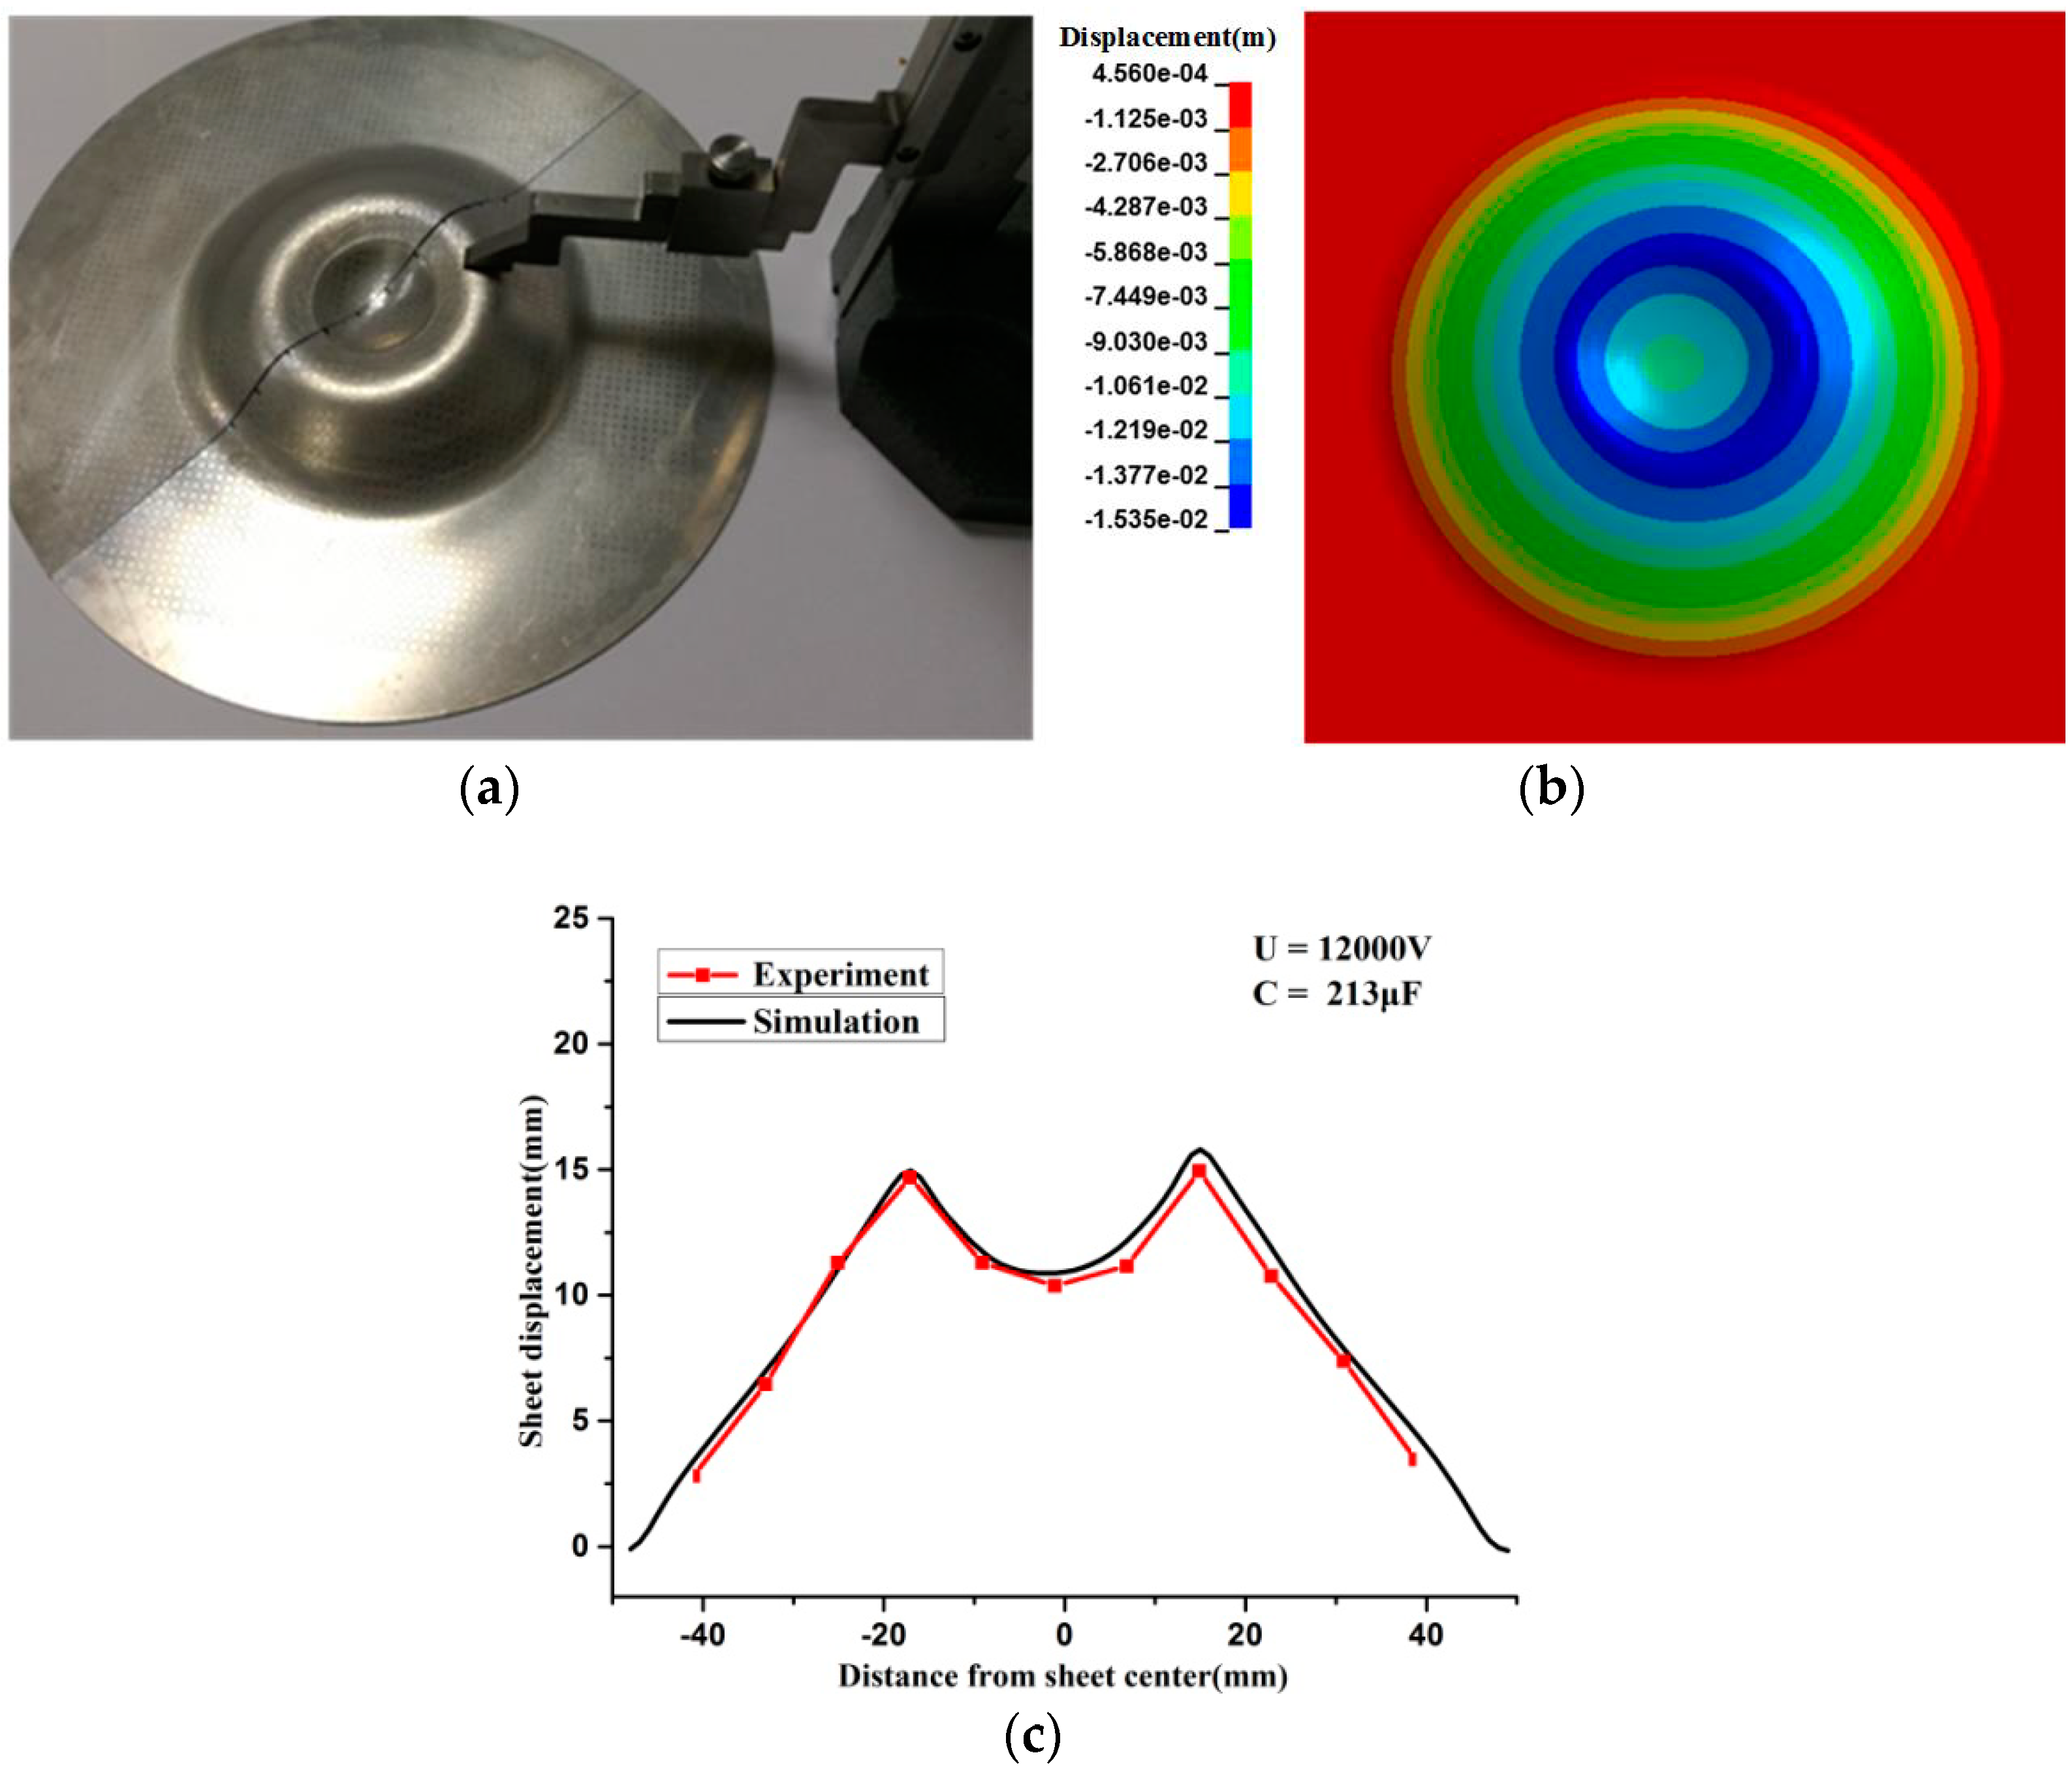
4.1. Electromagnetic Impaction Forming Experiment

The material constants of the 5052-O aluminum alloy GTN model were obtained. The obtained model was employed to predict the deformation and fracture behavior of the electromagnetic impaction deformation of the 5052-O aluminum alloy sheet at high strain rates.
Figure 8 shows a diagram of the 5052-O aluminum alloy sheet during high-speed electromagnetic impaction with the flat spiral coil, wherein the dimensions of each part are shown. An air vent was located at the bottom of the die. The sheet was placed below the flat spiral coil. The coil was then pressed by the hydraulic machine to prevent sheet sliding. When the magnetic force reached the yield limit of the aluminum alloy sheet, the sheet was pushed downward due to plastic deformation. When the discharge energy reached a certain value, the sheet impaction of the die at a high speed would cause fracture.

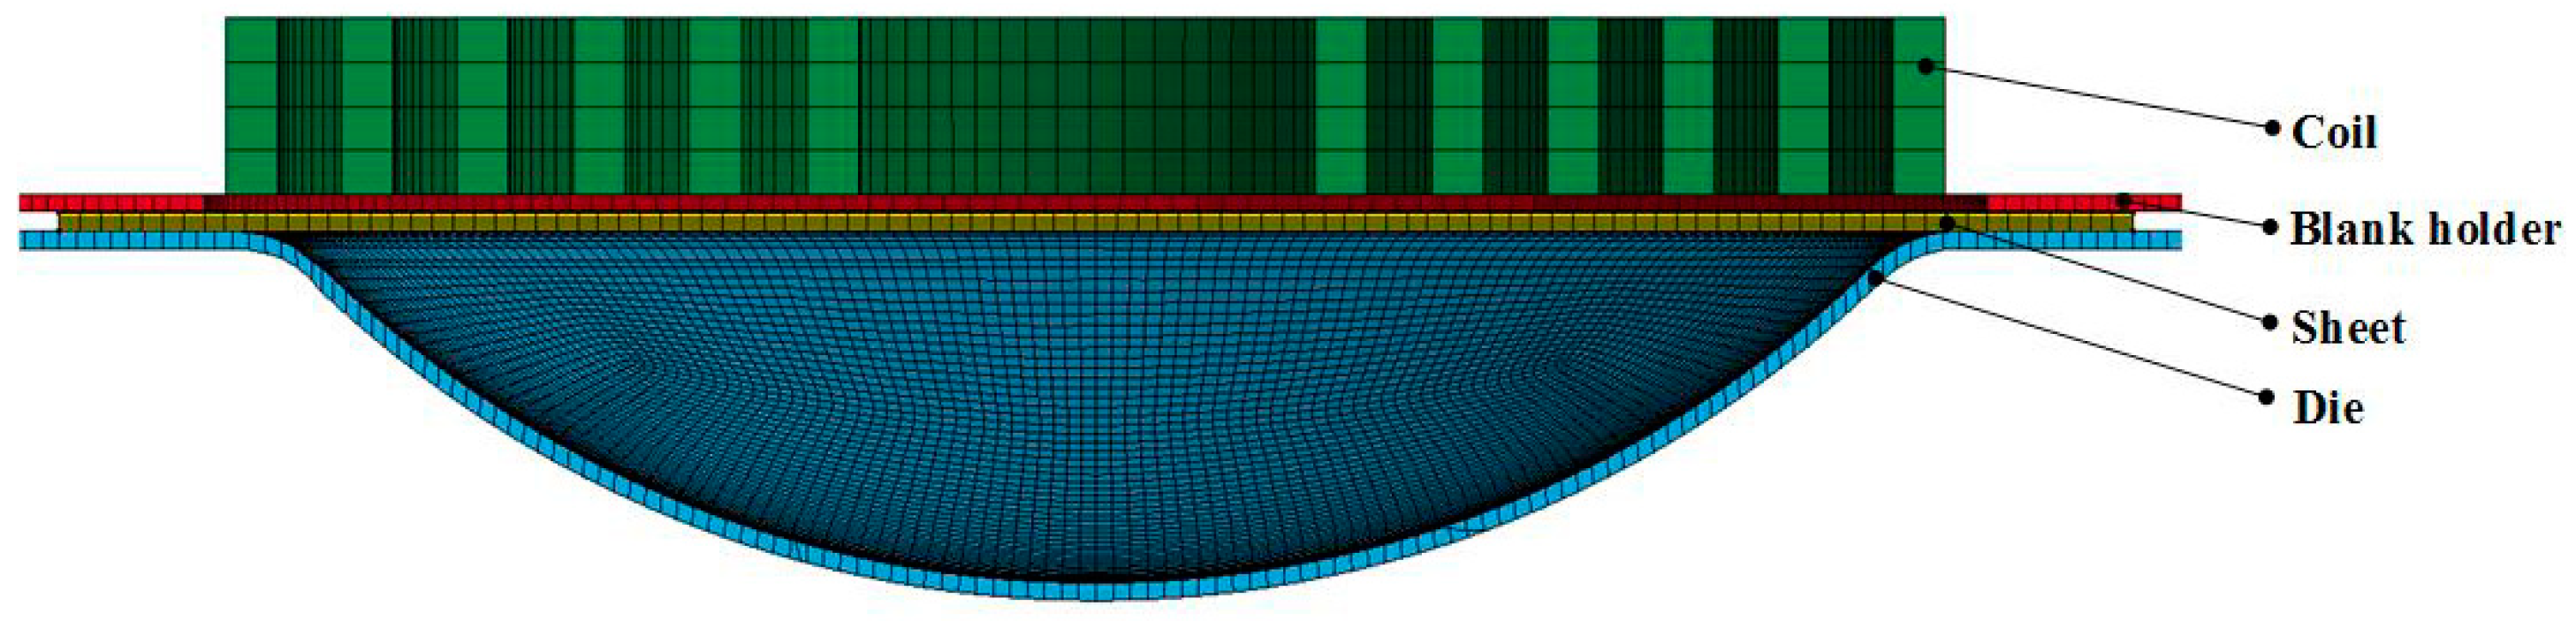
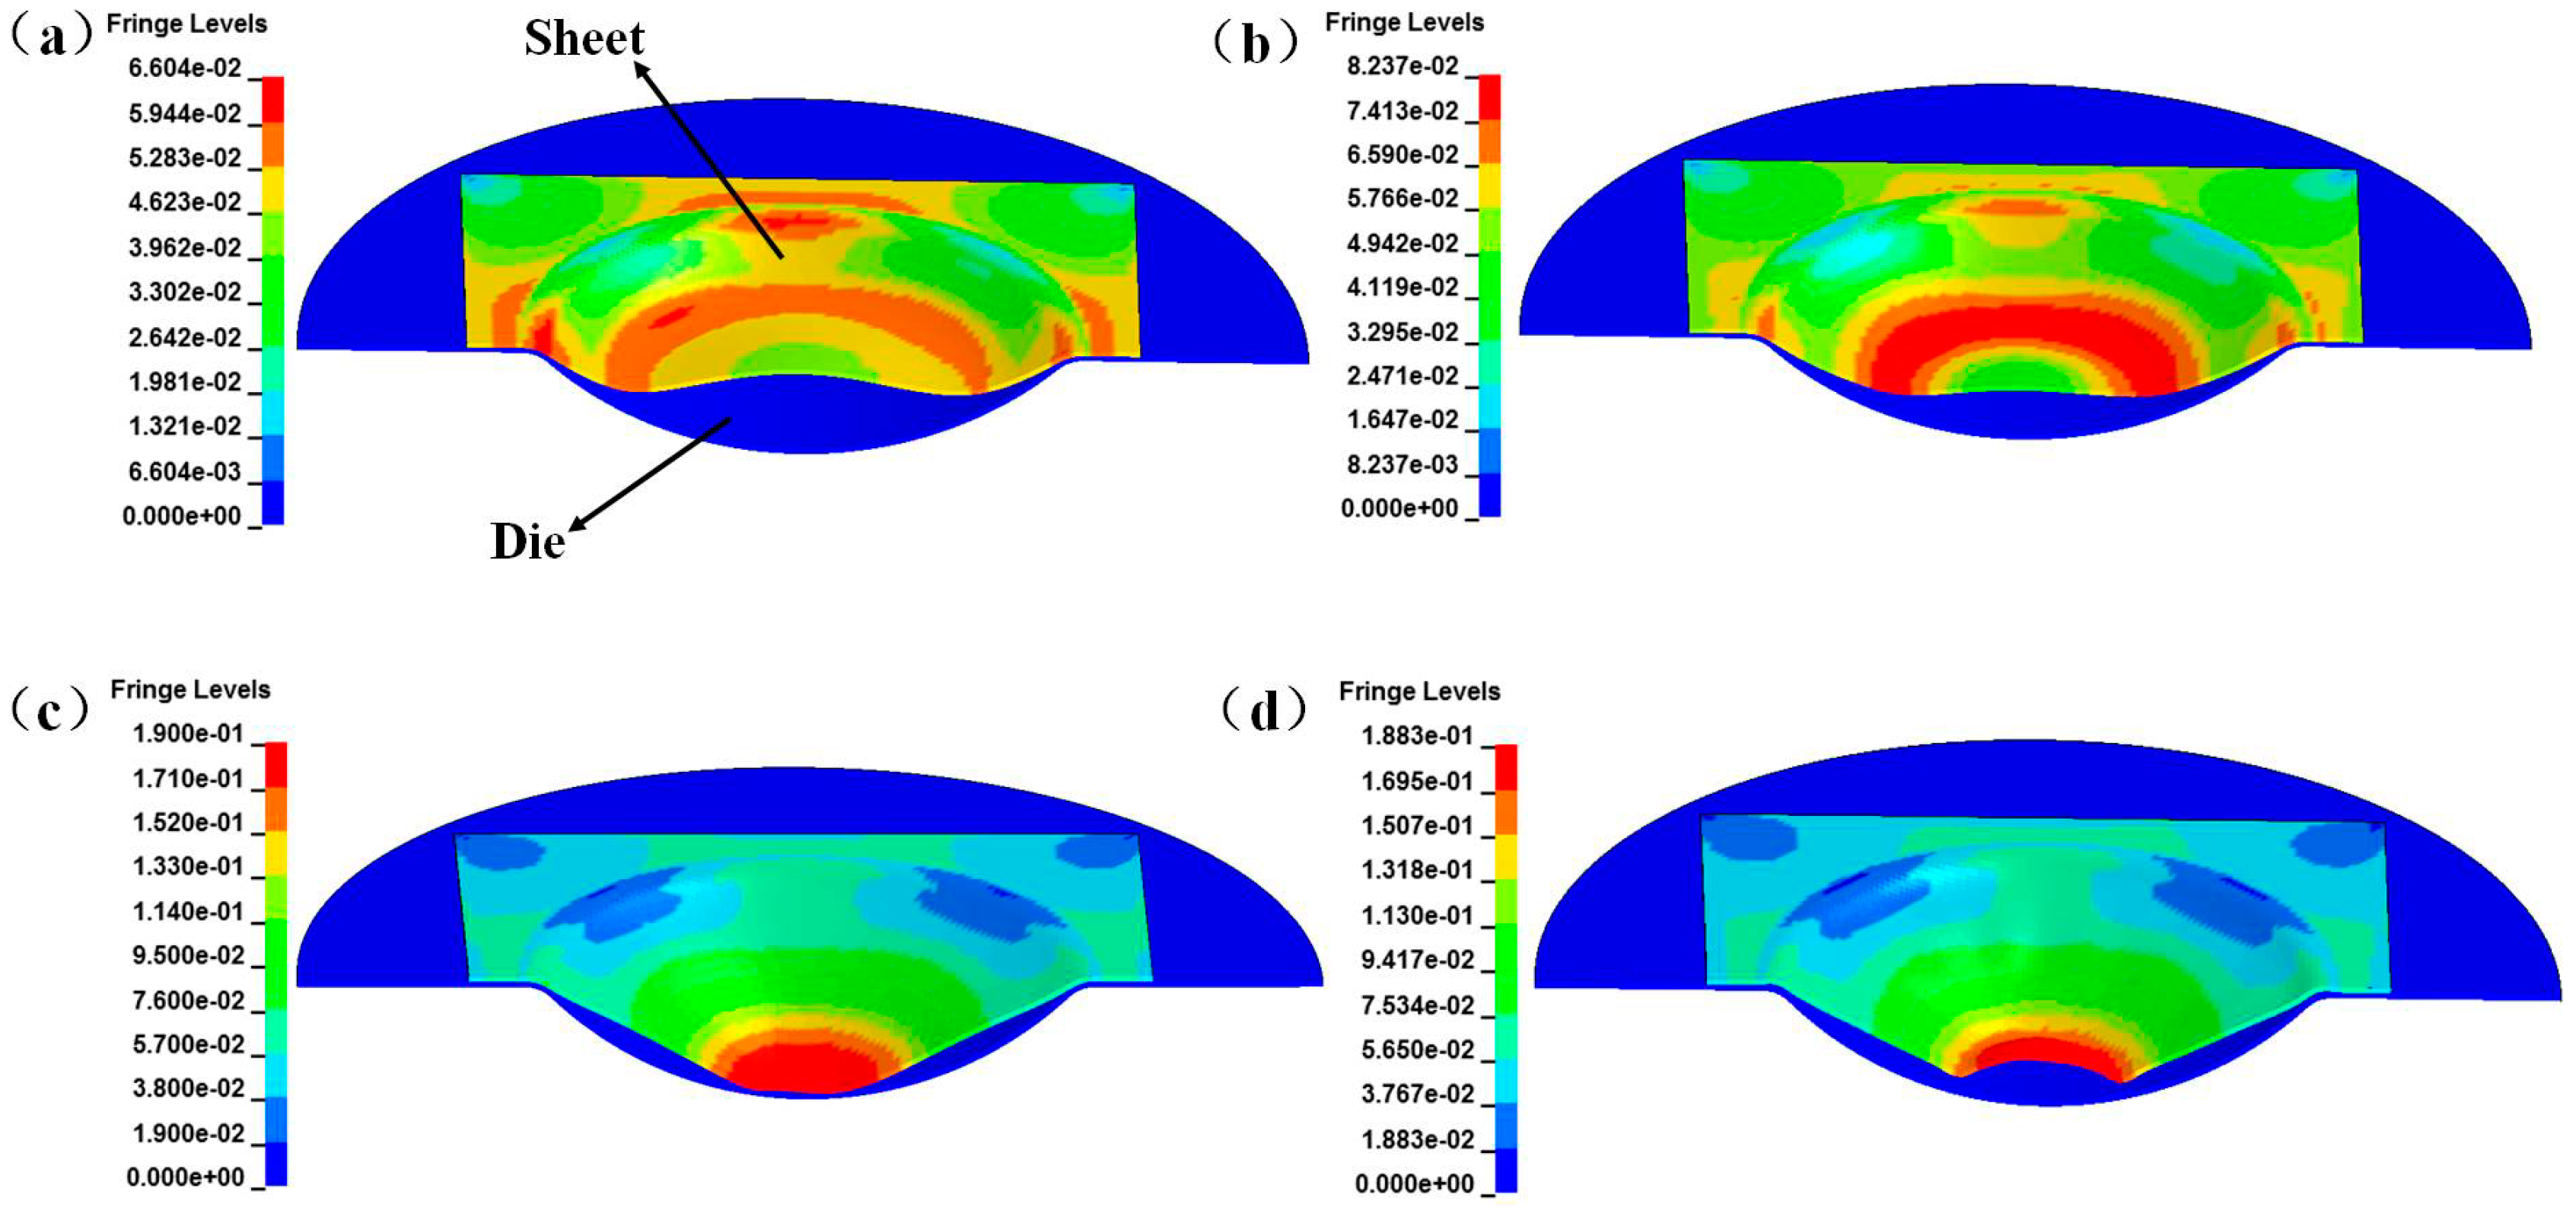
4.2. Numerical Models

Electromagnetic forming simulations were performed to predict sheet deformation behavior and the high-speed electromagnetic impaction fracture process by using the finite element software LS-DYNA 9.0. This software is an explicit finite element method (FEM) code capable of analyzing the transient dynamic plastic deformation and fracture behavior of high-speed impaction.
Figure 9 shows the FEM of high-speed electromagnetic impaction with a hemispherical die. This model only shows half the model consisting of a blank holder, coil, sheet, and die, which were meshed with the eight nodes and a hexahedron element. The coil, holder, and die were set to rigid body to expedite the calculation speed. The electrical resistivity of the sheet was 4.93 × 10⁻⁸ Ωm. The five-layer elements were meshed in the sheet thickness direction. A total of 86,325 elements and 115,456 nodes were used in the electromagnetic model. The electromagnetic boundary and voltage loads were applied to the FEM. During the forming process, the holder and die were considered fixed, and contact conditions were considered between the die and the sheet as well as the sheet and blank holder. Surface-to-surface contact was defined using the penalty method with a static friction coefficient of 0.2 and a dynamic friction coefficient of 0.1 [27].
Figure 10 shows the dimensions of the specimen utilized in the quasi-static tensile experiment using a Series IX universal tensile machine. The tensile direction of the specimen varied by 0°, 45°, and 90° from the rolling direction. Tensile tests of six specimens at 0°, 45°, and 90° from the rolling direction were conducted at room temperature and at a strain rate of 1 × 10⁻³ s−1. The stress-strain curves of the 5052-O aluminum alloy at 0°, 45°, and 90° in the rolling direction were obtained. The stress-strain curves were nearly the same at 0°, 45°, and 90° in the rolling direction (Figure 11). A slight deviation occurred in the elongation test at different tensile directions. Table 5 shows the mechanical properties of the 5052-O aluminum alloy sheet, including the yield and tensile strengths. Minimal change occurred in the elongation of the 5052-O aluminum alloy in the different tensile specimens, thereby confirming the material as isotropic. Table 6 shows the material parameters of the 5052-O aluminum alloy.
The sheet used in the simulation was made of 5052-O aluminum alloy. The constitutive behavior of the sheet is described by Equation (12) according to the fitting stress-strain curve (Figure 12):
σ = 377.23 ε 0.25
where σ is the true stress and ε is the true strain. The strain-rate sensitivity was ignored in the quasi-static deformation progress, whereas the quasi-static data were scaled to adapt to the high strain rate conditions in the high-speed electromagnetic forming using the Cowper-Symonds constitutive model. During the electromagnetic deformation process, the temperature could be ignored due to the limited forming time of approximately 0.03 s [28,29]. Numerous studies [30,31,32,33] have shown that the Cowper-Symonds constitutive model can properly describe the electromagnetic deformation of aluminum alloy. The Cowper-Symonds constitutive model is expressed as follows [34]:
σ C = σ ( 1 + ( ε p ) m )
where σc is the adjusted flow stress, ε ˙ is the plastic strain rate, and p and m are the strain rate parameters. Here, p = 6500 s−1 and m = 0.25 are the specific parameters for aluminum alloy [28,31,34]. Table 7 presents the values of the electrical parameters.
The GTN damage model constants under high strain rate, shown in Table 8, were used in the simulations of the 5052-O aluminum alloy.

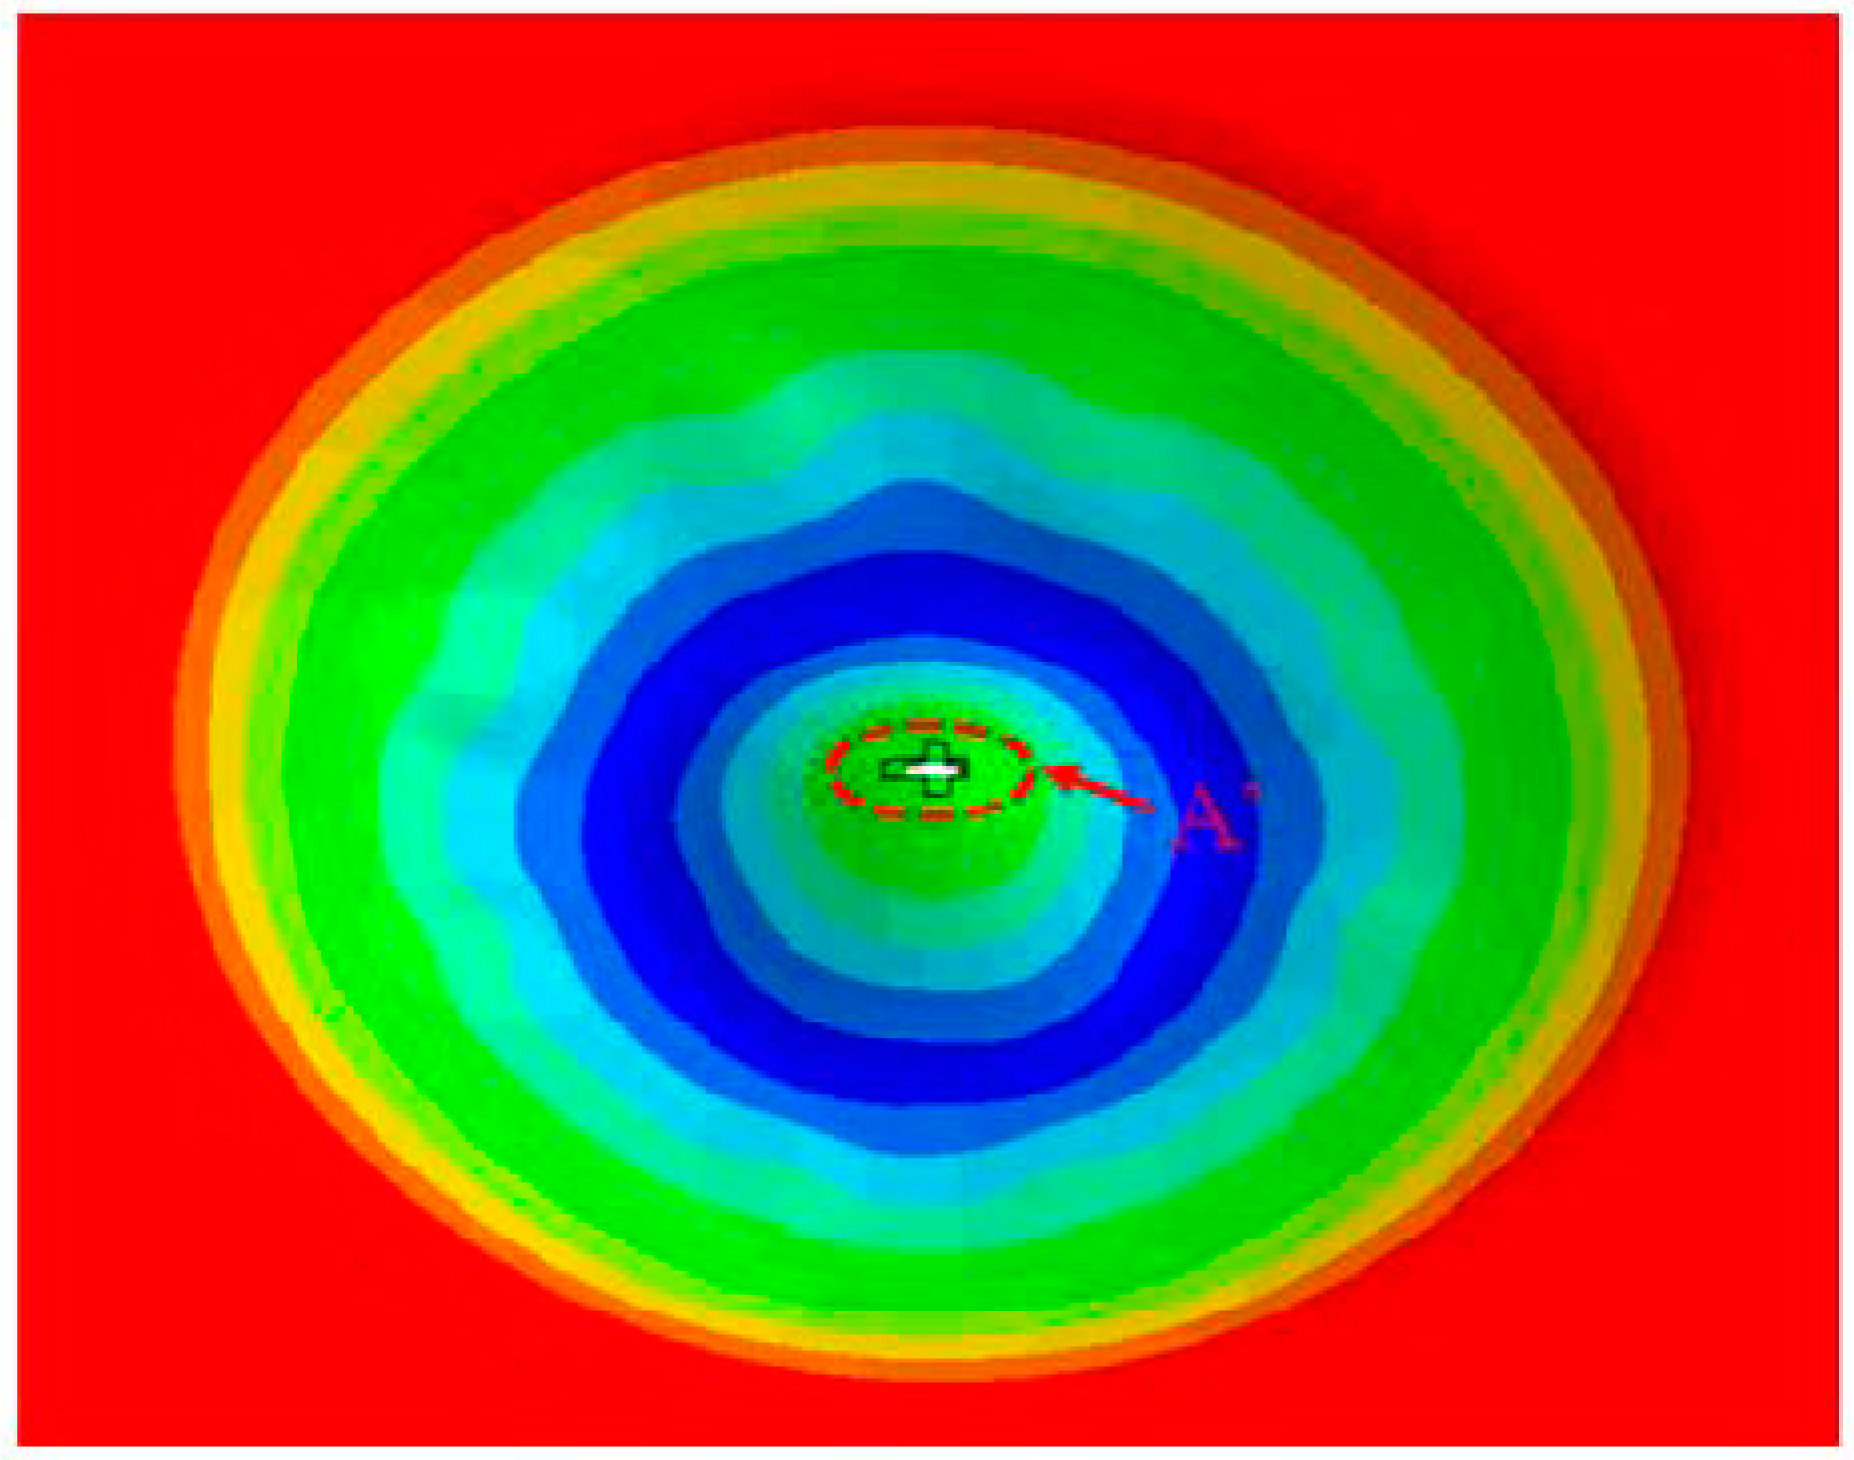
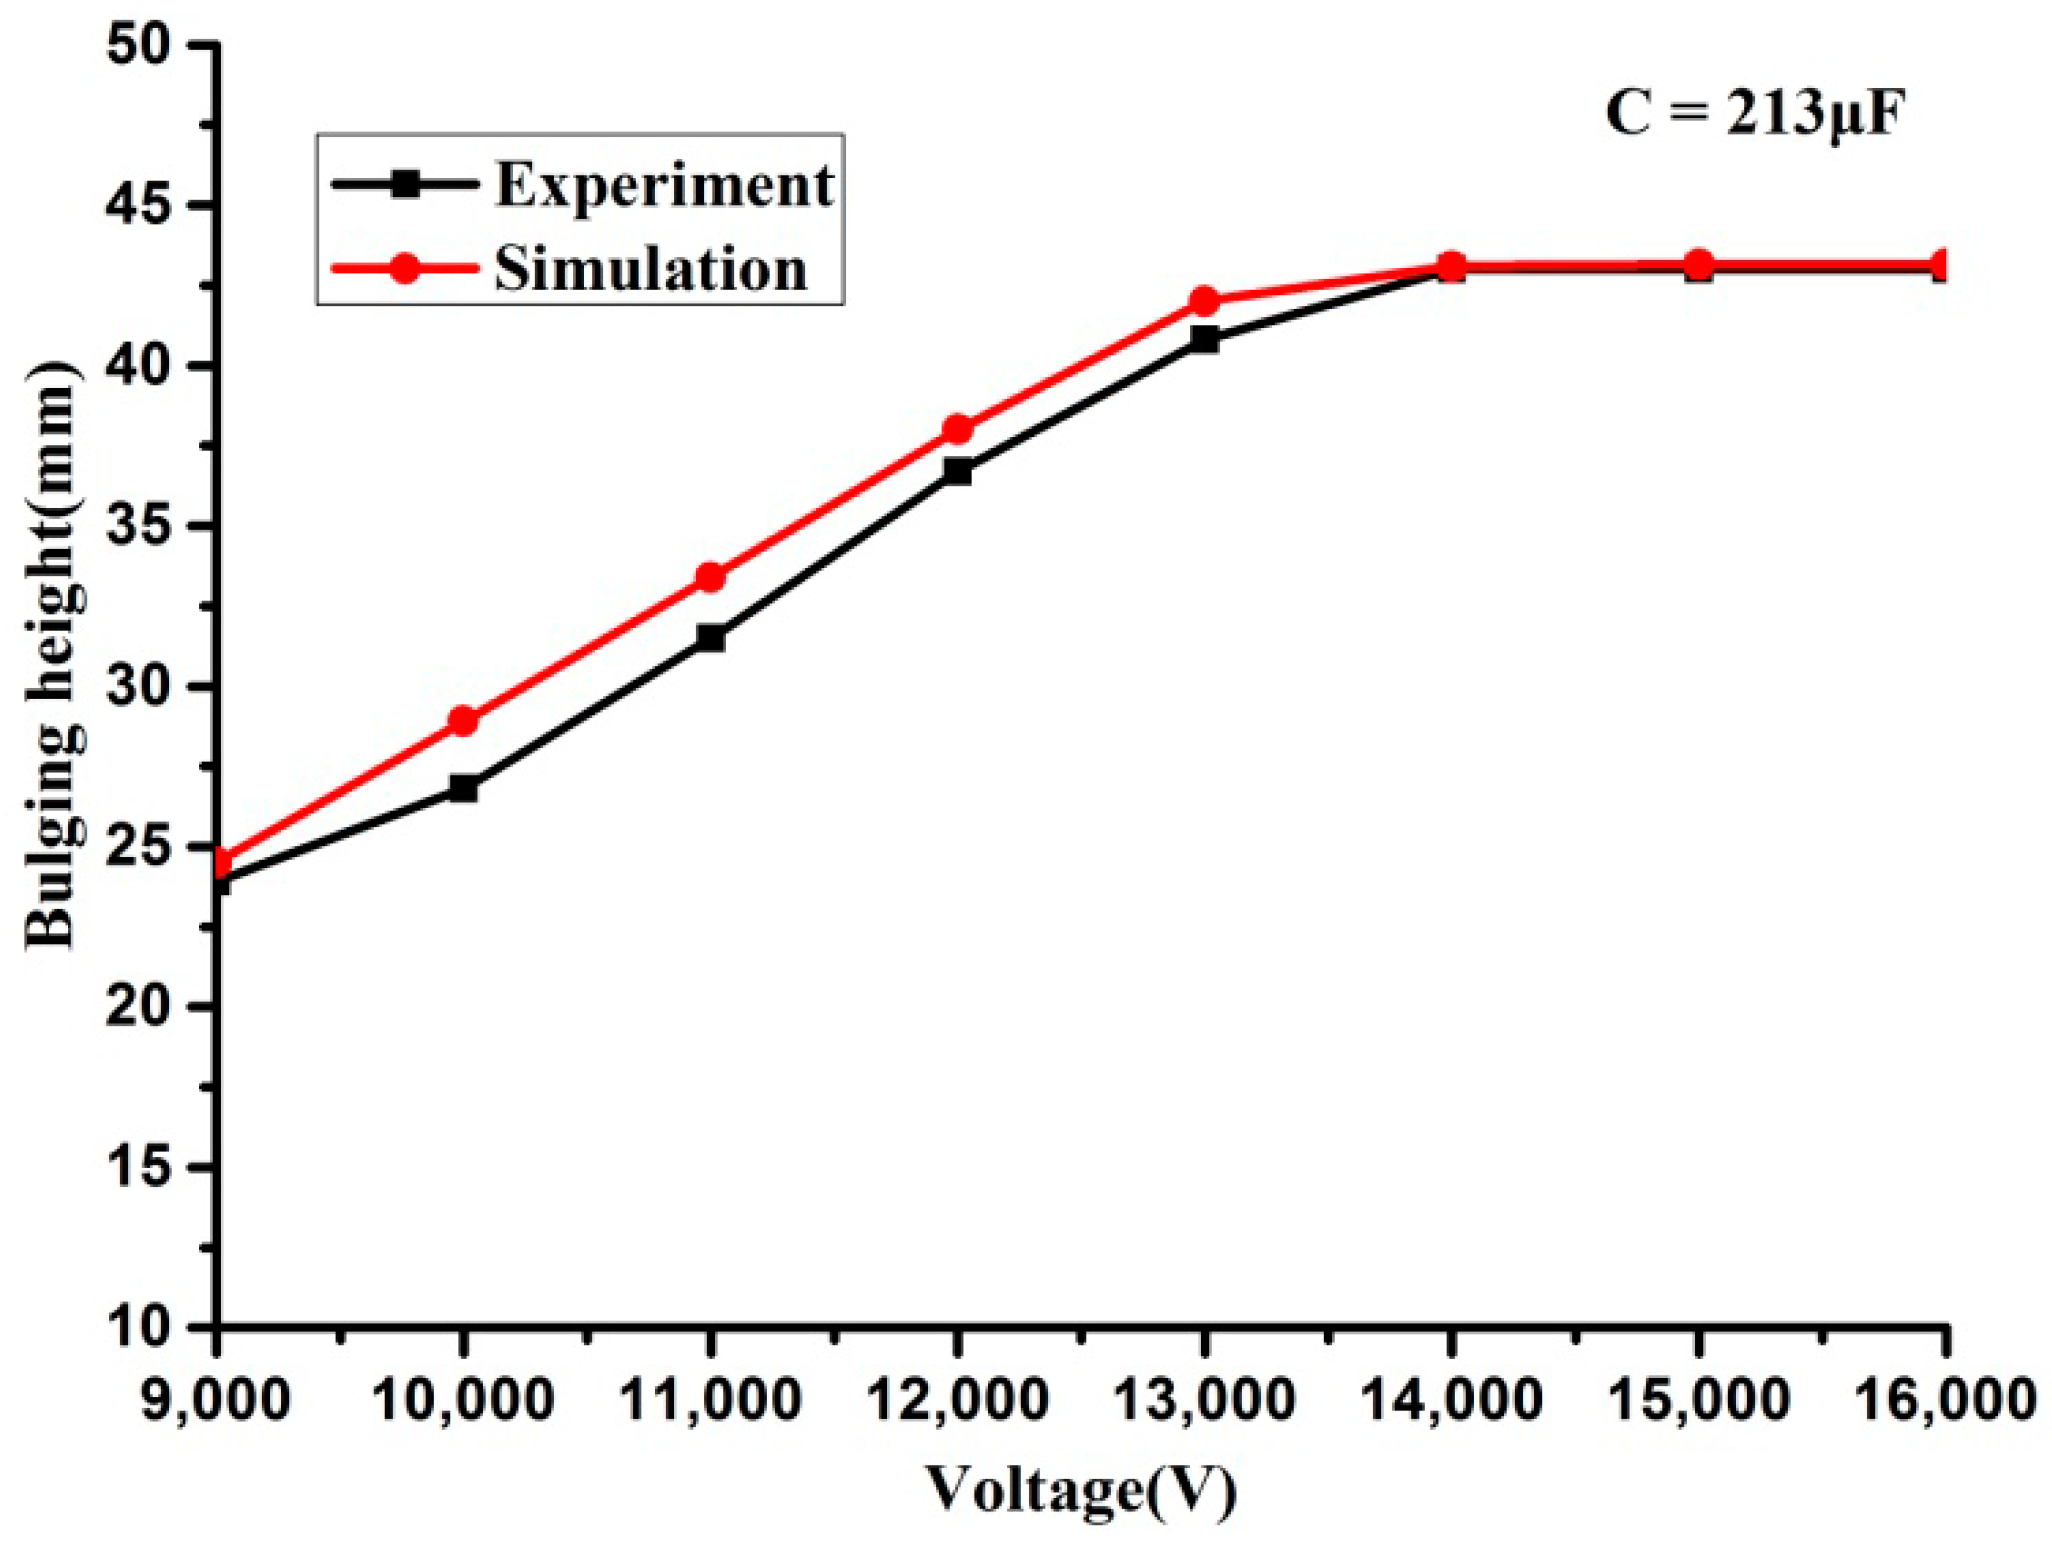
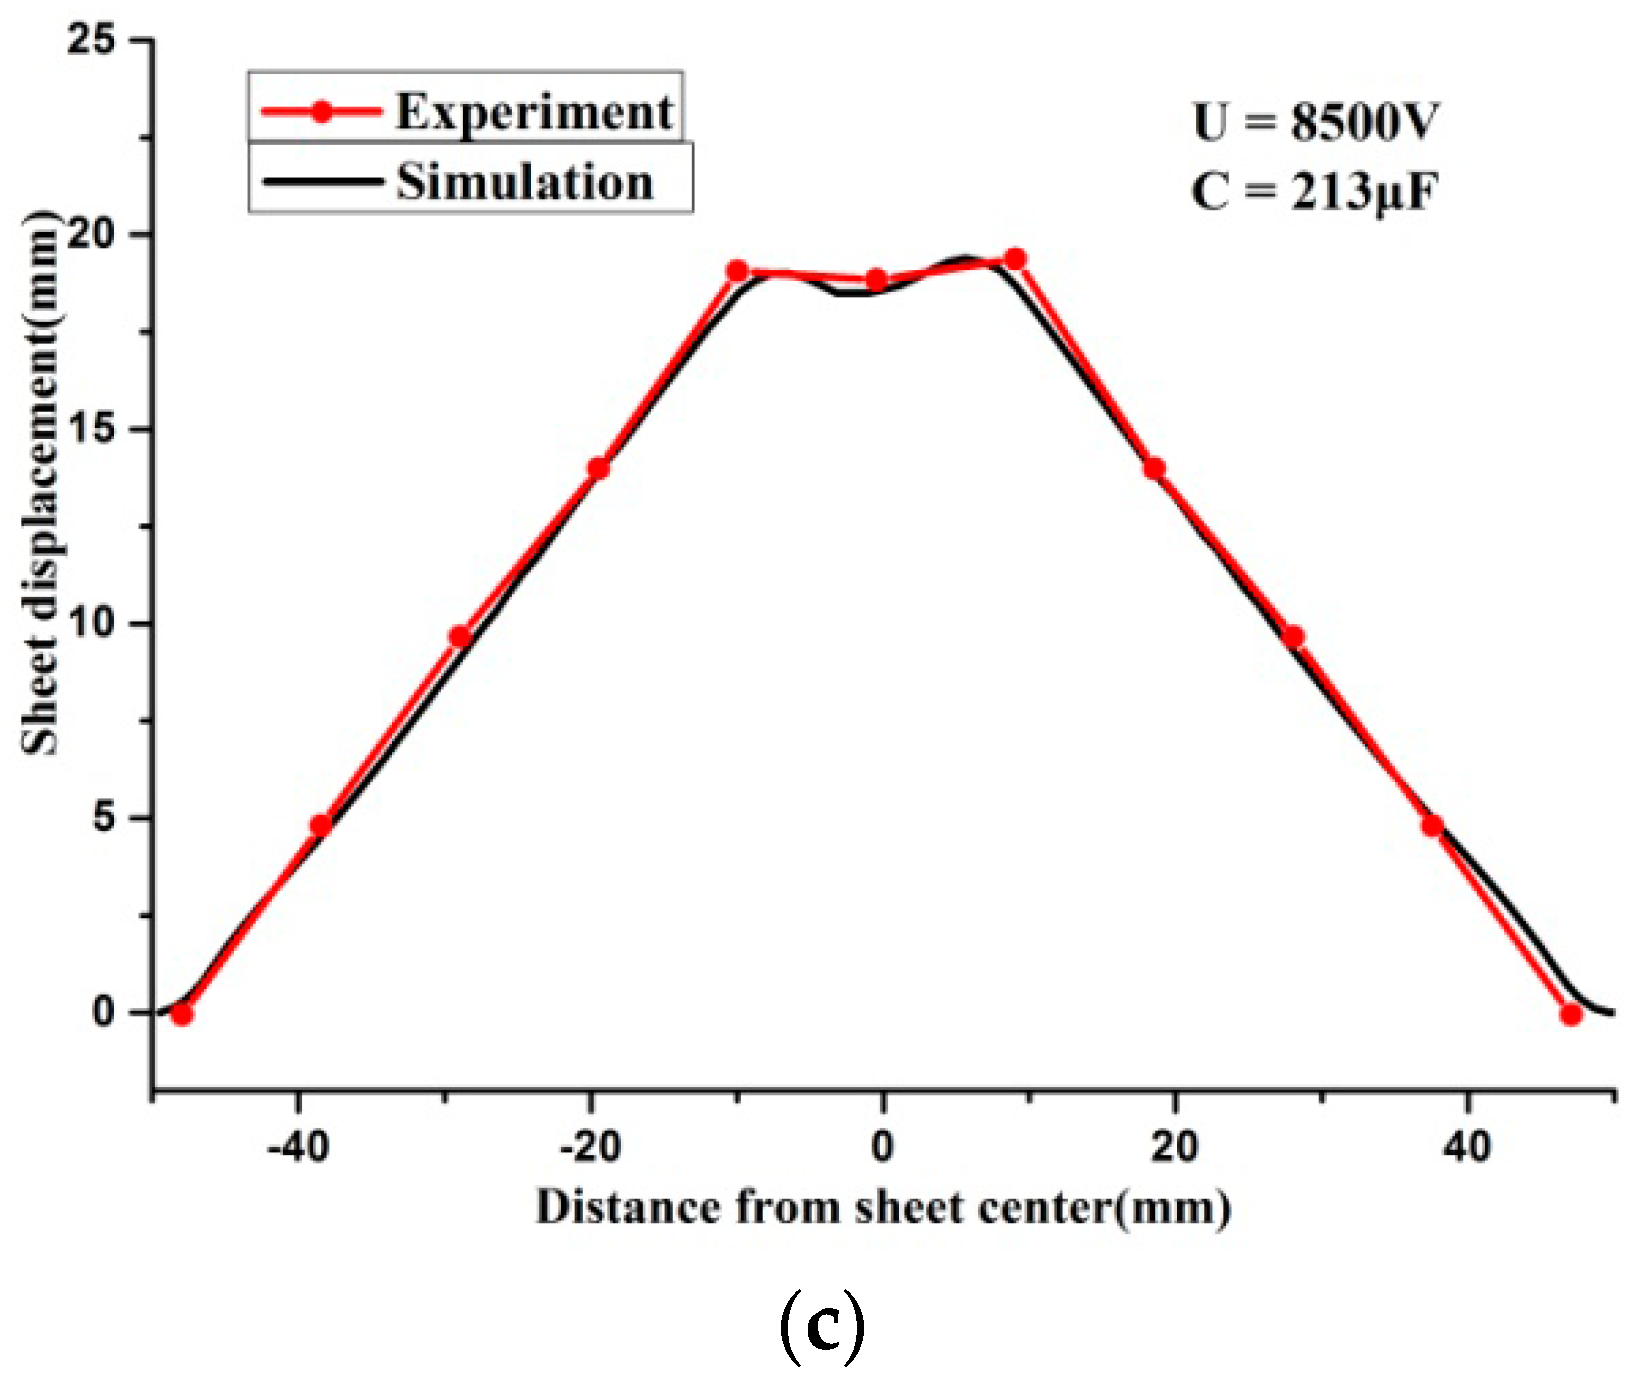
4.3. Validation Study

Figure 13 shows the distribution and evolution of the plastic strain determined by the numerical simulation of the electromagnetic forming contour and high-speed impaction with the die at a discharge voltage of 10 kV. The plastic strain at edge of the deformation area is noticeably larger than the sheet center in the early stages (Figure 13a). During the deformation process, the displacement of the sheet center increased gradually, and the area of greater plastic strain gradually moved to the central area from the sheet edge area (Figure 13b). Finally, the sheet center exhibited high-speed deformation under the effect of inertia, and impacted the bottom of the die (Figure 13c). Then, the sheet center rebounded under the reacting force of the die (Figure 13d). The shape of the high-speed electromagnetic impaction in the numerical simulations compared well with the experimental results, as shown in Figure 14a,b. The deformation height of the specimen after high-speed impaction, which was predicted by numerical simulation (16.65 mm), also agreed well with the experimental data (16.2 mm). Figure 14c shows the final shape profiles of the sheet after high-speed impaction along the central plane. There was only a small error between the experimental and simulation results. The error between the experimental data and simulation results was less than 5%.
The experimental and simulation results were compared with various discharge voltages to confirm the reliability of the model. The sheet shapes and profiles of the high-speed electromagnetic impaction in the numerical simulations agreed with the experimental results (Figure 15, Figure 16 and Figure 17). Therefore, the proposed model accurately predicted the impaction results with different discharge voltages.
Figure 18 shows a photo of the specimen during high-speed electromagnetic impaction with a discharge voltage of 13.5 kV and rupture occurring at the center. Figure 19 shows the fracture caused by the high-speed electromagnetic impaction at a discharge voltage of 13.5 kV with the GTN damage model. In comparing the two figures, the results from the GTN damage model agreed well with the experimental results.
Figure 20 shows the process of sheet deformation when the discharge voltage was 13.5 kV. At the initial deformation stage, the sidewall region of the sheet initially impacted the die. With the discharge time increasing to 120 μs, the sheet periphery region gradually impacted the sidewall of the die cavity. The sheet center suffered a serious rebound as it impacted the bottom of the die. The periphery region continued to move downward while the sheet center changed from extrusion to stretch due to the presence an electromagnetic force in the sidewall region. The sidewall area of the sheet initially impacted the die, which caused this area to suffer from compressive stress under the process of high-speed impaction. However, the sheet center also suffered two-direction tensile stress after impaction, and a sharp variation in the tensile strain occurred in this area. Finally, the apex area of the sheet incurred a crack under the inertial action of the high-speed rebound. This result is relatively different compared with those in Feng et al. [35].
During the high-speed impaction process, the void distribution of the sheet was heterogenous. The distribution of the void volume fraction was analyzed to predict the fracture location of the sheet. Figure 21 shows the void evolution in different positions. The three surface elements located at the center, sidewall, and the fillet of the sheet were investigated. At the beginning of deformation, the plastic deformation of all elements was extremely small, whereas the void volume fraction remained unchanged. The void volume fraction of the fillet region initially increased because the plastic deformation at approximately 70 μs was concentrated on the fillet region. When the sheet sidewall region continuously impacted the die, the void volume fraction slightly changed. However, the void volume fraction of the central region element suddenly changed considerably during the inertial stage. The increase in the voids of the central region and coalescence caused saltation in the void volume fraction because of the rebound tensile stress. Therefore, fracture would most likely occur in the sheet center.
To further validate the obtained model, experimental studies and simulations of high-speed electromagnetic impaction with a cylinder-shaped die were conducted, the FEM of which is shown in Figure 22. The elements of the cylinder-shaped die, coil, and blank holder were also set to rigid body. The boundary conditions, friction coefficient, coil structure, and the geometry size were the same as in Figure 9.
Figure 23 shows the results of the high-speed electromagnetic impaction with a cylinder-shaped die at different discharge voltages. The bulging heights between the experiment and simulation values of the model were in good agreement. The bulging height increased gradually with the increase in discharge voltage. However, when the discharge voltage was higher than 14 kV, the bulging height stopped increasing because a serious impact occurred between the sheet and the bottom of the cylinder-shaped die above 14 kV.
Figure 24a shows a photo of the specimen impacting the cylinder-shaped die at a discharge voltage of 14 kV. From this figure, necking and fracture occurred in the model with the high-speed impaction at a discharge voltage of 14 kV. The model results were in good agreement with the experimental results (Figure 24a,b). The specimen produced serious necking and cracks below the top of the collision region, which did not initiate at the apex of the specimen rebound region. The failure mode was slightly different compared with the results of impaction with a hemispherical die.

5. Conclusions

A new calculation method for the volume percentage of voids was proposed in this study. The GTN model parameters were determined by counting the void fractions at various damage stages. The microstructure morphologies of a 5052-O aluminum alloy sheet at high strain rates were observed via SEM.
The GTN damage model for high strain rates was used to predict the damage behavior of 5052-Oaluminum alloys under high-speed electromagnetic impaction. The numerical simulations and high-speed electromagnetic collision experiments verified the reliability of this model. The damage model for high strain rates accurately predicted the fracture occurrence on electromagnetic impaction forming.
The shape of the high-speed electromagnetic impaction in the numerical simulations agreed with the experimental results. The void volume fraction of the central region element suddenly changed considerably during the inertial stage. The increase in the voids of the central region and convergence caused fraction during the high-speed electromagnetic impact with the hemispherical die due to the rebound tensile stress. Therefore, fracture would most likely occur in the sheet center under high-speed electromagnetic impact with a hemispherical die.
Future work will attempt to establish high-speed impaction forming limit diagrams with numerical determination methods. The reasons for high-speed impaction formability improvement will be further revealed by transmission electron microscopy. Whether high-speed impaction affects the material’s fine texture and structure property should also be investigated.

Author Contributions

The research was conceived by F.F. and J.L.; P.Y., H.S., Q.Z. and P.H. planned and performed all the experiments; Theoretical and experimental analysis were performed by H.S., Q.Z., and P.H.; The manuscript was written by F.F. with support from all co-authors.

Funding

This research was funded by National Natural Science Foundation of China (No. 51705169 and No. 51435007) and the China Postdoctoral Science Foundation (No. 2017M6 10472).

Conflicts of Interest

The authors declare no conflict of interest.

References

  1. Cui, X.H.; Mo, J.H.; Li, J.J.; Zhao, J.; Zhu, Y.; Huang, L.; Li, Z.W.; Zhong, K. Electromagnetic incremental forming (EMIF): A novel aluminum alloy sheet and tube forming technology. J. Mater. Process. Technol. 2014, 214, 409–427. [Google Scholar] [CrossRef]
  2. Kim, D.; Park, H.I.; Lee, J.; Kim, J.H.; Lee, M.-G.; Lee, Y. Experimental study on forming behavior of high-strength steel sheets under electromagnetic pressure. Proc. Inst. Mech. Eng. Part B J. Eng. Manuf. 2015, 229, 670–681. [Google Scholar] [CrossRef]
  3. Chu, Y.-Y.; Lee, R.-S. Effect of field shaper geometry on the Lorentz force for electromagnetic sheet impact forming process. Proc. Inst. Mech. Eng. Part B J. Eng. Manuf. 2013, 227, 324–332. [Google Scholar] [CrossRef]
  4. Li, F.-Q.; Mo, J.-H.; Li, J.-J.; Huang, L.; Zhou, H.-Y.; Qiu, L. Experimental and numerical investigation of electromagnetic bulging of titanium alloy Ti-6Al-4V at room temperature. Proc. Inst. Mech. Eng. Part B J. Eng. Manuf. 2015, 229, 1753–1763. [Google Scholar] [CrossRef]
  5. Jang, C.H.; Jin, C.K.; Bolouri, A.; Kang, C.G. Effect of forming conditions on mechanical properties of rheoformed thin plates with microchannels using electromagnetic stirring. Proc. Inst. Mech. Eng. Part B J. Eng. Manuf. 2014, 228, 399–412. [Google Scholar] [CrossRef]
  6. Long, A.; Wan, M.; Wang, W.; Wu, X.; Cui, X.; Ma, B. Forming methodology and mechanism of a novel sheet metal forming technology—Electromagnetic superposed forming (EMSF). Int. J. Solids Struct. 2017. [Google Scholar] [CrossRef]
  7. Lai, Z.; Cao, Q.; Han, X.; Huang, Y.; Deng, F.; Chen, Q.; Li, L. Investigation on plastic deformation behavior of sheet workpiece during radial Lorentz force augmented deep drawing process. J. Mater. Process. Technol. 2017, 245, 193–206. [Google Scholar] [CrossRef]
  8. Paese, E.; Geier, M.; Homrich, R.P.; Rosa, P.; Rossi, R. Sheet metal electromagnetic forming using a flat spiral coil: Experiments, modeling, and validation. J. Mater. Process. Technol. 2019, 263, 408–422. [Google Scholar] [CrossRef]
  9. Cui, X.; Mo, J.; Han, F. 3D Multi-physics field simulation of electromagnetic tube forming. Int. J. Adv. Manuf. Technol. 2012, 59, 521–529. [Google Scholar] [CrossRef]
  10. Oh, Y.-R.; Nam, H.-S.; Kim, Y.-J.; Miura, N. Application of the GTN model to ductile crack growth simulation in through-wall cracked pipes. Int. J. Press. Vessel. Pip. 2018, 159, 35–44. [Google Scholar] [CrossRef]
  11. Butcher, C.; Chen, Z.; Bardelcik, A.; Worswick, M. Damage-based finite-element modeling of tube hydroforming. Int. J. Fract. 2009, 155, 55–65. [Google Scholar] [CrossRef]
  12. Shahzamanian, M.M. Anisotropic Gurson-Tvergaard-Needleman plasticity and damage model for finite element analysis of elastic-plastic problems. Int. J. Numer. Methods Eng. 2018, 115, 1527–1551. [Google Scholar] [CrossRef]
  13. Cricrì, G. A consistent use of the Gurson-Tvergaard-Needleman damage model for the R-curve calculation. Frat. Integr. Strutt. 2013, 7, 161–174. [Google Scholar]
  14. Uthaisangsuk, V.; Prahl, U.; Münstermann, S.; Bleck, W. Experimental and numerical failure criterion for formability prediction in sheet metal forming. Comput. Mater. Sci. 2008, 43, 43–50. [Google Scholar] [CrossRef]
  15. Lemiale, V.; Chambert, J.; Picart, P. Description of numerical techniques with the aim of predicting the sheet metal blanking process by FEM simulation. J. Mater. Process. Technol. 2009, 209, 2723–2734. [Google Scholar] [CrossRef]
  16. Zhang, Z.; Thaulow, C.; Ødegård, J. A complete Gurson model approach for ductile fracture. Eng. Fract. Mech. 2000, 67, 155–168. [Google Scholar] [CrossRef]
  17. Kami, A.; Dariani, B.M.; Sadough Vanini, A.; Comsa, D.S.; Banabic, D. Numerical determination of the forming limit curves of anisotropic sheet metals using GTN damage model. J. Mater. Process. Technol. 2015, 216, 472–483. [Google Scholar] [CrossRef]
  18. Teng, B.; Wang, W.; Xu, Y. Ductile fracture prediction in aluminium alloy 5A06 sheet forming based on GTN damage model. Eng. Fract. Mech. 2017, 186, 242–254. [Google Scholar] [CrossRef]
  19. He, M.; Li, F.; Wang, Z. Forming Limit Stress Diagram Prediction of Aluminum Alloy 5052 Based on GTN Model Parameters Determined by In Situ Tensile Test. Chin. J. Aeronaut. 2011, 24, 378–386. [Google Scholar] [CrossRef]
  20. Gurson, A.L. Continuum theory of ductile rupture by void nucleation and growth: Part I—Yield criteria and flow rules for porous ductile media. J. Eng. Mater. Technol. 1977, 99, 2–15. [Google Scholar] [CrossRef]
  21. Tvergaard, V.; Needleman, A. Analysis of the cup-cone fracture in a round tensile bar. Acta Met. 1984, 32, 157–169. [Google Scholar] [CrossRef]
  22. Needleman, A.; Tvergaard, V. An analysis of ductile rupture modes at a crack tip. J. Mech. Phys. Solids 1987, 35, 151–183. [Google Scholar] [CrossRef]
  23. Tvergaard, V. Influence of voids on shear band instabilities under plane strain conditions. Int. J. Fract. 1981, 17, 389–407. [Google Scholar] [CrossRef]
  24. Tvergaard, V. On localization in ductile materials containing spherical voids. Int. J. Fract. 1982, 18, 237–252. [Google Scholar]
  25. Abbasi, M.; Bagheri, B.; Ketabchi, M.; Haghshenas, D. Application of response surface methodology to drive GTN model parameters and determine the FLD of tailor welded blank. Comput. Mater. Sci. 2012, 53, 368–376. [Google Scholar] [CrossRef]
  26. Chu, C.; Needleman, A. Void nucleation effects in biaxially stretched sheets. J. Eng. Mater. Technol. (Trans. ASME) 1980, 102, 249–256. [Google Scholar] [CrossRef]
  27. Fan, Z.; Yu, H.; Li, C. Plastic deformation behavior of bi-metal tubes during magnetic pulse cladding: FE analysis and experiments. J. Mater. Process. Technol. 2016, 229, 230–243. [Google Scholar] [CrossRef]
  28. Fang, J.; Mo, J.; Cui, X.; Li, J.; Zhou, B. Electromagnetic pulse-assisted incremental drawing of aluminum cylindrical cup. J. Mater. Process. Technol. 2016, 238, 395–408. [Google Scholar] [CrossRef]
  29. Werdelmann, P.; Rosendahl, J.; Peier, D. Assessing the effective energy for magnetic forming processes by means of measurements and numerical calculation. In Proceedings of the 3rd International Conference on High Speed Forming, Dortmund, Germany, 11–12 March 2008; pp. 299–306. [Google Scholar]
  30. Mamalis, A.G.; Manolakos, D.E.; Kladas, A.G.; Koumoutsos, A.K. Electromagnetic forming tools and processing conditions: Numerical simulation. Mater. Manuf. Process. 2006, 21, 411–423. [Google Scholar] [CrossRef]
  31. Liu, D.-H.; Li, C.-F.; Yu, H.-P. Numerical modeling and deformation analysis for electromagnetically assisted deep drawing of AA5052 sheet. Trans. Nonferr. Met. Soc. China 2009, 19, 1294–1302. [Google Scholar] [CrossRef]
  32. Xu, J.R.; Yu, H.P.; Li, C.F. Effects of process parameters on electromagnetic forming of AZ31 magnesium alloy sheets at room temperature. Int. J. Adv. Manuf. Technol. 2013, 66, 1591–1602. [Google Scholar] [CrossRef]
  33. Paturi, U.M.R.; Narala, S.K.R.; Pundir, R.S. Constitutive flow stress formulation, model validation and FE cutting simulation for AA7075-T6 aluminum alloy. Mater. Sci. Eng. A 2014, 605, 176–185. [Google Scholar] [CrossRef]
  34. Haiping, Y.U.; Chunfeng, L.I.; Jianghua, D.E.N.G. Sequential coupling simulation for electromagnetic–mechanical tube compression by finite element analysis. J. Mater. Process. Technol. 2009, 209, 707–713. [Google Scholar] [CrossRef]
  35. Feng, F.; Huang, S.; Meng, Z.; Hu, J.; Lei, Y.; Zhou, M.; Yang, Z. A constitutive and fracture model for AZ31B magnesium alloy in the tensile state. Mater. Sci. Eng. A 2014, 594, 334–343. [Google Scholar] [CrossRef]
Figure 1. Physical aspect of ductile damage: (a) the microvoids coalescence and local necking occurs; and (b) damage evolution and macroscopic crack in the necked region.
Metals 08 00761 g001
Figure 2. A tool diagram of 5052-O aluminum alloy sheet electromagnetic free forming using the flat spiral coil.
Metals 08 00761 g002
Figure 3. The high-speed electromagnetic forming with (a) necking; and (b) fractured specimens.
Metals 08 00761 g003
Figure 4. The initial void distribution in 5052-O aluminum alloy.
Metals 08 00761 g004
Figure 5. The necking stage during electromagnetic high-speed forming.
Metals 08 00761 g005
Figure 6. The microvoids interconnection of 5052-O aluminum alloy during the fracture stage.
Metals 08 00761 g006
Figure 7. The calculation of void area percentage: (a) the voids coalescence stage; and (b) the fracture stage.
Metals 08 00761 g007
Figure 8. A tool diagram of 5052-O aluminum alloy sheet high-speed electromagnetic impaction with the flat spiral coil.
Metals 08 00761 g008
Figure 9. Half of finite element model for high-speed electromagnetic impaction with a hemispherical die.
Metals 08 00761 g009
Figure 10. The dimensions of tensile specimen.
Metals 08 00761 g010
Figure 11. The stress-strain curves of 5052-O aluminum alloy at 0°, 45° and 90° to the rolling direction.
Metals 08 00761 g011
Figure 12. The experiment and fitting curve of 5052-O aluminum alloy.
Metals 08 00761 g012
Figure 13. Numerical simulation of the plastic strain distribution during a high-speed electromagnetic impaction process with the die at a discharge voltage of 10 kV: (a) 80 μs; (b) 120 μs; (c) 180 μs; and (d) 300 μs.
Metals 08 00761 g013
Figure 14. Deformation height and shape profiles of high-speed impaction at a discharge voltage of 10 kV: (a) experiment result; (b) simulation result; and (c) comparison of the profiles between the experimental and simulated results along the central plane.
Metals 08 00761 g014
Figure 15. The deformation height and shape profiles of high-speed impaction at a discharge voltage of 8.5 kV: (a) experiment result; (b) simulation result; and (c) profiles comparison between the experimental and simulated results along the central plane.
Metals 08 00761 g015aMetals 08 00761 g015b
Figure 16. The deformation height and shape profiles of high-speed impaction at a discharge voltage of 9 kV: (a) experimental result; (b) simulation result; and (c) profiles comparison between the experimental and simulated results along central plane.
Metals 08 00761 g016
Figure 17. Deformation height and shape profiles of high-speed impaction at a discharge voltage of 12 kV: (a) experimental result; (b) simulation result; and (c) profiles comparison between the experimental and simulated results along the central plane.
Metals 08 00761 g017
Figure 18. Photo of electromagnetic high-speed impaction fracture specimen.
Metals 08 00761 g018
Figure 19. The fracture result of high-speed electromagnetic impaction with the GTN model.
Metals 08 00761 g019
Figure 20. The fracture process of 5052-O aluminum alloy electromagnetic under impaction forming with the die at a discharge voltage of 13.5 kV, after: (a) 80 μs; (b) 120 μs; (c) 160 μs; (d) 200 μs; (e) 250 μs; and (f) 300 μs.
Metals 08 00761 g020
Figure 21. Void evolution in different positions.
Metals 08 00761 g021
Figure 22. The finite element model of high-speed electromagnetic impaction with a cylinder-shaped die.
Metals 08 00761 g022
Figure 23. The relationship between discharge voltages and bulging heights.
Metals 08 00761 g023
Figure 24. (a) Experimental; and (b) simulation-predicted fracture specimen impact to the cylinder-shaped die.
Metals 08 00761 g024
Table 1. Chemical composition of the 5052-O aluminum alloy sheet (wt %).
Chemical ElementSiFeCuMnMgCrZnAl
Weight percentage0.090.210.040.052.410.280.04Balance
Table 2. Technological parameters of the 98 KJ electromagnetic forming machine.
Max Energy (kJ)Capacity (μF)Max Voltage (kV)
9821330
Table 3. The microvoid area of the necking and fracture specimens.
Necking Specimen NumberMicrovoid Area of Coalescence Stage (Pixels)Fracture Specimen NumberMicrovoid Area of Fracture Stage (Pixels)
113,481418,527
213,246518,742
313,707618,291
Average Value13,478Average Value18,520
Table 4. The calculation of average void volume fraction according to experiments.
Void Volume Fractionf0fcfFfN
Value0.001120.02060.02990.0132
Table 5. Mechanical properties of the 5052-O aluminum alloy sheet.
Specimen NumberYield Strength (mpa)Tensile Strength (mpa)Elongation (%)
1114.12208.8926.46
2117.85209.1827.37
3115.63212.9327.01
4118.97208.3428.58
5116.04208.2228.11
6117.25208.6726.96
Average value116.64209.3727.42
Table 6. Material parameters of the 5052-O aluminum alloy sheet.
Relative PermeabilityResistivity (Ωm)ρ (kg/m3)E (GPa)Yield Strength (MPa)Poisson’s RatioTensile Strength (MPa)Elongation (%)
14.93 × 10−8270072116.640.3209.3727.42
Table 7. Values of electrical parameters.
Electrical ParameterSymbolValue
Total resistanceR83 mΩ
Total capacitanceC213 μF
Total inductanceL11.8 μH
Table 8. The parameters of 5052-O aluminum alloy in the Gurson-Tvergaard-Needleman (GTN) damage model.
f0fcfFfNSN ε N q1q2q3
0.001120.02060.02990.01320.10.31.512.25

