On the Critical Resolved Shear Stress and Its Importance in the Fatigue Performance of Steels and Other Metals with Different Crystallographic Structures


Institute for Materials Testing, Materials Science and Strength of Materials (IMWF), University of Stuttgart, Pfaffenwaldring 32, 70569 Stuttgart, Germany
*
Author to whom correspondence should be addressed.
Metals 2018, 8(11), 883; https://doi.org/10.3390/met8110883
Submission received: 30 September 2018
/
Revised: 17 October 2018
/
Accepted: 25 October 2018
/
Published: 29 October 2018
(This article belongs to the Special Issue Fatigue and Wear for Steels)
Abstract
:This study deals with the numerical estimation of the fatigue life represented in the form of strength-life (S-N, or Wöhler) curves of metals with different crystallographic structures, namely body-centered cubic (BCC) and face-centered cubic (FCC). Their life curves are determined by analyzing the initiation of a short crack under the influence of microstructure and subsequent growth of the long crack, respectively. Micro-models containing microstructures of the materials are set up by using the finite element method (FEM) and are applied in combination with the Tanaka-Mura (TM) equation in order to estimate the number of cycles required for the crack initiation. The long crack growth analysis is conducted using the Paris law. The study shows that the crystallographic structure is not the predominant factor that determines the shape and position of the fatigue life curve in the S-N diagram, but it is rather the material parameter known as the critical resolved shear stress (CRSS). Even though it is an FCC material, the investigated austenitic stainless steel AISI 304 shows an untypically high fatigue limit (208 MPa), which is higher than the fatigue limit of the BCC vanadium-based micro-alloyed forging steel AISI 1141 (152 MPa).
1. Introduction
The approaches for the fatigue design and analysis are used to estimate when, if ever, a cyclically loaded specimen or machine component will lose its integrity over a period of time due to the fatigue. For the purpose of representing the practical recommendations of such approaches, the strength-life (S-N) diagram is often used. The S-N diagram provides the bearable stress (or the fatigue strength) S versus life cycles N of a material. The results are generated typically from tests by using standard laboratory-controlled specimens subjected to a cyclic loading as well as numerical approaches that are becoming more and more relevant recently. The approaches or methods of fatigue failure analysis combine science and engineering [1].
A scientific approach to the question of fatigue strength is to consider the effects of crystal structure on fatigue mechanisms [2,3,4,5]. Researchers from the field of fatigue are aware of the ratio between endurance (or fatigue) limit and ultimate tensile strength, σe/σu. This ratio is also known as the fatigue ratio and is typically higher for ferrous materials (including steels), which are of the body-centered cubic (BCC) type, than for non-ferrous materials, which are face-centered cubic (FCC). Furthermore, ferrous materials generally show a sharp “knee” in the S-N diagram at about 106 cycles, after which the strength-life curve increasingly flattens. The strength at this point is known as the fatigue limit. Interestingly, most other materials exhibit a gradual flattening between 107–108 cycles (see Figure 1). Although these effects have been explained by some researchers in terms of strain ageing and dislocation locking (see [5]), there is also evidence that crystal structure plays an important role.
Ferro et al. [2,5] examined two groups of iron-nickel alloys, which included an alloy with 96.5% iron and pure nickel (see Figure 1). In these tests, the ferrous or iron-rich group (BCC) exhibited consistently higher fatigue strengths than the nickel-rich group (FCC), as well as showing a definite fatigue limit at about 106 cycles. Figure 1 illustrates these effects. All materials had the same geometry (More-type specimens), all had the same preparation process (annealing) and all have been tested under same cyclic conditions. More details on the preparation and fatigue experiments can be found in References [2,5].
These same authors collected data on the fatigue ratio, σe/σu, for a large number of pure materials with different crystal structures and concluded that the ratios of BCC materials were consistently higher than for FCC and HCP (hexagonal close-packed) materials [3]. Table 1 lists fatigue ratios for a number of materials in the various crystal systems. The comparisons are most meaningful for pure metals in which the effects of alloying, aging, etc., are absent.
According to Grosskreutz [5], there is certainly evidence that the crystal structure plays a contributory role in determining the fatigue limit under constant stress amplitude loading. Besides the importance of the crystal structure, the aforementioned differences could be explained in terms of dislocation movement through the crystal. A question that can be posed is why should this influence exist. Since the reasons have not been proven, some general statements can be made. First, coherent slip leading to well-defined bands is not as likely in BCC structures simply because there are so many available slip systems, usually 24 compared to 12 in FCC structures and 3 to 6 in HCP materials, depending on the material (titanium is a special case, with 12 possible slip systems). Therefore, slip is well dispersed in BCC metals and slip band cracking is not as easily achieved. Furthermore, slip activity at a crack tip in BCC metals is not “exhausted” easily by hardening. Therefore, energy is consumed that might otherwise be available for crack extension. This capability to keep well-dispersed dislocation mobility, also in the case of extended fatigue cycling, is seemingly the most significant characteristic of the BCC system with respect to fatigue resistance. A second, assumingly related and equally relevant, reason for the superior performance of the BCC-based systems under fatigue conditions is the larger stress required to move dislocations. This stress is called the critical resolved shear stress (CRSS) and may be 100 times as large in BCC as in FCC structures. The yield stress of BCC metals is correspondingly higher, too. This fact, together with the work hardening rates, which are higher in BCC-based systems, affects the fatigue limit. Namely, BCC metals possess higher fatigue limits than FCC metals, placing them for that reason closer to the ultimate strength.
Accordingly, the effects of crystal structure and the CRSS provide an interesting investigation site, which could eventually provide clues on effective prediction of materials that are more fatigue resistant. Materials Science and numerical methods are promising in combination that possesses capabilities to shed light on this not sufficiently resolved research topic. The aim of this paper is to provide relevant information on the CRSS and to numerically investigate its importance in the fatigue performance of steels and other metals with different crystallographic structures.
2. Materials and Methods
2.1. Compression Testing of Small Pillars
A major interest in present-day Materials Science is to understand material deformation and failure mechanisms that are present in a vast number of applications and at different scales (predominantly at micro- and nanoscales). A method based on a new type of compression testing of pillars of the order of nano- and micrometer size has been developed and thereby opened a novel perspective on the investigation and measurement of the CRSS value for various materials. The method is becoming increasingly popular due to its cost-efficient and relatively simple procedure and the ability to analyze deformation mechanisms and material properties by focusing attention on a restricted material volume isolated from single crystals (see Figure 2). The experimental technique used to isolate these small-sized pillars is Focused Ion Beam (FIB) machining. Furthermore, the method of pillar compression testing enables the investigation of specific areas on the surface of a polycrystalline material, and thereby deeper insight into the underlying dislocation mechanisms that eventually contribute to the plastic flow resistance [6].
The pioneering research in the field of pillar testing published by Uchic et al. [7] in 2004 showed the example of cylindrical Ni micropillars, which at that time was an entirely new behavioral regime. Namely, the investigated pillar exhibited low hardening rates and discrete strain bursts (see Figure 3 for the two effects), and a power-law relationship between CRSS and pillar diameter, or the so-called size effect (see Figure 4e) [8]. It has been noted that the CRSS values of both FCC and BCC pillars decrease as the pillar size increases, conforming with inverse power-law scaling [7,9,10]. A large amount of publications [7,8,9,10,11,12,13,14,15,16,17,18,19,20,21,22,23,24,25,26,27,28,29,30,31,32,33,34,35,36] regarding small-scale plasticity are available today.
Figure 2a,b show an example of a pillar cut within the austenitic grain (austenitic stainless steel 316L), done by Monnet and Pouchon [11]. After compression, the deformation markings visible as slip traces on the surface of investigated cylindrical single-crystalline pillars indicate single slip mechanism, as Figure 2c depicts. Figure 3 gives resolved shear stress vs. strain curves (deduced from the force vs. displacement curves by using Schmid factors) of the pillars considered in the study. The strain bursts that emerge as flat regions have been observed as in the study of Uchic et al. The first strain burst has been understood to be a product of the first motion of a dislocation while the succeeding strain bursts represent collective movement of dislocations in an avalanche-like manner [11,12,13,14]. The small-scale yield (shear) stress, i.e., CRSS, for pillars is determined as the stress at which the first strain burst occurs [10].
A significant discrepancy in the value of the CRSS measured for the 5 µm pillars, 160 MPa (Figure 3a), is to be noted with respect to the larger 15 µm pillar, where the CRSS is equal to 110 MPa (Figure 3b). This confirms that the size effect is also present in 316L steel. Another observation that is in analogy to the general findings from the pillar compression testing are the fluctuations of the CRSS that decrease as the pillar size increases (see Figure 3) [11].
Okamoto et al. [15] investigated the behavior of high-enthalpy alloy (HEA) CrMnFeCoNi-based pillars (see Figure 4) under similar compression tests. Figure 4b,c show cases where these researchers applied two different loading-axis orientations ([26] and [23], Figure 4a) in order to obtain stress-strain curves of micropillars. Values of the CRSS are calculated by using the small-scale yield stress magnitudes and the Schmid factors that correspond to the two investigated orientations (0.488 and 0.467 for [26] and [23], respectively) and are given in Figure 4e versus micropillar size. It follows from Figure 4e that the CRSS values for the two considered orientations match to each other over the whole range of investigated micropillar sizes. This undoubtedly indicates that the CRSS value for slip on (111)[101] are independent of crystal orientation. This has been used by the authors [15] to combine the data points from the two tests into one master curve, shown in Figure 4e by the red dashed line. Similar to what has been recognized in single crystallline micropillars of many other FCC and BCC metals [7,9,12,16,17,18], the size effect has been also observed for the CrMnFeCoNi HEA.
2.2. Size Effect or A Power-Law Relationship between CRSS and Pillar Diameter
A size effect, invoked in previous section, is known to affect two features of plastic deformation: (i) the CRSS becomes stochastic and increases with decreasing pillar dimension; (ii) the hardening rate decreases strongly in pillars of micron scale. However, concerning the CRSS, several studies have shown that the size effect vanishes beyond a given pillar size Db. In pure nickel, Db was found being close to 20 µm by Uchic et al. [7] and 30 µm by Dimiduk et al. [19]. In gold, the size effect seems to decrease strongly in pillars of sizes larger than 7 µm [20]. However, in heterogeneous materials, such as Ni-base superalloys, the effect on the CRSS persists even in large pillars [7,11,21]. However, as concluded by various researches [7,8,14,15,17,19,20,22,23], this decrease in CRSS continues until the micropillar size reaches a value of 20 to 30 μm, at which the estimated CRSS may be further taken, for e.g., finite element method (FEM)-based simulations, as the representative value of bulk. In other words, by extrapolating the micropillar data obeying the inverse power-law scaling to the critical pillar size, the bulk CRSS values can be estimated. Accordingly, the bulk CRSS value for the HEA is estimated to between 33 and 43 MPa (Figure 4e), what fits the range of determined values for pure FCC metals (e.g., ~14 MPa for Al [8]).
The increased strength with reduced size follows a power law that explains the general relationship:
where τc is the CRSS, D is the top-surface diameter of a cylindrical pillar sample, K is the power-law coefficient and n is the power-law exponent, i.e., the power-law slope [6].
Despite being a matter of major discussions, it is generally agreed that the size effect is a consequence of the dislocation nucleation-governed plasticity, which is apparent from the higher stresses that arise during mechanical deformation of small-sized nanopillars. The explanation of the dislocation nucleation-governed plasticity can be found in its dependency on dislocation storage ability of FCC and BCC systems. Namely, dislocations moving inside the small-sized pillars are attracted to the free surface, and in order to sustain further deformation, new dislocations have to nucleate either inside the pillars or at their surface. This phenomenon especially concerns the strained FCC pillars deep in the sub-micron region where they experience the so-called “hardening by dislocation starvation”. In such cases, the pillars remain without dislocations, which vanish from the free surface at faster rates than they multiply inside the bulk [8,20,24]; and to nucleate new dislocations, higher stresses are required. According to experiments on FCC and BCC pillars [18,25,26,27], the more pronounced size effect in FCC materials, with respect to BCC materials, is related to the lattice resistance to plastic flow (see Section 1). A dislocation-starved condition is unlikely in the BCC system as a longer residence time is attributed to its dislocations, together with the ability to multiply new dislocations before the existing ones exit the pillar surface [27]. On contrary, the longer residence time of dislocations in BCC systems might be an explanation for their higher strength at higher scales, what is also in accordance to the statement from Section 1 about higher values of the CRSS in the BCC systems and their superiority in fatigue performance with respect to the FCC systems.
2.3. Strengthening Mechanisms
Strengthening mechanisms in single-crystals, such as dislocation density (as explained in Section 2.2 in relation to the dislocation residence time) and solute atoms, directly influence the deformation behavior in pillars, and thus the CRSS magnitude. An important strengthening source in industrial materials is the solid solution strengthening, or the alloy friction, that results from solute alloying elements, especially from substitutional elements, within the matrix. Furthermore, a significant content of added elements usually induces formation of precipitates within the matrix of the host material, leading to another strengthening mechanism known as precipitation strengthening. In some industrial materials, like annealed 316L-type austenitic stainless steel, no precipitation is observed, leaving the solid solution strengthening as the prevailing source to the strengthening process [11].
The resistance for the dislocation to move through the crystal, or the CRSS (τc), is dictated by the present strengthening mechanisms in the crystal [6]. To recall, the CRSS for compressive failure may have several components: The Peierls-Nabarro stress τ0, the dislocation hardening τdh, the solid solution hardening τssh, and the strengthening induced by precipitates τph. Irrespective if all or just particular strengthening components are present, the linear superposition may be applied when calculating the CRSS (τc) [11]:
In the case of high purity materials, with zero dislocation density and with no added alloying elements, the CRSS comprises merely of the Peierls-Nabarro stress τ0, which is the minimum requirement for initial dislocation motion [28].
Furthermore, the global yield stress Re comprises of the CRSS and further strengthening mechanisms that are present in bulk metals, namely the grain boundary hardening τgbh and the phase boundary hardening τpbh. Equation (3) summarize all the mechanisms that contribute to the strength of metallic materials.
An example of strengthening can be given with iron; The shear strength of large single-crystal samples, in mm size, can go below 10 MPa [6,29,30] at room temperature in the case of high purity iron. Previous studies on iron with different impurity contents [6,31] confirm the importance of interstitial solute atoms in the strengthening of crystals. In general, increased amounts of impurity elements lead to an increased shear strength in the crystal due to more resulting obstacles that hinder the gliding of dislocations. Based on these results, it was estimated that the strengthening contribution of C and O is about 40 MPa; which is significantly higher than the 10 MPa for the high purity single-crystal iron. The strengthening from solute atoms and impurities is the same in different-sized pillars; and it should not be partially responsible for the size effect that has been discussed in Section 2.2 [6].
An interesting study was done by Guo et al. [32] on the measurement of the CRSS for phases in a multiphase material. In this work, coupled with electron backscatter diffraction (EBSD) technique, micropillar compression was used to evaluate the CRSS of ferrite, which is BCC, and FCC austenite in a cast duplex stainless steel (Z3CN20-09M). Compression tests were carried out by compressing free-standing micropillars of ~5 μm diameter that were fabricated by FIB. The results reveal that BCC ferrite has a much higher strength than FCC austenite; while austenite possesses better ductility than ferrite. The CRSS values are, quantified to be ~194 MPa and ~318 MPa for austenite and ferrite, respectively. Strengthening mechanisms can be regarded as responsible for the higher strength of ferrite. Firstly, solid solution strengthening is introduced by the higher alloying content of substitutional chromium in ferrite (26.74 wt.%) than in austenite (21.11 wt.%) [37]. Although austenite contains a higher nickel content than ferrite, i.e., 9.14 wt.% in austenite compared to 5.18 wt.% in ferrite, it was reported that the solid solution strengthening caused by chromium is greater than that of nickel [38]. Secondly, as already stated in Section 2.2, the low mobility of screw dislocations in BCC crystals usually results in higher strengthening as well as a higher strain hardening rate through dislocation-dislocation interactions or kinetic pileups of the screw dislocation in the area close to the dislocation sources, which in turn leads to an enhanced strength of ferrite phase [25,26,32].
Quantification of the strengthening components is a challenging task but is also necessary for the understanding and eventual modelling of the mechanical behavior of metals. For BCC and FCC materials, the slip event is usually activated in unique crystal systems when the applied stress is higher than their CRSS, which is associated with the intragranular crystal plasticity [32]. Therefore, it is of great importance to be able to determine the CRSS of a phase or more different phases in metallic materials to understand the mechanical behavior of their bulks and to further establish appropriate material and damage models (e.g., Crystal Plasticity and/or Tanaka-Mura (TM) equation/model) for simulation studies.
2.4. Numerical Estimation of Fatigue Behavior with the Help of CRSS
Structural integrity monitoring and characterization of existing damage are of high importance for the service life assessment. An important aspect of the fatigue process is the failure of structures that can occur at load levels accompanied with stresses in the critical regions that are below the material yield stress. This raises the importance of being able to predict the life of these structures before the catastrophic fracture occurs. However, in many cases structures can tolerate cracks up to a certain length, meaning that not every crack is detrimental immediately after its formation. In order to estimate the moment when the crack reaches unstable growth, it is essential to ensure methods being able to describe and quantify the crack growth precisely.
In order to numerically analyse the total fatigue life of structures, i.e., structural components or a specimen, from the moment when the first micro-crack nucleates within a grain up to the moment when the dominant crack evolves into a critical one leading to final failure, a proper multiscale simulation approach is required. Figure 5 shows a scheme of scales that need to be considered, starting with the nanoscale, going up to micro-/mesoscales and ending up with the macroscale. The up-to-date nanoscale, i.e., atomistic, simulation techniques like ab-initio [39,40,41] or Molecular Dynamics (MD) [42,43,44] can provide the relevant material parameters needed at higher length scales of fatigue modelling and simulation scheme. One such parameter is the CRSS on the most active slip plane in a grain, that can be derived from MD simulations, e.g., by using the approach of Hummel et al. [45,46]. Other methods for the derivation of the CRSS are micro-pillar tests, as discussed in previous sections. The CRSS can be used as the input parameter for the micromechanics-based model providing information on the number of loading cycles to nucleate a micro-crack and subsequent growth of a short crack inside the microstructure of the investigated material; or in other words, comprising both the number of cycles to initiate the short crack (TM model [47,48]). These initiation cycles are further transferred to the macroscale fatigue crack growth model based on power law equations (e.g., Paris law), which are finally used to estimate the total fatigue life, up to final fracture. By using the presented modelling workflow, the fatigue of metals can be simulated more or less independently of the experimental input [45,46,49,50,51,52].
A dislocation model of a double pileup proposed by Tanaka and Mura in 1981 [47,48] is frequently used for fatigue crack initiation analysis (see Figure 5) to determine when a grain, subjected to an outer cyclic loading, will develop a slip band and subsequently a crack [54]. According to their theory of fatigue crack nucleation, the forward and reverse plastic flows within slip bands under cyclic loading are caused by edge dislocations with different signs gliding on two adjacent crystallographic planes. It is assumed that their mobility is irreversible. As reported by the founders of this model, the monotonic build-up of dislocations evolves from the theory of dislocations in a systematic manner. One of the parameters of the model, equation (4), is the CRSS on a slip plane. As stated in previous sections, the CRSS is a threshold value of the shear stress along the glide direction that a dislocation needs to surpass in order to start moving. If the resolved shear stress is lower than the CRSS, no dislocation is moving on the glide plane and, consequently, no pile takes place at the grain boundary.
As mentioned above, the number of cycles Ns needed for micro-crack nucleation within a single grain can be derived by means of the physically-based TM equation [47,48]:
According to TM, micro-cracks form along slip band segments, depending on segmental length ds, the average shear stress range on the segment Δτs, the shear modulus G, the crack initiation energy Wc, the Poisson’s ratio ν, and the CRSS [49,52,55,56].
A more extended and detailed description of the implementation of the TM equation into FEM-based modelling and simulation of the crack initiation process has been reported in publications of the authors of this study [45,46,49,50,51,52] and by other researchers, too [55,56,57,58]. Some details about mesh, boundary and loading conditions are also given in Section 3.
A well-known and often used method for the quantification of the long crack growth is the Paris law [59], which gives the fatigue crack growth rate, FCGR or da/dN, in relation to the stress intensity factor, ΔK (= Kmax − Kmin), at the crack tip during the stable crack growth. Despite being standard, this well-accepted and proven method is applied in many cases for the characterization of long crack growth. Long crack modelling is used extensively in the fatigue related research and is accordingly well documented and well understood.
The multiscale approach for fatigue simulation, consisting of the CRSS determination, crack initiation simulation based on the TM equation and long crack growth simulation based on Fracture Mechanics, has been previously reported in References [45,46,51,52]. The methodology forms the basis of the presented research work, which has been conducted with the aim to determine numerically the complete S-N curve of considered materials.
3. Results
In order to approach the question of fatigue strength in a proper way, it is necessary to consider the effects of crystal structure on fatigue mechanisms. The purpose of this section is to present the derivation of the CRSS parameter for materials of interest by using different methods of determination (micro-pillar tests and MD simulations) and its implementation in numerical analyses of fatigue initiation life, based on the TM model. During the numerical estimation of the fatigue life curves of materials with different magnitudes of the CRSS, an attention has been paid to their crystal structures, too. It has long been known that ferrous materials (BCC) typically show a sharp “knee” (fatigue limit) in the S-N diagram at about 106 cycles, while most other metals (FCC) exhibit a gradual flattening between 107–108 cycles.
Besides the importance of the crystal structure, an assumption that the reason for superior fatigue behavior of BCC metals in general is the higher stress needed to move dislocations, i.e., the CRSS, through their system. Therefore, it is of high interest to analyze numerically the fatigue life curves of materials with different CRSS values, but also by having their crystal structures in view. For this purpose, four materials are selected and are tabulated in Table 2. Besides of the AISI 1141 steel with BCC crystal structure that has been analyzed in [52], three additional materials taken into account are FCC austenitic stainless steel AISI 304, high purity iron (Fe 99.9%) that is BCC and high purity aluminum (Al 1050) with an FCC structure. Their life curves are determined by analyzing the initiation of a short crack and subsequent growth of the long crack separately. Micro-models containing microstructures of the materials are set up by using the FEM and are applied in combination with the Tanaka-Mura equation in order to estimate the number of cycles needed for crack initiation. The long crack growth quantification is accomplished by using the Paris law.
Values of the CRSS from Table 2 are estimated by using methods presented in Section 2. Namely, the CRSS of 160 MPa for AISI 304 steel is taken from the micro-pillar tests (MPT) performed by Monnet and Pouchon [11]. The 117 MPa high CRSS is taken from the study of Hummel et al. [45,46] performed by using the MD method. This value has been applied for AISI 1141 steel in the numerical determination of fatigue life curves. To quantify the size-strengthening effect and to determine the CRSS of 99.9% pure iron, the experimental data from Reference [6] were plotted and extrapolated, as introduced in Reference [15] (see Figure 4e), as a function of pillar diameter in the double logarithmic plot in Figure 6. The CRSS is estimated to be 35–45 MPa for this material by applying the aforementioned methodology, explained in Section 2 in detail. Another example is given in Figure 6 where the data for high purity aluminum from [8] were plotted and extrapolated as a function of pillar diameter. Here the values of CRSS are estimated to be 11–16 MPa. A third example found in literature is for copper [17] with an estimated CRSS of 19–25 MPa. The data for copper are given for comparison reasons, but have not been considered in the numerical study. It is worth noting the observation that the power-law slopes of all three investigated metals (BCC iron and FCC aluminum and copper) are in the same range, namely −0.618 for pure iron, −0.602 for copper and −0.625 for aluminum. Furthermore, the slope of a BCC HEA from the study of Okamoto et al. [15] is given as −0.63.
A notched specimen from the experimental study of Fatemi et al. [60] has been analysed in this work by using the presented multiscale approach for fatigue life prediction (see Section 2.4). Figure 7b contains the three-dimensional (3D) model of the specimen, in a stressed state. The model represents a half of the specimen due to applied symmetry boundary conditions. The FEM-based software ABAQUS has been used to create and analyse the numerical model of the specimen. The model is meshed with 25 752 linear hexahedral elements of type C3D8R, from the ABAQUS element library [53]. Concerning the relevant dimensions, the considered specimen is 141.73 mm high (y-axis), 63.50 mm wide (x-axis), 2.54 mm thick (z-axis) with the notch radius of 9.128 mm. All other details about the specimen are provided in Reference [60]. The spot at the notch visualized by the help of a red square in Figure 7b becomes critical after putting the specimen in cyclic loading. The specimen fractured, starting from that site, in experiments from Fatemi et al. [60] under stress-controlled cyclic conditions with the loading ratio R = 0, i.e., under fully tensional cyclic loading. The ranges of applied stress amplitudes vary from material to material and are given in Figure 7. Furthermore, this global model serves to provide boundary conditions (in this case displacements) to the microstructural submodel (Figure 8a), which is located at the notch ground of the global model and is used for the crack initiation analysis.
Numerical models of the 3D global model and of the 3D deformable shell submodel, which have been analyzed in this study for different materials are shown in Figure 8. In this case, the resulting stresses are given for the models that have material properties of the vanadium-based microalloyed forging steel AISI 1141, and that are loaded with stress amplitude of 256 MPa. Other applied stress amplitudes for this and all other investigated materials are given in Figure 7. Figure 8a shows shear stresses in a 3D deformable shell submodel, where loading is accomplished by applying the displacements from the 3D global model to the boundary edges (upper, right and bottom) of the submodel. This specific submodel contains 249 grains and is meshed with 154 708 linear quadrilateral elements of type M3D4R; meaning that each grain contains approximately 621 elements. The microstructures of the investigated materials (Table 3), i.e., their grains, are created by using a Voronoi tessellation technique. The average sizes of grains are given in Table 3. The micro-crack modelling within the microstructural models of these materials has been accomplished by using the TM model, i.e., the model-based criterion that says that the average shear stress on a slip band segment needs to be two times higher than the CRSS of the specific material (Δτs > 2CRSS). The average shear stresses in the microstructural model (see Figure 8a) are an input from the FEM-based analysis. The slip band segment that fulfills the criterion and which, next to that, needs the lowest number of cycles to nucleate the crack according to the TM model gets cracked. The microstructural model is remeshed after introducing a newly nucleated crack and the process is repeated until the moment when there are no more segments favorable for cracking. The TM model-based micro-crack modelling considers just the transgranular cracking. Intergranular cracks along the grain boundaries occur in rare situations and only if two already nucleated transgranular cracks are located near the same grain boundary. In such cases, the yield stress is the cracking criterion and no cycles are prescribed to the event.
Figure 8b gives the global model of the notched tensile specimen (half). The same model has been applied for the long crack modelling and simulation by using the Stress Intensity Factors-based Paris Law [59]. The details on this well-established and well-known approach can be found in a previous publication of the authors [52] on the example of AISI 1141. Due to the relative simplicity and general presence of this long crack modelling and simulation approach in the fatigue community, further details are not repeated in this paper.
Table 3 contains other simulation-relevant material properties; namely the Young’s modulus E, the shear modulus G, the Poisson’s ratio υ, the three elastic constants C11, C12 and C44, the crack initiation energy Wc, and the average grain size d for all materials considered in this study. The length of slip band segment ds, which is the input to the TM equation, is calculated from the grain size d (ds = d/4) [49,52,55,56]. The constitutive laws of the materials are purely linear elastic, defined by using orthotropic elasticity [53], i.e., the three elastic constants.
Figure 9 shows an example of damaged microstructural model of Fe 99.9% after the analysis has been performed. The model contains visible micro-cracks, which have been introduced by applying the TM equation for the crack nucleation to the FEM-based analysis. A damaged state in the figure represents the end of the crack initiation stage, under a 75 MPa loading stress amplitude.
The method for the estimation of the moment when the crack initiation Nini has been accomplished is well-documented in previous publications of the authors of this study [51,52]. An example has been given in Figure 10 where the fatigue crack growth rate da/dN estimated for the damaged model from Figure 9 has been plotted in relation to the number of nucleated micro-cracks, i.e., number of broken crack segments. The da/dN can be easily derived by dividing the length, da, of each individual micro-crack that has been nucleated within microstructure and its accompanying nucleation lifetime, dN.
Namely, it has been observed in the present as well as in previous studies [49,50,51,52] that the rate drops down and stabilizes after certain time. Interestingly, Newman et al. in [61] reported a similar declining behaviour during the short crack growth. In such cases, the short crack most likely exits the initiation and enters the long crack growth stage. This appearance, when crack growth enters the regime characterized by significantly low rates (see Figure 10a), is used within the multiscale fatigue simulation to determine cycles related to the crack initiation process. The methodology of initiation estimation can be facilitated in many cases by plotting the averaged da/dN (Figure 10b), where every point is averaged with two preceding and two following neighbouring points. The average rate is smoother than the original one and allows easier detection of the drop. The number of cycles for the initiation is estimated by summing all the cycles spent for nucleation of individual segmental cracks that occurred in the microstructural model until the observed rate drop. When combined together, the initiation and the succeeding fracture mechanics-based long crack growth (see References [51,52,55,56] for more details) allow estimation of the complete fatigue life. The combined results are typically given as the finite life region (slope region) of the S-N diagram.
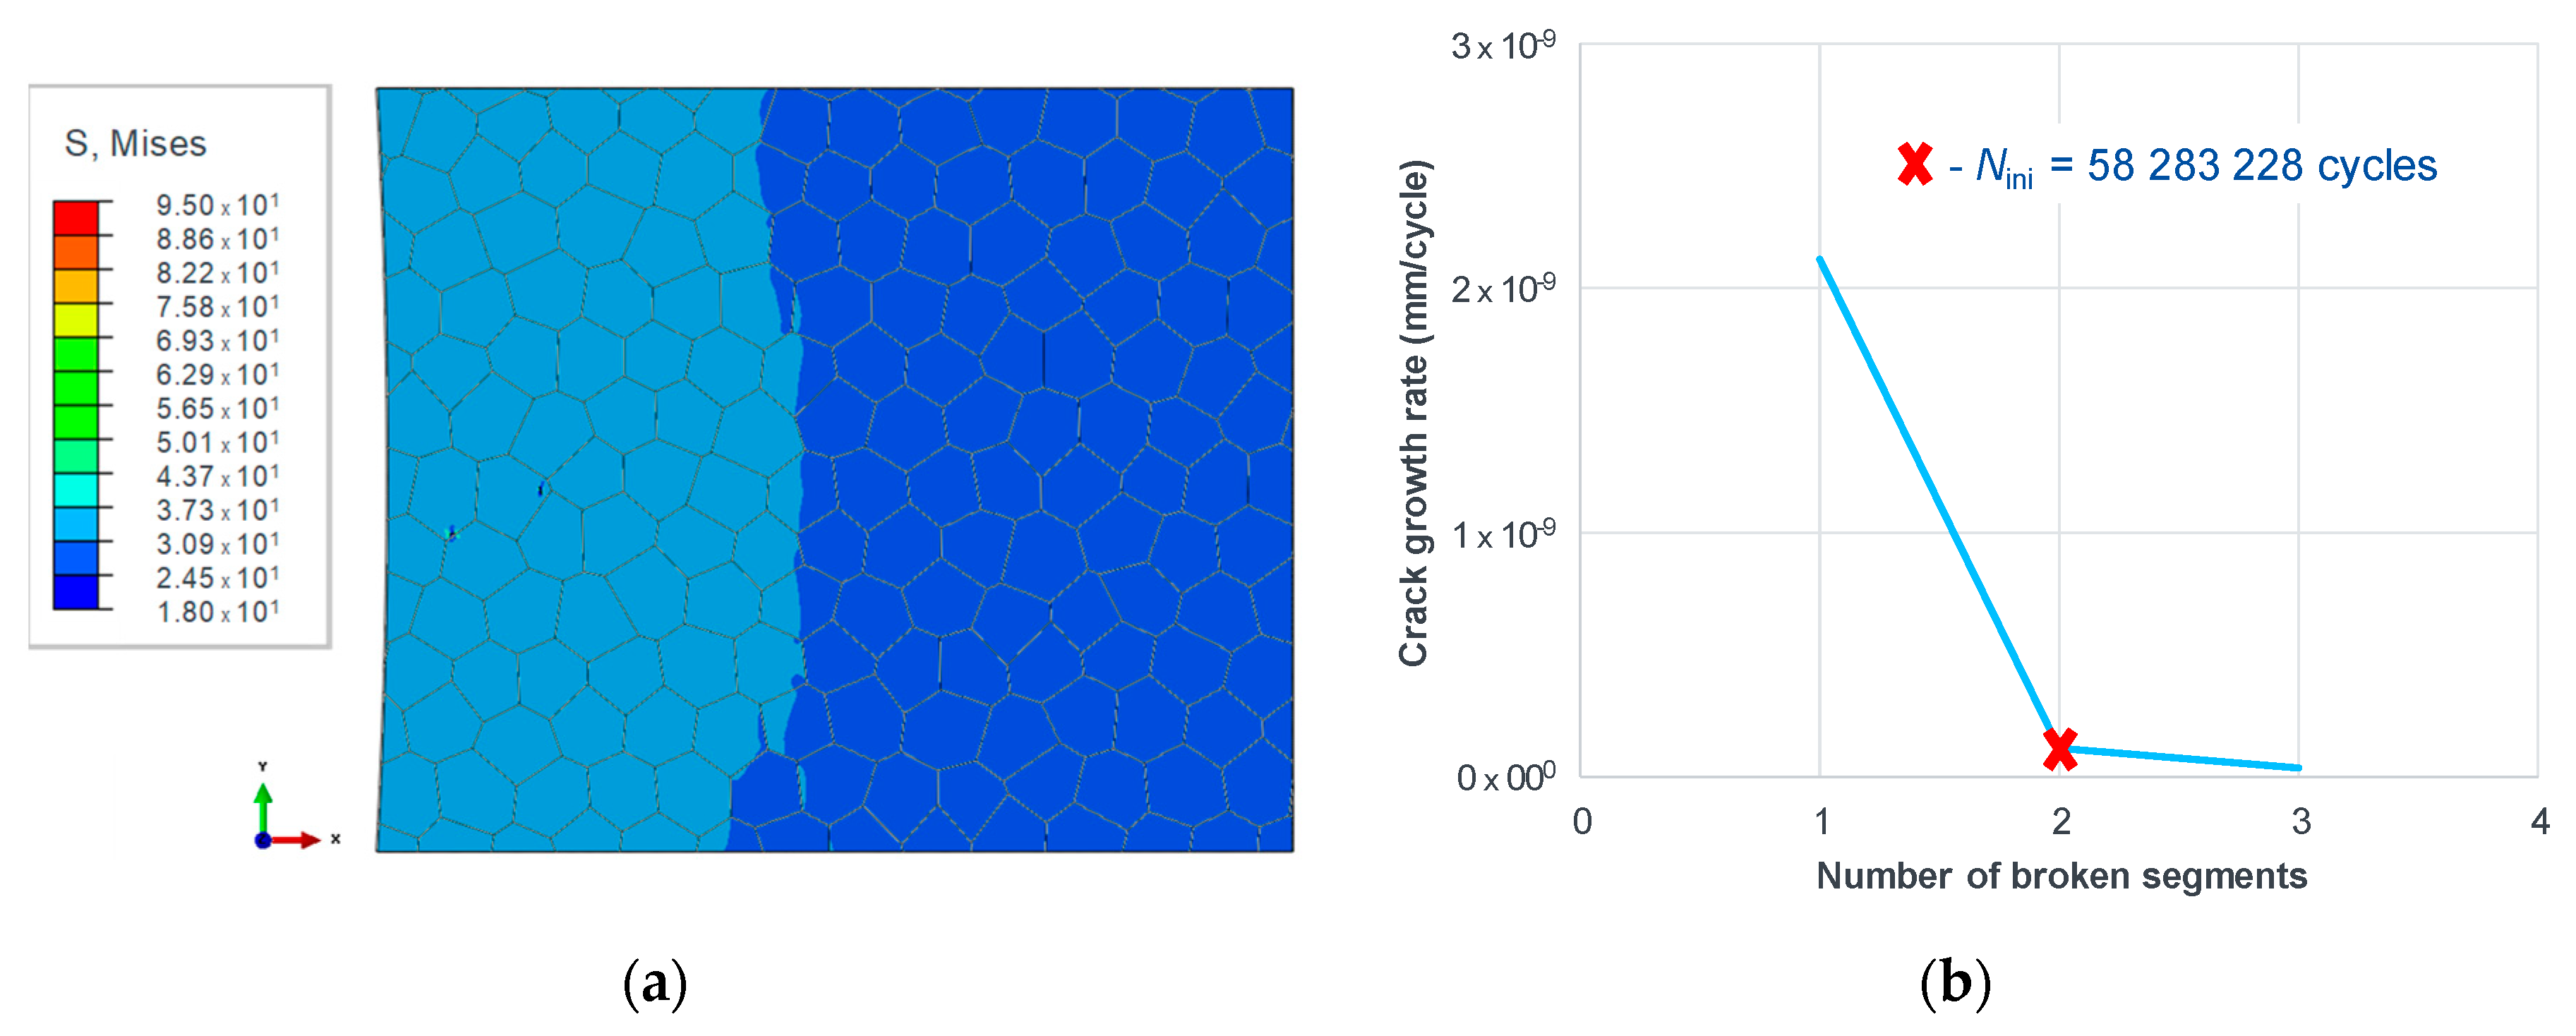
With the decrease of the loading stress amplitude, the finite life region comprises more and more of just the crack initiation stage and eventually transforms into an infinite life region, as reported by Mughrabi [62]. The aforementioned knee in the diagram, which also represents the fatigue endurance limit, can be typically recognized as the transition point between definite life (slope in the typical S-N curve) and infinite life (below the fatigue limit). Thus, the fatigue limit can be determined by solely calculating the initiation number of cycles as the transition of a short crack into the long crack does not take place in the fatigue limit region [62]. Accordingly, the loading amplitude can be decreased incrementally in the microstructurally-based crack initiation modelling approach, until the point where just few or no cracks appear inside the microstructural model and where extreme cycles are reached for those few nucleated cracks. An example is given for 1050A in Figure 11 where extreme cycles as well as relatively low crack growth rates have been reached for only two nucleated cracks in the microstructural model. Such situations of the short crack retardation are considered as run-outs in the simulation analysis. Figure 7 comprises results for fatigue life curves of all considered materials in this study. Points in Figure 7 are average values of results from two different microstructures analyzed per material.
4. Discussion and Conclusions
As reported by several researchers, the CRSS may be up to 100 times as large in BCC steels as in metals with FCC crystal structures. However, after a detailed survey, it has been observed that there are certain FCC steels (e.g., austenitic stainless steel AISI 304) which have an unusually high CRSS. Besides of that, BCC metals typically show the “knee” and, on the other hand, certain FCC metals with a low CRSS show no sharp “knee” in the S-N diagram. Fatigue life curves in Figure 7 illustrate the existence of definite fatigue limits in both the BCC (AISI 1141) and the FCC steels (AISI 304). According to the numerical observations, the magnitude of the CRSS is directly responsible for the occurrence or absence of the definite fatigue limit. From the microstructurally- and TM equation-based modelling point of view and from the resulting fatigue life curves in Figure 7, the following explanations for this recognition are listed:
- The transition from infinite life (below the fatigue limit) to definite life (slope in the typical S-N curve) happens when a sufficient number of micro-cracks in the material microstructure (typically >10) have reached a condition for cracking. The cracking condition according to the TM equation says that the absolute magnitude of average shear stress on a grain slip band has to be higher than two times the CRSS.
- The higher the CRSS magnitude of the metal of interest, the higher the loading stress amplitude needed to accomplish the transition from the infinite to definite life, as shown in Figure 7. In other words, the higher the CRSS magnitude, the higher the accompanying fatigue endurance limit. Despite having different crystal structures, FCC austenitic stainless steel AISI 304 and BBC vanadium-based micro-alloyed forging steel AISI 1141 have relatively high CRSS values (160 MPa and 117 MPa, respectively) and as a result fatigue limits at considerably high positions in the S-N diagram, Figure 7.
- In the case of very high CRSS values, the stresses within the microstructural model are at a relatively high level at the moment of transition from infinite life to definite life, resulting in a high number of grains that are favorable for cracking. The higher the number of cracking favorable grains after the transition from infinite life to definite life, the steeper the slope of the finite life region in the S-N diagram.
- The study showed that the crystallographic structure is not the predominant factor that determines the shape and position of a fatigue life curve in the S-N diagram, but it is rather the CRSS magnitude. Namely, the higher the CRSS of a certain material, the higher the curve position is in the diagram, and the more pronounced the transition between the definite and the indefinite life region. Despite being an FCC material, the austenitic stainless steel AISI 304 showed an untypically high fatigue limit (208 MPa), which is higher than the fatigue limit of the BCC vanadium-based micro-alloyed forging steel AISI 1141 (152 MPa). The remaining two investigated FCC metals, the pure iron (Fe 99.9%) and the high purity aluminum (Al 99.5%) possess, according to this numerical study, relatively low fatigue limits, i.e., 44 and 19 MPa, respectively.
- The numerical study provided good agreement of the fatigue limits of the investigated materials with the experimentally determined fatigue limits. This observation refers firstly to AISI 1141 steel whose numerical fatigue limit of 152 MPa [52] is almost perfectly matching the experimental one, which is 155 MPa [60]. The value determined numerically for AISI 304 is fitting the span of experimental values that can be found in literature, too [63,64,65]. A relatively good agreement, however with a slight overestimation, has been achieved for aluminum 1050A (18 MPa vs. 10-14 MPa [66]). Reliable experimental data for Fe 99.9% could not be found. These results are summarized in Table 4 and depicted in Figure 7.
To conclude, the analysis yields a fundamental understanding of the difference between the shapes of the fatigue life curves for steels and other metals with different crystal structures and the importance of the material parameter CRSS. The effects of crystal structure and the CRSS provide a facet of fatigue theory that is numerically predictive and which allows us to select those types of materials, which are more likely to be fatigue resistant.
Author Contributions
Conceptualization, both authors; Methodology, M.M.; Validation, M.M.; Formal Analysis, M.M.; Investigation, M.M.; Data Curation, M.M.; Writing-Original Draft Preparation, M.M.; Writing-Review & Editing, both authors; Visualization, M.M.; Supervision, S.S.
Funding
This research received no external funding.
Acknowledgments
M.M. and S.S. wish to acknowledge gratefully the permission of respected journals and authors to use their data and graphics.
Conflicts of Interest
The authors declare no conflict of interest.
References
- Budynas, R.G.; Nisbett, J.K. Fatigue failure resulting from variable loading. In Shigley’s Mechanical Engineering Design, 10th ed.; McGraw-Hill Education: New York, NY, USA, 2015; pp. 273–349. ISBN 978-0-07-339820-4. [Google Scholar]
- Ferro, A.; Montalenti, G. On the effect of the crystalline structure on the form of fatigue curves. Philos. Mag. 1964, 10, 1043. [Google Scholar] [CrossRef]
- Ferro, A.; Mazzetti, P.; Montalenti, G. On the effect of the crystalline structure on fatigue: Comparison between body-centred metals (Ta, Nb, Mo and W) and face-centred and hexagonal metals. Philos. Mag. J. Theor. Exp. Appl. Phys. 1965, 12, 867–875. [Google Scholar] [CrossRef]
- Buck, A. Fatigue properties of pure metals. Int. J. Fract. Mech. 1967, 3, 145–152. [Google Scholar] [CrossRef]
- Grosskreutz, J.C. Fatigue mechanisms in the sub-creep range. ASTM 1971, 495, 5–60. [Google Scholar] [CrossRef]
- Rogne, B.; Thaulow, C. Strengthening mechanisms of iron micropillars. Philos. Mag. 2015, 95, 1814–1828. [Google Scholar] [CrossRef]
- Uchic, M.D.; Dimiduk, D.M.; Florando, J.N.; Nix, W.D. Sample dimensions influence strength and crystal plasticity. Science 2004, 305, 986–989. [Google Scholar] [CrossRef] [PubMed]
- Kunz, A.; Pathak, S.; Greer, J.R. Size effects in Al nanopillars: Single crystalline vs. bicrystalline. Acta Mater. 2011, 59, 4416–4424. [Google Scholar] [CrossRef]
- Greer, J.R.; Hosson, J.T.D. Plasticity in small-sized metallic systems: Intrinsic versus extrinsic size effect. Prog. Mater. Sci. 2011, 56, 654–724. [Google Scholar] [CrossRef]
- Chen, Z.M.; Okamoto, N.L.; Demura, M.; Inui, H. Micropillar compression deformation of single crystals of Co3(Al,W) with the L12 structure. Scr. Mater. 2016, 121, 28–31. [Google Scholar] [CrossRef]
- Monnet, G.; Pouchon, M.A. Determination of the critical resolved shear stress and the friction stress in austenitic stainless steels by compression of pillars extracted from single grains. Mater. Lett. 2013, 98, 128–130. [Google Scholar] [CrossRef]
- Dimiduk, D.M.; Woodward, C.; LeSar, R.; Uchic, M.D. Scale-free intermittent flow in crystal plasticity. Science 2006, 312, 1188–1190. [Google Scholar] [CrossRef] [PubMed]
- Csikor, F.F.; Motz, C.; Weygand, D.; Zaiser, M.; Zapperi, S. Dislocation Avalanches, Strain Bursts, and the Problem of Plastic Forming at the Micrometer Scale. Science 2007, 318, 251–254. [Google Scholar] [CrossRef] [PubMed]
- Okamoto, N.L.; Kashioka, D.; Inomoto, M.; Inui, H.; Takebayashi, H.; Yamaguchi, S. Compression deformability of gamma- and zeta-Fe-Zn intermetallics to mitigate detachment of brittle intermetallic coating of galvannealed steels. Scr. Mater. 2013, 69, 307–310. [Google Scholar] [CrossRef] [Green Version]
- Okamoto, N.L.; Fujimoto, S.; Kambara, Y.; Kawamura, M.; Chen, Z.M.T.; Matsunoshita, H.; Tanaka, K.; Inui, H.; George, E.P. Size effect, critical resolved shear stress, stacking fault energy, and solid solution strengthening in the CrMnFeCoNi high-entropy alloy. Sci. Rep. 2016, 6, 35863. [Google Scholar] [CrossRef] [PubMed] [Green Version]
- Kiener, D.; Motz, C.; Schöberl, T.; Jenko, M.; Dehm, G. Determination of mechanical properties of copper at the micron scale. Adv. Eng. Mater. 2006, 8, 1119–1125. [Google Scholar] [CrossRef]
- Jennings, A.T.; Burek, M.J.; Greer, J.R. Microstructure versus Size: Mechanical properties of electroplated single crystalline Cu nanopillars. Phys. Rev. Lett. 2010, 104, 135503. [Google Scholar] [CrossRef] [PubMed]
- Schneider, A.S.; Kaufmann, D.; Clark, B.G.; Frick, C.P.; Gruber, P.A.; Mönig, R.; Kraft, O.; Arzt, E. Correlation between critical temperature and strength of small-scale bcc pillars. Phys. Rev. Lett. 2009, 103, 105501. [Google Scholar] [CrossRef] [PubMed]
- Dimiduk, D.; Uchic, M.; Parthasarathy, T. Size-affected single-slip behavior of pure nickel microcrystals. Acta Mater. 2005, 53, 4065–4077. [Google Scholar] [CrossRef]
- Greer, J.R.; Oliver, W.C.; Nix, W.D. Size dependence of mechanical properties of gold at the micron scale in the absence of strain gradients. Acta Mater. 2005, 53, 1821–1830. [Google Scholar] [CrossRef]
- Shade, P.; Uchic, M.; Dimiduk, D.; Viswanathan, G.; Wheeler, R.; Fraser, H. Size-affected single-slip behavior of Rene N5 microcrystals. Mater. Sci. Eng. A 2012, 535, 53–61. [Google Scholar] [CrossRef]
- Okamoto, N.L.; Kashioka, D.; Hirato, T.; Inui, H. Specimen- and grain-size dependence of compression deformation behavior in nanocrystalline copper. Int. J. Plast. 2014, 56, 173–183. [Google Scholar] [CrossRef] [Green Version]
- Okamoto, N.L.; Inomoto, M.; Adachi, H.; Takebayashi, H.; Inui, H. Micropillar compression deformation of single crystals of the intermetallic compound zeta-FeZn13. Acta Mater. 2014, 65, 229–239. [Google Scholar] [CrossRef]
- Zheng, H.; Cao, A.; Weinberger, C.R.; Huang, J.Y.; Du, K.; Wang, J.; Ma, Y.; Xia, Y.; Mao, S.X. Discrete plasticity in sub-10-nm-sized gold crystals. Nat. Commun. 2010, 1, 144. [Google Scholar] [CrossRef] [PubMed] [Green Version]
- Greer, J.R.; Weinberger, C.R.; Cai, W. Comparing the strength of f.c.c. and b.c.c. sub-micrometer pillars: Compression experiments and dislocation dynamics simulations. Mater. Sci. Eng. A 2008, 493, 21–25. [Google Scholar] [CrossRef] [Green Version]
- Schneider, A.; Clark, B.; Frick, C.; Gruber, P.; Arzt, E. Effect of orientation and loading rate on compression behavior of small-scale Mo pillars. Mater. Sci. Eng. A 2009, 508, 241–246. [Google Scholar] [CrossRef]
- Hagen, A.; Thaulow, C. Low temperature in-situ micro-compression testing of iron pillars. Mater. Sci. Eng. A 2016, 678, 355–364. [Google Scholar] [CrossRef]
- Bruesewitz, C.; Knorr, I.; Hofsaess, H.; Barsoum, M.W.; Volkert, C.A. Single crystal pillar microcompression tests of the MAX phases Ti2InC and Ti4AlN3. Scr. Mater. 2013, 69, 303–306. [Google Scholar] [CrossRef]
- Feller-Kniepmeier, M.; Hundt, M. Deformation properties of high purity alpha-Fe single crystals. Scr. Metall. 1983, 17, 905–908. [Google Scholar] [CrossRef]
- Stein, D.; Low, J.; Seybolt, A. The mechanical properties of iron single crystals containing less than 5 × 10⁻³ ppm carbon. Acta Metall. 1963, 11, 1253–1262. [Google Scholar] [CrossRef]
- Stein, D.F.; Low, J.R. Effects of orientation and carbon on the mechanical properties of iron single crystals. Acta Metall. 1966, 14, 1183–1194. [Google Scholar] [CrossRef]
- Guo, E.-Y.; Xie, H.-X.; Singh, S.S.; Kirubanandham, A.; Jing, T.; Chawla, N. Mechanical characterization of microconstituents in a cast duplex stainless steel by micropillar compression. Mater. Sci. Eng. A 2014, 598, 98–105. [Google Scholar] [CrossRef]
- Cruzado, A.; Gan, B.; Jimenez, M.; Barba, D.; Ostolaza, K.; Linaza, A.; Molina-Aldareguia, J.; Llorca, J.; Segurado, J. Multiscale modeling of the mechanical behavior of IN718 superalloy based on micropillar compression and computational homogenization. Acta Mater. 2015, 98, 242–253. [Google Scholar] [CrossRef]
- Jin, H.-H.; Ko, E.; Kwon, J.; Hwang, S.S.; Shin, C. Evaluation of critical resolved shear strength and deformation mode in proton-irradiated austenitic stainless steel using micro-compression tests. J. Nucl. Mater. 2016, 470, 155–163. [Google Scholar] [CrossRef]
- Wu, J.; Tsai, W.; Huang, J.; Hsieh, C.; Huang, G.-R. Sample size and orientation effects of single crystal aluminum. Mater. Sci. Eng. A 2016, 662, 296–302. [Google Scholar] [CrossRef]
- Palomares-Garcia, A.J.; Perez-Prado, M.T.; Molina-Aldareguia, J.M. Effect of lamellar orientation on the strength and operating deformation mechanisms of fully lamellar TiAl alloys determined by micropillar compression. Acta Mater. 2017, 123, 102–114. [Google Scholar] [CrossRef]
- Campos, M.; Bautista, A.; Caceres, D.; Abenojar, J.; Torralba, J. Study of the interfaces between austenite and ferrite grains in P/M duplex stainless steels. J. Eur. Ceram. Soc. 2003, 23, 2813–2819. [Google Scholar] [CrossRef]
- Ramazani, A.; Mukherjee, K.; Prahl, U.; Bleck, W. Modelling the effect of microstructural banding on the flow curve behaviour of dual-phase (DP) steels. Comput. Mater. Sci. 2012, 52, 46–54. [Google Scholar] [CrossRef]
- Hocker, S.; Schmauder, S.; Bakulin, A.V.; Kulkova, S.E. Ab initio investigation of tensile strengths of metal(1 1 1)/alpha-Al2O3(0 0 0 1) interfaces. Philos. Mag. 2014, 94, 265–284. [Google Scholar] [CrossRef]
- Kulkova, S.E.; Bakulin, A.V.; Kulkov, S.S.; Hocker, S.; Schmauder, S. Influence of interstitial impurities on the Griffith work in Ti-based alloys. Phys. Scr. 2015, 90, 094010. [Google Scholar] [CrossRef]
- Bakulin, A.V.; Spiridonova, T.; Kulkova, S.E.; Hocker, S.; Schmauder, S. Hydrogen diffusion in doped and undoped alpha-Ti: An ab-initio investigation. Int. J. Hydrogen Energy 2016, 41, 9108–9116. [Google Scholar] [CrossRef]
- Kohler, C.; Kizler, P.; Schmauder, S. Atomistic simulation of precipitation hardening in alpha-iron: Influence of precipitate shape and chemical composition. Modell. Simul. Mater. Sci. Eng. 2005, 13, 35–45. [Google Scholar] [CrossRef]
- Prskalo, A.-P.; Schmauder, S.; Ziebert, C.; Ye, J.; Ulrich, S. Molecular dynamics simulations of the sputtering of SiC and Si3N4. Surf. Coat. Technol. 2010, 204, 2081–2084. [Google Scholar] [CrossRef]
- Prskalo, A.-P.; Schmauder, S.; Ziebert, C.; Ye, J.; Ulrich, S. Molecular dynamics simulations of the sputtering process of silicon and the homoepitaxial growth of a Si coating on silicon. Comput. Mater. Sci. 2011, 50, 1320–1325. [Google Scholar] [CrossRef]
- Bozic, Z.; Schmauder, S.; Mlikota, M.; Hummel, M. Multiscale fatigue crack growth modelling for welded stiffened panels. Fatigue Fract. Eng. Mater. Struct. 2014, 37, 1043–1054. [Google Scholar] [CrossRef] [Green Version]
- Bozic, Z.; Schmauder, S.; Mlikota, M.; Hummel, M. Multiscale fatigue crack growth modeling for welded stiffened panels. In Handbook of Mechanics of Materials; Schmauder, S., Chen, C.-S., Chawla, K.K., Chawla, N., Chen, W., Kagawa, Y., Eds.; Springer: Singapore, 2018; pp. 1–21. ISBN 978-981-10-6855-3. [Google Scholar]
- Tanaka, K.; Mura, T. A dislocation model for fatigue crack initiation. J. Appl. Mech. 1981, 48, 97–103. [Google Scholar] [CrossRef]
- Tanaka, K.; Mura, T. A theory of fatigue crack initiation at inclusions. Metall. Trans. A 1982, 13, 117–123. [Google Scholar] [CrossRef]
- Mlikota, M.; Staib, S.; Schmauder, S.; Bozic, Z. Numerical determination of Paris law constants for carbon steel using a two-scale model. J. Phys. Conf. Ser. 2017, 843, 012042. [Google Scholar] [CrossRef] [Green Version]
- Mlikota, M.; Schmauder, S.; Bozic, Z.; Hummel, M. Modelling of overload effects on fatigue crack initiation in case of carbon steel. Fatigue Fract. Eng. Mater. Struct. 2017, 40, 1182–1190. [Google Scholar] [CrossRef]
- Mlikota, M.; Schmauder, S. Numerical determination of component Woehler curve. DVM Bericht 2017, 1684, 111–124. [Google Scholar]
- Mlikota, M.; Schmauder, S.; Bozic, Z. Calculation of the Woehler (S-N) curve using a two-scale model. Int. J. Fatigue 2018, 114, 289–297. [Google Scholar] [CrossRef]
- ABAQUS, version 2018 ed; Abaqus Documentation; Simulia: Providence, RI, USA, 2018.
- Socie, D.F. Fatigue damage simulation models for multiaxial loading. In Proceedings of the Sixth International Fatigue Congress (Fatigue ’96), Berlin, Germany, 6–10 May 1996; pp. 967–976. [Google Scholar]
- Glodez, S.; Jezernik, N.; Kramberger, J.; Lassen, T. Numerical modelling of fatigue crack initiation of martensitic steel. Adv. Eng. Softw. 2010, 41, 823–829. [Google Scholar] [CrossRef]
- Jezernik, N.; Kramberger, J.; Lassen, T.; Glodez, S. Numerical modelling of fatigue crack initiation and growth of martensitic steels. Fatigue Fract. Eng. Mater. Struct. 2010, 33, 714–723. [Google Scholar] [CrossRef]
- Huang, X.; Brueckner-Foit, A.; Besel, M.; Motoyashiki, Y. Simplified three-dimensional model for fatigue crack initiation. Eng. Fract. Mech. 2007, 74, 2981–2991. [Google Scholar] [CrossRef]
- Briffod, F.; Shiraiwa, T.; Enoki, M. Fatigue crack initiation simulation in pure iron polycrystalline aggregate. Mater. Trans. 2016, 57, 1741–1746. [Google Scholar] [CrossRef]
- Paris, P.; Erdogan, F. A critical analysis of crack propagation laws. J. Basic Eng. 1963, 85, 528–533. [Google Scholar] [CrossRef]
- Fatemi, A.; Zeng, Z.; Plaseied, A. Fatigue behavior and life predictions of notched specimens made of QT and forged microalloyed steels. Int. J. Fatigue 2004, 26, 663–672. [Google Scholar] [CrossRef]
- Newman, J.; Phillips, E.; Swain, M. Fatigue-life prediction methodology using small-crack theory. Int. J. Fatigue 1999, 21, 109–119. [Google Scholar] [CrossRef] [Green Version]
- Mughrabi, H. Microstructural mechanisms of Cyclic deformation, fatigue crack initiation and early crack growth. Philos. Trans. R. Soc. Lond. Ser. A 2015, 373. [Google Scholar] [CrossRef] [PubMed]
- Boyer, H. Atlas of Fatigue Curves, 1st ed.; American Society for Metals: Materials Park, OH, USA, 1985; ISBN 0871702142. [Google Scholar]
- Atzori, B.; Meneghetti, G.; Ricotta, M. Analysis of the fatigue strength under two load levels of a stainless steel based on energy dissipation. Fract. Struct. Integrity 2011, 17, 15–22. [Google Scholar] [CrossRef]
- Ben Fredj, N.; Ben Nasr, M.; Ben Rhouma, A.; Sidhom, H.; Braham, C. Fatigue life improvements of the AISI 304 stainless steel ground surfaces by wire brushing. J. Mater. Eng. Perform. 2004, 13, 564–574. [Google Scholar] [CrossRef]
- Sakin, R. Investigation of bending fatigue-life of aluminum sheets based on rolling direction. Alex. Eng. J. 2018, 57, 35–47. [Google Scholar] [CrossRef]
Figure 1.
Comparison of fatigue life curves of iron-rich, which are of the body-centered cubic (BCC) type, with nickel-rich alloys, which are face-centered cubic (FCC). Fatigue life curves illustrate the existence of definite fatigue limits in BCC materials, reproduced from [2,5], with permission from Taylor & Francis, 1964.

Figure 2.
Example of (a) 5 µm and (b) 15 µm pillars cut within large grains, and (c) deformed large pillar after compression testing, reproduced from [11], with permission from Elsevier, 2013.
Figure 2.
Example of (a) 5 µm and (b) 15 µm pillars cut within large grains, and (c) deformed large pillar after compression testing, reproduced from [11], with permission from Elsevier, 2013.
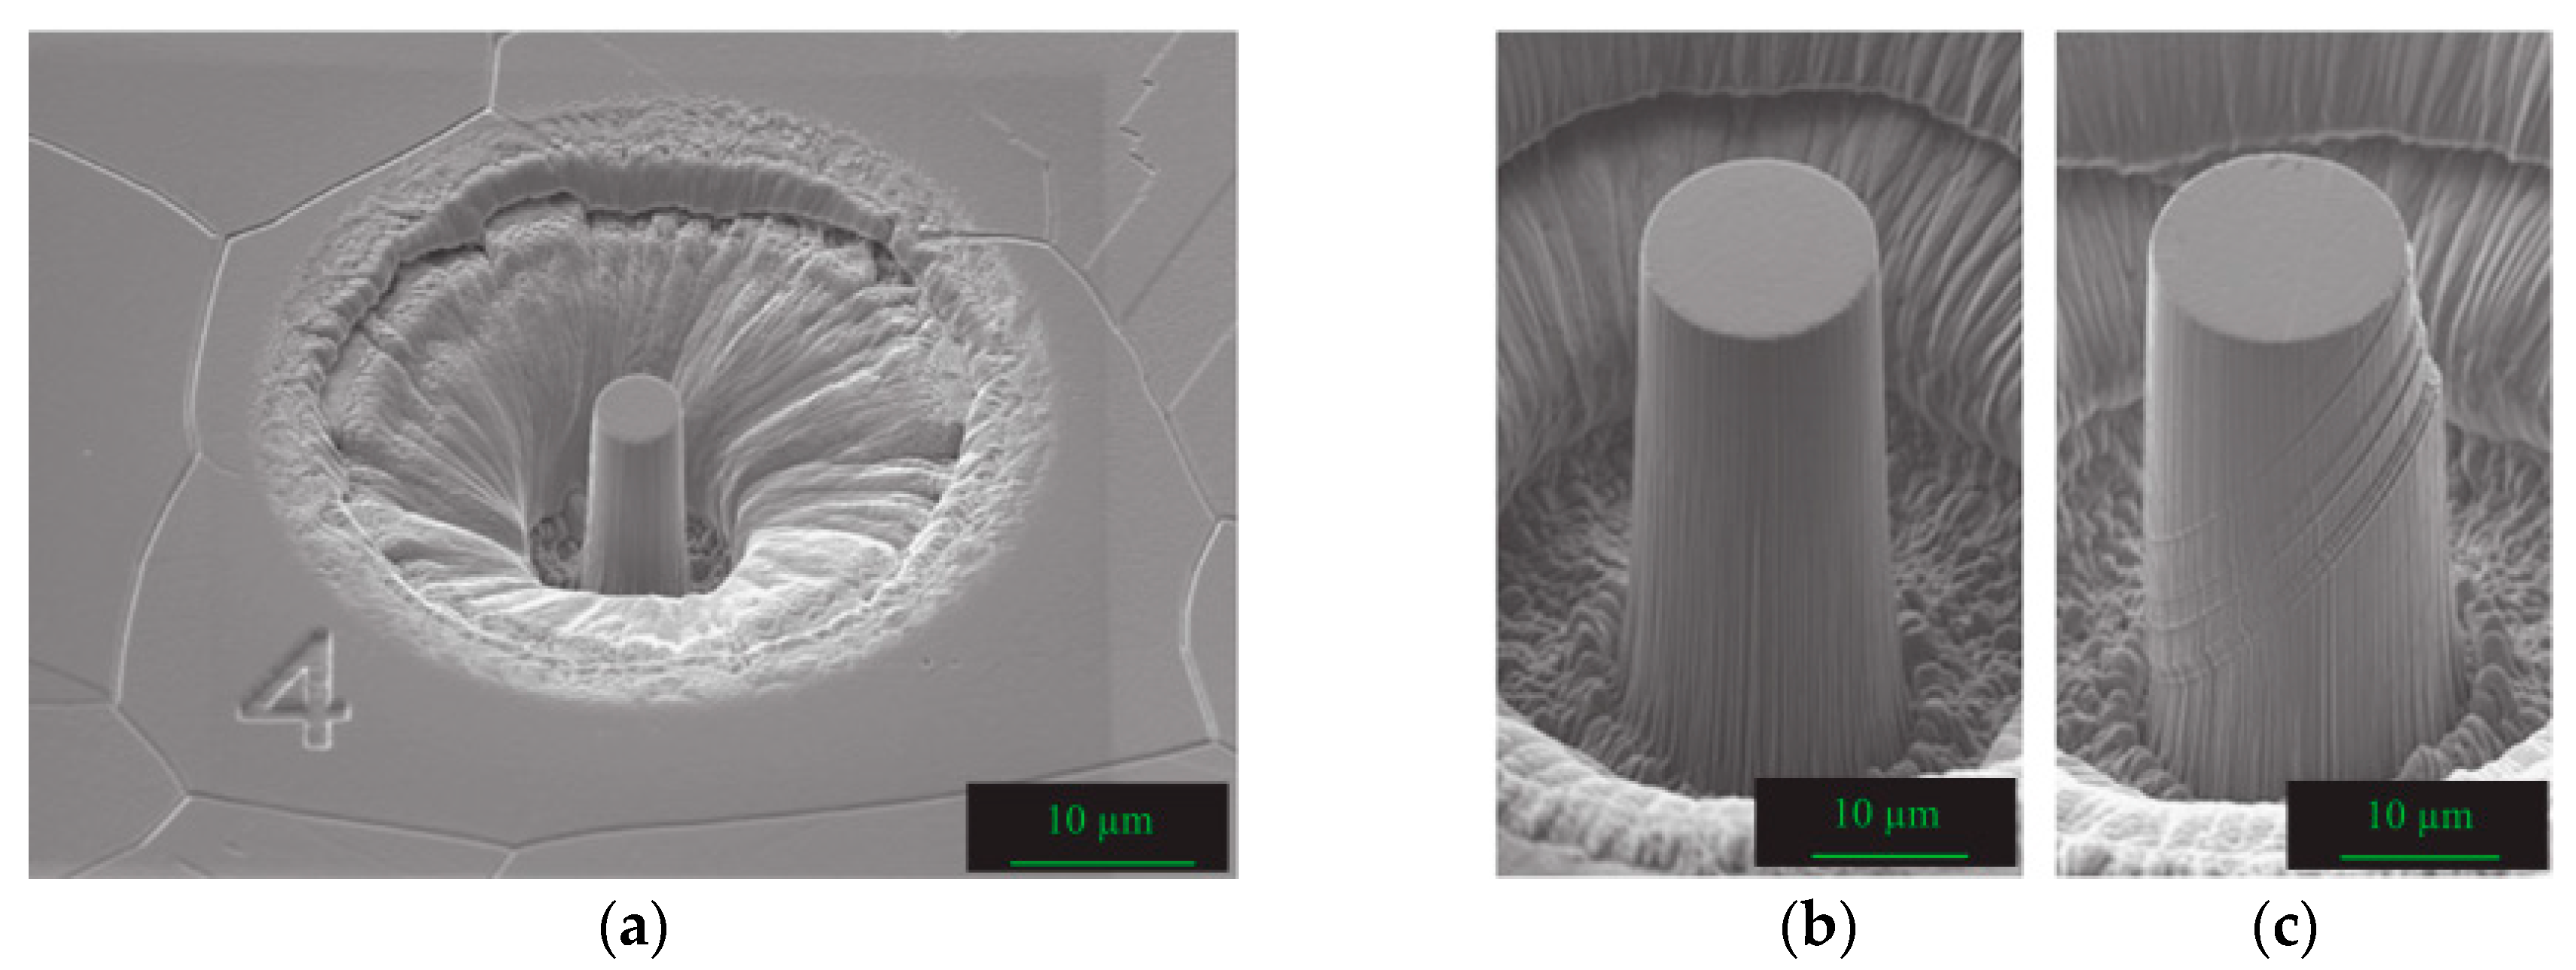
Figure 3.
Resolved shear-stress vs. strain curves of (a) 5 µm pillars and (b) 15 µm pillars, reproduced from [11], with permission from Elsevier, 2013.
Figure 3.
Resolved shear-stress vs. strain curves of (a) 5 µm pillars and (b) 15 µm pillars, reproduced from [11], with permission from Elsevier, 2013.

Figure 4.
Compression tests of single-crystalline micropillars of the equiatomic CrMnFeCoNi HEA. (b,c) Selected stress-strain curves of single-crystalline micropillars with loading-axis orientations of (b) [26], and (c) [23], respectively; (d) Secondary-electron image taken in a scanning electron microscope showing {111} slip traces on the side surfaces of a deformed micropillar with [23] orientation; (e) Size dependence of critical resolved shear stress (CRSS) for {111} <101> slip, reproduced from [15], with permission from the author, 2016.
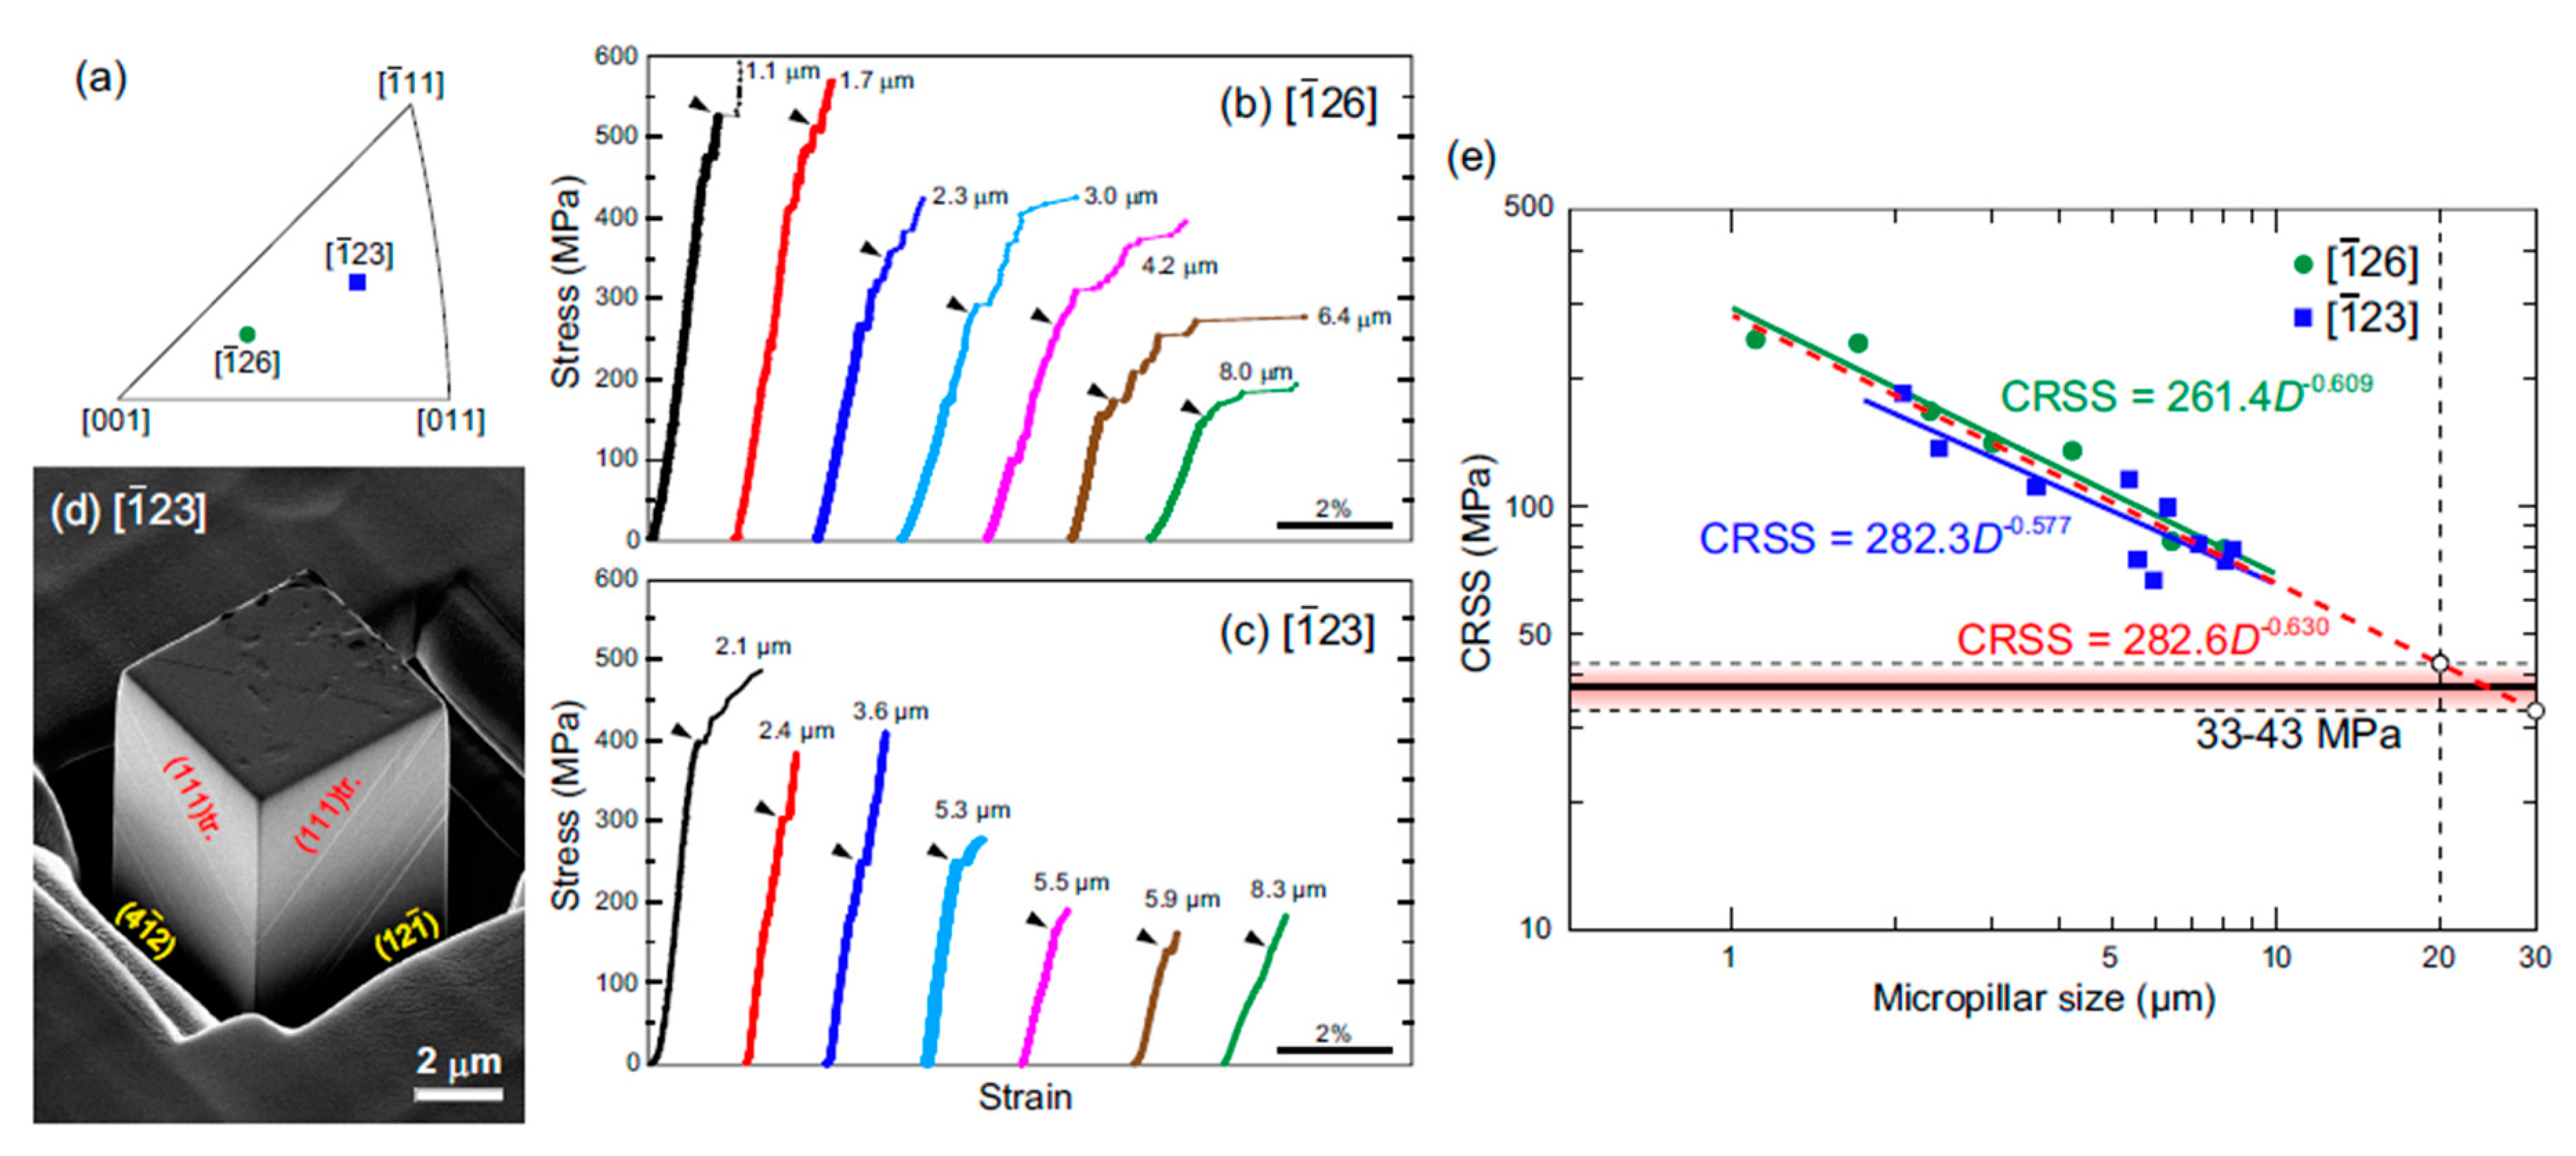
Figure 5.
Multiscale approach—Coupling of methodologies at the relevant scales, and accompanying outputs (O/P) (CRSS, da/dN—crack growth rate, Nini—number of stress cycles for crack initiation, Nprop—number of stress cycles for crack propagation), reproduced from [34,45,50,53], with permissions from Elsevier, 2016 and John Wiley and Sons, 2014, 2017.

Figure 6.
CRSS (critical resolved shear stress) of iron [6], copper [17] and aluminum [8], respectively, as a function of pillar diameter D. Plots of data for different materials show the power law relationship, i.e., the size effect, between pillar diameter and the CRSS, data from [6,8,17].
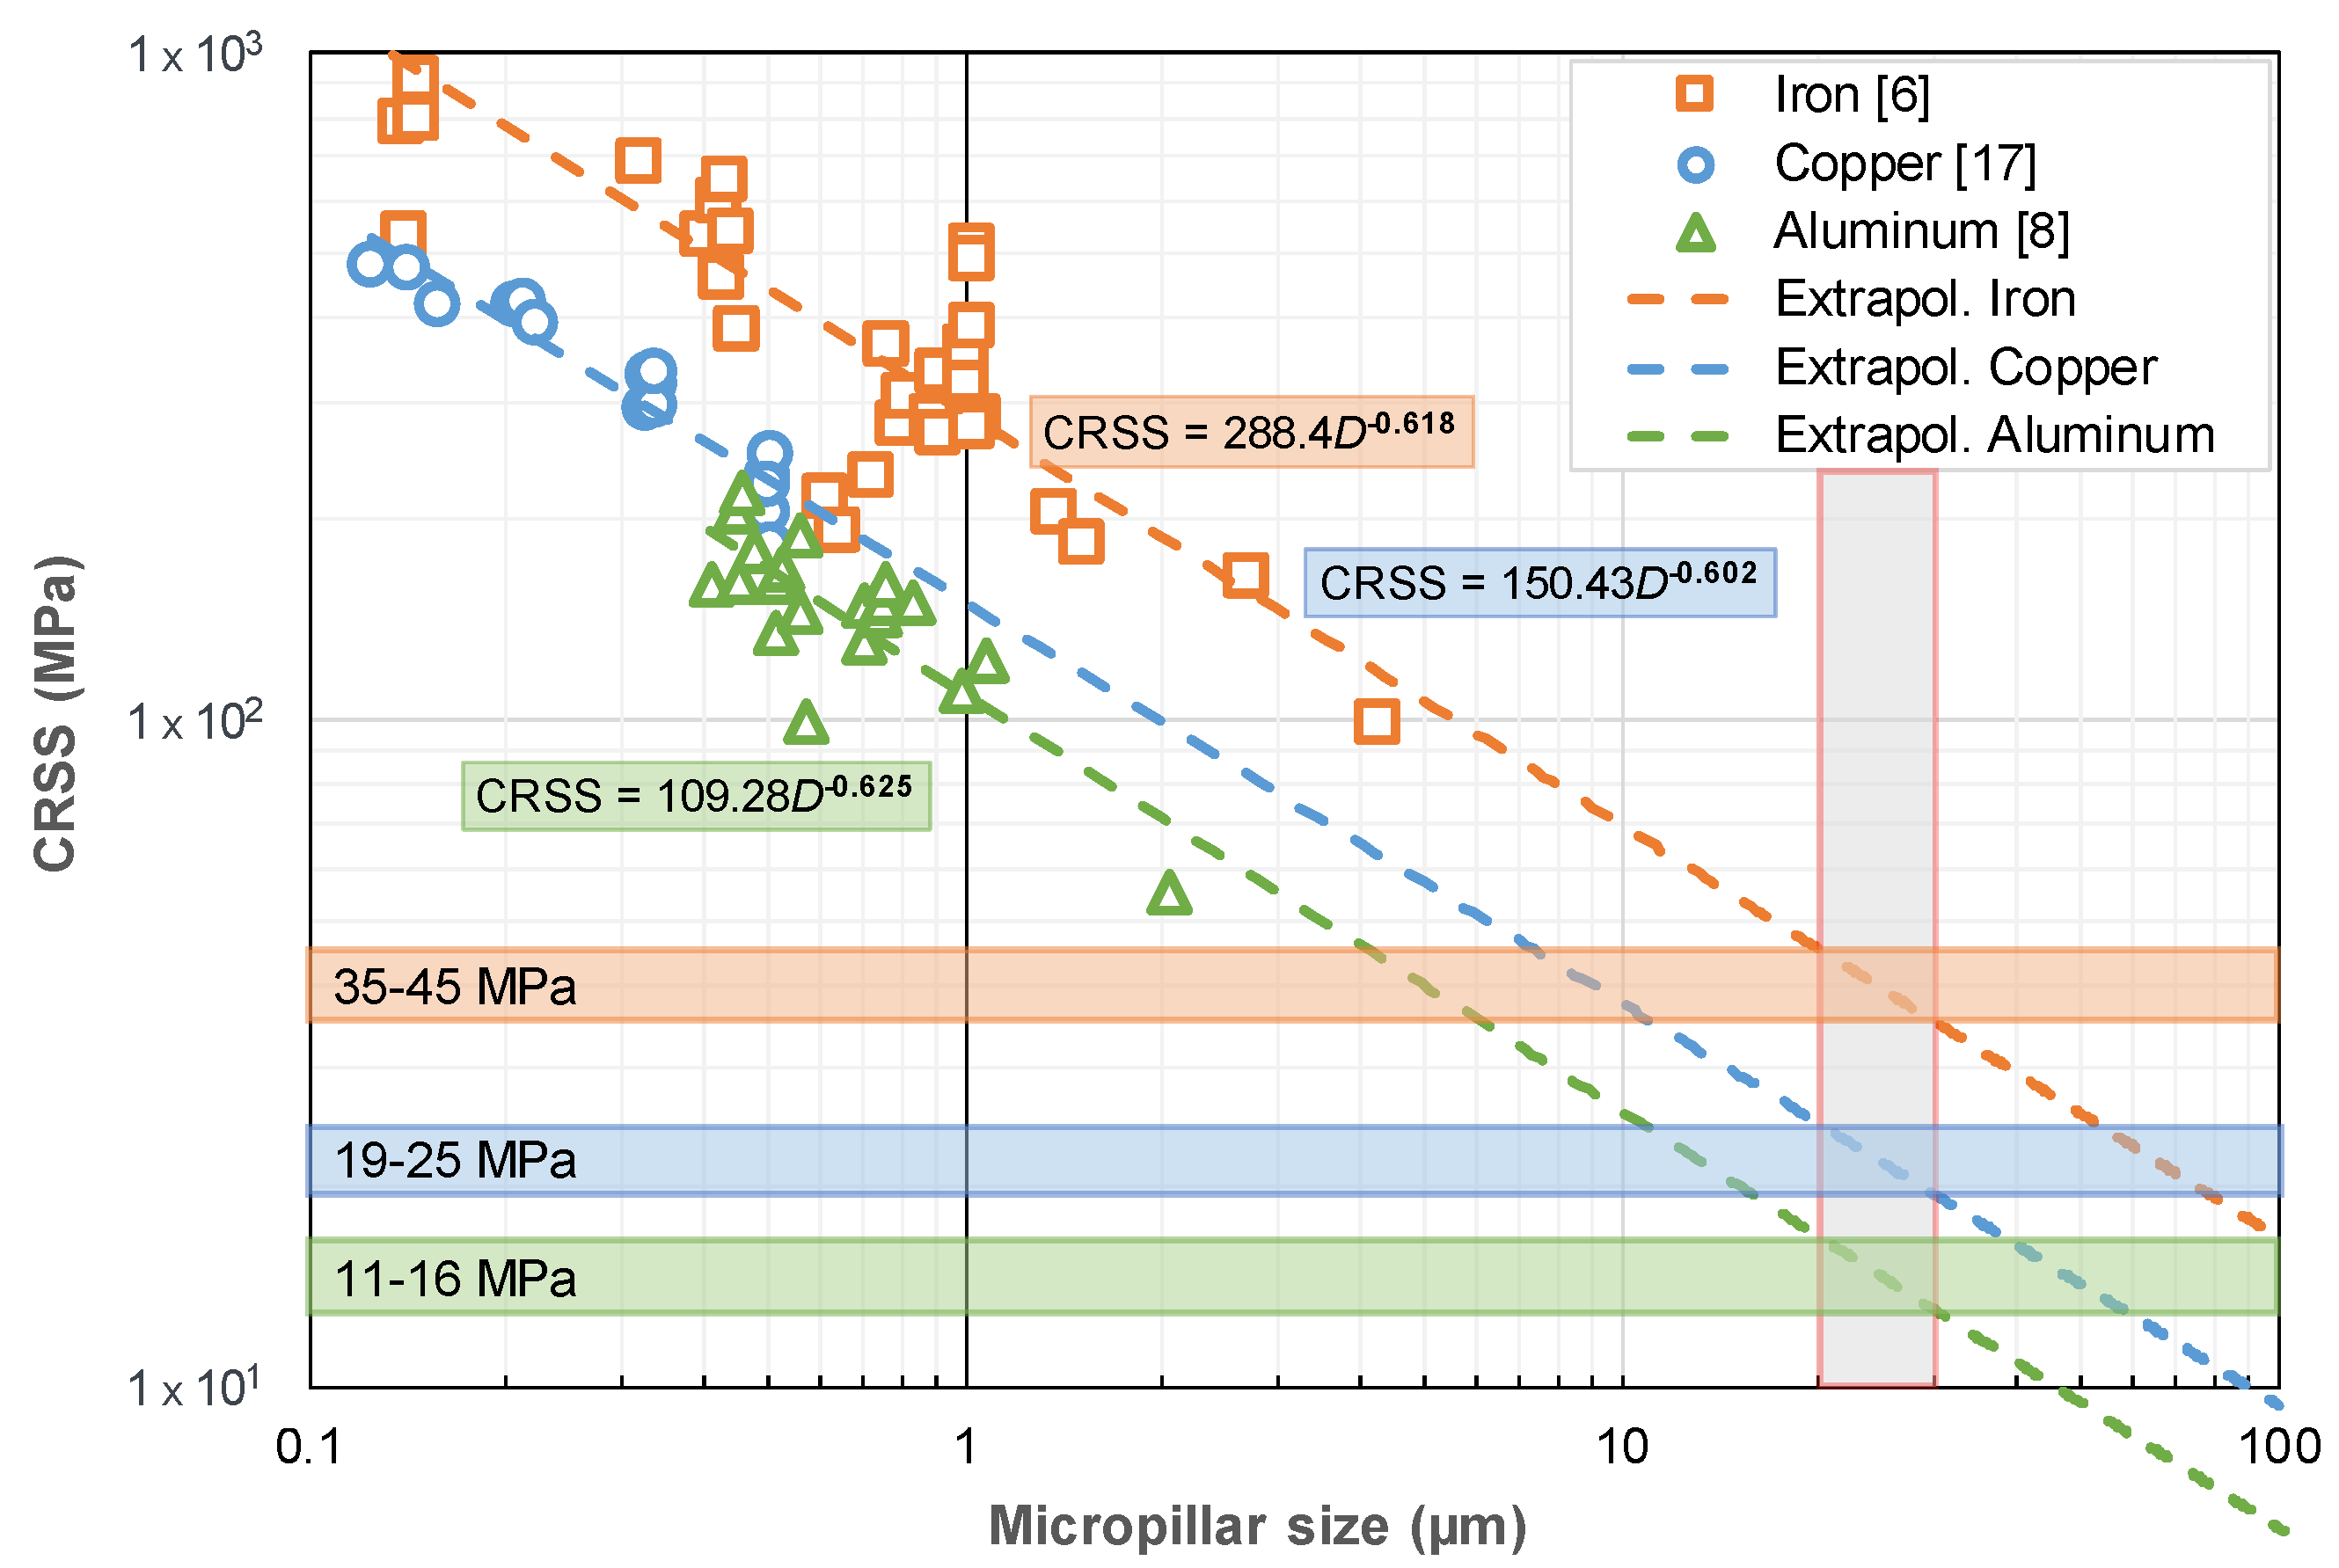
Figure 7.
Simulation-based fatigue life curves, which illustrate the existence of definite fatigue limits in BCC and FCC materials depending on the magnitudes of the CRSS.
Figure 7.
Simulation-based fatigue life curves, which illustrate the existence of definite fatigue limits in BCC and FCC materials depending on the magnitudes of the CRSS.
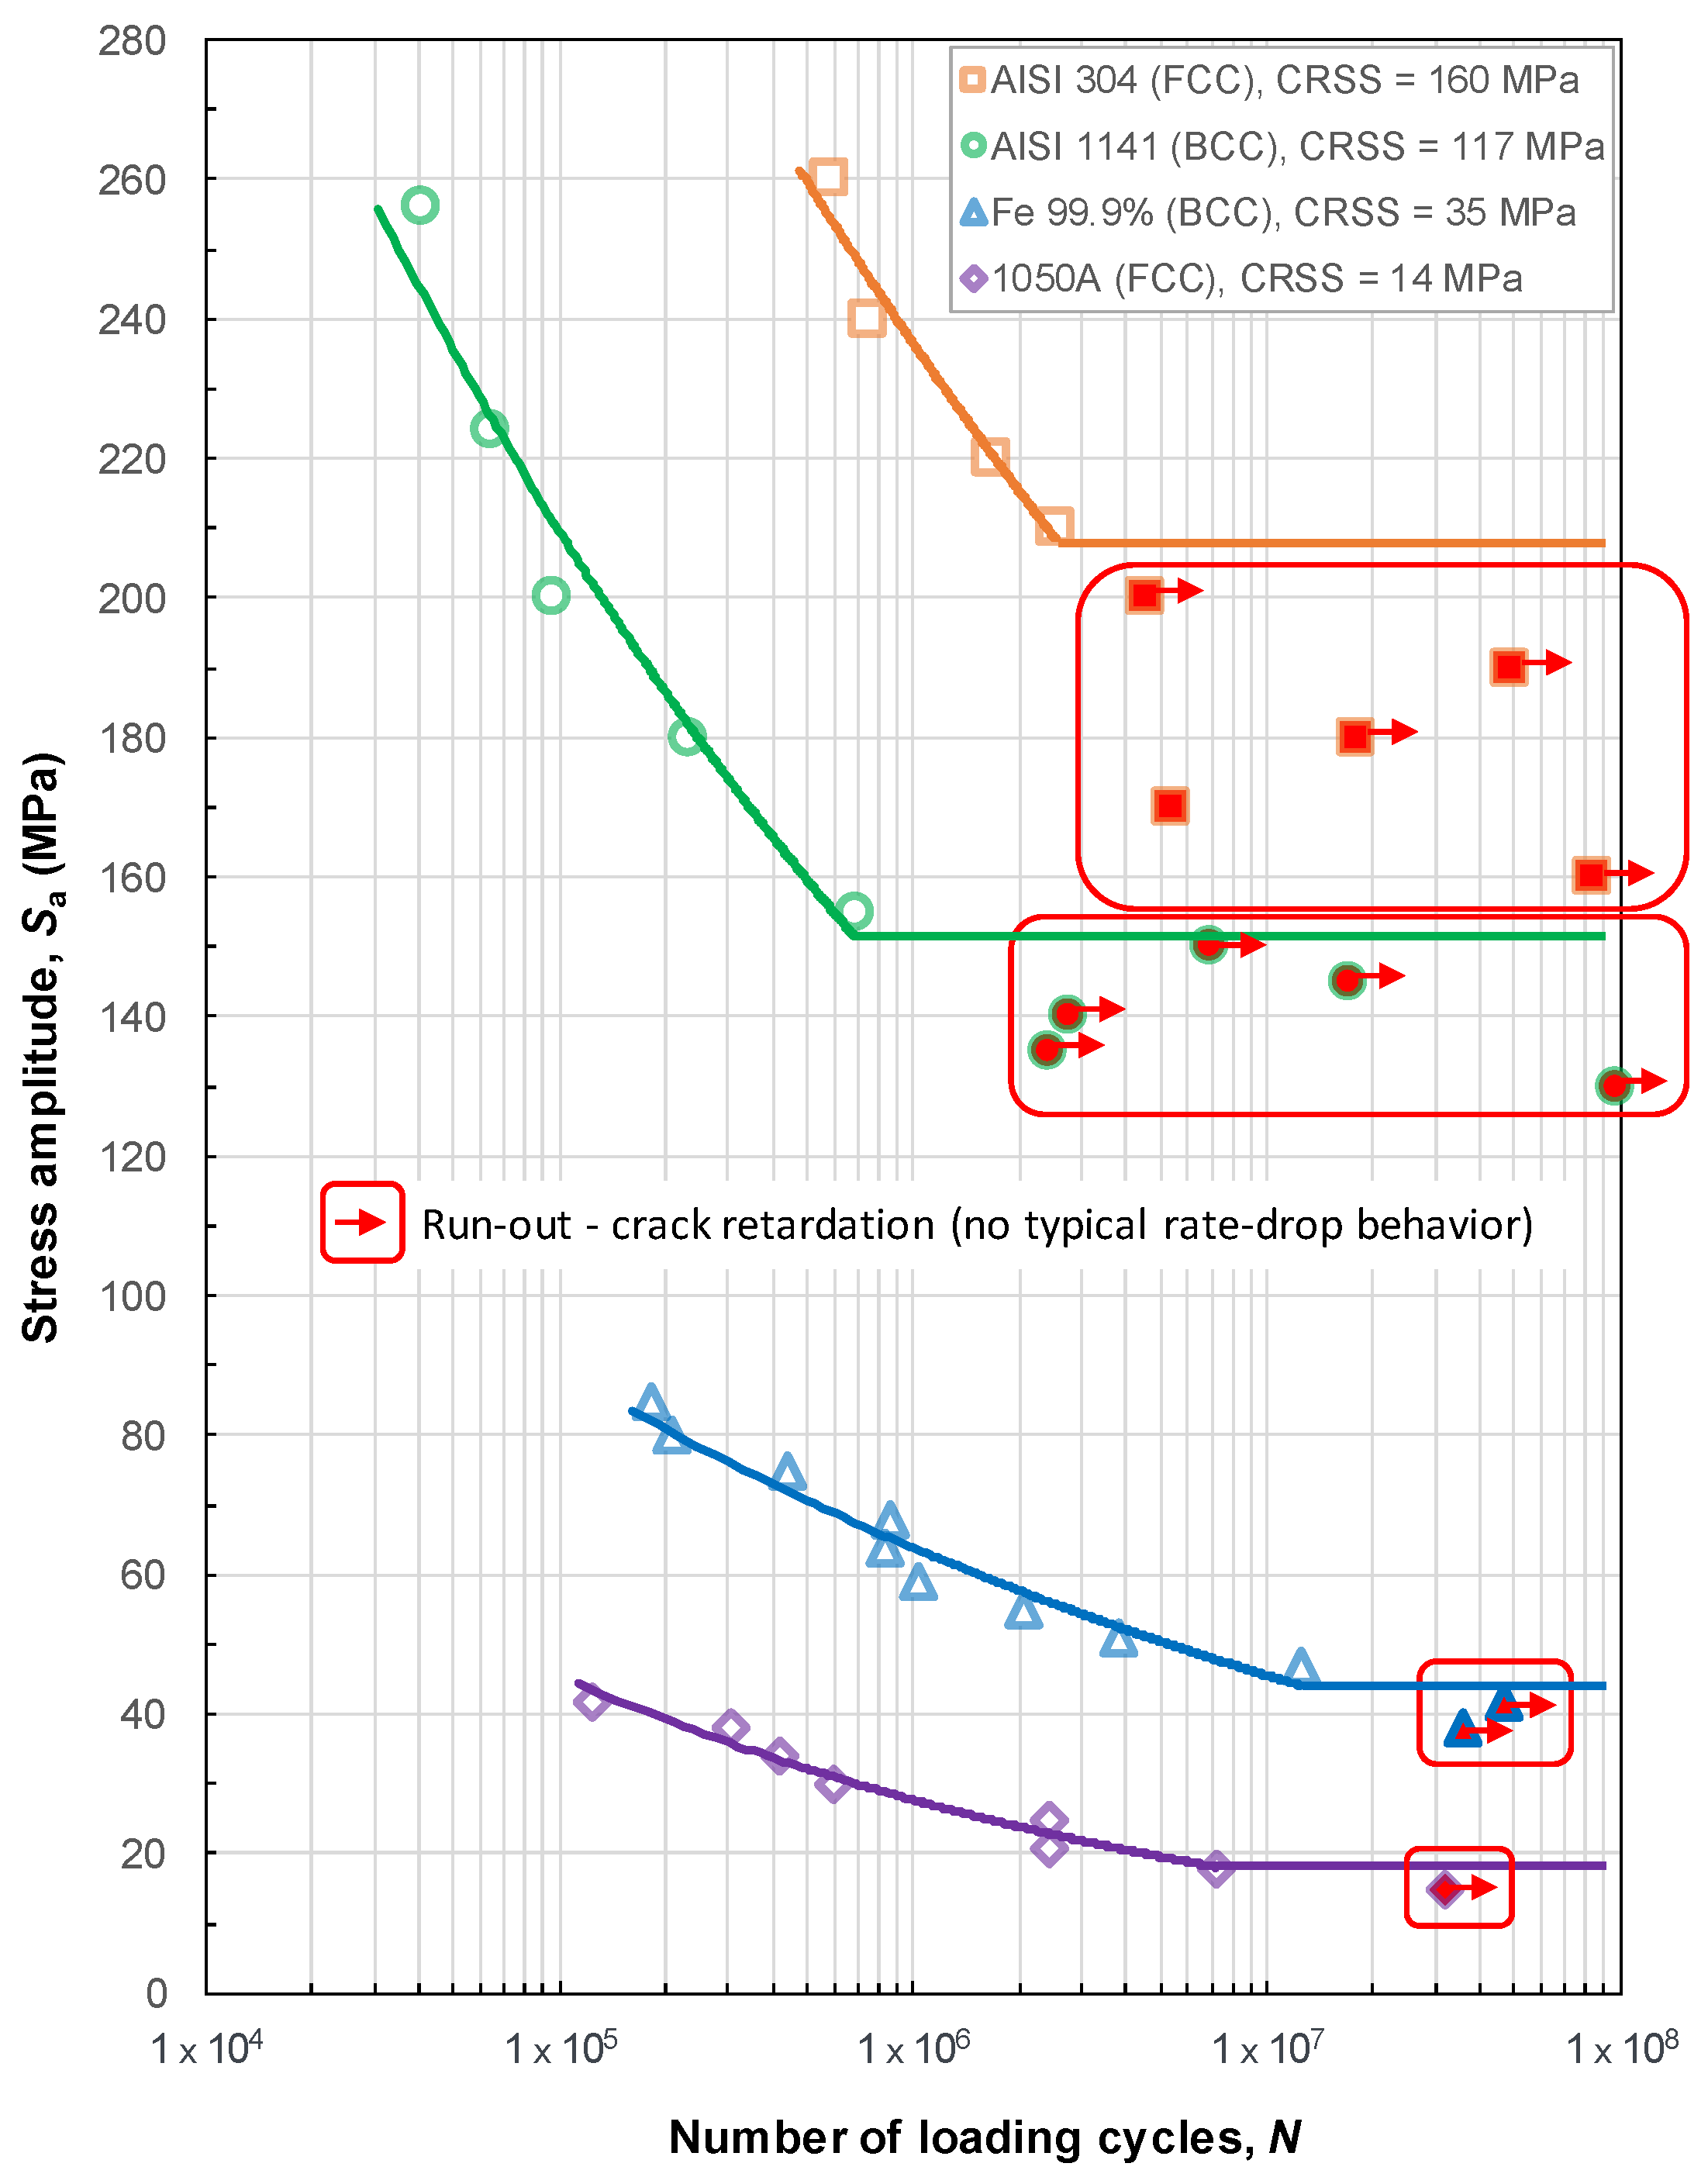
Figure 8.
(a) Shear stresses in a 3D deformable shell submodel of the AISI 1141 steel; (b) 3D global model of the notched tensile specimen (half), reproduced from [52], with permission from Elsevier, 2018.
Figure 8.
(a) Shear stresses in a 3D deformable shell submodel of the AISI 1141 steel; (b) 3D global model of the notched tensile specimen (half), reproduced from [52], with permission from Elsevier, 2018.
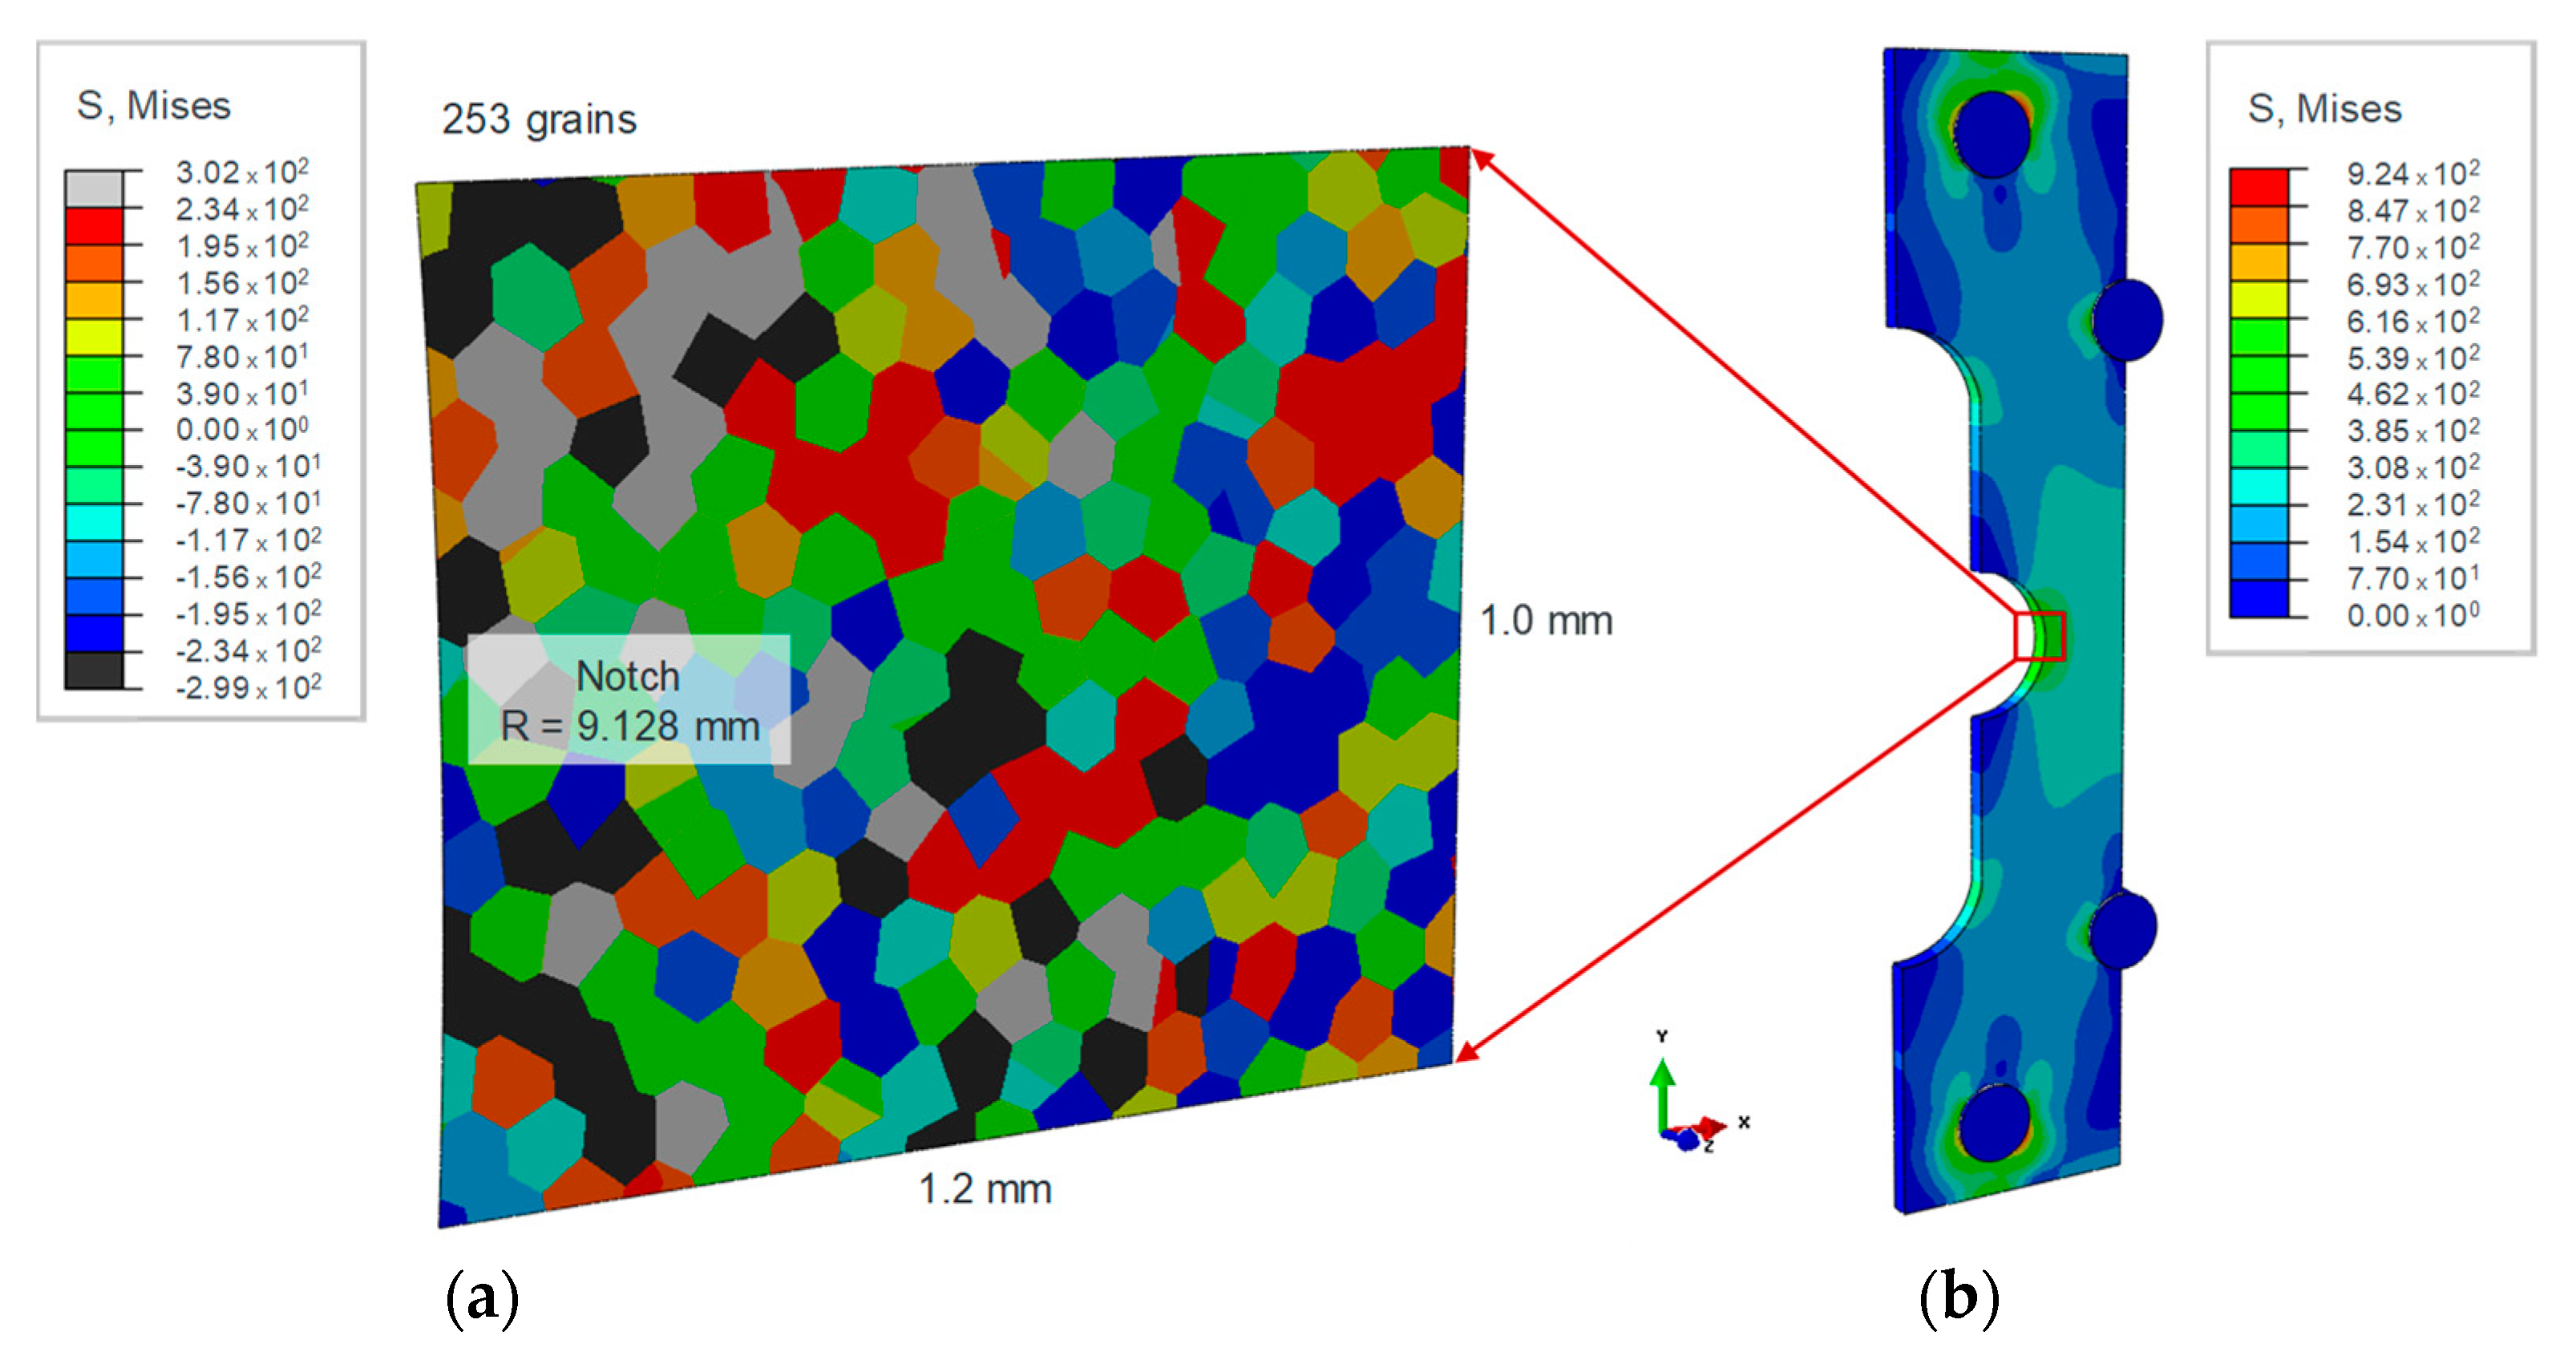
Figure 9.
Damaged microstructural model of the Fe 99.9% at the end of the crack initiation stage, under 75 MPa loading stress amplitude.
Figure 9.
Damaged microstructural model of the Fe 99.9% at the end of the crack initiation stage, under 75 MPa loading stress amplitude.

Figure 10.
(a) Fatigue crack growth rate of the Fe 99.9% at the end of the crack initiation stage; (b) Averaged fatigue crack growth rate of the Fe 99.9%.
Figure 10.
(a) Fatigue crack growth rate of the Fe 99.9% at the end of the crack initiation stage; (b) Averaged fatigue crack growth rate of the Fe 99.9%.
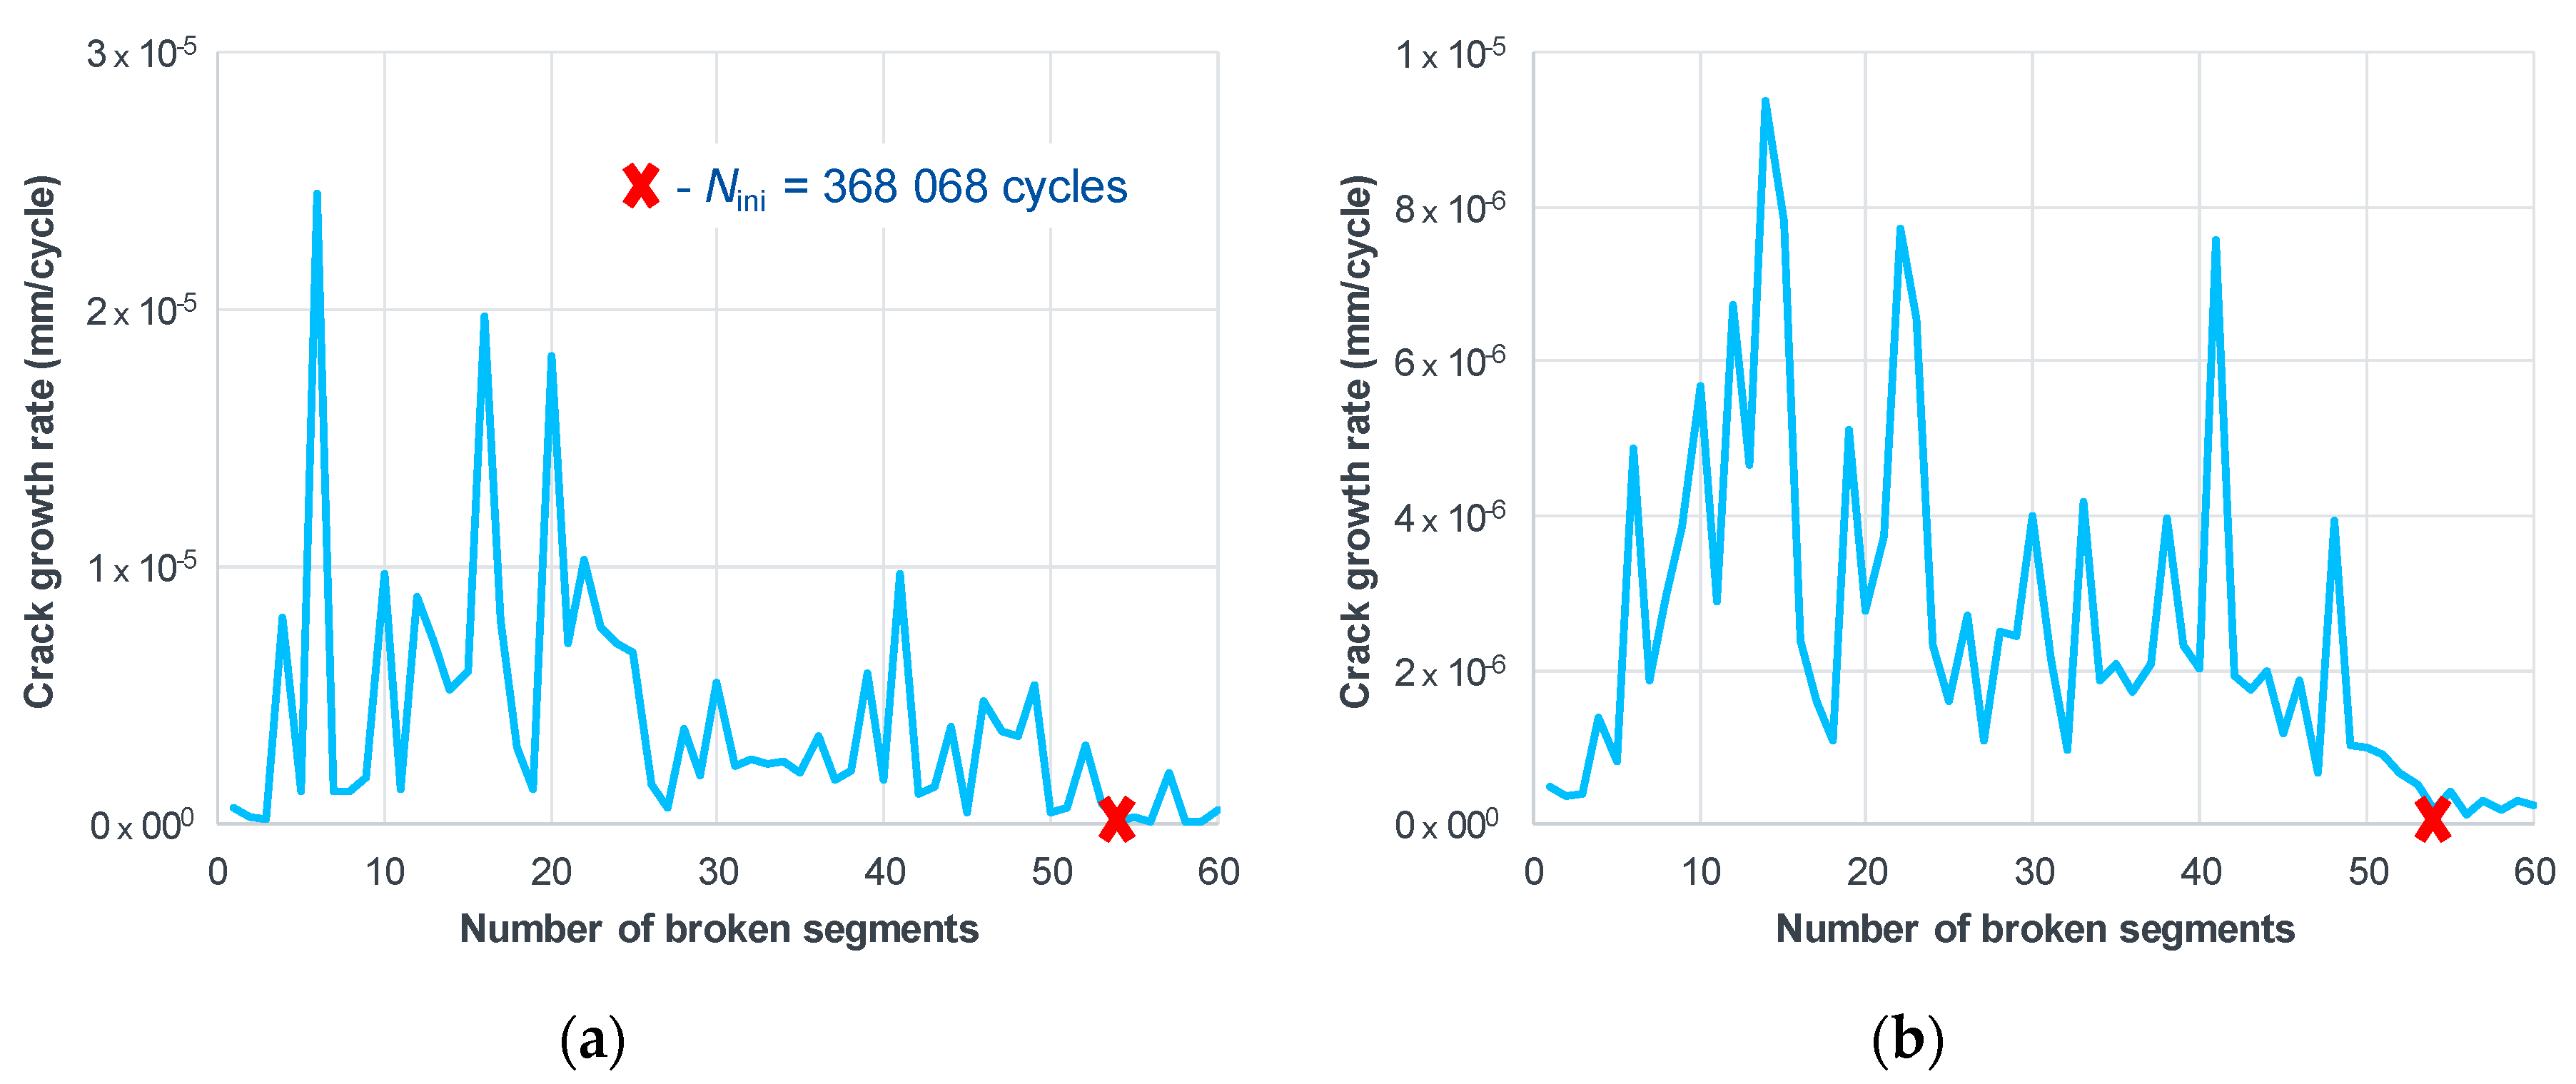
Figure 11.
(a) Damaged microstructural model of the 1050A; (b) Fatigue crack growth rate of the 1050A at the end of the crack initiation stage, under 15 MPa loading stress amplitude.
Figure 11.
(a) Damaged microstructural model of the 1050A; (b) Fatigue crack growth rate of the 1050A at the end of the crack initiation stage, under 15 MPa loading stress amplitude.

Table 1.
Fatigue ratios for a number of materials in the various crystal systems, data from [5].
Table 1.
Fatigue ratios for a number of materials in the various crystal systems, data from [5].
| Lattice | Material | σu (MPa) | σe (MPa) | σe/σu |
|---|---|---|---|---|
| BCC | W | 1372 | 834 | 0.61 |
| Mo | 696 | 500 | 0.72 | |
| Ta | 308 | 265 | 0.86 | |
| Nb | 294 | 225 | 0.77 | |
| Fe (+0.2% Ti) | 265 | 182 | 0.69 | |
| Mild steel (0.13% C) | 421 | 224 | 0.53 | |
| 4340 steel | 1103 | 482 | 0.44 | |
| FCC | Ni | 303 | 108 | 0.36 |
| Cu | 301 | 110 | 0.37 | |
| Al | 90 | 34 | 0.38 | |
| 2024-T3 Al | 483 | 138 | 0.29 | |
| 7075-T6 Al | 572 | 159 | 0.28 | |
| HCP | Ti | 703 | 414 | 0.59 |
| Co (+0.5% Ti) | 521 | 165 | 0.32 | |
| Zn | 145 | 26 | 0.18 | |
| Mg | 182 | 30 | 0.16 |
Table 2.
CRSS (critical resolved shear stress) values for different materials.
| Material | CRSS (MPa) | Method | Source |
|---|---|---|---|
| AISI 304 (X5CrNi18-10) | 160 | MPT | Monnet and Pouchon [11] |
| AISI 1141 (40Mn2S12) | 117 | MD | Hummel et al. [45,46] |
| Fe 99.9% | 35 | MPT | Rogne and Thaulow [6] |
| 1050A (Al 99.5%) | 14 | MPT | Jennings et al. [17] |
Table 3.
CRSS values for different materials.
| Material | E (GPa) | G1 (MPa) | υ1 - | C11 (MPa) | C12 (MPa) | C44 (MPa) | Wc1 (N/mm) | d1 (µm) |
|---|---|---|---|---|---|---|---|---|
| AISI 304 | 188 | 79,000 | 0.26 | 233,026 | 80,820 | 79,000 | 69 | ~30 |
| AISI 1141 | 200 | 78,125 | 0.28 | 255,682 | 99,432 | 78,125 | 19 | ~60 |
| Fe 99.9% | 205 | 81,000 | 0.28 | 262,073 | 101,918 | 81,000 | 19 | ~65 |
| 1050A | 72 | 26,000 | 0.33 | 106,678 | 52,543 | 26,000 | 11 | ~65 |
1 TM model parameters.
© 2018 by the authors. Licensee MDPI, Basel, Switzerland. This article is an open access article distributed under the terms and conditions of the Creative Commons Attribution (CC BY) license (http://creativecommons.org/licenses/by/4.0/).
Share and Cite
MDPI and ACS Style
Mlikota, M.; Schmauder, S. On the Critical Resolved Shear Stress and Its Importance in the Fatigue Performance of Steels and Other Metals with Different Crystallographic Structures. Metals 2018, 8, 883. https://doi.org/10.3390/met8110883
AMA Style
Mlikota M, Schmauder S. On the Critical Resolved Shear Stress and Its Importance in the Fatigue Performance of Steels and Other Metals with Different Crystallographic Structures. Metals. 2018; 8(11):883. https://doi.org/10.3390/met8110883
Chicago/Turabian StyleMlikota, Marijo, and Siegfried Schmauder. 2018. "On the Critical Resolved Shear Stress and Its Importance in the Fatigue Performance of Steels and Other Metals with Different Crystallographic Structures" Metals 8, no. 11: 883. https://doi.org/10.3390/met8110883
Note that from the first issue of 2016, this journal uses article numbers instead of page numbers. See further details here.