
An Ice Protection System Based on Phased Piezoelectric Transducers

Centro Italiano Ricerche Aerospaziali (CIRA), 81043 Capua, Italy
*
Author to whom correspondence should be addressed.
Actuators 2024, 13(5), 158; https://doi.org/10.3390/act13050158
Submission received: 15 March 2024
/
Revised: 12 April 2024
/
Accepted: 19 April 2024
/
Published: 24 April 2024
(This article belongs to the Special Issue Actuators in 2024)
Abstract
:This study focuses on a system constituted of two piezoelectric transducers installed on a slat representative element, with ice protection purposes. The waves generated by these actuators can cause, in fact, shear actions between the slat panel and the ice accretion, with the final effect of breaking and detaching it. A property of the system is, however, the possibility of regulating the phase between the excitation signals of the two transducers. This capability can be exploited to produce local advantageous wave interference with a consequent amplification of the shear actions. Benefits can be obtained in terms of: (1) reduction of needed power; (2) recovery of signal intensity losses due to distance, geometric, and mechanic discontinuities; (3) recovery of non-optimal functionality due to off-design conditions. The work starts with an overview of the impact of the ice on the aeronautic and other sectors. Then, attention is paid to the systems currently used to protect aircraft, with a specific focus on ultrasounds generated by piezoelectric transducers. The concept proposed in this work is then presented, illustrating the main components and the working modality. On this basis and considering the specific nature of the physical phenomenon, the modeling approach was defined and implemented. At first, the impact of some critical parameters, such as the temperature and the thickness of the ice, was investigated. Then, the impact of the phase delay parameter was considered, estimating the increase of magnitude potentially reachable by means of optimal tuning. Finally, a preliminary experimental campaign was organized and a comparison with the numerical predictions was performed.
1. Introduction
Ice accretions on aircraft can have catastrophic effects on the complex phenomenology determined. In fact, it can alter the original aerodynamic geometry of the wing, determining sudden drag increase and lift loss; moreover, by obstructing the air intake of the propeller, the ice can dramatically reduce the thrust; finally, when the accretions occur close to the movable surfaces, their excursion is strongly reduced with impacts on the maneuverability of the vehicle. Such a phenomenology, caused by specific atmospheric conditions and the aerodynamic field around the wing, is all the more worrying if one considers that it is sudden and does not give the pilot the time and the possibility to take the appropriate countermeasures. Thus, often the aircraft abruptly falls into a stall condition and recovery actions can hardly be taken [1].
These aspects made more severe by the addition of climate change widely justify efforts to prevent or mitigate ice accretion. Inspections of the wings are routinely addressed before take-off, using either visual checks or specialized equipment [2]. These types of checks are also supported and accompanied by onboard protection systems.
A general classification can be performed, distinguishing the protection systems in deicing and anti-icing [3]; the former removing already accreted ice, the latter preventing its accretion. Before take-off, warm liquids can be sprayed onto the aerodynamic surfaces to melt the ice. As an alternative, and with the intention of preventing ice accretions, dedicated fluids can be deposited on the surfaces. During flight, some precautions can be taken to prevent ice: adjusting the velocity of the vehicle or the altitude or avoiding zones climatically prone to ice events. In any case, the regulations mandate onboard ice protection systems, which can dramatically impact power consumption, weight, and integration with other onboard systems.
Numerical models are used to study the problem of ice growth and then experimental tests are performed to check the predictions. A numerical model that uses the phase-field method to simulate how ice forms and accumulates on aircraft wings is presented by Ashraf Ali Omar et al. [4]. The ability of the model to predict ice behavior on various surfaces has been validated with experimental data.
An overview of the research on aircraft icing undertaken by NASA at the Glenn Research Center is given in [5]. The research includes wind tunnel tests, numerical models, and data analysis. The authors talk about the difficulties of investigating how ice forms on aircraft wings and the advantages of new technologies.
The basic mechanisms of how ice forms on aircraft wings are reviewed comprehensively by Veldhuis et al. [6]. The review includes the physics of water droplets that are below freezing, the processes of ice accumulation, and the effects on aerodynamics.
Many works in the literature show the development of conventional and unconventional ice protection systems, indicating the great and deep interest in the topic. Different types of ice protections can be implemented; among others: hot gas, electrothermal, pneumatic, microwaves, and electro-impulse systems, as well as surface deformations [7]. These systems have advantages and disadvantages. The main issues are the power consumption, the weight, the effect on the aircraft layout, and the ability to remove ice. Table 1 shows the pros and cons of different types of ice protection systems [7,8,9,10,11,12,13,14,15,16,17,18,19,20,21,22,23,24,25,26,27,28,29,30,31,32]. The most desired advantages are low power consumption and low weight.
The necessity of developing new strategies, which are minimally invasive and represent a valid alternative in terms of power consumption and weight penalty, paved the way to new approaches that rely on unconventional technologies. In this regard, one recalls the use of materials, called “smart”, which offer different functionalities and the capability of changing some of their features on the basis of external stimuli. Among the others, and with reference to their impact on the ice protection field, shape memory alloys (SMA) and magnetostrictive and piezoelectric materials deserve special insight. The superelasticity and the strain recovery capabilities make SMA particularly suited to de-icing applications, as proved by patents issued since 1997 [33] and by more recent works on the topic [34,35]. Magnetostrictive materials also find applications both for the removal [36] and detection [37] of ice accretions. Similarly, piezoelectric materials appear in many works focusing on different de-icing strategies [9,10].
Despite the potentialities offered by these innovative materials, many challenges must be faced to achieve a technology readiness level (TRL) compliant with flight applications. JEDI ACE [38], SENS4ICE [39], and ICEGENESIS [40] are some examples of projects, at the European level, dealing with ice protection topics and strategies. At the worldwide level, one can recall: the Chinese State Grid Science and Technology Project focused on ice removal architecture based on electro-impulse systems [41] and the Airport Cooperative Research Program promoting ice protection strategies within the US airport network [42].
The research herein presented was performed within the Project of “Green Air-frame Icing Novel Systems”, GAINS, funded by the European Community within the Clean Sky 2 framework [43]. GAINS pursues the objective of improving, maturing, and demonstrating innovative ice protection systems for aeronautic applications. This challenge is faced following a specific technology maturation path, envisaging:
- The implementation of dedicated numerical tools for the accurate prediction of ice accretion mechanisms and the design of unconventional concepts;
The concept investigated in this work belongs to the piezoelectric ice protection systems. In line with similar applications, piezoelectric transducers are used for driving mechanical waves into a skin element to remove ice accretions on the outer face. Generated shear actions crack the ice over its extension and break the link at the interface with the skin surface. The proposed concept is constituted by an aluminum skin element representative of a slat of the Dassault Falcon 7X business jet [46], integrated with two piezoelectric disks bonded on the inner surface. These transducers were used to drive mechanical waves into the skin. Different works investigate the capability of ultrasound waves to detect ice through transducer arrays [50] and remove it by means of one or more transducers [51,52,53,54]. These studies focus on several parameters, such as ice thickness and distribution, transducer dimensions, and position. In the present work, attention is also paid to some of these aspects, but the focus is mainly on the phase delay among the signals of excitation; this parameter is here examined by virtue of its ability to determine detachment actions. To the best knowledge of the authors, the phase delay is treated in different studies for its capability of magnifying wave amplitude; however, a correlation would be important between the potentiality of this approach and the mitigation achievable against the main losses that can affect an ultrasound ice protection system. In this sense, the phase delay and its versatility against different operational scenarios (temperature excursion, ice of different thickness, distance from the source) or its capability of mitigating losses related to the non-ideal nature of the system (imperfect bonding of the transducers on the structure, presence of mechanical discontinuities as stiffeners, rivets or local junctions) can make the difference, especially in view of industrial applications. Moreover, even though this work focuses on ice protection in aerospace, the adopted approach and the phase delay strategy can be extended to other fields of application. To cite some examples, wind turbines or heat exchangers could benefit from this approach, since their ice protection systems are strongly influenced by the same parameters this work focuses on. Then, beyond the ice protection field, biomedical applications based on ultra-sounds could also benefit from the proposed approach, due to its potential capability of compensating for a wide number of losses of effectiveness.
In line with this scope, the phase delay between the signals generated by the two disks was changed to investigate its impact on the magnitude of the transferred actions. Six piezoelectric patch sensors were bonded on specific points of the inner surface to detect the local actions produced by the piezoelectric disks acting in combination.
The study presented herein is organized as follows. The first section is devoted to the description of the concept and its working principle, highlighting the roles of the subparts and the conditions in which the system was investigated. Then, another section is devoted to the modeling approach employed to examine the impact of phase delay on performance; in this section, attention is paid to the parameters used to determine the optimal phase and to the indicators of performance. At this point, in the subsequent section, a preliminary test campaign was illustrated; the aim was to observe the general benefits of the optimal phase delay in terms of signal amplification. Finally, a critical overview of the outcomes is organized, highlighting the main benefits coming from the phase delay and its limitations.
2. Proposed Ice Protection System Layout and Working Principle
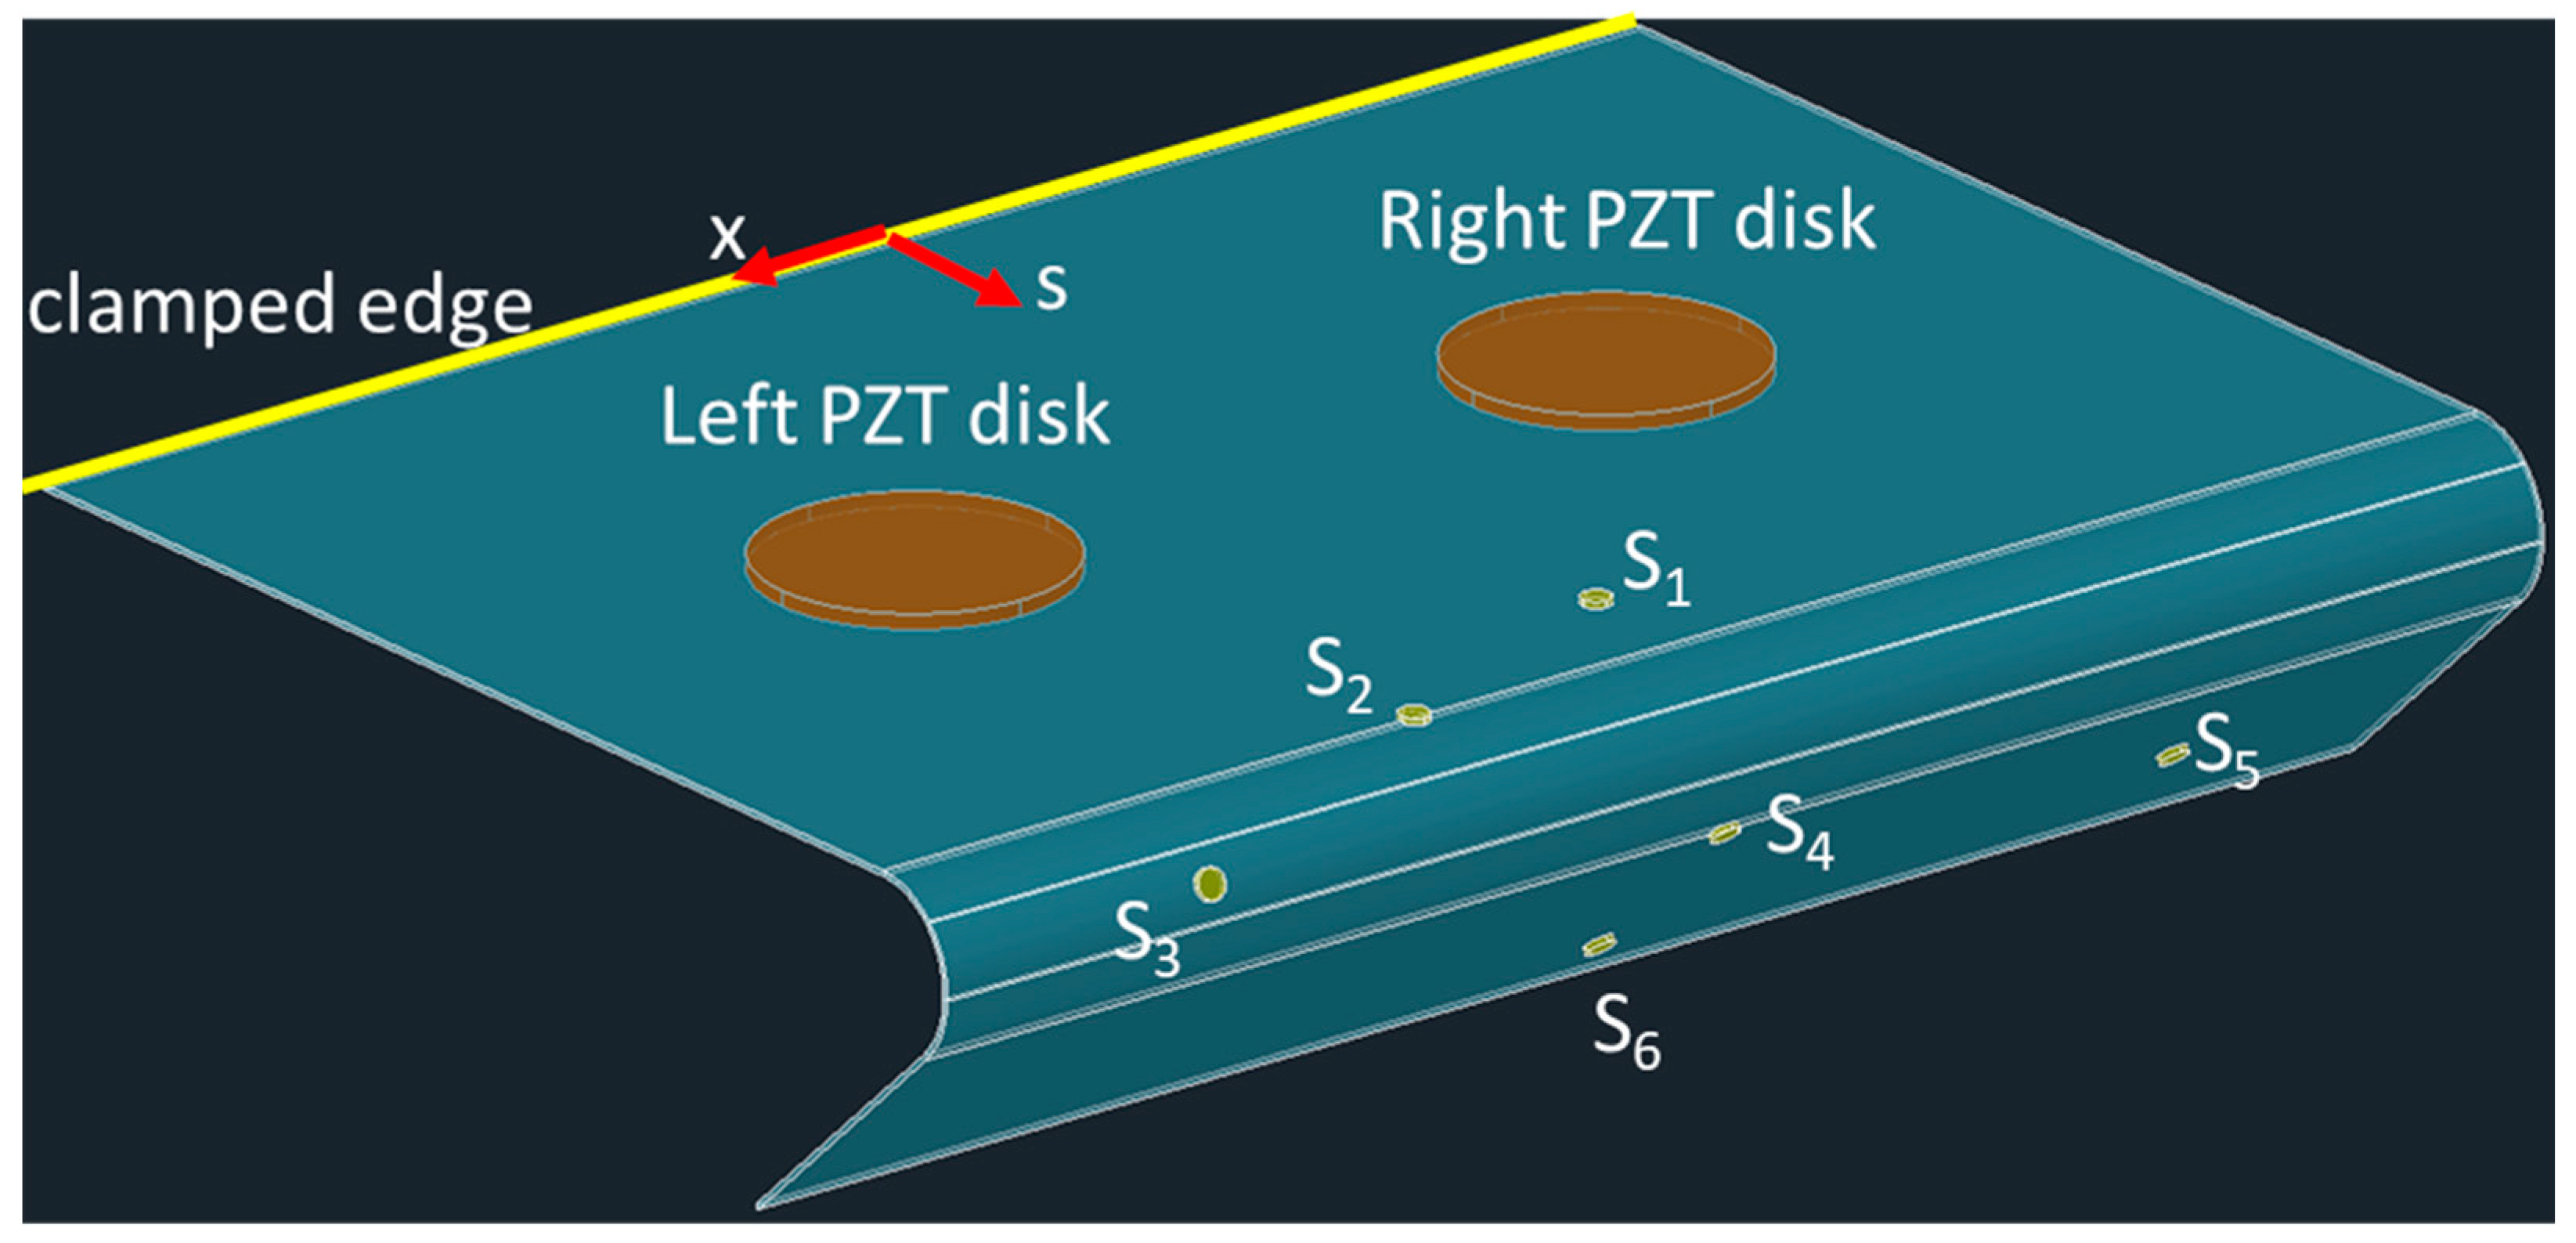
Among other objectives, the aforementioned GAINS Project aims to develop and demonstrate, within a representative environment, an ice protection system that employs piezoelectric technology on a slat. In this context, as a case study, a curved panel made of aluminum alloy, which serves as a representative model for the slat, was taken into consideration. As shown in the transparency of Figure 1, three main regions can be ideally identified: a flat zone with one edge clamped to simulate the connection of the slat to the wing structure; a curved region representative of the leading edge; and another flat region as a final extension of the slat. Six piezoelectric sensor patch transducers and two piezoelectric actuator disks are bonded on the inner surface. Two sensors, S1 and S2, are located on the first flat region; a sensor, S3, on the curved zone; and the three remaining sensors, S4, S5, and S6, on the last flat region. The two actuator disks are symmetrically placed on the first region. The location of the actuator disks and of the sensors referred to in the frame shown in Figure 1 are reported in Table 2; the coordinates in the s direction have to be intended as curvilinear abscissas.
Specific wavelengths, comparable to the thickness of the skin, are generated. This type of wave, in fact, is related to specific resonance phenomena and is really effective in terms of propagation. In more detail, two main types of actions can be transferred at the interface with the ice: in-plane shear, with the main effect of cracking the ice, and out-of-plane shear, producing its detachment. This latter type of wave owes its name to the discoverer, H. Lamb [55]. Depending on the mode of excitation, Lamb waves can be differentiated into symmetric and asymmetric types. The symmetric waves determine opposite sinusoidal out-of-plane displacements across the thickness, while the asymmetric ones produce synchronous displacements; these two types of modal shapes are qualitatively shown in Figure 2.
The thickness and the physical properties of the medium are just some of the parameters that affect the frequency at which it is possible to excite in- and out-of-plane ultrasound waves and, thus, their effectiveness.
The level of attenuation of waves at a certain point depends on several parameters, among others:
- The distance of the sources from the point: this parameter causes both a phase shift and an attenuation of the signals;
- The geometry of the protected component: thickness or curvature variations, local discontinuities, junctions, or constraints may generate wave reflections, worsening system effectiveness;
- The distribution of the ice: ice accretions behave as lumped masses that modify the dynamic response and also result in the reflection of waves;
- The temperature: the distribution of temperature may vary, for instance, along the chord, as shown in [53]; this parameter may produce thermal distortions within the different materials of the system; moreover, it may alter the mechanical properties of the ice;
- The transmission of shear: this aspect is crucial for its impact on the magnitude of the transmitted actions. It is influenced by different parameters; the theoretical model built by Crawley and de Luis [56] highlights the effect of some parameters, corresponding to the quality of the bonding layer and, thus, the effectiveness of the transmission. In particular, the non-dimensional parameter Γ was identified for a 1D PZT patch of extension L:
Γ is a measure of the quality of the adhesive layer. Bonding layers with Γ > 10 can be considered perfect in terms of transmission. Even if relation (1) was built for the case of a 1D PZT element, when applied to a circular transducer, it gives a perception of the quality of the bonding.
L in this case is assumed equal to the diameter of the disk (50 mm). Then, considering the Young’s moduli and the thicknesses of the structure and of the PZT reported in Table 4, for an adhesive shear module, Ga, with a value of 4.94 GPa (Loctite-Hysol-9395 adhesive [57]), a value of 21 can be found out for Γ. For this computation, the adhesive layer was assumed to be 0.1 mm thick; this thickness is practically achievable by squeezing the glue between the structure and the PZT, after having doped it with glass spacing microspheres.
The aforementioned aspects, jointly with failure events of some piezoelectrics in the network, may dramatically abate the effectiveness of the ice protection system. In particular, the distribution of the ice and the variation of the temperature might strongly alter the dynamic response of the system. The distortions generated by the variation of temperatures, for example, determine an internal stress level that alters the stiffness of the structure. Due to the relevance of this aspect, some studies [58,59] investigated additional degrees of freedom (dofs), such as non-linear damping, to better adapt the dynamic response to the specific application.
The local interference generated by piezoelectric actuator disks can also be exploited. In the case study presented in this work, the interference of the waves generated by the left and right actuator disks of the slat panel is investigated.
The displacement and produced by the left and right piezo disks shown in the scheme of Figure 3 can be expressed as:
with , , , and being the amplitude and the wave vectors for the left and right piezo, and , , , and the position vector, the angular frequency, the time, and the phase delay of the displacement generated by the left actuator with respect to the right one.
The aim of the system is to generate waves with a specific phased delay that, at each frequency and throughout every location of interest within the domain, guarantees the maximum amplitude.
3. Operational Range
As discussed in the previous section, the design of an effective de-icing system based on piezo technology involves different aspects concurring to produce the detachment of the ice accretions. A literature survey was undertaken to investigate the main approaches followed for the development of ice protection systems based on piezoelectric transducers. In Table 3, a summary of the main ice protection systems based on piezoelectric technologies is reported, illustrating the main characteristics, operational ranges, and the protected parts. In particular, the reported systems apply to different specimens with a variety of geometries, such as wing sections or plates, and are tested in thermal chambers or icing wing tunnels, where different types of ice accretions are obtained. The different parameters characterizing the de-icing systems include type of actuation, supply voltage, phase, and frequencies of excitations. Moreover, the table illustrates the assessment procedure selected to verify the detachment of the ice.
An analysis of this table highlights the following points:
- The applications can be categorized into two primary families based on the frequency of excitation: low bandwidth, arriving at a few kHz, and high bandwidth, over 20 kHz. In the first band, the typical modal shapes of plate elements are excited, while in the higher band, thickness resonances are exploited. It is noteworthy that applications operating at low frequencies typically employ a greater number of piezoelectric patches with an overall capacitance compliant with the frequency limitations of the amplifier;
- Another classification, even if not so sharp, can be performed on the basis of the voltage of excitation; two parameters seem to be related to it: the stiffness of the structure (in turn determined by material and geometry) and the frequency itself: generally stiffer structures and lower frequencies are accompanied by higher voltages; it is also worth noting that higher frequencies require amplification systems with an adequately high cut-off band, compatible with the capacitances of bulky piezoelectrics;
- Protected part: flat (rectangular or circular, free or constrained) and curved plates representative of wing leading edges; with specific reference to this last typology and in particular to the work [60]; it is worth noting the implementation of an opposite phase delay to better harmonize the waves produced by different piezoelectrics acting on a complex structure;
- The ice distribution: the applications are characterized by ice accretions with different thicknesses, up to 12 mm, with an average of 4 mm.
The system discussed in the study is a metallic curved plate representative of a slat, an open structure halfway between a flat panel and a leading edge. In this sense, it exhibits three main aspects that may alter the propagation and, thus, the effectiveness of the waves: the presence of a constraint on the aft side, a high curvature level on the leading edge, and some zones far from the wave sources. Low-frequency plate modal shapes may be strongly influenced by the presence of additional constraints such as lateral ribs; moreover, the excited modes could potentially interfere with the dynamic behavior of the wing. High frequencies of excitation offer a reduced susceptibility to constraints, although local reflections must be accurately taken into account. In this sense and considering the possibility of setting an enhanced excitation strategy generating in-plane and out-of-plane shear actions to, respectively, break and expel ice, the high-frequency bandwidth was preferred in this work. Another important aspect is the material of the skin, which is made of metal. Unlike laminate structures, the current system is not prone to delamination events. Such events, on one hand, could be caused by high-frequency waves and, on the other hand, could alter the wave propagation. Of course, attention must be paid on the bonding of the piezo actuator disks to reduce any transmission losses and prevent any cracking.
4. Modeling and Parameter Sensitivity
The purpose of this section is to quantify the impact of certain parameters on the strain amplitude transmitted at various points of the slat, which are significant for the off-design operation of the protection system.
A finite element model of the slat was realized. The study of phenomena associated with ultrasound waves requires dedicated approaches capable of describing wave propagation both in-plane and through the thickness. Two-dimensional shell elements, commonly used for low-frequency problems, were not considered for this application; the linear approximation of the displacement profile along the thickness offered by these elements, in fact, does not assure the correct simulation of the boundary conditions on the inner and outer faces of the skin element, which is particularly relevant for the high-frequency problems. For this reason, stacks of solid elements were considered for the entire structure, to ensure a number of nodes along the thickness adequate to the representation of nonlinear displacement profiles. The MSC/Nastran frequency response solution was implemented on this model to obtain the stress concentration at the interface with the ice layer against the type of excitation (piezo disks acting individually and in combination at 0 and at a specific phase delay) and the ice thickness.
The finite element model of the slat is depicted in Figure 4, with its principal characteristics outlined in Table 4 and Table 5. The image at the top displays the exterior of the slat, uniformly coated with an ice layer, while on the bottom, the interior view of the structure shows that it is equipped with two piezo-actuator disks and six circular piezo-patches for strain sensing. It is constituted of 255,112 solid elements and 624,311 nodes. Five elements along the thickness of the slat were placed by a total of six nodes to describe the profile of the displacement; the same was performed for the ice layer. The action of the piezo disks was simulated by an equivalent thermal load, assigning fictious expansion coefficients and for the in-plane and out-of-plane directions:
with and being the piezoelectric charge constants linking the voltage applied along the patch normal direction, 3, to the expansion produced along the out-of-plane (normal), 3, and in-plane (radial), 1, directions. Finally, is the thickness of the disks. In this way, there is a 1-to-1 correspondence between applied thermal load and voltage. The system was excited up to 60 kHz, fairly including the radial mode of the piezo disk alone, 44.2 kHz, and wide enough to contain the corresponding mode when bonded to the mechanical system (slat + ice).
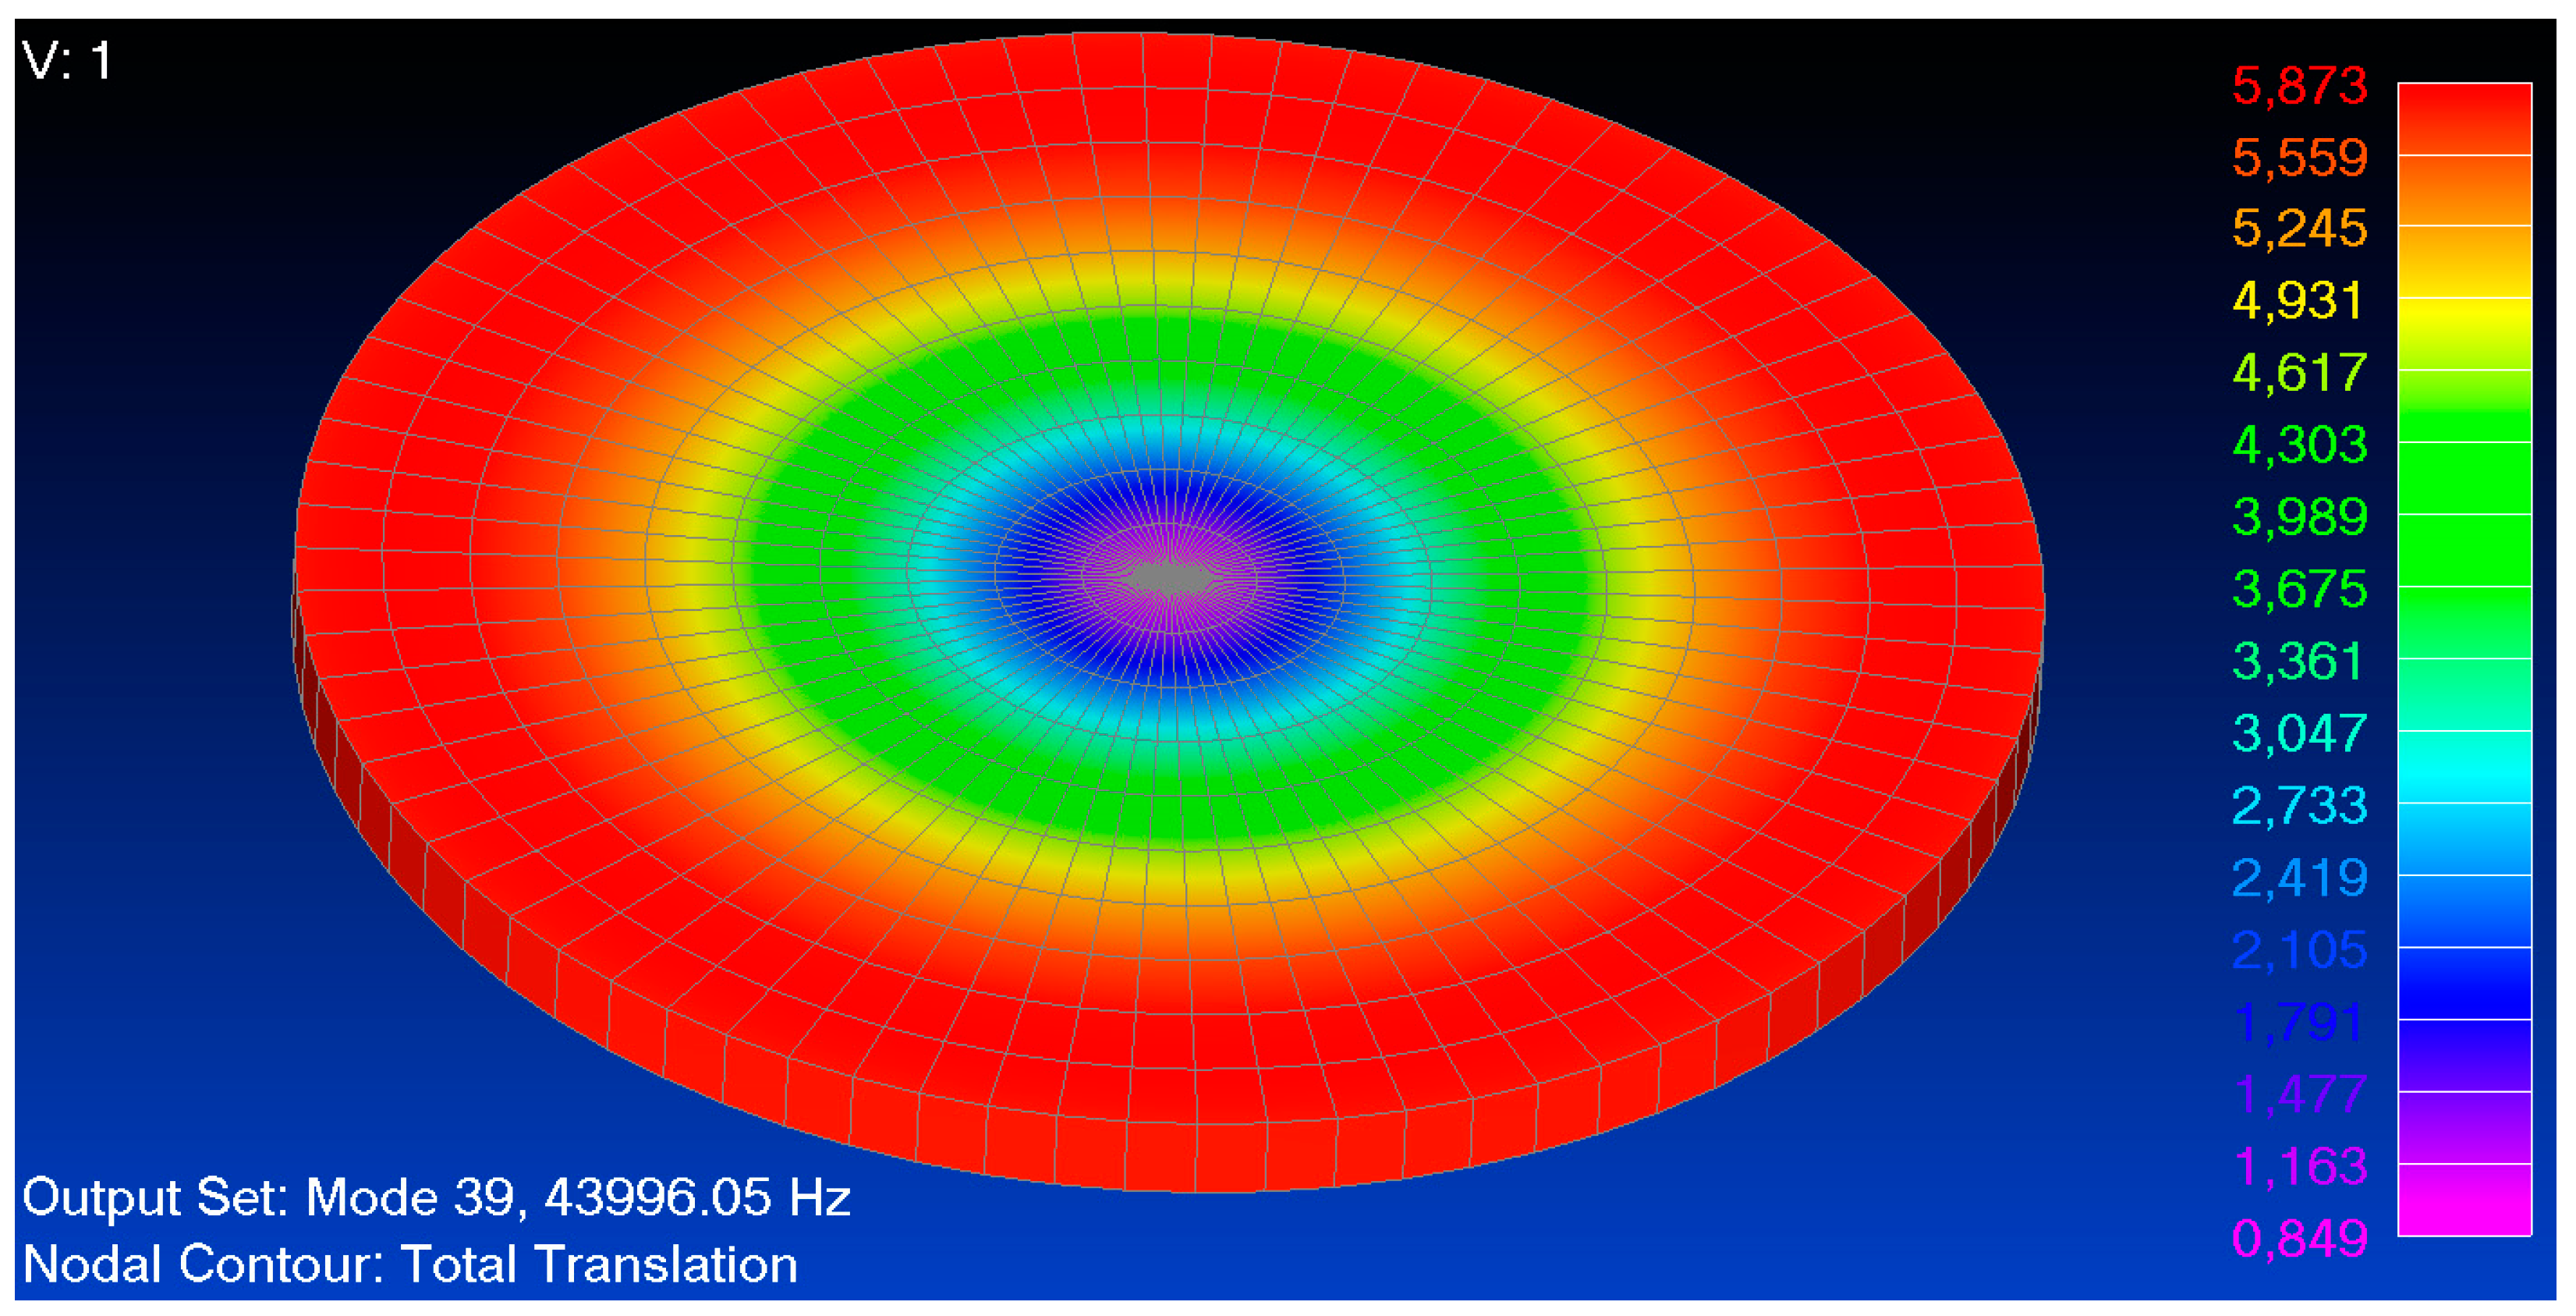
At first, the normal mode analysis of the piezo actuator disk alone was performed to verify the consistency of numerical predictions with the material features used and, thus, with the theoretical prediction of the radial mode. In Figure 5, the radial mode of the piezoelectric disk is illustrated. The corresponding frequency, fr, was 44.0 kHz, against the theoretical one of 44.2 kHz. This last value was computed by dividing the radial mode frequency constant of the Pz26 material, NP, of 2.21 × 10³ mHz, by the piezo disk diameter, dp.
Then, the effect of the temperature on the dynamic response was investigated, computing the strain the piezoelectric patch sensors undergo within the frequency range. MSC/Nastran SOL 103 [68] was employed to calculate the system stiffness matrix, altered by the thermal load stress due to the temperature decrease from the initial (25 °C, room temperature) to sub-zero values. The stiffness matrix represented the input database for the next frequency response analysis, addressed by SOL 111. For the sake of clearness, the previously mentioned steps implemented to understand the impact of the temperature change are reported within the block diagram of Figure 6.
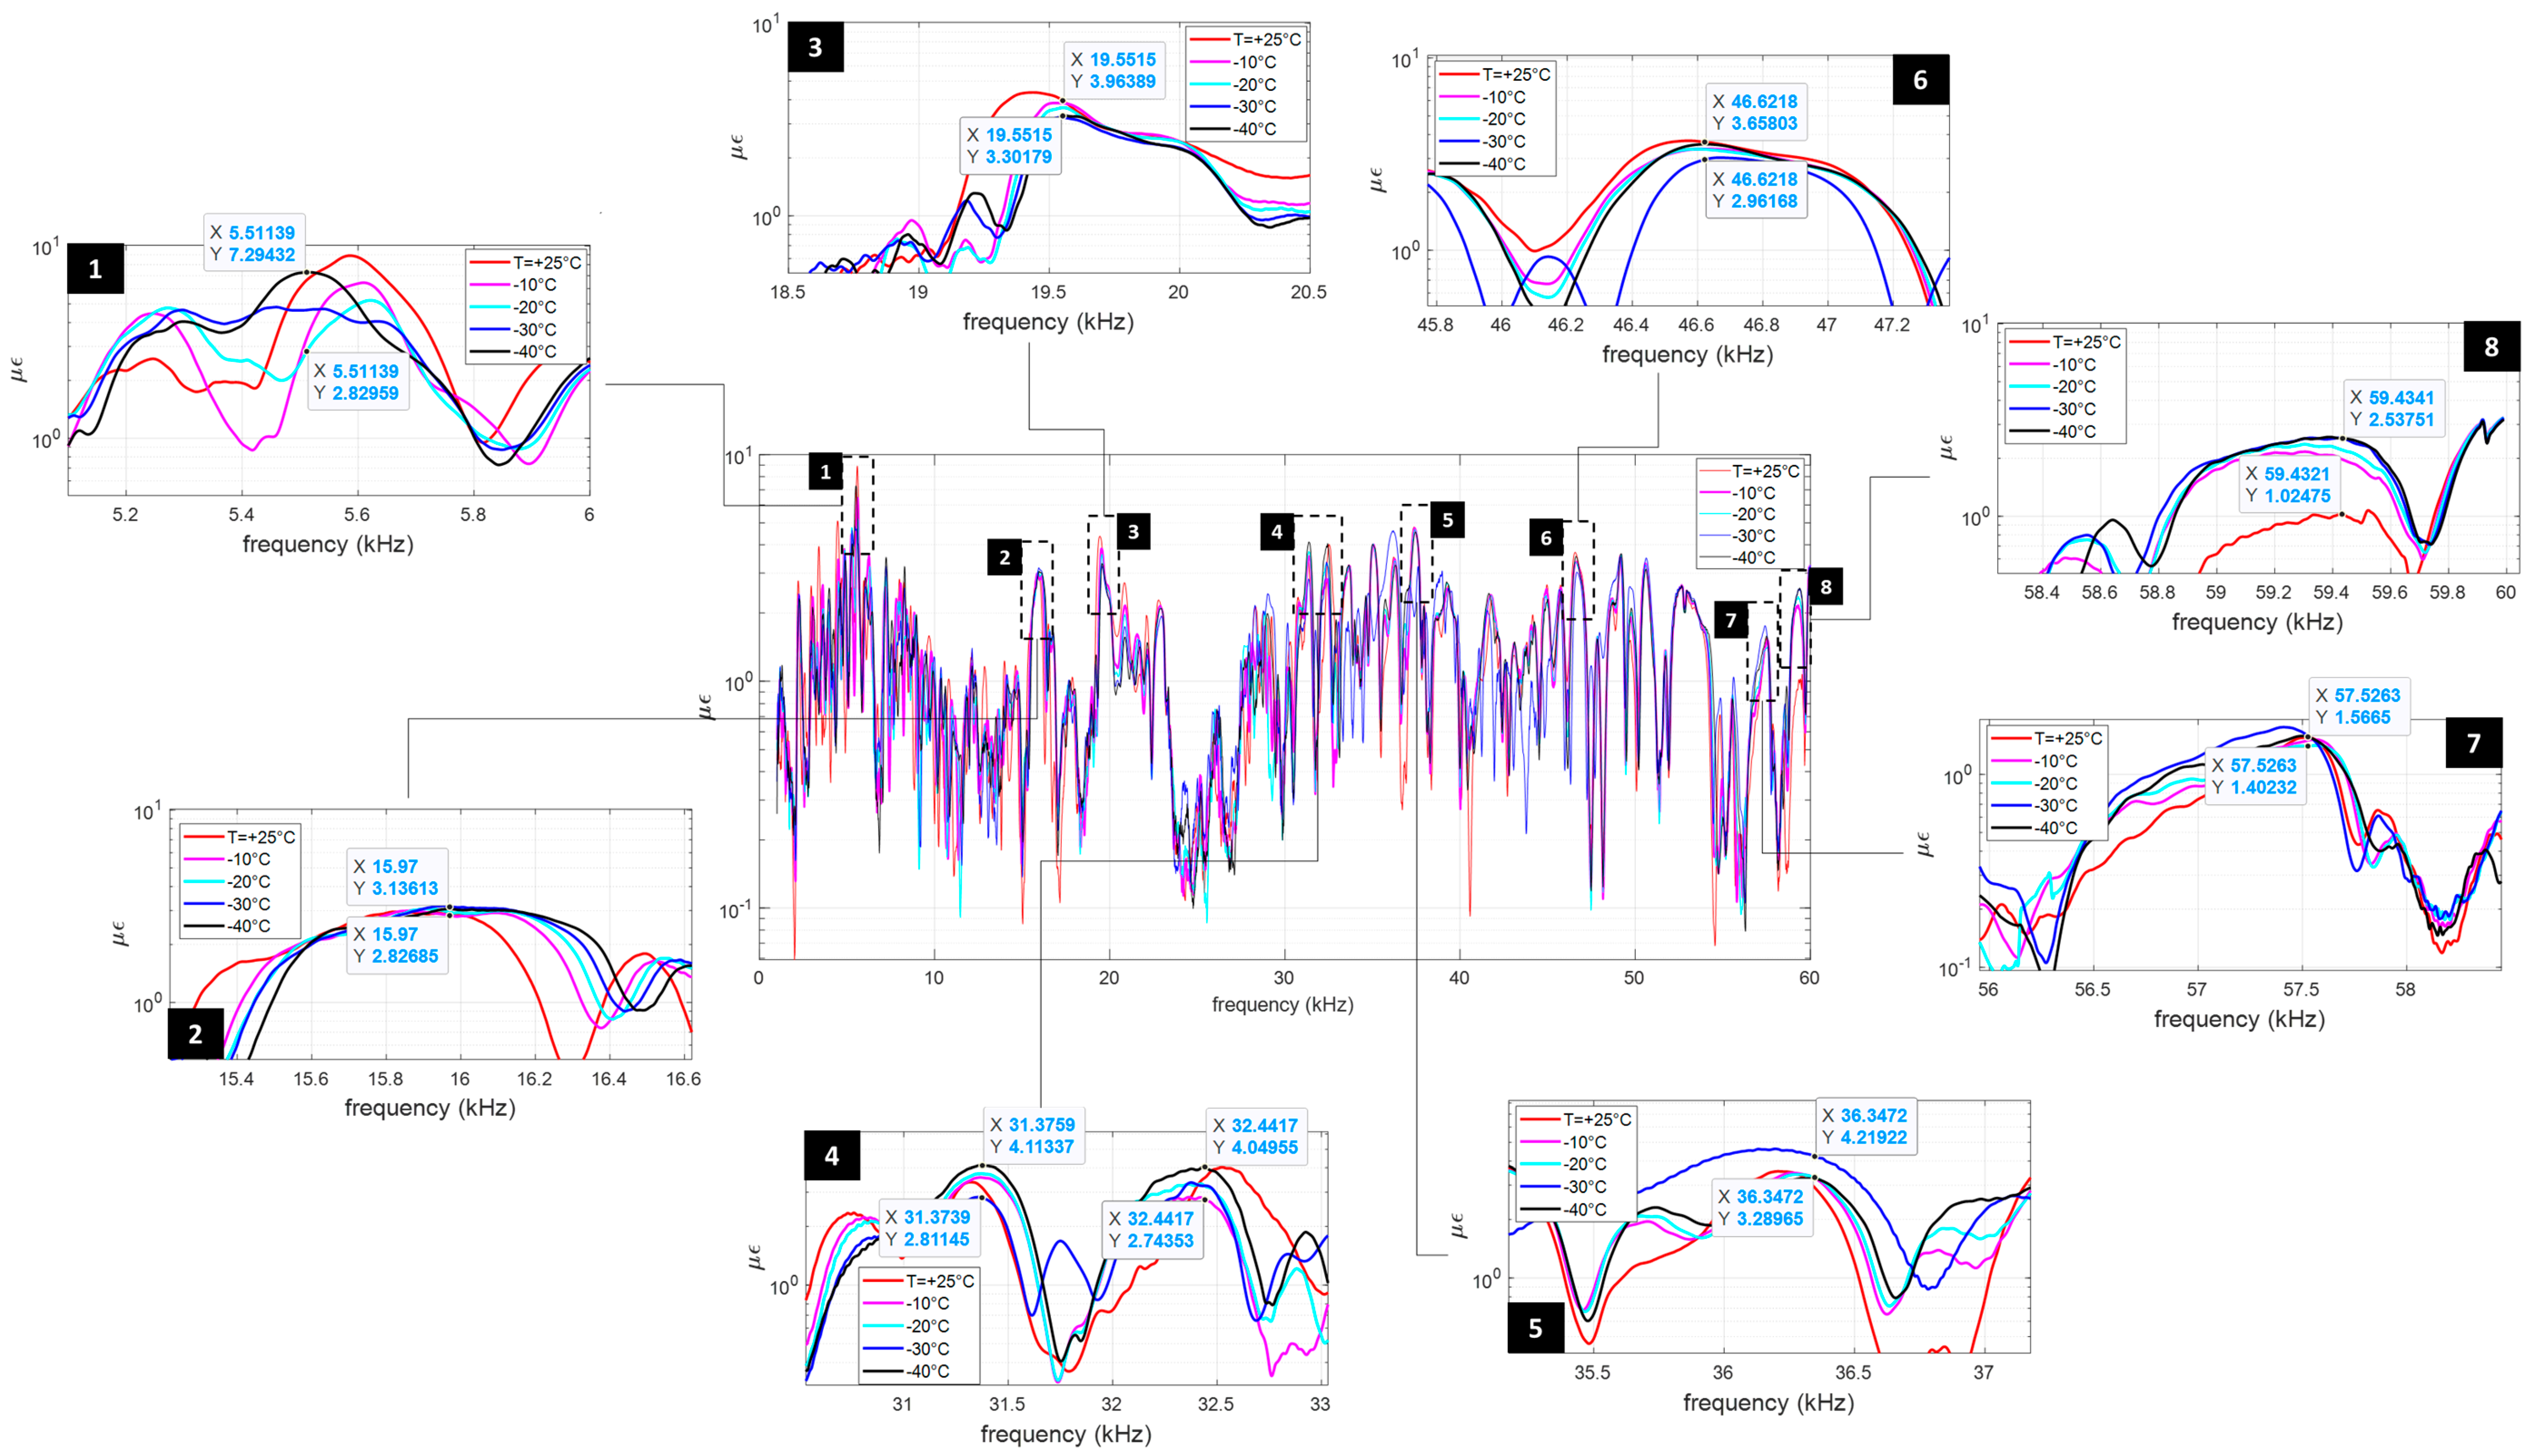
One can obtain an idea of the impact of the temperature by the plots of Figure 7 and Figure 8 showing, in the middle, the micro-strain per unit volt, µε, at sensor S1 against the frequency, without ice accretion and with a uniform layer of ice 2 mm thick. Several of the most significant peaks, which may be exploited to crack or detach the ice, were closely examined in the detailed zoomed-in plots surrounding the central peak. These peaks were selected assuming, as a reference, a lowest temperature of −40 °C. The distortion caused by the temperature variation and the consequent alteration of the internal stress are at the basis of a stiffness variation and, thus, of a different dynamic behavior. Generally, the effect of the temperature is highlighted by a distinct trend, evidenced by the consistent sequence of local peaks. In the absence of ice (Figure 7) and for temperatures ranging between −10 and −40 °C, variation in micro-strains were found, from a minimum value of 7% for the peak at 57.5 kHz (detail plot n.7) to a maximum value of 62% at 5.5 kHz (detail plot n.1). In all the plots, the micro-strains at +25 °C were also reported just as a reference, but they were not used for the computation of the amplitude variation. In the presence of ice that is 2 mm thick (Figure 8), a similar behavior was observed, from a minimum deviation of 0.2% at 38.7 kHz (plot n.5) to a maximum value of 29% at 15.0 kHz (plot n.2).
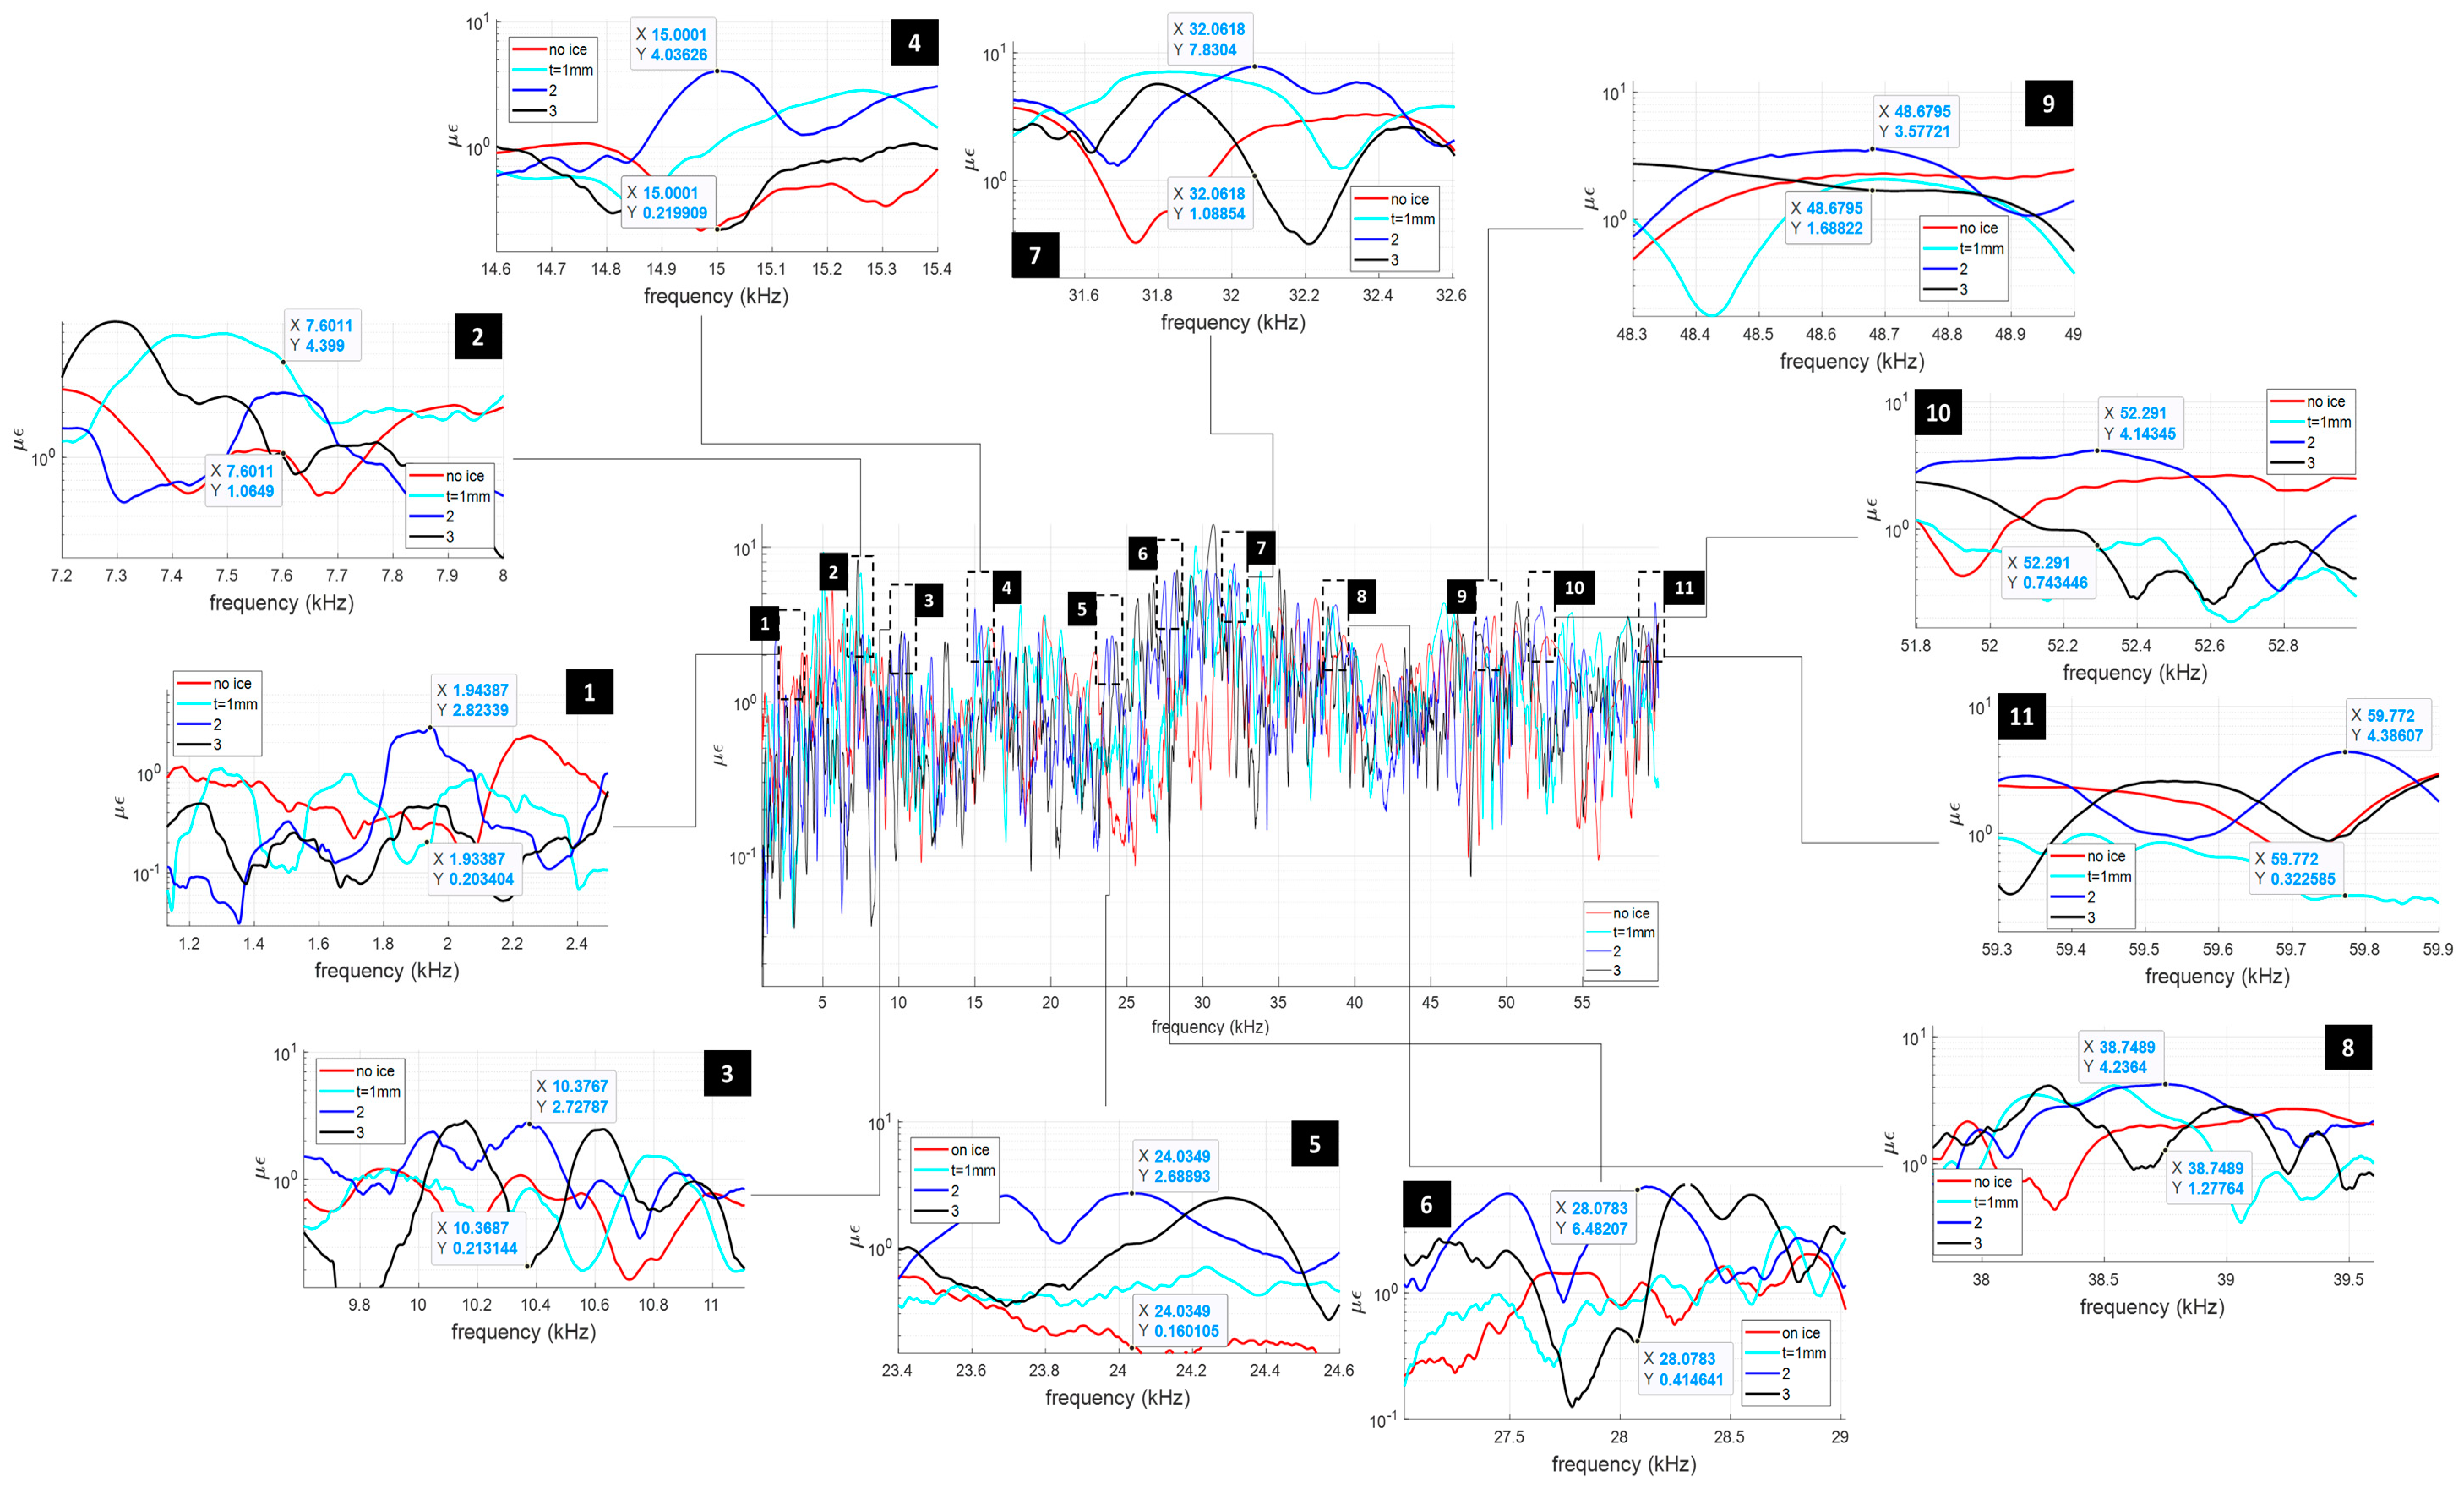
Finally, the impact of the thickness of the ice was investigated. The plot in the center of Figure 9 illustrates the micro-strain at sensor S1 within the entire frequency range, at a temperature of −20 °C and for ice thickness ranging from 0 (no ice) to 3 mm. The curve for 2 mm thick ice was assumed as a reference and highlighted by a thicker line. The peaks considered for this analysis were selected on the basis of this curve and then the corresponding values of the other curves were exanimated. Once more, the detail plots show the situation on the selected peaks. The thickness proved to be a parameter even more influential than the temperature since amplitude deviations between 53 and 95% were found at 48.7 kHz (plot n.9) and at 15 kHz (plot n.4). Even if the effect of the thickness of the ice is evident as for the temperature, it is more difficult to establish a clear trend. The ice, in fact, has two opposite effects on the dynamic response: its additional mass tends to reduce the resonance frequencies while its thickness contributes to the global rigidity.
For a quick idea of the de-icing performance of the system and of the impact of temperature and ice thickness, the in-plane and out-of-plane shears, τxy and τLamb, were computed. As discussed, these two types of shear play a critical role in removing ice; the former cracking, the latter detaching it [28]. Another important role is played by the Interface Shear Concentration Coefficient, ICCS, applied to the two components of shear [28] and capable of weighting them by the supplied power W:
The power was computed as a product of the applied voltage by the current. This latter parameter was obtained as the 1st time derivative of the electrical charge on the actuators, which is, in turn, related to the actual strain.
In the plot of Figure 10, the in-plane shear and the corresponding ISCC were illustrated for all the sensors, at a temperature of −20 °C and for a 1 mm thick uniform distribution. All the results presented hereafter were obtained through an excitation signal with an amplitude of 100 V. The curves represent the shear level while their color shows the ISCC coefficient magnitude. Red dot and green triangle markers were used to highlight the maximum values of the ISCC and of the shear, respectively. It is worth noting that these two values do not coincide for all the sensors. For sensor S5, for example, these values are clearly distinct, presenting the challenge of selecting between the maximum cracking action and the most advantageous shear-to-power ratio. Only when shear and power have the same phase, do the shear itself and the ISCC reach their maximum at the same frequency. A particularly favorable coupling between the PZT and the structure at a specific frequency results in power savings, though it does not invariably lead to the maximization of shear. This, according to definition (8), produces the rise of ISCC. Contour plots covering in-plane and out-of-plane maximum shear and ISCC for all six sensors were collected in Figure 11 and Figure 12 to give an idea of the trend against the thickness of the ice and the temperature. All the sensors show the same trend for in-plane components (Figure 11) against the ice thickness: the darker regions on the bottom, joined to the light blue ISCC contour lines, indicate a lower stress concentration when the ice thickness is modest. One can understand this by noting that thinner ice layers more readily follow the metallic substrate, without generating excessive stress. On the contrary, thicker layers of ice hinder the motion of the substrate. There is an intermediate value of thickness that allows the best transmission and, thus, magnifies the shear. In-plane shear between a minimum of 0.45 and a maximum of 1.8 MPa was found, respectively, on sensors S4 and S6, for ice thicknesses of 1 and 2 mm. Only sensor S3 reached the maximum shear (0.7 MPa) for the maximum thickness of 3 mm. It is placed on the curved and, thus, most rigid region of the slat; for this reason, here, the optimal thickness for transmission is higher. Out-of-plane shear within the same range was also estimated (0.6–1.3 MPa, Figure 12). In this case, optimal transmission is achieved at the minimum ice thickness considered (1 mm) or, at the most, at an intermediate value. The structure, in fact, exhibits greater in-plane than out-of-plane rigidity. In this second case, lower values of ice thickness are required to maximize the transmission of shear. The impact of the temperature is particularly evident for the out-of-plane shear; here, the maximum shear actions are achieved for the lowest temperatures. The higher distortions generated at these temperatures, in fact, determine an increase in the rigidity of the structure whose authority with respect to the ice arises, together with the capability of generating stress.
Another crucial factor lies in the relationship between the strain detected by the piezoelectric sensors and the shear force at the ice interface. The graphs in Figure 13 depict the strain of the sensors (indicated by the blue line) and the corresponding out-of-plane shear (represented by the red line) for a scenario involving a 1 mm thick ice layer at −10 °C. The deformations on the order of tens (detectable by standard equipment and well below the stress limit of the piezoelectric material) demonstrate the suitability of these transducers for this specific application. It is worth noting that the shear reaches its absolute maximum across the entire bandwidth at approximately 7.5 kHz (indicated by the red cross markers) for all sensor positions. In contrast, the absolute maximum strain occurs beyond 50 kHz. However, if one considers a narrower frequency range to calculate the maximum strain (e.g., within 30 kHz), practically coincident peaks can be observed for all sensors except S5. Through this approach, it is possible to exploit the measure of the strain sensors to scan single bands of the frequency range to identify local maxima of shear.
5. Optimal Delay Effects
After having explored the performance achievable without any signal delay from the actuators, the influence of this parameter was assessed. To this end, the maximum shear and ISCC obtainable by an optimal delay were computed at each ice thickness value and temperature.
The MSC/Nastran RLOAD2 card was used to specify the phase of the signal generated by the left disk with respect to the other one. The investigations hereafter discussed were obtained by implementing the computational scheme shown in Figure 14.
In practice, as was already undertaken for the computation of the dynamic response at 0 deg phase delay, an initial eigenvalue analysis was performed on each slat configuration (plate element + PZT disks + PZT sensors + ice layer of assigned thickness). Then, the frequency response was addressed within a cycle, increasing by 10 deg the value of the phase delay of the left disk at each step. The loop continues until the phase delay is lower than 360 deg. When the phase delay is 0, the configuration is assumed as a reference.
The plots of Figure 15 and Figure 16 present the maximum increase of in-plane and out-of-plane shear and ISCC, in correspondence with the peaks identified in the previous section against the temperature and the thickness of the ice.
Shear increases up to 0.6 MPa were found out for the in-plane direction (sensor S2). A more modest increase was estimated for the out-of-plane direction, no greater than 0.3 MPa, for the same sensor. These values, compared to the reference magnitudes reported in the previous section and obtained without any phasing of the signals indicate the operating margin of the optimal phasing, in practice confined to an order below.
It is significant that the highest increases of both in-plane and out-of-plane components are registered at the locations corresponding to the sensors S2, S3, and S5. Here, the optimal phase delay plays an important role since it ensures an enhanced interference of the signals coming from the two disks, despite the different paths.
The maximum increase of shear seems achievable for different values of thickness, depending on the position on the slat. More in detail, for the symmetric sensors, S1, S4, and S6, a maximum increase of in-plane shear is achievable for the lowest ice thickness value (1 mm). This is also confirmed for the out-of-plane components, for sensors S1 and S4. Due to their location, the 0-phase delay already represents a sub-optimal condition that can be improved only by enhancing different excitation peaks, which are sensitive to specific phase delay angles. For the reference configuration (0-phase delay, Figure 11 and Figure 12), the maximum shear level was achieved for intermediate values of the thickness; the maximum increase is instead achieved for the minimum thickness (1 mm), thus highlighting the involvement of different peaks, whose potentials are higher than the original ones.
The impact of the temperature for the in-plane component is generally negligible as shown by the parallel quasi-horizontal contour lines of the plots of Figure 15. The situation is different for the out-of-plane component of the shear, at least for sensors S3–S5 that highlight a maximum increase at the lowest temperatures (−40 °C). The increased rigidity of this configuration, attributable to the significant thermal distortions, affords a larger margin for the optimal phase delay.
A different trend was observed for the ISCC. Here, the greatest increase (1.2 MPa/√W for sensor S1) was noticed for the in-plane direction, against a more modest maximum hike for the out-of-plane direction (0.16 MPa/√W for sensor S6). These figures indicate larger margins for the in-plane ISCC, passing from 8 to 9.2 MPa/√W as the optimal phasing strategy is implemented (Figure 12, sensor S1). For the out-of-plane direction, instead, the abovementioned increase of 0.16 MPa/√W must be compared to the basic value of 16 MPa/√W (Figure 11, sensor S6). The different behavior of the ISCC in relation to the shear magnitude can once again be attributed to the fact that the power required by the transducers is affected by the degree of resonance between the piezoelectric element’s intrinsic frequency and that of the entire electro-mechanical system, which includes the piezo, the structure, and the ice coating.
The outcomes prove that benefits can be achieved both in terms of shear magnitude at the interface with the ice and ISCC. This implies that, on one hand, there is potential to enhance the shear level required for detachment, thereby improving de-icing efficacy, and on the other hand, to obtain certain advantages in power consumption. Within the range of parameters considered, the optimal phase delay led to an improvement of the shear and of the ISCC of about one order lower than the nominal conditions. As expected, the performance of the optimal phasing depends on the zone on which the sensors are located and also on the temperature. The above-mentioned sensor S2 seems the most benefited by the optimal phasing, with a maximum shear increase. Its position is not symmetric with respect to the piezo-actuators and not so far from them. This leads to a local signal not significantly attenuated by the distance and not well phased in nominal conditions: the phase delay strategy has thus a wide margin of improvement. A similar effect can be observed also for sensor S5, still located in a not symmetric position and, thus, potentially benefiting from the phase delay strategy; in this case, however, the greater distance from the sources makes the difference in terms of increase of amplitude. The best increase of the ISCC was instead estimated for sensor S1 (1.2 MPa/√W). The symmetric configuration makes the 0-phase very close to the optimal condition; this strongly reduces achievable benefits on the shear magnitude. Nevertheless, the effects of fine-tuning can be highlighted by the ISCC, being the ratio between two parameters (shear and power), both of them being affected by the optimal phase strategy. It is also worth noting that the thickness of the ice does not have the same effect: for example, at 0-phase, the in-plane shear actions are maximized by an intermediate value of the thickness, while for the out-of-plane actions, optimal results are obtained for intermediate values of thickness (sensors S4, S5, and S6) and for the minimum value in the range (sensors S1, S2, and S3).
Typically, it is the thickness of the ice that contributes more to the observed differences than the temperature does. Depending on the sensor used, the most significant effects may be noted either in the thickest or the thinnest ice distributions. This is evident for sensors S1, S4, and S6 where the best results in terms of shear are obtained for the thinner distributions of ice. On the contrary, sensor S5 shows an opposite behavior, while the remaining ones, S2 and S3, show the best figures for intermediate thicknesses.
The outcomes observed at a 0-phase delay generally indicate identical peaks for both the shear magnitude and the ISCC. This suggests that the nominal design may be effectively guided by considering either the shear magnitude or the ISCC as a singular parameter. Conversely, when addressing the optimal phase delay, a decision must be made between these two parameters to amplify their enhancement. The two alternatives are: to increase the shear magnitude while easing the power-saving criteria, or to focus on the ISCC to conserve power while maintaining the same level of shear. When an optimal phase delay strategy is implemented, the ideal ice thickness varies depending on the specific scenario. The interpretation of this behavior is made more complicated since the thermal distortions play their role in altering the local stiffness and thus the dynamic. Speaking of temperature, it is worth noting that it greatly alters the shear magnitude and the ISCC for the out-of-plane components, at 0-phase and for the optimal phasing, while its effect is not so pronounced for the in-plane actions.
6. Ice Protection Effectiveness
After having investigated the ability of the phase delay to enhance shear and ISCC across various temperatures and ice thicknesses, its effectiveness in facilitating detachment was examined.
To this end, the adhesion strength of the ice on aluminum alloy substrates was considered. Several works focus on the experimental determination of this parameter, influenced by the roughness, the type of ice, and the temperature [69,70,71,72]. For the sake of caution, a value of 0.568 MPa, which is the highest value determined, was adopted for this calculation. Both the maximum shear at a 0-phase delay and with optimal phasing normalized with respect to this adhesion strength were plotted in Figure 17 and Figure 18, referring to the in-plane and out-of-plane components, respectively. Left and right plots illustrate the shear at a 0-phase delay and with the optimal phase delay. The brighter colors evident for some plots on the right qualitatively indicate higher values of the normalized shear and, thus, the benefits due to the optimal phase delay. This is particularly evident in Figure 17 for the plots of the sensors S2 and S5. The same can be said for Figure 18 about the plot of the sensors S3 and S6. Another interesting aspect is the extension of the detachment operational range within the normalized limits considered [0.3–3]. This occurs for the in-plane component on sensor S1 (first plot of Figure 17) and for the out-of-plane component on sensor S3 (third plot on the left in Figure 18): the dashed regions in these graphs highlight portions of the operational range that at 0-phase delay do not cross the minimum limit (0.3); these regions, however, disappear on the corresponding plots on the right since the optimal phase delay produces here an increase of the shear.
The just mentioned qualitative observations can be supported by a quantitative estimate of the contour areas over the threshold with and without optimal phase. The ratio of the operational range areas relevant to the optimal phase delay over the 0-phase delay is reported in Table 6. For almost all the sensors, a % extension of the operational range was found, also achieving significant levels (about 317 and 260% for the out-of-plane and the in-plane shear of the sensors S2 and S3). Here, the effect of the optimal phase is particularly evident for the wide margin, with the 0-phase delay being inappropriate for the asymmetric location of these sensors. Finally, no results were found out for the in-plane component of the sensor S4, since the shear level stayed lower than the threshold within the entire operational range.
7. Preliminary Experimental Validation
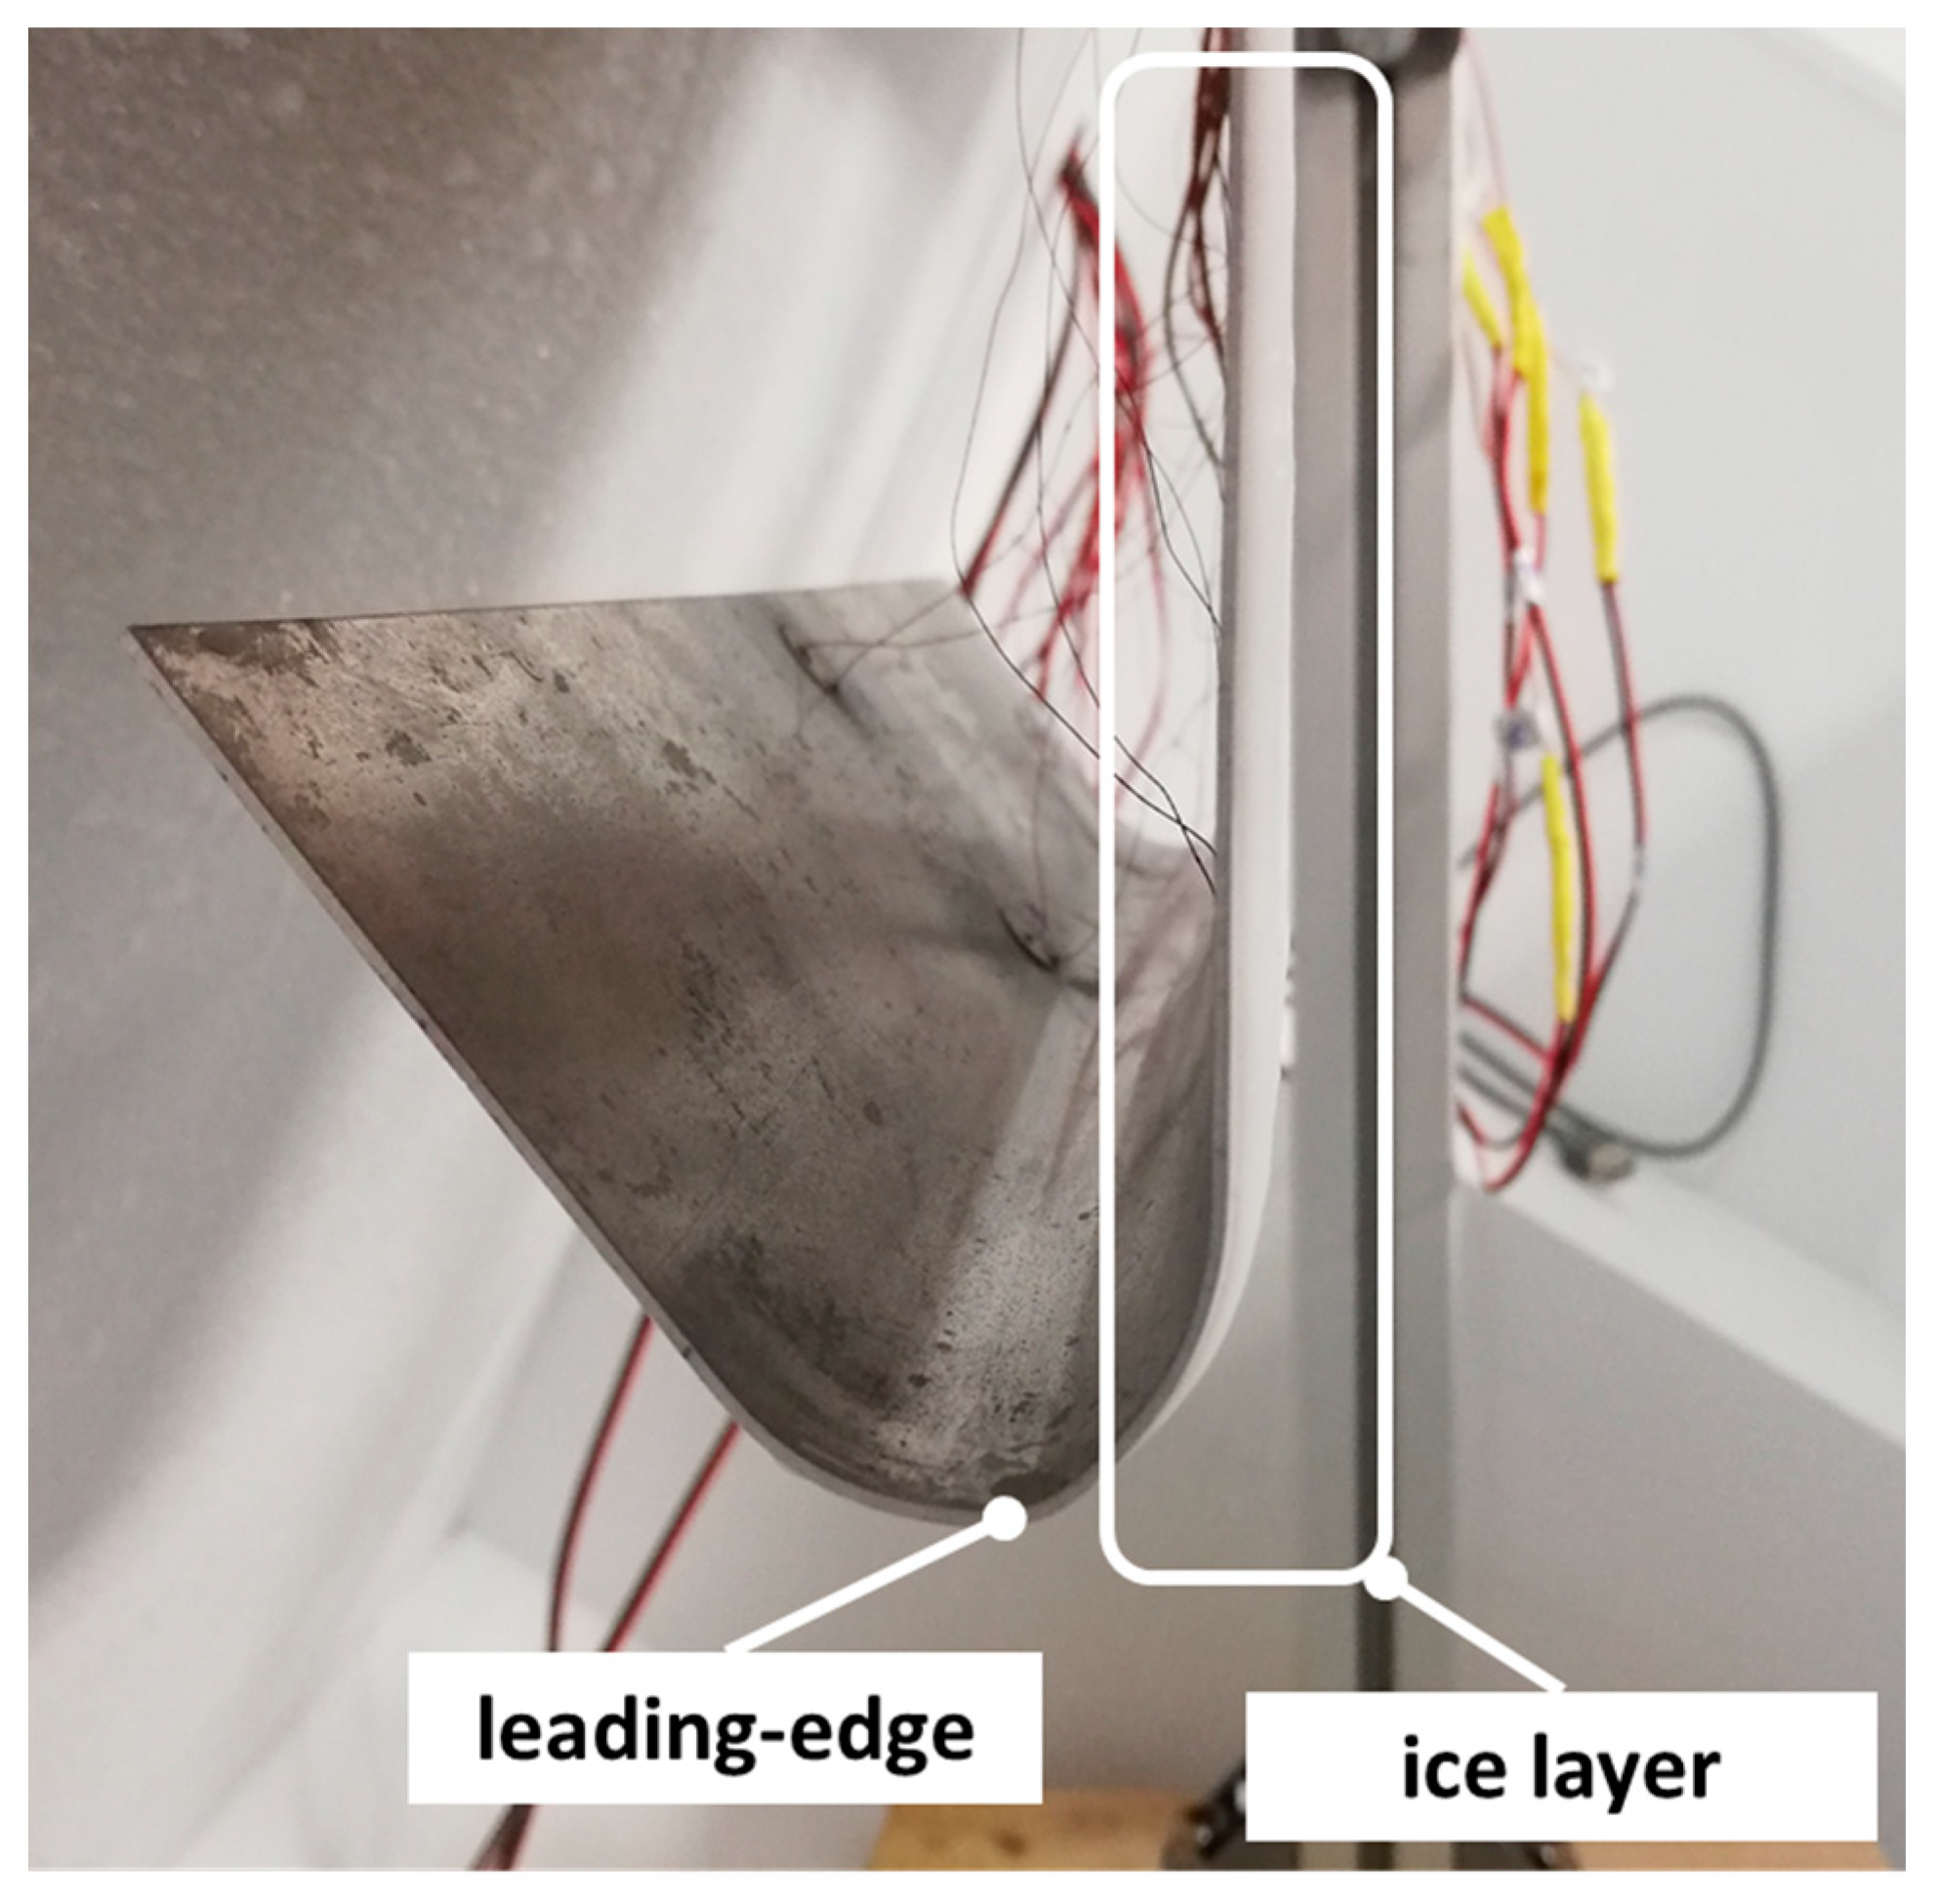
A preliminary validation was also addressed by means of a dedicated experimental setup. In Figure 19, a schematic of the slat hanged to a test rig inserted within a refrigerator capable of achieving a temperature of −40 °C, is illustrated. A fogger and a camera were used to accrete the ice on the slat and monitor its level. The picture of the slat covered with an ice layer within the refrigerator is shown in Figure 20.
The six sensors were used to measure the strain generated by the guided waves produced by the two actuator disks. The setup was organized according to the block diagram illustrated in Figure 21. In this schematic, the inner view of the slat is represented by the blue rectangle on the right. The sensors S1–S3 on the clamped flat region of the slat were represented by the grey boxes (to indicate that they are visible in transparency, being on the back of this view), while the remaining sensors, S4–S6, placed on the leading-edge zone and on the external flat region, were represented by the blue boxes.
The excitation of the left (L) and right (R) piezoelectric disks was assured by the PXIe 5423 generator [73], while the signals detected by the sensors were acquired by the PXIe 5105 oscilloscope [74]. The main features of this equipment are reported in Table 7.
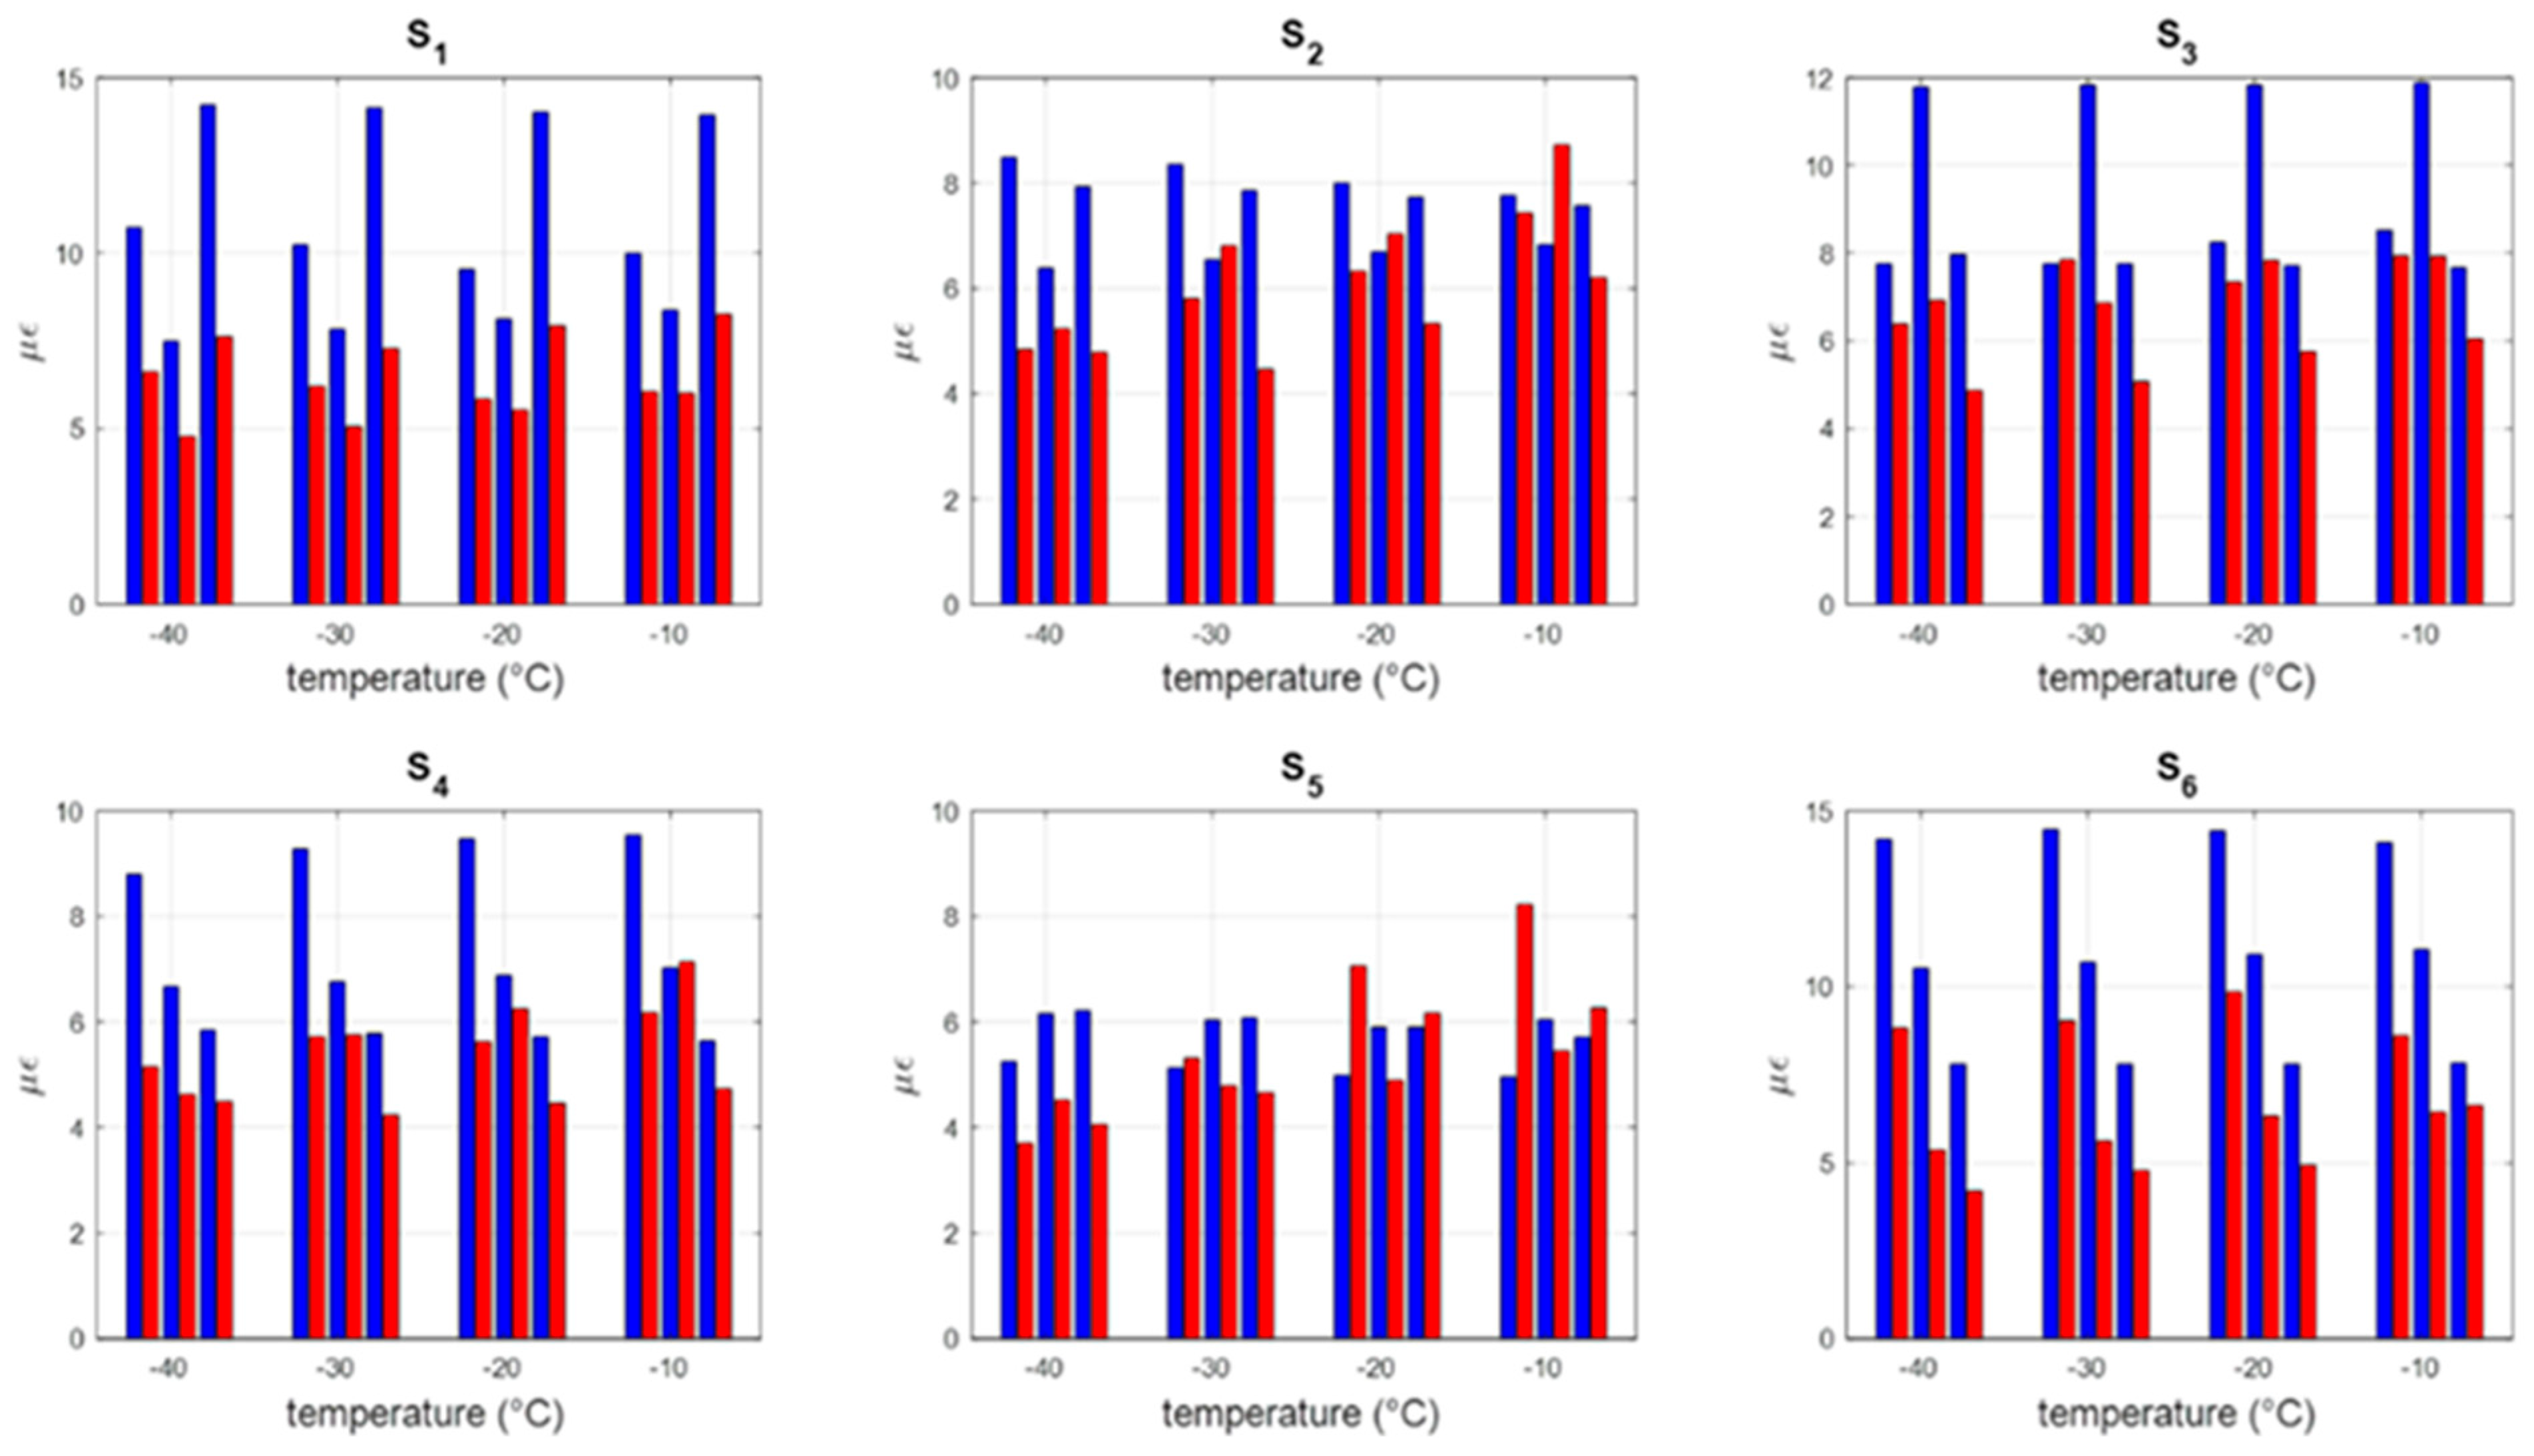
A summary of the experimental maximum strain is provided together with the corresponding numerical values in the bar plots of Figure 22 for the case of 0-phase delay. The bars were grouped by temperatures from −40 °C to −10 °C, proceeding from left to right for ice thicknesses of 1, 2, and 3 mm. The magnitude, in line with what was also observed by numerical predictions, does not exhibit a uniform trend with the temperature: the groups of bars seem to have a similar trend at the different temperatures. This is qualitatively in line with the contour plots of Figure 12, even if in this case, linear strain and not shear is compared.
Then, in Figure 23, a similar comparison was organized for the maximum strain achievable through the optimal phase delay. The blue bars (experimental data) in this case also highlight a remarkable influence of the ice thickness, with a clearly visible maximum per each sensor, except S4, and for all the temperatures investigated. In line with the numerical predictions, the measured increase of amplitude is 1 order below the reference condition (0-phase delay).
A projection was finally performed in terms of ice breaking over the entire bandwidth, even if, as aforementioned, a direct comparison with the shear is not feasible since the transducer acquired linear and not angular strain:
- The experimental data without optimal phase delay, averaged over all the sensors and over the entire thickness and temperatures ranges, lead to an average transmitted strain of 5 µε.
- The same average, for the optimal phase delay, gives an increase of about 0.6 µε; that is to say, an intensification of the transmitted action of about 12%.
8. Conclusions and Further Steps
This study investigated the impact of the phase delay between guided waves on the effectiveness of an ice protection system based on piezoelectric technology.
The main scope is to enhance the performance of ultrasound ice protection systems in terms of the magnitude of the detachment actions and power consumption. Many parameters can, in fact, adversely influence the effectiveness of this type of system, causing deviation from the nominal operational conditions. Among others, attention was paid to the temperature, the distance from the sources, some geometric features of the protected element, and the ice thickness. The effects of these parameters were explored and quantified, showing the shift produced on the frequency peaks of the structure and, thus, on the conditions of excitation and on the amplitude of the dynamic response. A dedicated finite element model of the system was built. Solid elements were used to adequately describe the displacement profile along the thickness, critical for the wavelengths taken into account. The impact of the thermal distortions caused by the variation of the temperature was also investigated, by implementing frequency response analyses on the pre-stressed structure, with and without ice. After this study, the possibility of phasing the signal of two sources was considered. The idea was to produce a constructive wave interference at different points of the domain to increase the magnitude and thus the detachment ability of the system. Some benefits can be achieved by using independent channels of excitation and suitably phasing them: (1) it can locally increase the magnitude of the signal on already well-covered areas; (2) it can recover losses due to off-design conditions (unforeseen ice distributions) or by the presence of geometric discontinuities or stiffening; (3) it can mitigate drops in performance due to the fault of some piezo-actuators in the network. The effect of the optimal phasing was studied on six different points of the structure, finding specific settings to enhance the performance on each of them.
The present study highlighted some interesting aspects:
- The temperature of the structure dramatically alters not only the ice features but also the dynamic of the structure itself. In particular, the stress level due to the thermal distortions determines the shift of the frequency peaks that are potentially exploitable for exciting shear waves. Thus, the ice protection system may not work in nominal conditions, with a consequent a loss of effectiveness. Within the operational range [−40 °C, −10 °C] a reduction of up to 62% of the magnitude of shear was estimated at the interface with the ice.
- The ice thickness may alter the dynamic behavior of the system even more significantly, both in terms of amplitude and the position of the peaks. A reduction of up to 95% of the shear amplitude was estimated within the ice thickness range of 1–3 mm. Even higher variations seem plausible in the case of non-uniform ice accretions.
These aspects in some way highlight the importance of a logic of excitation that compensates for and recovers from any deviation from the nominal conditions. Within the scope of this work, that is to say, the increase of the magnitude of the shear actions at the interface with the ice, through a favorable wave interference at specific point of the structure, two main indicators were investigated: the shear amplitude itself and the ISCC. These indicators are strictly related to the capability of the system to produce ice detachment and to the power necessary. The main findings were:
- The maximum shear magnitude and the ISCC in the case of 0-phase delay (reference) generally coincide. On the contrary, different trends were observed within the temperature–ice thickness domain when the logic of the optimal phase is implemented. This highlights the importance of a strategy of selection between one target, the magnitude of the shear, and the best compromise between this and needed power, that is to say, the ISCC.
- An increase of the shear magnitude up to 0.6 and 0.3 MPa for the in-plane and out-of-plane actions, respectively, was estimated. These figures indicate that an increase of one order blow the reference configuration (0-phase delay) can be obtained to the optimal phase delay strategy.
- The ISCC was most benefited by the strategy. Here, the best increase of ISCC was estimated at 1.2 MPa/√W for the in-plane actions, over a reference value of 8 MPa/√W, that is to say, 15%. The ISCC for the in-plane actions was enhanced but in a much modest way, with a net increase of 0.16 MPa/√W over a basic value of 16 MPa/√W, practically 1%.
- The thickness of the ice generally has a more severe impact on the effectiveness of the system than the temperature. Moreover, depending on the location of the sensor, the values of the thickness for which the best performance is achieved changes. This suggests the influence of the modal shapes on the local deformation field.
- A global enhancement of the power of the ice protection system was also observed through a preliminary experimental campaign; a rough maximum value of 12% of improvement of the power within the operational range was estimated, even in a direct comparison in terms of shear since the transducers were suited for linear and not angular strain.
These findings underscore the potential of the phase delay approach to enhance the performance of an ultrasound ice protection system. Specifically, they can be situated within the technology’s maturation path, with an eye toward industrial applications. The approach, in fact, can significantly impact several of the following aspects:
- Readiness of the technology: this aspect is achieved through redundant architectures that rely on the synergistic use of multiple network elements, ensuring an acceptable level of performance even in the event of temporary faults in some transducers.
- Integration and impact on the other on-board systems: the phase delay approach contributes to enhanced performance and, in turn, to a reduction of the power consumption of the system; this, in some way, simplifies necessary upgrade operations, mitigating the upheaval of the pre-existing on-board equipment.
- Compliance with new configurations: the technology herein investigated seems particularly prone to new configurations, such as full electric or hybrid aircraft; the main reason is the type of energy, electrical energy, that the technology uses and handles, requiring limited operations of conversion before reaching the end user.
The activities and results herein described represent a first step in the understanding of the impact of external parameters on low-power ice protection systems and in assessing a strategy to mitigate any loss. In this sense, from a numerical point of view, many other steps can be taken. Among the others, the investigation of more general ice accretions, not differing only in thickness but also in the distribution on the protected surface, is worth investigating; in fact, it is worth noting that, even if applied to uniform ice accretions, which are more difficult to remove, the approach herein presented is specifically suited to local distributions on which the mechanical energy is concentrated. Another important aspect is the number of actuators: in this work, a minimum of two was considered, but redundancy logics require more independent channels. A plurality of channels also enables phase accommodation strategies, allowing the system to better adapt to the evolution of the ice detached region during the time. From an experimental point of view, the assessment of experimental outcomes is ongoing, with preliminary optimistic feedback in terms of agreement with the numerical predictions; dedicated analyses will be addressed and presented in future works.
Author Contributions
Conceptualization, S.A. and A.C.; methodology, S.A.; data curation, A.B.; writing—original draft preparation, S.A.; writing—review and editing, A.C.; visualization, B.G.; supervision, A.C.; project administration, S.A. All authors have read and agreed to the published version of the manuscript.
Funding
This project has received funding from the Clean Sky 2 Joint Undertaking under the European Union’s Horizon 2020 research and innovation programme under grant agreement No. 945521.
Data Availability Statement
The data presented in this study are available on request addressed to the corresponding author.
Conflicts of Interest
All authors were employed by the company Centro Italiano Ricerche Aerospaziali (CIRA). The authors declare that the research was conducted in the absence of any commercial or financial relationships that could be construed as a potential conflict of interest.
References
- Marongiu, C.; Vitagliano, P.L.; Zanazzi, G.; Narducci, R. Aerodynamic Analysis of an Iced Airfoil at Medium/High Reynolds Number. AIAA J. 2008, 46, 2469–2478. [Google Scholar] [CrossRef]
- Federal Aviation Administration (FAA). Aircraft Icing. Available online: https://www.faa.gov/documentlibrary/media/advisory_circular/ac%2000-6a%20chap%2010-12.pdf (accessed on 7 March 2024).
- Parent, O.; Ilinca, A. Anti-icing and de-icing techniques for wind turbines: Critical review. Cold Reg. Sci. Technol. 2011, 65, 88–96. [Google Scholar] [CrossRef]
- Li, S.; Paoli, R. Modeling of Ice Accretion over Aircraft Wings Using a Compressible OpenFOAM Solver. Intl. Jnl. Aerospace Eng. 2019, 4864927. [Google Scholar] [CrossRef]
- Potapczuk, M.G. Aircraft Icing Research at NASA Glenn Research Center. J. Aerosp. Eng. 2013, 26. [Google Scholar] [CrossRef]
- Veldhuis, S.; Dam, C.J.; Hoeijmakers, H.W.M. Aircraft icing: A review of the fundamental mechanisms. Appl. Therm. Eng. 2003, 23, 2245–2266. [Google Scholar] [CrossRef]
- Thomas, S.K.; Cassoni, R.P.; MacArthur, C.D. Aircraft Anti-Icing and De-Icing Techniques and Modeling. J. Aircr. 1996, 33, 841–854. [Google Scholar] [CrossRef]
- Venna, S.; Lin, Y.-J.; Botura, G. Piezoelectric Transducer Actuated Leading Edge De-Icing with Simultaneous Shear and Impulse Forces. J. Aircr. 2007, 44, J052113. [Google Scholar] [CrossRef]
- Palacios, J.L. Design, Fabrication, and Testing of an Ultrasonic De-Icing System for Helicopter Rotor Blades. Ph.D. Thesis, The Pennsylvania State University, University Park, PA, USA, 2008. Available online: https://catalog.libraries.psu.edu/catalog/4753586 (accessed on 7 March 2024).
- Palacios, J.; Smith, E.; Rose, J.; Royer, R. Instantaneous De-Icing of Freezer Ice via Ultrasonic Actuation. AIAA J. 2011, 49, 1158–1167. [Google Scholar] [CrossRef]
- Zhang, Z.; Hu, H.; Bai, X.; Hu, H. An Experimental Study on the Detrimental Effects of Deicing Fluids on the Performance of Icephobic Coatings for Aircraft Icing Mitigation. Aerosp. Sci. Technol. 2021, 119, 107090. [Google Scholar] [CrossRef]
- Yakovlieva, A.; Boichenko, S.; Shkilniuk, I.; Bakhtyn, A.; Kale, U.; Nagy, A. Assessment of Influence of Anti-Icing Fluids Based on Ethylene and Propylene Glycol on Environment and Airport Infrastructure. Int. J. Sustain. Aviat. 2022, 8, 54–74. [Google Scholar] [CrossRef]
- Yamazaki, M.; Jemcov, A.; Sakaue, H. A Review on the Current Status of Icing Physics and Mitigation in Aviation. Aerospace 2021, 8, 188. [Google Scholar] [CrossRef]
- SKYbrary Aviation Safety. Chapter 15: Ice and Rain Protection. Available online: https://skybrary.aero (accessed on 13 March 2024).
- Abdelghany, E.S.; Sarhan, H.H.; El Saleh, A.; Farghaly, M.B. High Bypass Turbofan Engine and Anti-Icing System Performance: Mass Flow Rate of Anti-Icing Bleed Air System Effect. Case Studies in Thermal Engineering. 2023. Available online: https://researchgate.net (accessed on 13 March 2024).
- Wong, S.-H.; Papadakis, M.; Zamora, A. Computational Investigation of a Bleed Air Ice Protection System. In Proceedings of the Fluid Dynamics and Co-Located Conferences, Chicago, IL, USA, 28 June–1 July 2010. AIAA 2009-3966. [Google Scholar] [CrossRef]
- Papadakis, M.; Wong, S.-H.; Yeong, H.-W.; Wong, S.-C. Experimental Investigation of a Bleed Air Ice Protection System; SAE Technical Paper 2007-01-3313; SAE: Warrendale, PA, USA, 2007. [Google Scholar] [CrossRef]
- Papadakis, M.; Zamora Rodriguez, A.; Domingos, R. Experimental and Computer Model Results for a Bleed Air Ice Protection System; SAE Technical Paper 2011-38-0034; SAE: Warrendale, PA, USA, 2011. [Google Scholar] [CrossRef]
- Zanon, A.; De Gennaro, M. Design of the Thermoelectric Ice Protection System for a Tiltrotor Application. AIAA J. 2023, 59, 1337–1350. [Google Scholar] [CrossRef]
- Morita, K.; Kimura, S.; Sakaue, H. Hybrid System Combining Ice-Phobic Coating and Electrothermal Heating for Wing Ice Protection. Aerospace 2020, 7, 102. [Google Scholar] [CrossRef]
- Yu, L.; Wu, Y.; Zhao, H.; Zhu, D. A Study on the Sensitivities of an Ice Protection System Combining Thermoelectric and Superhydrophobic Coating to Icing Environment Parameters. Appl. Sci. 2023, 13, 6607. [Google Scholar] [CrossRef]
- Yang, S.; Yi, X.; Guo, Q.; Xiao, C.; Luo, Z.; Zhou, Y. Novel Hybrid Ice Protection System Combining Thermoelectric System and Synthetic Jet Actuator. AIAA J. 2021, 59, 4. [Google Scholar] [CrossRef]
- Bendarkar, M.V.; Chakraborty, I.; Garcia, E.; Mavris, D.N. Rapid Assessment of Power Requirements and Optimization of Thermal Ice Protection Systems. AIAA J. 2018, 59, 4136. [Google Scholar]
- Ingram, R.B.; Codner, G.W.; Gerardi, J.J. Electro-Magnetic Expulsion De-Icing System. WO Patent 1996037406A1, 28 November 1996. [Google Scholar]
- Petrenko, V.F. System and Method for Icemaker and Aircraft Wing with Combined Electromechanical and Electrothermal Pulse Deicing. U.S. Patent 20100206990A1, 19 August 2010. [Google Scholar]
- Lei, T.; Min, Z.; Gao, Q.; Song, L.; Zhang, X.; Zhang, X. The Architecture Optimization and Energy Management Technology of Aircraft Power Systems: A Review and Future Trends. Energies 2022, 15, 4109. [Google Scholar] [CrossRef]
- Righi, F.; Sullivan, D.B.; Hartl, D.J.; Rogers, J. Shape Memory Alloy Rotor Blade Deicing. In Proceedings of the 54th AIAA/ASME/ASCE/AHS/ASC Structures, Structural Dynamics, and Materials Conference, Boston, MA, USA, 8–11 April 2013. [Google Scholar] [CrossRef]
- Tamer, O.; Kyriazis, A.; Sinapius, M. Parameter Study and Experimental Analysis of a Thermo-Mechanical De-Icing Concept. Smart Mater. Struct. 2020, 29, 045021. [Google Scholar] [CrossRef]
- Villeneuve, E.; Ghinet, S.; Volat, C. Experimental Study of a Piezoelectric De-Icing System Implemented to Rotorcraft Blades. Appl. Sci. 2021, 11, 9869. [Google Scholar] [CrossRef]
- Jomaa, M.; Vasic, D.; Costa, F.; Lévy, P.-E.; Ali, M. Driving Power Supply for an Avionic Piezoelectric Deicing System. In Proceedings of the SPIE 12483, Active and Passive Smart Structures and Integrated Systems XVII, 124831N, Long Beach, CA, USA, 28 April 2023. [Google Scholar] [CrossRef]
- Song, N.; Benmeddour, A. Erosion Resistant Hydrophobic Coatings for Passive Ice Protection of Aircraft. Appl. Sci. 2022, 12, 9589. [Google Scholar] [CrossRef]
- Piscitelli, F.; Palazzo, S.; De Nicola, F. Icing Wind Tunnel Test Campaign on a Nacelle Lip-Skin to Assess the Effect of a Superhydrophobic Coating on Ice Accretion. Appl. Sci. 2023, 13, 5183. [Google Scholar] [CrossRef]
- Ingram, R.B.; Gerardi, J.J. Shape Memory Alloy De-Icing Technology. U.S. Patent US5686003A, 11 November 1997. [Google Scholar]
- Liu, X.; Xing, Y.; Zhao, L. Study of Shape Memory Alloy De-icing Device for Nonrotating Components of Aircrafts. Proc. IOP Conf. Ser. Mater. Sci. Eng. 2018, 394, 032106. [Google Scholar] [CrossRef]
- Tamer, O.; Walter, F.; Sinapius, M.; Böl, M. A Computational Geometric Parameter Optimization of the Thermomechanical Deicing Concept. Actuators 2022, 11, 223. [Google Scholar] [CrossRef]
- Bhakta, B. Novel Ice Protection System Suitable for Unmanned Aerial Vehicle Wing. Ph.D. Thesis, Cranfield University, Cranfield, UK, 1 February 2005. [Google Scholar]
- Muhammed, M.; Virk, M.S. Ice Accretion on Fixed-Wing Unmanned Aerial Vehicle—A Review Study. Drones 2022, 6, 863. [Google Scholar] [CrossRef]
- European Commission. JEDI ACE—Japanese-European De-Icing Aircraft Collaborative Exploration. Available online: https://cordis.europa.eu/project/id/314335 (accessed on 7 March 2024).
- European Commission. SENS4ICE—SENSors and Certifiable Hybrid Architectures FOR Safer Aviation in ICing Environment [Internet]. Available online: https://www.sens4ice-project.eu/ (accessed on 7 March 2024).
- European Commission. ICE GENESIS Environment. Available online: https://www.ice-genesis.eu/page/bm/ldo-101.php (accessed on 7 March 2024).
- Jiang, X.; Wang, Y. Studies on the Electro-Impulse De-Icing System of Aircraft. Aerospace 2019, 6, 67. [Google Scholar] [CrossRef]
- Airport Cooperative Research Program. Available online: https://www.skybrary.aero/sites/default/files/bookshelf/4867.pdf (accessed on 7 March 2024).
- Meggitt PLC. GAINS—Green Airframe Icing Novel Systems. Available online: https://www.meggitt.com/insights/new-tunes-to-break-the-ice/ (accessed on 7 March 2024).
- Liu, J.; Janjua, Z.A.; Roe, M.; Xu, F.; Turnbull, B.; Choi, K.S.; Hou, X. Super-Hydrophobic/Icephobic Coatings Based on Silica Nanoparticles Modified by Self-Assembled Monolayers. Nanomaterials 2016, 6, 232. [Google Scholar] [CrossRef]
- Liu, J.; Wang, J.; Memon, H.; Fu, Y.; Barman, T.; Choi, K.S.; Hou, X. Hydrophobic/Icephobic Coatings Based on Thermal Sprayed Metallic Layers with Subsequent Surface Functionalization. Surf. Coat. Technol. 2019, 357, 267–272. [Google Scholar] [CrossRef]
- Dassault Group. Falcon 7X—The Benchmark for the 21st Century Business Jet. Available online: https://www.dassaultfalcon.com/en/Aircraft/Models/7X/Pages/overview.aspx (accessed on 7 March 2024).
- Yeoh, S.S.; Rashed, M.; Sanders, M.; Bozhko, S. Variable-Voltage Bus Concept for Aircraft Electrical Power System. IEEE Trans. Ind. Electron. 2019, 66, 5634–5643. [Google Scholar] [CrossRef]
- Memon, H.; Liu, J.; De Focatiis, D.S.A.; Choi, K.; Hou, X. Intrinsic Dependence of Ice Adhesion Strength on Surface Roughness. Surf. Coat. Technol. 2020, 385, 125352. [Google Scholar] [CrossRef]
- Memon, H.; Liu, J.; Weston, N.; Wang, J.; De Focatiis, D.S.A.; Choi, K.; Hou, X. In-Situ Icing and Water Condensation Study on Different Topographical Surfaces. Cold Reg. Sci. Technol. 2019, 165, 102778. [Google Scholar] [CrossRef]
- Tenebre, P.; Six, M.-F. Anti-Icing/De-Icing System and Method and Aircraft Structure Incorporating This System. U.S. Patent 8,146,866, 3 April 2012. [Google Scholar]
- Endres, M.; Sommerwerk, H.; Mendig, C.; Sinapius, M.; Horst, P. Experimental Study of Two Electro-Mechanical De-Icing Systems Applied on a Wing Section Tested in an Icing Wind Tunnel. CEAS Aeronaut. J. 2017, 8, 429–439. [Google Scholar] [CrossRef]
- Budinger, M.; Pommier-Budinger, V.; Bennani, L.; Rouset, P.; Bonaccurso, E.; Dezitter, F. Electromechanical Resonant Ice Protection Systems: Analysis of Fracture Propagation Mechanisms. AIAA J. 2018, 56, 4412–4422. [Google Scholar] [CrossRef]
- Chang, S.; Tang, H.; Wu, H.; Su, X.; Lewis, A.; Ji, C. Three-Dimensional Modelling and Simulation of the Ice Accretion Process on Aircraft Wings. Int. J. Astronaut. Aeronaut. Eng. 2018, 3, 1–25. [Google Scholar]
- Royer, R.L., Jr.; Rose, J.L.; Smith, E.C.; Palacios, J.L. Ultrasonic Vibration System and Method for Removing/Avoiding Unwanted Build-Up on Structures. U.S. Patent 20100031972A1, 11 February 2010. [Google Scholar]
- Lamb, H. On Waves in an Elastic Plate. Proc. R. Soc. A 1917, 93, 114–128. [Google Scholar]
- Crawley, E.F.; Luis, J.D. Use of Piezoelectric Actuators as Elements of Intelligent Structures. AIAA J. 1987, 25, 1373–1385. [Google Scholar] [CrossRef]
- Henkel. Brochure: Structural Adhesive Solutions for Composite Repair. Henkel Corporation. Available online: https://dm.henkel-dam.com/is/content/henkel/brochure-structural-adhesive-solutions-composite-repair-loctite (accessed on 1 April 2024).
- Lu, Z.; Brennan, M.; Ding, H.; Chen, L. High-Static-Low-Dynamic-Stiffness Vibration Isolation Enhanced by Damping Nonlinearity. Sci. China Technol. Sci. 2019, 62, 1103–1110. [Google Scholar] [CrossRef]
- Kovacic, I.; Brennan, M.; Waters, T. A Study of a Non-Linear Vibration Isolator with Quasi-Zero Stiffness Characteristic. J. Sound Vib. 2008, 315, 700–711. [Google Scholar] [CrossRef]
- Bai, T.; Zhu, C.; Miao, B.; Li, K.; Zhu, C. Vibration De-Icing Method with Piezoelectric Actuators. J. Vibroeng. 2015, 17, 61–73. [Google Scholar]
- Di Placido, N.; Soltis, J.; Palacios, J. Enhancement of Ultrasonic De-Icing via Tone Burst Excitation. J. Aircr. 2016, 53, 1821–1829. [Google Scholar] [CrossRef]
- Budinger, M.; Pommier-Budinger, V.; Reysset, A.; Palanque, V. Electromechanical Resonant Ice Protection Systems: Energetic and Power Considerations. AIAA J. 2021, 59, 2590–2602. [Google Scholar] [CrossRef]
- Budinger, M.; Pommier-Budinger, V.; Napias, G.; Costa da Silva, A. Ultrasonic Ice Protection Systems: Analytical and Numerical Models for Architecture Tradeoff. J. Aircr. 2016, 53, 680–690. [Google Scholar] [CrossRef]
- Memmolo, V.; Moll, J. Investigation on Guided Waves Propagation Across Ice Layers. In Proceedings of the SPIE Health Monitoring of Structural and Biological Systems XIV Conference, Online, 11 May 2020; Volume 11381. [Google Scholar]
- Pierrick, R.; Pommier-Budinger, V.; Budinger, M. Electromechanical Resonant Ice Protection Systems: How to Favour Fractures Propagation. In Proceedings of the International Conference on Icing of Aircraft, Engines, and Structures, Minneapolis, MN, USA, 17–21 June 2019. [Google Scholar]
- Shi, Y.; Yu, J. Multimodal Shear Wave Deicing Using Fibre Piezoelectric Actuator on Composite for Aircraft Wings. IEEE/ASME Trans. Mechatron. 2018, 23, 2090–2098. [Google Scholar] [CrossRef]
- Zhu, Y.; Li, Q. Numerical Simulation and Experiment of the Piezoelectric De-Icing System. In Proceedings of the 3rd International Conference on Machinery, Materials and Information Technology Applications, Qingdao, China; 2015. [Google Scholar]
- MSC Nastran. Quick Reference Guide; MSC Software Corporation: Newport Beach, CA, USA, 2015; pp. 3442–3443. [Google Scholar]
- Xue, X.; Qiang, G.; Feng, Y.; Luo, T. Experimental Study on the Adhesion Strength of the Frozen Ice for Aircraft Moving Parts. Aerospace 2022, 9, 589. [Google Scholar] [CrossRef]
- Farahani, E.; Liberati, A.C.; Mahdavi, A.; Stoyanov, P.; Moreau, C.; Dolatabadi, A. Ice Adhesion Evaluation of PTFE Solid Lubricant Film Applied on TiO2 Coatings. Coatings 2023, 13, 1049. [Google Scholar] [CrossRef]
- Bleszynski, M.; Clark, E. Current Ice Adhesion Testing Methods and the Need for a Standard: A Concise Review. Standards 2021, 1, 117–133. [Google Scholar] [CrossRef]
- Work, A.; Lian, Y. A Critical Review of the Measurement of Ice Adhesion to Solid Substrates. Prog. Aerosp. Sci. 2018, 98, 1–26. [Google Scholar] [CrossRef]
- National Instruments. PXIe-5423 Specifications. Available online: https://www.ni.com/docs/en-US/bundle/pxie-5423-specs/page/specs.htmlt (accessed on 11 April 2024).
- National Instruments. PXIe 5105 Specifications. Available online: https://www.ni.com/docs/en-US/bundle/pxie-5105-specs/page/specs.html (accessed on 11 April 2024).
Figure 1.
Layout of the ice protection system installed on the slat element.

Figure 2.
Lamb waves: symmetric (top) and antisymmetric (bottom) modal shapes.

Figure 3.
Schematic of the domain to be protected.

Figure 4.
Finite element model of the slat integrated with piezoelectric disks and strain sensor patches.
Figure 4.
Finite element model of the slat integrated with piezoelectric disks and strain sensor patches.

Figure 5.
Radial mode of the piezoelectric actuator disk.

Figure 6.
Numerical procedure for the determination of the impact of the temperature variation on the dynamic response of the ice-protected system.
Figure 6.
Numerical procedure for the determination of the impact of the temperature variation on the dynamic response of the ice-protected system.

Figure 7.
Strain vs. frequency vs. temperature at sensor S1 without ice.

Figure 8.
Strain vs. frequency vs. temperature at sensor S1 with a 2 mm thick ice layer.

Figure 9.
Strain vs. frequency vs. ice thickness at sensor S1, at −20 °C.

Figure 10.
In-plane shear, τXY, and corresponding ISCCXY at −20 °C for 1 mm thick ice layer.

Figure 11.
Max in-plane shear and ISCC vs. temperature vs. ice thickness at all the sensors.

Figure 12.
Max out-of-plane shear and ISCC vs. temperature vs. ice thickness at all the sensors.


Figure 13.
Strain measured by the sensors vs. out-of-plane shear at the interface an ice layer 1 mm thick.
Figure 13.
Strain measured by the sensors vs. out-of-plane shear at the interface an ice layer 1 mm thick.

Figure 14.
Computational scheme implemented for the estimate of the effect of the phase delay.

Figure 15.
Max increase of in-plane shear and ISCC vs. temperature vs. ice thickness at all the sensors.
Figure 15.
Max increase of in-plane shear and ISCC vs. temperature vs. ice thickness at all the sensors.

Figure 16.
Max increase of out-of-plane shear and ISCC vs. temperature vs. ice thickness at all the sensors.
Figure 16.
Max increase of out-of-plane shear and ISCC vs. temperature vs. ice thickness at all the sensors.


Figure 17.
Shear in-plane component at 0-phase delay (left) and with the optimal phase delay (right) normalized with respect to the shear strength threshold of 0.638 MPa.
Figure 17.
Shear in-plane component at 0-phase delay (left) and with the optimal phase delay (right) normalized with respect to the shear strength threshold of 0.638 MPa.


Figure 18.
Shear out-of-plane component at 0-phase delay (left) and with the optimal phase delay (right) normalized with respect to the shear strength threshold of 0.638 MPa.
Figure 18.
Shear out-of-plane component at 0-phase delay (left) and with the optimal phase delay (right) normalized with respect to the shear strength threshold of 0.638 MPa.


Figure 19.
Schematic of the experimental setup organized in the refrigerator control room.

Figure 20.
Slat covered by the ice in the refrigerator control room.

Figure 21.
Setup block diagram; “L” and “R” and the numbers 1–6 refer to the left and right actuator disks and to the six sensors, respectively.
Figure 21.
Setup block diagram; “L” and “R” and the numbers 1–6 refer to the left and right actuator disks and to the six sensors, respectively.

Figure 22.
Maximum strain measured by the sensors at 0-phase delay: numerical predictions (blue) and experimental outcomes (red).
Figure 22.
Maximum strain measured by the sensors at 0-phase delay: numerical predictions (blue) and experimental outcomes (red).

Figure 23.
Maximum strain increase measured by the sensors for the optimal phase delay: numerical predictions (blue) and experimental outcomes (red).
Figure 23.
Maximum strain increase measured by the sensors for the optimal phase delay: numerical predictions (blue) and experimental outcomes (red).


| Ice Prevention/ Removal System | Advantages | Disadvantages | Power Consumption (kW/m2) | Weight (kg/m2) | References |
|---|---|---|---|---|---|
| Fluid | Effective for both preventing and removing ice. Applicable to any surface. It can be cooled and used with various energy sources. | It can freeze or contaminate. It can affect surface aerodynamics. | 0.5–2 | 0.5–2 | [11,12,13] |
| Hot Air | Reliable for continuous ice protection. | It can cause thermal and fatigue on the surface. It can increase fuel consumption and emissions. It takes longer to remove ice. | 10–20 | 13 | [14,15,16,17,18] |
| Thermoelectrical | Versatile and manageable, it can utilize electricity from a multitude of sources. Prone to use various configurations of heating elements. | It requires high electrical power and insulation. It can cause arcing and sparks and affect the structural integrity of composite materials. | 5–15 | 0.5–1.5 | [19,20,21,22,23] |
| Electromagnetic Actuator | It can prevent and remove ice. It is capable of utilizing electrical power at various frequencies. | It can cause electromagnetic interference. It can affect the durability of the embedded metallic mesh in the material. | 10–30 | 0.1–0.5 | [24,25] |
| Electrohydraulic Actuator | Efficient and cost-effective; it can mechanically remove ice. It has the capability to harness hydraulic power from the engine or alternative sources. | It requires periodic activation and maintenance. It can cause noise and vibrations and affect the quality of the components. | 1–5 | 1–4 | [26] |
| Shape Memory Alloy Actuator | It can mechanically remove ice through shape alteration or torsional motion. It is capable of functioning with direct thermal input or through the Joule effect. | It requires accurate design and calibration. It can cause fatigue issues. It can affect the aerodynamic performance of the surface. | 0.5–2 | 0.5–2 | [27,28] |
| Piezoelectric Actuator | It can mechanically remove ice by generating vibrations or shear waves. It is capable of operating with low electrical power consumption. Prone to use various configurations of vibrating elements. Particularly compliant to full electric aircraft or hybrid aircraft configurations | It can require complex control and actuation systems. It can cause structural damage or cracks. | 1.1–1 | 0.05–0.5 | [29,30] |
| Hydrophobic Coatings | It can prevent ice formation and/or facilitate detachment under aerodynamic loads or in synergy with active systems | It can lose effectiveness over time, due to weathering or other factors | Depends on the composition: from 0.010 to 0.200 kg/m2 | Depends on the type and thickness of the coating: from 0.05 to 0.5 kg/m2 | [31,32] |
Table 2.
Coordinates of the transducers installed on the slat element.
| Item | Curvilinear Abscissa, s (m) | Span Wise Coordinate, x (m) |
|---|---|---|
| Left actuator disk | 0.080 | 0.065 |
| Right actuator disk | 0.080 | −0.065 |
| Sensor S1 | 0.149 | 0 |
| Sensor S2 | 0.161 | 0.065 |
| Sensor S3 | 0.173 | 0.105 |
| Sensor S4 | 0.221 | 0 |
| Sensor S5 | 0.241 | −0.122 |
| Sensor S6 | 0.262 | 0 |
Table 3.
Summary of the ice protection system works, based on piezoelectric technologies.
| Main Features of the Protected Element | Environment | De-Icing System | Actuator | Excitation Frequency | Voltage | Phase | Ice | Reference |
|---|---|---|---|---|---|---|---|---|
|
|
| 10 PZTs inner side leading edge placed next to spar and next to the tip | 1 kHz | −250–750 V | The actuators next to the tip are in opposite phase to the ones next to the spar |
| [51] |
| Freezer at temperatures in the range −20 °C, −15 °C | 6 PZTs, 20 × 20 × 1 mm | Sweep (100, 6000) Hz | 200 Vpp | Purified water poured in patches 20 × 20 mm and 2 or 6 mm thick | [60] | ||
| PZT 3.81 cm | Burst 67.5 kHz with 0.55 kHz variation | 24 patches of freezer ice | [61] | ||||
| Plate 154 × 52 × 1.5 mm | Freezer | Analytical and numerical model of fracture propagation | 1 PZT, 50 × 25 × 0.5 mm | 10, 15, and 26 kHz | 2/4 mm glaze ice | [62] | ||
| Clamped Plate 290 × 200 × 1.5 mm | Freezer | Compare different architectures | Langevin PZT |
| 150–180 | 2 mm glaze ice | [63] | |
| Fiberglass plate | Climate chamber | Guided waves for ice detection | 1 PZT | [64] | ||||
|
|
|
|
| Glaze ice | [65] | ||
| Prepreg Plate 175 × 45 × 2 mm | Freezer | PZT | 990 Hz | 10 Vpp | 1.5 mL frozen water | [66] | ||
| Freezer | 650 V | [67] |
Table 4.
Main features of the model.
| FE Features | Slat Material | Piezo Actuators | Piezo Sensors |
|---|---|---|---|
| 255,112 solid elements; 624,311 3-dof nodes | Type: 7075 T6 Aluminum alloy; Young’s modulus: 70 GPa; Poisson ratio: 0.32; Density: 2750 kg/m3; | Number: 2 disks | Number: 6 disks |
| Thickness: 0.8 mm | Thickness: 2.5 mm | Thickness: 0.3 mm | |
| Diameter: 50 mm | Diameter: 10 mm | ||
| Piezoelectric characteristics: Table 5 | |||
Table 5.
Main features of the piezoelectric materials of the actuator and sensors.
| Transducer | Type of Material | Young’s Modulus, Poisson Ratio | Density | Piezoelectric Charge Constants | Piezoelectric Voltage Constants |
|---|---|---|---|---|---|
| Actuator disks | Pz26 | YE, 77.0 GPa ν, 0.334 | ρ, 7700 kg/m3 | −1.28 × 10⁻¹⁰ C/N 3.28 × 10⁻¹⁰ C/N | −10.9 × 10⁻³ Vm/N 28.0 × 10⁻³ Vm/N |
| Sensor disks | PIC155 | YE, 56.6 GPa ν, 0.334 | ρ, 7800 kg/m3 | −1.65 × 10⁻¹⁰ C/N 3.60 × 10⁻¹⁰ C/N | −12.9 × 10⁻³ Vm/N 27.0 × 10⁻³ Vm/N |
Table 6.
Ratio of the operational range areas for the optimal phase delay over the 0-phase delay.
| Sensor | Ratio for In-Plane Shear | Ratio for Out-of-Plane Shear |
|---|---|---|
| S1 | 12.77% | 52.01% |
| S2 | 100.62% | 316.89% |
| S3 | 260.01% | 62.32% |
| S4 | - | 8.80% |
| S5 | 31.48% | 13.85% |
| S6 | 3.08% | 0.01% |
Table 7.
Equipment used to generate and acquire signals.
| Equipment | Number of Channels | Maximum Output Overload | Max Sample Frequency |
|---|---|---|---|
| PXIe 5423 generator | 2 | 12.0 Vpp | 40.0 MHz |
| PXIe 5105 oscilloscope | 8 | 6.0 V | 60.0 MHz |
Disclaimer/Publisher’s Note: The statements, opinions and data contained in all publications are solely those of the individual author(s) and contributor(s) and not of MDPI and/or the editor(s). MDPI and/or the editor(s) disclaim responsibility for any injury to people or property resulting from any ideas, methods, instructions or products referred to in the content. |
© 2024 by the authors. Licensee MDPI, Basel, Switzerland. This article is an open access article distributed under the terms and conditions of the Creative Commons Attribution (CC BY) license (https://creativecommons.org/licenses/by/4.0/).
Share and Cite
MDPI and ACS Style
Ameduri, S.; Concilio, A.; Brindisi, A.; Galasso, B. An Ice Protection System Based on Phased Piezoelectric Transducers. Actuators 2024, 13, 158. https://doi.org/10.3390/act13050158
AMA Style
Ameduri S, Concilio A, Brindisi A, Galasso B. An Ice Protection System Based on Phased Piezoelectric Transducers. Actuators. 2024; 13(5):158. https://doi.org/10.3390/act13050158
Chicago/Turabian StyleAmeduri, Salvatore, Antonio Concilio, Angela Brindisi, and Bernardino Galasso. 2024. "An Ice Protection System Based on Phased Piezoelectric Transducers" Actuators 13, no. 5: 158. https://doi.org/10.3390/act13050158
Note that from the first issue of 2016, this journal uses article numbers instead of page numbers. See further details here.