
Polymorphisms of CYP7A1 and HADHB Genes and Their Effects on Milk Production Traits in Chinese Holstein Cows


1
Department of Animal Genetics and Breeding, College of Animal Science and Technology, Key Laboratory of Animal Genetics, National Engineering Laboratory for Animal Breeding, State Key Laboratory of Animal Biotech Breeding, China Agricultural University, Breeding and Reproduction of Ministry of Agriculture and Rural Affairs, Beijing 100193, China
2
Beijing Jingwa Agricultural Innovation Center, Beijing 100193, China
*
Author to whom correspondence should be addressed.
Animals 2024, 14(9), 1276; https://doi.org/10.3390/ani14091276
Submission received: 8 April 2024
/
Revised: 21 April 2024
/
Accepted: 22 April 2024
/
Published: 24 April 2024
(This article belongs to the Collection Advances in Cattle Breeding, Genetics and Genomics)
Abstract
:Simple Summary
This study aimed to identify genetic variants related to differences in milk production in Chinese Holstein cows. By analyzing specific genes involved in lipid metabolism, researchers identified variants linked to the milk, fat, and protein yield cows produce over time. They also found patterns in these genetic variations that could affect how the genes work together. The results of this study suggest that these genetic markers could be useful for selecting cows with better milk-production traits. Additionally, the findings could help scientists better understand how these genes influence milk production, potentially leading to improved strategies for breeding dairy cattle. Overall, this research provides valuable insights into enhancing milk production in dairy farming, which could ultimately benefit both farmers and consumers.
Abstract
Our preliminary research proposed the cytochrome P450 family 7 subfamily A member 1 (CYP7A1) and hydroxyacyl-coenzyme A dehydrogenase trifunctional multienzyme complex beta subunit (HADHB) genes as candidates for association with milk-production traits in dairy cattle because of their differential expression across different lactation stages in the liver tissues of Chinese Holstein cows and their potential roles in lipid metabolism. Hence, we identified single-nucleotide polymorphisms (SNPs) of the CYP7A1 and HADHB genes and validated their genetic effects on milk-production traits in a Chinese Holstein population with the goal of providing valuable genetic markers for genomic selection (GS) in dairy cattle, This study identified five SNPs, 14:g.24676921A>G, 14:g.24676224G>A, 14:g.24675708G>T, 14:g.24665961C>T, and 14:g.24664026A>G, in the CYP7A1 gene and three SNPs, 11:g.73256269T>C, 11:g.73256227A>C, and 11:g.73242290C>T, in HADHB. The single-SNP association analysis revealed significant associations (p value ≤ 0.0461) between the eight SNPs of CYP7A1 and HADHB genes and 305-day milk, fat and protein yields. Additionally, using Haploview 4.2, we found that the five SNPs of CYP7A1 formed two haplotype blocks and that the two SNPs of HADHB formed one haplotype block; notably, all three haplotype blocks were also significantly associated with milk, fat and protein yields (p value ≤ 0.0315). Further prediction of transcription factor binding sites (TFBSs) based on Jaspar software (version 2023) showed that the 14:g.24676921A>G, 14:g.24675708G>T, 11:g.73256269T>C, and 11:g.73256227A>C SNPs could alter the 5′ terminal TFBS of the CYP7A1 and HADHB genes. The 14:g.24665961C>T SNP caused changes in the structural stability of the mRNA for the CYP7A1 gene. These alterations have the potential to influence gene expression and, consequently, the phenotype associated with milk-production traits. In summary, we have confirmed the genetic effects of CYP7A1 and HADHB genes on milk-production traits in dairy cattle and identified potential functional mutations that we suggest could be used for GS of dairy cattle and in-depth mechanistic studies of animals.
1. Introduction
Milk, often referred to as “white gold”, plays a pivotal role as a rich source of essential nutrients supporting growth, bone-mass accrual, and immune function, containing proteins, fats, carbohydrates, minerals, and vitamins [1]. The surge in demand for high-quality dairy products is attributed to factors like global population growth, increasing income levels, and shifting dietary preferences [2]. This change in demand is particularly pronounced in developing regions, notably in Asia and Africa. Enhancing yield and quality traits represent paramount objectives for dairy breeding, necessitating the implementation of effective breeding strategies such as genomic selection (GS) to optimize these characteristics.
GS facilitates early and precise selection of young bulls and reserve heifers without relying on phenotypic data, thereby shortening the dairy breeding cycle from 5–6 years to about 2 years. By significantly reducing generation intervals, this approach lowers breeding costs and accelerates genetic progress. Therefore, improved accuracy in GS is crucial for the development of improved breeding strategies [3]. Single-nucleotide polymorphisms (SNPs), which are prevalent in genomic regions like promoters or enhancers, serve as primary genetic markers. They impact gene expression by altering how regulatory proteins bind or how chromatin is structured, thus affecting protein structure, RNA splicing [4], and miRNA binding [5]. They are crucial in influencing pathways associated with milk synthesis and lactation [6,7,8,9]. Integrating functional SNPs into genomic-selection chips can enhance the efficiency, accuracy, and sustainability of selection [10], leading to improved milk-production traits in cows.
The rapid development of -omics technology has facilitated the process of functional-gene/locus mining. Our preliminary research proposed that the cytochrome P450 family 7 subfamily A member 1 (CYP7A1) and hydroxyacyl-coenzyme A dehydrogenase trifunctional multienzyme complex beta subunit (HADHB) genes are differentially expressed in different lactation stages in dairy cows and are involved in lipid metabolism [11]. The CYP7A1 gene encodes cholesterol 7 alpha-hydroxylase, the rate-limiting enzyme in the classic pathway of bile-acid synthesis in the liver [12]. Bile acids are integral to processes such as lipid digestion, absorption, and excretion, as well as to the regulation of cholesterol homeostasis and metabolic pathways. The HADHB gene encodes hydroxyacyl-CoA dehydrogenase, a vital component of the mitochondrial trifunctional protein (MTP) complex, which is responsible for catalyzing the final three steps of mitochondrial beta-oxidation of long-chain fatty acids [13]. Furthermore, the CYP7A1 gene is positioned within the quantitative trait loci (QTL) QTL_ID: 2732 and QTL_ID: 3408, which have been demonstrated to affect milkfat yield and percentage and milk protein percentage [14,15,16]. HADHB is situated within the QTL region related to milk yield (QTL_ID: 1512) and is approximately 11.8 kb from the SNP rs110711742, which is associated with milk yield [17]. These findings suggest a potential association between CYP7A1 and HADHB and milk-production traits.
This study investigates the genetic associations between candidate genes CYP7A1 and HADHB and milk-production traits in dairy cattle, including 305-day milk yield, fat yield, fat percentage, protein yield, and protein percentage. Additionally, predictive analyses were used to assess the regulatory effects of SNPs, particularly the effects on transcription factor binding sites (TFBSs) and mRNA stability, offering insights to support further exploration of causal mutations and their potential applications to developing GS chips for the breeding of dairy cattle.
2. Materials and Methods
2.1. Animal Selection and Phenotypic Data Collection
We selected 898 dairy cows from 45 Chinese Holstein sire families on 22 farms in Beijing Sunlon Livestock Development Co., Ltd. (Beijing, China) as the experimental population. The 45 bulls were used for SNP identification, and 898 cows were used for association analysis (898 cows in the first lactation and 611 in the second lactation). Each sire family had an average of 21 daughters, and each cow had three generations of pedigree information and Dairy Herd Improvement (DHI) records that were provided by the Beijing Dairy Cattle Centre (Beijing, China) (Table S1). The cows in each sire family were distributed across various dairy farms and were maintained with the same feeding conditions. Data consisted of the milk-production phenotype of each cow for the whole lactation period of the parity, which comprised 305-day milk yield, fat yield, fat percentage, protein yield, and protein percentage. The study was conducted in accordance with Guide for the Care and Use of Laboratory Animals and was approved by the Institutional Animal Care and Use Committee (IACUC) at China Agricultural University (Beijing, China).
2.2. Genomic DNA Extraction
The frozen semen of 45 bulls and blood samples from 898 cows were provided by Beijing Dairy Cattle Center (Beijing, China). We extracted genomic DNA from the semen using the salting-out procedure and used a TIANamp Blood DNA Kit (Tiangen, Beijing, China) to extract DNA from the blood samples. The quantity and quality of extracted DNA were determined by a NanoDrop2000 spectrophotometer (Thermo Science, Hudson, NH, USA) and gel electrophoresis (1.5%), respectively.
2.3. Identification and Genotyping of SNPs in Candidate Genes
According to the genomic sequences of the two genes, CYP7A1 (NC_037341.1) and HADHB (NC_037338.1) of Bos taurus in Genbank, primers were designed using Primer3.0 (https://bioinfo.ut.ee/primer3-0.4.0/ (accessed on 8 September 2021)). They were then synthesized by Beijing Liuhe Bgi Co., Ltd. (Beijing, China). The primers covered the entire coding region and 2000 base pairs upstream and downstream of the regulatory regions of the genes. The DNA samples from semen were diluted to 50 ng/µL and used for PCR amplification (Table S2). PCR products were analyzed by 2% gel electrophoresis, and the qualified products were sequenced bidirectionally by Beijing Qingke Xinye Biotechnology Co., Ltd. (Beijing, China). Then, the sequences were aligned to the reference sequence (ARS-UCD1.2) using NCBI-blast (https://blast.ncbi.nlm.nih.gov/Blast.cgi (accessed on 20 November 2023)) to identify SNPs. Subsequently, we genotyped the SNPs in the 898 cows using Genotyping by Target Sequencing (GBTS) technology by Boruidi Biotechnology Co., Ltd. (Shijiazhuang, China). The allelic and genotypic frequencies were calculated, and the Hardy−Weinberg equilibrium was tested by the chi-squared test.
2.4. Linkage Disequilibrium (LD) Estimation
The extent of LD between the identified SNPs was estimated using Haploview 4.2 (Broad Institute of MIT and Harvard, Cambridge, MA, USA), with the solid spine algorithm. The haplotype block with a frequency greater than 0.05 was retained. The extent of LD is measured by the D′ value, to which it is proportional.
2.5. Association Analysis between SNP/Haplotype and Milk-Production Traits
The MIXED procedure in SAS 9.4 software (SAS Institute Inc., Cary, NC, USA) was used to perform association analysis between the SNP or haplotype block and the five milk-production traits (305-day milk yield, fat yield, fat percentage, protein yield and protein percentage) using the following animal model:
where y is the phenotypic value of each trait of each cow; μ is the overall mean; HYS is the fixed effect of farm (1–22: 22 farms), calving year (1–4: 2012–2015) and calving season (1: April–May; 2: June–August; 3: September–November and 4: December–March); M is the age at calving as a covariant, b is the regression coefficient of covariant M; G is the genotype or haplotype combination effect; a is the individual random additive genetic effect with a distribution of ; A is a pedigree-based relationship matrix with an additive genetic variance of ; and e is the random residual with a distribution of , where I is the unit matrix and is the residual variance. A Bonferroni correction was carried out by multiple tests with a significance level equal to the original p value divided by the number of genotype or haplotype combinations.
Furthermore, the additive, dominant, and allelic substitution effects of the SNPs were calculated by the following formulas:
where a is the additive effect; d is the dominant effect; α is the allelic substitution effect; , and are the least-squares means of milk-production traits for the corresponding genotypes; p is the frequency of allele A; and q is the frequency of allele B.
2.6. Prediction of Transcription Factor Binding Sites
We used Jaspar (http://jaspar.genereg.net/ (version 2023)) software to predict whether SNPs in the 5′ flanking region of CYP7A1 and HADHB genes changed the transcription factor binding sites (TFBS) (relative score ≥ 0.80).
2.7. Prediction of mRNA Structure
We used the NCBI database (https://blast.ncbi.nlm.nih.gov/ (accessed on 20 November 2023)) to query for synonymy or missense mutations on exons. Subsequently, we used RNAfold WebServer (http://rna.tbi.univie.ac.at/cgi-bin/RNAWebSuite/RNAfold.cgi (accessed on 20 November 2023)) to predict the changes to the RNA secondary structure caused by the mutation in the untranslated region, with the parameters of minimum free energy (MFE), partition function, and avoidance of isolated base pairs. MFE was used for a direct comparison of the folding stability of RNAs of the same sizes; the smaller the MFE, the greater the stability.
3. Results
3.1. SNPs Identification
We identified five SNPs in the CYP7A1 gene and three in the HADHB gene in 898 dairy cows from 45 Chinese Holstein sire families on 22 farms. In CYP7A1, 14:g.24676921A>G (rs42765357), 14:g.24676224G>A (rs109454495) and 14:g.24675708G>T (rs42765359) were located in the 5′ flanking region; 14:g.24665961C>T (rs108958186), was found in the 3′ untranslated region (UTR); and 14:g.24664026A>G (rs109680813) was found in the 3′ regulatory region. In HADHB, 11:g.73256269T>C (rs110033443) was located in the 5′ flanking region, 11:g.73256227A>C (rs134856746) in the 5′ UTR, and 11:g.73242290C>T (rs137211407) in the intron between exons 5 and 6. The genotypic and allelic frequencies of all the identified SNPs are summarized in Table 1.
3.2. Single-Marker Association Analysis
The results of the association analysis (Table 2) showed that 14:g.24665961C>T, in CYP7A1, was significantly associated with milk yield (p value = 0.0443) and fat yield (p value ≤ 0.0001) in the first lactation period; four SNPs, 14:g.24676921A>G, 14:g.24676224G>A, 14:g.24675708G>T, and 14:g.24665961C>T, were significantly associated with milk, fat and protein yields (p value ≤ 0.0059) and 14:g.24664026A>G was highly significantly associated with fat yield (p value = 0.0037) in the second lactation.
In HADHB, all three SNPs, 11:g.73256269T>C, 11:g.73256227A>C, and 11:g.73242290C>T, were significantly associated with milk and protein yields in the first lactation (p value ≤ 0.0461) and with milk, fat, and protein yields in the second lactation (p value ≤ 0.001). Additionally, the results of the additive, dominant, and allelic substitution effects were shown in Table 3.
3.3. Haplotype Association Analysis
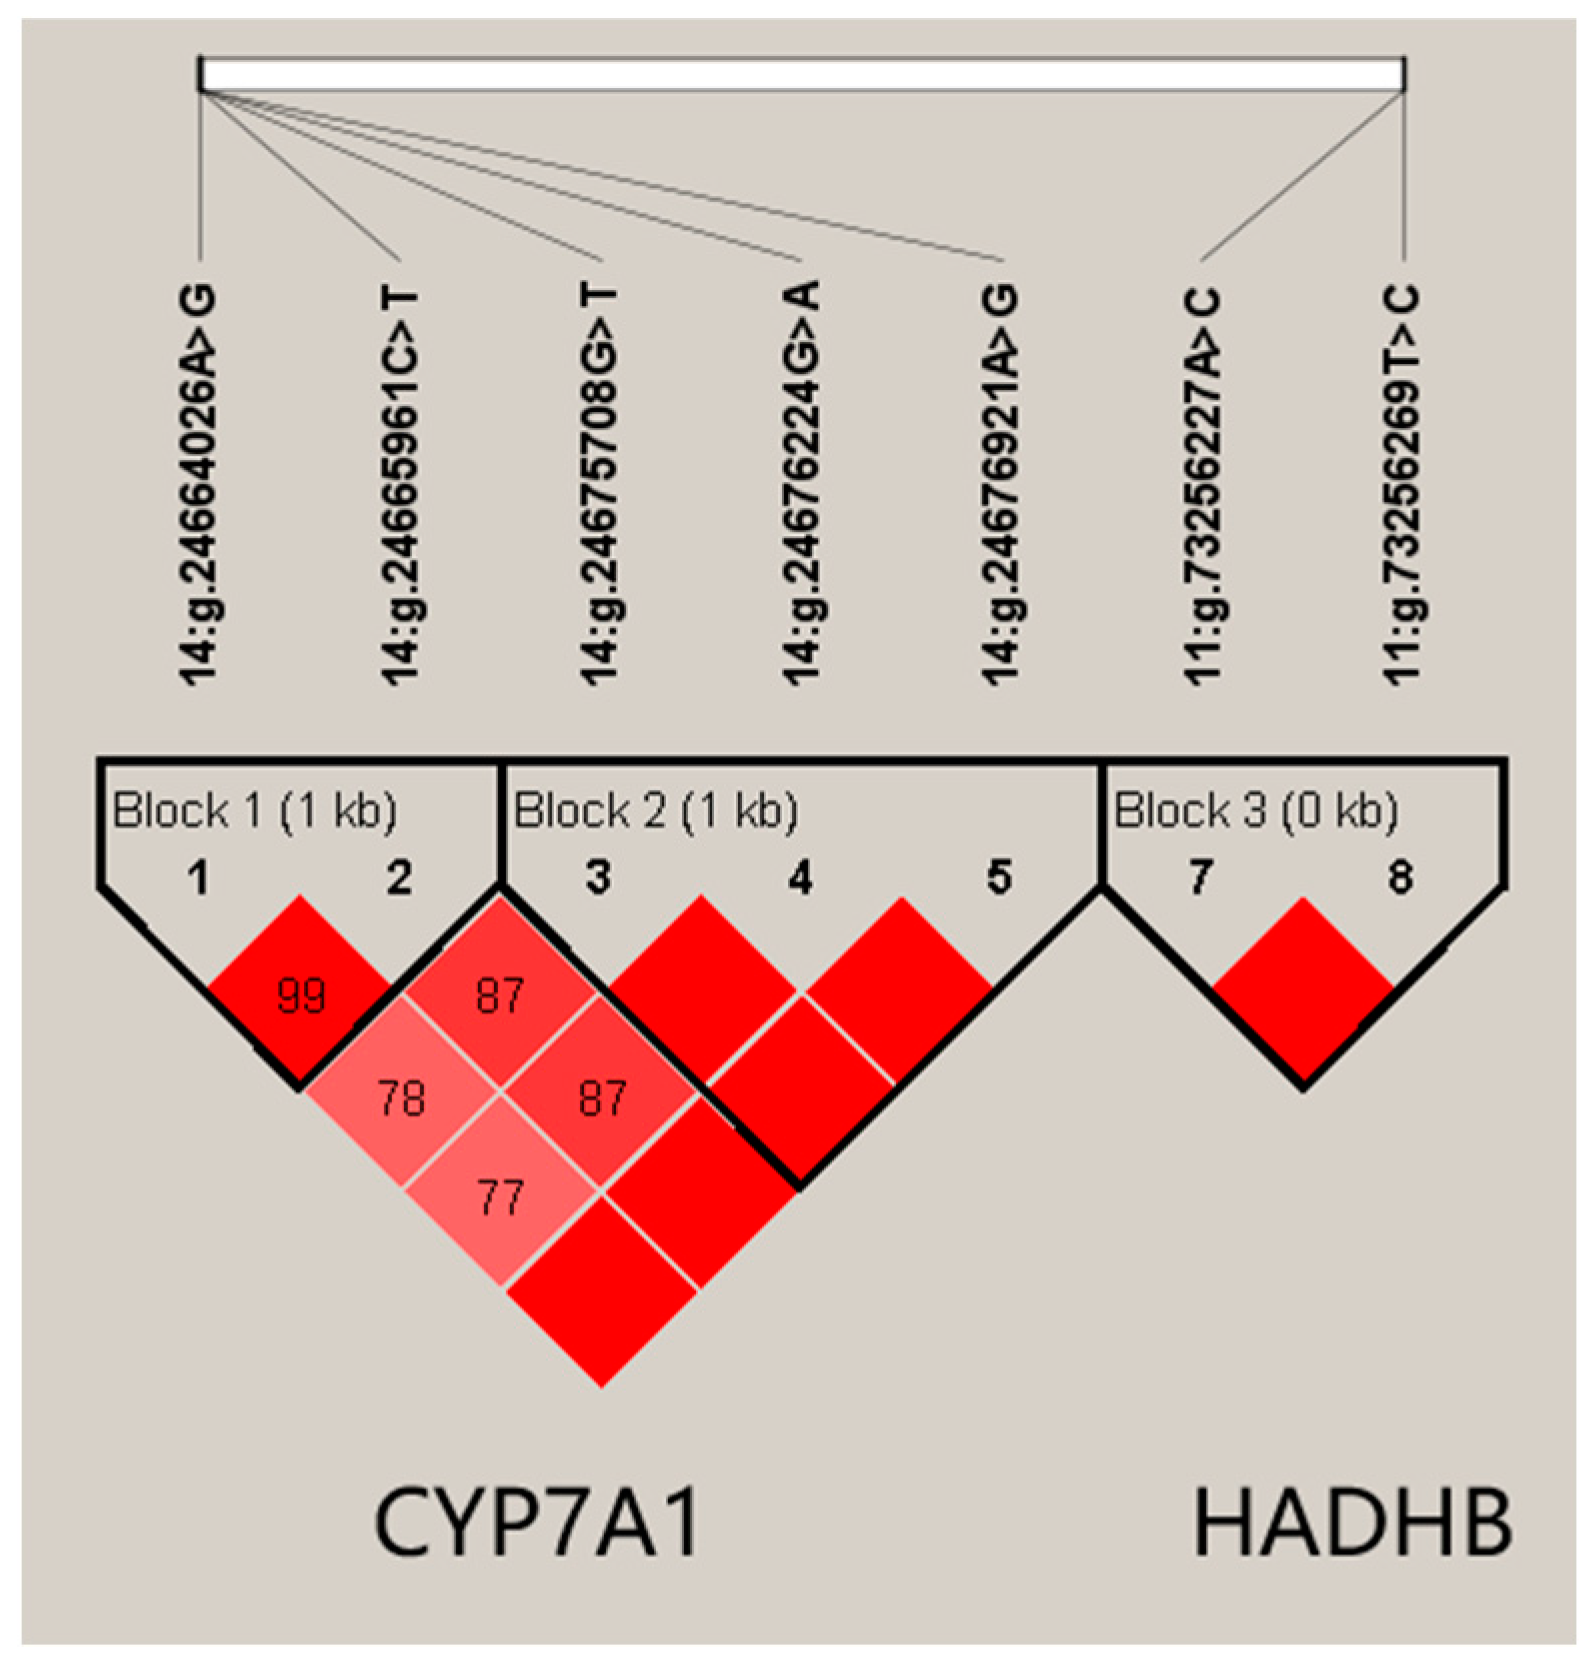
Using Haploview 4.2, five SNPs in CYP7A1, 14:g.24675708G>T, 14:g.24676224G>A, 14:g.24676921A>G, 14:g.24665961C>T and 14:g.24664026A>G, formed two haplotype blocks (Figure 1). In Block 1, the frequencies of haplotypes H1 (AC), H2 (GT) and H3 (AT) were 0.463, 0.342, and 0.194, respectively. Block 2 was composed of three haplotypes, H1 (TGA), H2 (GAG), and H3 (TGG), with frequencies of 0.349, 0.545, and 0.105, respectively. We found that the two blocks in CYP7A1 were significantly associated with milk, fat, and protein yields in both lactations (p value ≤ 0.0011; Table 4).
Similarly, two SNPs, 11:g.73256269T>C and 11:g.73256227A>C, in HADHB formed Block 3 (Figure 1). The frequencies of haplotypes H1 (AT), H2 (CC), and H3 (CT) were 0.159, 0.806, and 0.035, respectively. This block was found to be associated with milk, fat, and protein yields in the first lactation (p value ≤ 0.0315), and milk, fat, and protein yields in the second lactation (p value ≤ 0.0052; Table 4).
3.4. Changes of Transcription Factor Binding Sites Caused by SNPs in 5′ Region
Using the JASPAR, changes in TFBS were predicted for four SNPs in the 5′ regulatory region of the CYP7A1 and HADHB genes. As a result, it was found that, in CYP7A1, the allele G of 14:g.24676921A>G created a binding site (BS) for transcription factors (TFs) EBF1 and SP1, while the mutation from G to T of 14:g.24675708G>T eliminated the BS for ELK1 but created a BS for FOXC1 and ZNF354C. For HADHB, before and after mutation, 11:g.73256269T>C resulted in the disappearance of the BS for PAX2 and NR2F1 and the appearance of that for TFAP2A; in addition, the allele A of 11:g.73256227A>C created a BS for ZNF354C and allele C created a BS for HINFP (Table 5).
3.5. mRNA Structural Stability Altered by the Mutation in Untranslated Region
Using RNAfold, changes in the mRNA minimum free energy (MFE) were predicted. The mutation of C to T in SNP 14:g.24665961C>T causes the MFE of mRNA to change from −578.10 kcal/mol to −539.20 kcal/mol, resulting in a decrease in the structural stability of CYP7A1 mRNA.
4. Discussion
The CYP7A1 and HADHB genes have been implicated in milk-production traits in dairy cows, as indicated by recent research studies. CYP7A1 is known to influence triglyceride and cholesterol metabolism in the liver tissue of dairy cows and is a rate-limiting enzyme for bile-acid synthesis [18]; in chickens, HADHB plays a crucial role in liver lipid metabolism, particularly in inducing peroxisomal and mitochondrial β-oxidation activity [19]. These findings affirm the possible beneficial influence of these genes on milk production. Here, further identification of SNPs in the CYP7A1 and HADHB genes and analysis of their association with milk-production traits in dairy cows provide valuable information for understanding the mechanism of inheritance of these traits and linking the metabolic functions of these genes to their phenotypic effects. Furthermore, the integration of significant genetic sites from the CYP7A1 and HADHB genes into GS models can facilitate more precise selection of individuals with favorable milk-production traits. The purpose of these models is to predict the genetic advantage of the trait of interest based on the SNP profile of the individual, such that breeders can screen individuals for specific genetic variants associated with particular milk-production phenotypes, select them for breeding, and thus improve the efficiency of breeding.
In this study, we identified SNPs in the CYP7A1 and HADHB genes and confirmed their significant associations with milk-production traits in dairy cows. SNPs can cause phenotypic variation by affecting the function or expression of genes involved in various biological processes [20,21,22,23]. This study did find significant differences in the milk-production phenotypes of cows with different SNP sites in the CYP7A1 and HADHB genes. The number of individual cows with lower phenotypic values was also smaller, possibly because individuals of genotypes with higher-production phenotypes had been selected for while those with lower-production phenotypes had been eliminated during artificial breeding over the long term [24]. In addition, the phenotypic values of the cows and the significance of SNP/haplotype block associations were lower in the first lactation than in the second lactation. This difference could be explained by either of two possible causes. First, the varying numbers of cows in the two lactation periods may impact the statistical significance of the corresponding results. Second, there are physiological differences between the two lactation periods, as dairy cows tend to produce more milk in their second lactation [25].
Transcription factors are proteins that bind to specific DNA sequences and modulate the expression of target genes involved in various biological processes [26]. In this study, we found changes in TFBSs caused by SNPs in the 5′ flanking regions of the CYP7A1 and HADHB genes. These changes may result in altered regulation of gene expression by TFs, affecting the participation of the corresponding expression products in normal physiological and metabolic activities and thus, in turn, contributes to changes in milk production. For instance, in HADHB, TFAP2A is a specific nuclear transcription factor that may promote cell proliferation by positively regulating certain cell-proliferation-associated proteins such as EIA, SV40, and c-myc [27]. This TF binding with 11:g.73256269C may promote expression of the CYP7A1 gene and explain the significantly higher milk, fat and protein yields in the cows with genotype CC compared to those with genotype TT in the second lactation. Conversely, ZNF354C binds to form a number of transcriptional-repression complexes that inhibit the transcription of the intended target genes [28]. Binding of the HDAHB gene to this TF at 11:g.73256227A may result in the repression of its expression, which may have contributed to the significantly lower production of milk, fat, and milk proteins by the individuals with genotype AA than by those with CC in the second lactation.
Although the region is situated within gene exons, the term “untranslated region” (UTR) refers to the non-coding segment located at the mRNA molecule’s terminus. Consequently, SNPs found within the UTR do not exert a direct influence on transcription and translation processes and are typically regarded as neutral variants. However, despite their lack of direct impact on encoded proteins, such SNPs in UTRs may change the mRNA’s minimum free energy, leading to reduced mRNA stability. The synonymous mutation 14:g.24665961C>T, located in the untranslated region of the CYP7A1 gene, reduces mRNA stability, resulting in reduced efficiency of transcription and translation of this gene, possibly affecting triglyceride and cholesterol metabolism [29,30], which may explain why the amount of milkfat yield in second lactation was significantly higher in the individuals with the genotype CC than in those with the genotype TT at the SNP site 14:g.24665961C>T.
5. Conclusions
This study identified polymorphisms in the CYP7A1 and HADHB genes and their significant genetic effects on milk-production traits in Chinese Holstein cows, offering genetic markers for GS of dairy cattle; thus, four SNPs that altered TFBSs, 14:g.24676921A>G, 14:g.24675708G>T, 11:g.73256269T>C, and 11:g.73256227A>C, were proposed as possible causative mutations for the formation of milk-production traits. Further in-depth verification is needed before these SNPs can be used to provide genetic information to support the breeding of dairy cattle.
Supplementary Materials
The following supporting information can be downloaded at: https://www.mdpi.com/article/10.3390/ani14091276/s1, Table S1: Descriptive statistics of phenotypic values for dairy production traits in two lactations; Table S2: Primers and procedures for PCR used in SNPs identification of CYP7A1 and HADHB genes.
Author Contributions
B.H. and D.S. conceived and designed the experiments, L.X. prepared the DNA samples for SNP identification and genotyping, A.C., Q.Y., W.Y. and Y.W. analyzed the data, and the manuscript was prepared by A.C. and B.H. All authors have read and agreed to the published version of the manuscript.
Funding
This work was financially supported by the STI 2030-Major Projects (2023ZD04069); the National Key R&D Program of China (2021YFF1000700); the National Natural Science Foundation of China (32072716); Beijing Digital Agriculture Innovation Consortium Project (BAIC10-2023); the Program for Changjiang Scholar and Innovation Research Team in University (IRT_15R62); Youth Elite Development Program of College of Animal Science and Technology, China Agricultural University, China Agricultural University; China Agriculture Research System of MOF and MARA (CARS-36).
Institutional Review Board Statement
The animal study protocol was approved by the Institutional Animal Care and Use Committee (IACUC) at China Agricultural University (protocol code DK996).
Informed Consent Statement
Not applicable.
Data Availability Statement
The datasets generated and/or analyzed during the current study are available in the article and its Supplementary Materials.
Acknowledgments
We appreciate Beijing Dairy Cattle Center for providing the samples (semen and blood) and the corresponding phenotypic data.
Conflicts of Interest
The authors declare that they have no competing interest.
References
- Pereira, P.C. Milk nutritional composition and its role in human health. Nutrition 2014, 30, 619–627. [Google Scholar] [CrossRef]
- Khaw, K.-T.; Friesen, M.D.; Riboli, E.; Luben, R.; Wareham, N. Plasma phospholipid fatty acid concentration and incident coronary heart disease in men and women: The EPIC-Norfolk prospective study. PLoS Med. 2012, 9, e1001255. [Google Scholar] [CrossRef]
- Vignal, A.; Milan, D.; SanCristobal, M.; Eggen, A. A review on SNP and other types of molecular markers and their use in animal genetics. Genet. Sel. Evol. 2002, 34, 275–305. [Google Scholar] [CrossRef] [PubMed]
- Lalonde, E.; Ha, K.C.; Wang, Z.; Bemmo, A.; Kleinman, C.L.; Kwan, T.; Pastinen, T.; Majewski, J. RNA sequencing reveals the role of splicing polymorphisms in regulating human gene expression. Genome Res. 2011, 21, 545–554. [Google Scholar] [CrossRef] [PubMed]
- Gong, J.; Tong, Y.; Zhang, H.M.; Wang, K.; Hu, T.; Shan, G.; Sun, J.; Guo, A.Y. Genome-wide identification of SNPs in microRNA genes and the SNP effects on microRNA target binding and biogenesis. Hum. Mutat. 2012, 33, 254–263. [Google Scholar] [CrossRef]
- Raven, L.-A.; Cocks, B.G.; Pryce, J.E.; Cottrell, J.J.; Hayes, B.J. Genes of the RNASE5 pathway contain SNP associated with milk production traits in dairy cattle. Genet. Sel. Evol. 2013, 45, 25. [Google Scholar] [CrossRef]
- Fang, M.; Fu, W.; Jiang, D.; Zhang, Q.; Sun, D.; Ding, X.; Liu, J. A multiple-SNP approach for genome-wide association study of milk production traits in Chinese Holstein cattle. PLoS ONE 2014, 9, e99544. [Google Scholar] [CrossRef]
- Ibeagha-Awemu, E.M.; Peters, S.O.; Akwanji, K.A.; Imumorin, I.G.; Zhao, X. High density genome wide genotyping-by-sequencing and association identifies common and low frequency SNPs, and novel candidate genes influencing cow milk traits. Sci. Rep. 2016, 6, 31109. [Google Scholar] [CrossRef]
- Pasandideh, M.; Mohammadabadi, M.; Esmailizadeh, A.; Tarang, A. Association of bovine PPARGC1A and OPN genes with milk production and composition in Holstein cattle. Czech J. Anim. Sci. 2015, 60, 97–104. [Google Scholar] [CrossRef]
- MacLeod, I.; Bowman, P.; Vander Jagt, C.; Haile-Mariam, M.; Kemper, K.; Chamberlain, A.; Schrooten, C.; Hayes, B.J.; Goddard, M.E. Exploiting biological priors and sequence variants enhances QTL discovery and genomic prediction of complex traits. BMC Genom. 2016, 17, 144. [Google Scholar] [CrossRef]
- Xu, L.; Shi, L.; Liu, L.; Liang, R.; Li, Q.; Li, J.; Han, B.; Sun, D. Analysis of liver proteome and identification of critical proteins affecting milk fat, protein, and lactose metabolism in dariy cattle with Itraq. Proteomics 2019, 19, 1800387. [Google Scholar] [CrossRef]
- Pullinger, C.R.; Eng, C.; Salen, G.; Shefer, S.; Batta, A.K.; Erickson, S.K.; Verhagen, A.; Rivera, C.R.; Mulvihill, S.J.; Malloy, M.J.; et al. Human cholesterol 7α-hydroxylase (CYP7A1) deficiency has a hypercholesterolemic phenotype. J. Clin. Investig. 2002, 110, 109–117. [Google Scholar] [CrossRef]
- Das, A.M.; Illsinger, S.; Lucke, T.; Hartmann, H.; Ruiter, J.P.; Steuerwald, U.; Waterham, H.R.; Duran, M.; Wanders, R.J.J.C.c. Isolated mitochondrial long-chain ketoacyl-CoA thiolase deficiency resulting from mutations in the HADHB gene. Clin. Chem. 2006, 52, 530–534. [Google Scholar] [CrossRef]
- Zhang, Q.; Boichard, D.; Hoeschele, I.; Ernst, C.; Eggen, A.; Murkve, B.; Pfister-Genskow, M.; Witte, L.A.; Grignola, F.E.; Uimari, P. Mapping quantitative trait loci for milk production and health of dairy cattle in a large outbred pedigree. Genetics 1998, 149, 1959–1973. [Google Scholar] [CrossRef]
- Boichard, D.; Grohs, C.; Bourgeois, F.; Cerqueira, F.; Faugeras, R.; Neau, A.; Rupp, R.; Amigues, Y.; Boscher, M.Y.; Levéziel, H. Detection of genes influencing economic traits in three French dairy cattle breeds. Genet. Sel. Evol. 2003, 35, 77–101. [Google Scholar] [CrossRef]
- Kučerová, J.; Lund, M.; Sørensen, P.; Sahana, G.; Guldbrandtsen, B.; Nielsen, V.; Thomsen, B.; Bendixen, C. Multitrait quantitative trait loci mapping for milk production traits in Danish Holstein cattle. J. Dairy Sci. 2006, 89, 2245–2256. [Google Scholar] [CrossRef]
- Pedrosa, V.B.; Schenkel, F.S.; Chen, S.-Y.; Oliveira, H.R.; Casey, T.M.; Melka, M.G.; Brito, L.F. Genomewide association analyses of lactation persistency and milk production traits in Holstein cattle based on imputed whole-genome sequence data. Genes 2021, 12, 1830. [Google Scholar] [CrossRef]
- Wu, D.; Gu, M.; Wei, Z.; Bai, C.; Su, G.; Liu, X.; Zhao, Y.; Yang, L.; Li, G. Myostatin knockout regulates bile acid metabolism by promoting bile acid synthesis in cattle. Animals 2022, 12, 205. [Google Scholar] [CrossRef]
- Shao, F.; Wang, X.; Yu, J.; Shen, K.; Qi, C.; Gu, Z. Expression of miR-33 from an SREBP2 intron inhibits the expression of the fatty acid oxidation-regulatory genes CROT and HADHB in chicken liver. Br. Poult. Sci. 2019, 60, 115–124. [Google Scholar] [CrossRef]
- Cargill, M.; Altshuler, D.; Ireland, J.; Sklar, P.; Ardlie, K.; Patil, N.; Lane, C.R.; Lim, E.P.; Kalyanaraman, N.; Nemesh, J.; et al. Characterization of single-nucleotide polymorphisms in coding regions of human genes. Nat. Genet. 1999, 22, 231–238. [Google Scholar] [CrossRef]
- Kumar, V.; Westra, H.-J.; Karjalainen, J.; Zhernakova, D.V.; Esko, T.; Hrdlickova, B.; Almeida, R.; Zhernakova, A.; Reinmaa, E.; Võsa, U.; et al. Human disease-associated genetic variation impacts large intergenic non-coding RNA expression. PLoS Genet. 2013, 9, e1003201. [Google Scholar] [CrossRef]
- Ryan, B.M.; Robles, A.I.; Harris, C.C. Genetic variation in microRNA networks: The implications for cancer research. Nat. Rev. Cancer 2010, 10, 389–402. [Google Scholar] [CrossRef]
- Lango Allen, H.; Estrada, K.; Lettre, G.; Berndt, S.I.; Weedon, M.N.; Rivadeneira, F.; Willer, C.J.; Jackson, A.U.; Vedantam, S.; Raychaudhuri, S.; et al. Hundreds of variants clustered in genomic loci and biological pathways affect human height. Nature 2010, 467, 832–838. [Google Scholar] [CrossRef]
- Miglior, F.; Fleming, A.; Malchiodi, F.; Brito, L.F.; Martin, P.; Baes, C.F. A 100-Year Review: Identification and genetic selection of economically important traits in dairy cattle. J. Dairy Sci. 2017, 100, 10251–10271. [Google Scholar] [CrossRef]
- Gengler, N. Persistency of lactation yields: A review. Interbull Bull. 1996, 12, 87–96. [Google Scholar]
- Latchman, D.S. Transcription factors: An overview. Int. J. Biochem. Cell Biol. 1997, 29, 1305–1312. [Google Scholar] [CrossRef]
- Orso, F.; Corà, D.; Ubezio, B.; Provero, P.; Caselle, M.; Taverna, D. Identification of functional TFAP2A and SP1 binding sites in new TFAP2A-modulated genes. BMC Genom. 2010, 11, 355. [Google Scholar] [CrossRef]
- Oo, J.A.; Irmer, B.; Günther, S.; Warwick, T.; Pálfi, K.; Izquierdo Ponce, J.; Teichmann, T.; Pflüger-Müller, B.; Gilsbach, R.; Brandes, R.P.; et al. ZNF354C is a transcriptional repressor that inhibits endothelial angiogenic sprouting. Sci. Rep. 2020, 10, 19079. [Google Scholar] [CrossRef]
- Sabi, R.; Tuller, T. Modelling the efficiency of codon–tRNA interactions based on codon usage bias. DNA Res. 2014, 21, 511–526. [Google Scholar] [CrossRef]
- Hanson, G.; Coller, J. Codon optimality, bias and usage in translation and mRNA decay. Nat. Rev. Mol. Cell Biol. 2018, 19, 20–30. [Google Scholar] [CrossRef]
Figure 1.
Linkage disequilibrium estimated between SNPs in CYP7A1 and HADHB gene. The blocks indicate haplotype blocks, and the text above the horizontal numbers is the SNP names. The values in the red boxes are pair-wise SNP correlations (D′, while bright red boxes without numbers indicate complete linkage disequilibrium (LD) (D′ = 1)).


Table 1.
Detailed information about the identified SNPs and their genotypic and allelic frequencies.
Table 1.
Detailed information about the identified SNPs and their genotypic and allelic frequencies.
| Gene | SNP | rs ID | Gene Region | Genotype | Genotypic Frequency | Allele | Allelic Frequency |
|---|---|---|---|---|---|---|---|
| CYP7A1 | 14:g.24676921A>G | rs42765357 | 5′ flanking region | AA | 0.1341 | A | 0.3511 |
| AG | 0.4340 | G | 0.6489 | ||||
| GG | 0.4319 | ||||||
| 14:g.24676224G>A | rs109454495 | 5′ flanking region | AA | 0.3073 | A | 0.5433 | |
| AG | 0.4720 | G | 0.4567 | ||||
| GG | 0.2207 | ||||||
| 14:g.24675708G>T | rs42765359 | 5′ flanking region | GG | 0.3083 | G | 0.5444 | |
| GT | 0.4720 | T | 0.4566 | ||||
| TT | 0.2196 | ||||||
| 14:g.24665961C>T | rs108958186 | 3′ UTR | CC | 0.2218 | C | 0.4683 | |
| CT | 0.4931 | T | 0.5317 | ||||
| TT | 0.2851 | ||||||
| 14:g.24664026A>G | rs109680813 | 3′ flanking region | AA | 0.4298 | A | 0.6584 | |
| AG | 0.4572 | G | 0.3416 | ||||
| GG | 0.1130 | ||||||
| HADHB | 11:g.73256269T>C | rs110033443 | 5′ flanking region | CC | 0.6410 | C | 0.8031 |
| CT | 0.3242 | T | 0.1969 | ||||
| TT | 0.0348 | ||||||
| 11:g.73256227A>C | rs134856746 | 5′ UTR | AA | 0.0201 | A | 0.1605 | |
| AC | 0.2809 | C | 0.8395 | ||||
| CC | 0.6990 | ||||||
| 11:g.73242290C>T | rs137211407 | Intron | CC | 0.1373 | C | 0.2450 | |
| CT | 0.2154 | T | 0.7550 | ||||
| TT | 0.6473 |
UTR: untranslated region.
Table 2.
Associations of eight SNPs in the CYP7A1 and HADHB genes with milk yield and milk-composition traits in Chinese Holstein cattle during the first and second lactations.
Table 2.
Associations of eight SNPs in the CYP7A1 and HADHB genes with milk yield and milk-composition traits in Chinese Holstein cattle during the first and second lactations.
| Gene | SNP | Lactation | Genotype (No.) | Milk Yield (kg) | Fat Yield (kg) | Fat Percentage (%) | Protein Yield (kg) | Protein Percentage (%) |
|---|---|---|---|---|---|---|---|---|
| CYP7A1 | 14:g.24676921A>G | 1 | AA (118) | 10,289 ± 64.59 | 345.06 ± 2.27 | 3.37 ± 0.03 | 306.85 ± 2.73 | 2.98 ± 0.01 |
| AG (391) | 10,308 ± 43.99 | 344.94 ± 1.55 | 3.36 ± 0.03 | 308.93 ± 2.17 | 2.30 ± 0.01 | |||
| GG (389) | 10,299 ± 43.98 | 345.75 ± 1.55 | 3.37 ± 0.03 | 308.37 ± 2.18 | 3.00 ± 0.01 | |||
| p value | 0.9512 | 0.8719 | 0.8957 | 0.6648 | 0.3686 | |||
| 2 | AA (79) | 11,067 A ± 103.8 | 396.65 A ± 4.38 | 3.59 ± 0.04 | 330.55 Aa ± 4.38 | 2.99 ± 0.01 | ||
| AG (272) | 10,660 B ± 69.92 | 378.52 B ± 3.10 | 3.56 ± 0.03 | 317.36 Bb ± 3.10 | 2.98 ± 0.01 | |||
| GG (260) | 10,717 B ± 71.91 | 383.4 B ± 3.17 | 3.59 ± 0.03 | 319.70 ABb ± 3.17 | 2.99 ± 0.01 | |||
| p value | 0.0003 | <0.0001 | 0.5719 | 0.0059 | 0.5828 | |||
| 14:g.24676224G>A | 1 | AA (278) | 10,287 ± 50.05 | 346.51 ± 1.73 | 3.38 ± 0.03 | 308.51 ± 2.31 | 3.01 ± 0.01 | |
| GA (422) | 10,277 ± 43.34 | 343.81 ± 1.49 | 3.36 ± 0.03 | 307.49 ± 2.15 | 2.99 ± 0.01 | |||
| GG (198) | 10,370 ± 53.54 | 346.97 ± 1.85 | 3.37 ± 0.03 | 310.12 ± 2.41 | 3.00 ± 0.01 | |||
| p value | 0.1972 | 0.1421 | 0.574 | 0.3774 | 0.2884 | |||
| 2 | AA (181) | 10,755 B ± 78.19 | 385.15 AB ± 3.38 | 3.59 ± 0.03 | 321.69 AB ± 3.38 | 3.00 ± 0.01 | ||
| GA (293) | 10,622 B ± 69.32 | 378.07 B ± 3.05 | 3.58 ± 0.03 | 315.65 B ± 3.05 | 2.97 ± 0.01 | |||
| GG (137) | 10,942 A ± 84.75 | 389.83 A ± 3.63 | 3.57 ± 0.03 | 326.73 A ± 3.63 | 2.98 ± 0.01 | |||
| p value | 0.0006 | 0.0011 | 0.8325 | 0.0029 | 0.0677 | |||
| 14:g.24675708G>T | 1 | GG (279) | 10,271 ± 50.23 | 346.01 ± 1.73 | 3.38 ± 0.03 | 308.12 ± 2.31 | 3.01 ± 0.01 | |
| GT (422) | 10,282 ± 43.57 | 343.92 ± 1.49 | 3.36 ± 0.03 | 307.55 ± 2.15 | 2.99 ± 0.01 | |||
| TT (197) | 10,378 ± 53.8 | 347.33 ± 1.86 | 3.37 ± 0.03 | 310.48 ± 2.41 | 3.00 ± 0.01 | |||
| p value | 0.1313 | 0.1635 | 0.5444 | 0.2926 | 0.244 | |||
| 2 | GG (181) | 10,755 AB ± 78.19 | 385.15 AB ± 3.38 | 3.59 ± 0.03 | 321.69 AB ± 3.38 | 3.00 ± 0.01 | ||
| GT (293) | 10,622 B ± 69.32 | 378.07 B ± 3.05 | 3.58 ± 0.03 | 315.65 B ± 3.05 | 2.97 ± 0.01 | |||
| TT (137) | 10,942 A ± 84.76 | 389.83 A ± 3.63 | 3.57 ± 0.03 | 326.73 A ± 3.63 | 2.98 ± 0.01 | |||
| p value | 0.0006 | 0.0011 | 0.8325 | 0.0029 | 0.0677 | |||
| 14:g.24665961C>T | 1 | CC (198) | 10,355 ± 53.37 | 348.72 A ± 1.87 | 3.39 ± 0.03 | 310.35 A ± 2.42 | 3.00 ± 0.01 | |
| CT (438) | 10,250 ± 42.29 | 341.82 B ± 1.48 | 3.35 ± 0.03 | 306.39 B ± 2.14 | 2.99 ± 0.01 | |||
| TT (262) | 10,354 ± 50.21 | 348.93 A ± 1.76 | 3.38 ± 0.03 | 310.43 A ± 2.33 | 3.00 ± 0.01 | |||
| p value | 0.0443 | <0.0001 | 0.2811 | 0.0258 | 0.369 | |||
| 2 | CC (136) | 10,975 Aa ± 85.38 | 394.69 Aa ± 3.66 | 3.60 ± 0.03 | 328.62 Aa ± 3.66 | 2.99 ± 0.01 | ||
| CT (305) | 10,604 Bb ± 67.5 | 377.09 Bc ± 2.99 | 3.57 ± 0.03 | 315.25 Bb ± 2.99 | 2.98 ± 0.01 | |||
| TT (170) | 10,813 ABa ± 80.72 | 385.16 ABb ± 3.49 | 3.57 ± 0.03 | 322.85 ABa ± 3.49 | 2.99 ± 0.01 | |||
| p value | <0.0001 | <0.0001 | 0.5643 | 0.0001 | 0.1667 | |||
| 14:g.24664026A>G | 1 | AA (385) | 10,251 ± 42.60 | 344.86 ± 1.48 | 3.38 ± 0.03 | 306.82 ± 2.16 | 3.00 ± 0.01 | |
| AG (410) | 10,358 ± 42.67 | 346.02 ± 1.49 | 3.36 ± 0.03 | 309.88 ± 2.17 | 2.99 ± 0.01 | |||
| GG (103) | 10,284 ± 68.88 | 344.17 ± 2.41 | 3.36 ± 0.04 | 309.52 ± 2.90 | 3.01 ± 0.01 | |||
| p value | 0.0583 | 0.6425 | 0.5414 | 0.1429 | 0.5095 | |||
| 2 | AA (261) | 10,798 ± 70.29 | 386.32 Aa ± 3.10 | 3.59 ± 0.03 | 322.31 ± 3.10 | 2.99 ± 0.01 | ||
| AG (286) | 10,676 ± 69.67 | 378.68 Ab ± 3.09 | 3.57 ± 0.03 | 317.79 ± 3.09 | 2.98 ± 0.01 | |||
| GG (64) | 10,758 ± 113.28 | 389.85 Aa ± 4.75 | 3.62 ± 0.05 | 320.94 ± 4.75 | 2.99 ± 0.02 | |||
| p value | 0.2012 | 0.0037 | 0.4078 | 0.2597 | 0.7069 | |||
| HADHB | 11:g.73256269T>C | 1 | CC (580) | 10,345 ± 40.5 | 345.52 ± 1.40 | 3.36 ± 0.03 | 309.82 ± 2.08 | 3.00 ± 0.01 |
| TC (287) | 10,249 ± 49.36 | 346.32 ± 1.72 | 3.39 ± 0.03 | 306.67 ± 2.30 | 3.00 ± 0.01 | |||
| TT (31) | 10,100 ± 118.79 | 338.41 ± 4.16 | 3.35 ± 0.06 | 302.28 ± 4.45 | 2.99 ± 0.02 | |||
| p value | 0.0236 | 0.1926 | 0.2617 | 0.0461 | 0.8674 | |||
| 2 | CC (370) | 10,873 A ± 66.55 | 387.93 Aa ± 2.95 | 3.58 ± 0.03 | 324.74 A ± 2.95 | 2.99 ± 0.01 | ||
| TC (214) | 10,626 B ± 74.67 | 380.21 Ab ± 3.26 | 3.60 ± 0.03 | 315.93 B ± 3.26 | 2.98 ± 0.01 | |||
| TT (27) | 10,091 C ± 162.53 | 351.42 Bc ± 6.68 | 3.50 ± 0.07 | 299.92 B ± 6.68 | 2.98 ± 0.02 | |||
| p value | <0.0001 | <0.0001 | 0.3795 | <0.0001 | 0.585 | |||
| 11:g.73256227A>C | 1 | AA (18) | 10,532 AB ± 156.37 | 349.98 ± 5.49 | 3.31 ± 0.08 | 313.59 b ± 5.73 | 3.00 ± 0.03 | |
| AC (250) | 10,178 B ± 51.16 | 344.16 ± 1.81 | 3.40 ± 0.03 | 304.93 a ± 2.36 | 3.00 ± 0.01 | |||
| CC (630) | 10,333 A ± 39.75 | 345.45 ± 1.42 | 3.36 ± 0.03 | 309.37 b ± 2.07 | 3.00 ± 0.01 | |||
| p value | 0.0015 | 0.499 | 0.2506 | 0.0184 | 0.9941 | |||
| 2 | AA (19) | 9958.5 Ac ± 193.86 | 335.25 A ± 7.93 | 3.42 ± 0.08 | 294.18 B ± 7.93 | 2.98 ± 0.03 | ||
| AC (184) | 10,540 Bb ± 78.1 | 377.62 B ± 3.39 | 3.60 ± 0.03 | 312.87 B ± 3.39 | 2.97 ± 0.01 | |||
| CC (408) | 10,883 Aa ± 65.13 | 388.71 C ± 2.90 | 3.58 ± 0.03 | 325.20 A ± 2.90 | 2.99 ± 0.01 | |||
| p value | <0.0001 | <0.0001 | 0.0665 | <0.0001 | 0.404 | |||
| 11:g.73242290C>T | 1 | CC (123) | 10,254 AB ± 65.02 | 344.89 ± 2.30 | 3.38 ± 0.04 | 306.77 ab ± 2.73 | 2.99 ± 0.01 | |
| CT (189) | 10,168 B ± 54.74 | 344.54 ± 1.95 | 3.40 ± 0.03 | 304.97 b ± 2.47 | 3.00 ± 0.01 | |||
| TT (586) | 10,358 A ± 40.35 | 345.66 ± 1.45 | 3.36 ± 0.03 | 309.91 a ± 2.08 | 3.00 ± 0.01 | |||
| p value | 0.0012 | 0.8134 | 0.2182 | 0.0206 | 0.7748 | |||
| 2 | CC (88) | 10,476 B ± 99.09 | 368.81 Bc ± 4.20 | 3.54 ± 0.04 | 308.42 B ± 4.20 | 2.96 ± 0.01 | ||
| CT (147) | 10,545 B ± 82.76 | 379.36 ABb ± 3.58 | 3.62 ± 0.03 | 315.16 B ± 3.58 | 2.99 ± 0.01 | |||
| TT (376) | 10,884 A ± 66.08 | 387.96 Aa ± 2.95 | 3.57 ± 0.03 | 325.03 A ± 2.95 | 2.99 ± 0.01 | |||
| p value | <0.0001 | <0.0001 | 0.1681 | <0.0001 | 0.0674 |
The number in the table represents the mean ± standard deviation; the number in the bracket represents the number of cows with the corresponding genotype; the p value shows the significance calculated for the genetic effects of SNPs; the superscript letters indicate the significance calculated for the effects different genotypes via the comparison of each pair of pairs; a, b, c within the same column with different superscripts means that the p value is < 0.05; and A, B, C within the same column with different superscripts means that the p value is <0.01.
Table 3.
Additive, dominant and allele substitution effects of 8 SNPs in the CYP7A1 and HADHB genes on milk yield and milk-composition traits in Chinese Holstein cattle during two lactations.
Table 3.
Additive, dominant and allele substitution effects of 8 SNPs in the CYP7A1 and HADHB genes on milk yield and milk-composition traits in Chinese Holstein cattle during two lactations.
| Gene | SNP Name | Lactation | Effect | Milk Yield (kg) | Fat Yield (kg) | Fat Percentage (%) | Protein Yield (kg) | Protein Percentage (%) |
|---|---|---|---|---|---|---|---|---|
| CYP7A1 | 14:g.24676921A>G | 1 | Additive Effect (a) | −5.0162 | −0.3432 | −0.00126 | −0.7593 | −0.00757 |
| Dominance Effect (d) | 14.2908 | −0.467 | −0.00879 | 1.3145 | 0.007425 | |||
| Allele Substitution Effect (α) | −9.3289 | −0.2023 | 0.001392 | −1.156 | −0.00981 | |||
| 2 | Additive Effect (a) | 174.61 ** | 6.6291 ** | 0.00234 | 5.4211 * | −0.00187 | ||
| Dominance Effect (d) | −232.24 ** | −11.5028 ** | −0.02803 | −7.7643 ** | −0.00847 | |||
| Allele Substitution Effect (α) | 243.41 ** | 10.0366 ** | 0.01064 | 7.7212 ** | 0.000633 | |||
| 14:g.24676224G>A | 1 | Additive Effect (a) | −41.8497 | −0.2291 | 0.006524 | −0.8039 | 0.004882 | |
| Dominance Effect (d) | −51.9072 | −2.9335 * | −0.018 | −1.8257 | −0.00847 | |||
| Allele Substitution Effect (α) | −46.4739 | −0.4904 | 0.00492 | −0.9666 | 0.004128 | |||
| 2 | Additive Effect (a) | −93.7702 * | −2.34 | 0.009039 | −2.5205 | 0.007237 | ||
| Dominance Effect (d) | −226.82 ** | −9.4213 ** | −0.00727 | −8.5594 ** | −0.01769 | |||
| Allele Substitution Effect (α) | −110.1 * | −3.0184 | 0.008515 | −3.1369 | 0.005963 | |||
| 14:g.24675708G>T | 1 | Additive Effect (a) | −53.7569 | −0.6575 | 0.0065 | −1.1824 | 0.004344 | |
| Dominance Effect (d) | −42.5283 | −2.7457 | −0.01911 | −1.7491 | −0.00997 | |||
| Allele Substitution Effect (α) | −57.6403 | −0.9082 | 0.004755 | −1.3421 | 0.003434 | |||
| 2 | Additive Effect (a) | −93.7702 * | −2.34 | 0.009039 | −2.5205 | 0.007237 | ||
| Dominance Effect (d) | −226.82 ** | −9.4213 ** | −0.00727 | −8.5594 ** | −0.01769 | |||
| Allele Substitution Effect (α) | −110.1 * | −3.0184 | 0.008515 | −3.1369 | 0.005963 | |||
| 14:g.24665961C>T | 1 | Additive Effect (a) | 0.911 | −0.106 | 0.002497 | −0.04286 | −0.00055 | |
| Dominance Effect (d) | −104.99 * | −6.9981 | −0.03212 | −3.9993 * | −0.01024 | |||
| Allele Substitution Effect (α) | 8.3937 | 0.3928 | 0.004787 | 0.2422 | 0.000182 | |||
| 2 | Additive Effect (a) | 80.7445 | 4.764 * | 0.01721 | 2.8865 | 0.001474 | ||
| Dominance Effect (d) | −289.97 ** | −12.8359 ** | −0.01506 | −10.4784 ** | −0.0176 | |||
| Allele Substitution Effect (α) | 96.8803 * | 5.4783 ** | 0.01805 | 3.4696 | 0.002453 | |||
| 14:g.24664026A>G | 1 | Additive Effect (a) | −16.3957 | 0.3409 | 0.009981 | −1.3534 | −0.00523 | |
| Dominance Effect (d) | 89.7199 | 1.5028 | −0.0135 | 1.7121 | −0.00847 | |||
| Allele Substitution Effect (α) | 11.7791 | 0.8128 | 0.005741 | −0.8157 | −0.00789 | |||
| 2 | Additive Effect (a) | 20.2446 | −1.7674 | −0.01594 | 0.6858 | −0.00119 | ||
| Dominance Effect (d) | −101.99 | −9.407 ** | −0.03741 | −3.8298 | −0.00827 | |||
| Allele Substitution Effect (α) | −14.8297 | −5.0024 | −0.0288 | −0.6313 | −0.00403 | |||
| HADHB | 11:g.73256269T>C | 1 | Additive Effect (a) | 122.03 * | 3.5596 | 0.003985 | 3.7702 | 0.004206 |
| Dominance Effect (d) | 26.4066 | 4.3527 | 0.03899 | 0.6195 | 0.001006 | |||
| Allele Substitution Effect (α) | 104.04 ** | 0.5932 | −0.02259 | 3.348 * | 0.003521 | |||
| 2 | Additive Effect (a) | 390.89 ** | 18.2568 ** | 0.03657 | 12.4128 ** | 0.001967 | ||
| Dominance Effect (d) | 143.14 | 10.5408 ** | 0.05419 | 3.5935 | −0.00841 | |||
| Allele Substitution Effect (α) | 471.25 ** | 24.1742 ** | 0.067 | 14.4302 ** | −0.00275 | |||
| 11:g.73256227A>C | 1 | Additive Effect (a) | 99.5398 | 2.2649 | −0.02704 | 2.1125 | −0.00149 | |
| Dominance Effect (d) | −254.17 ** | −3.5579 | 0.05961 * | −6.5477 * | 0.001585 | |||
| Allele Substitution Effect (α) | 272.76 * | 4.6897 | −0.06766 | 6.5749 | −0.00257 | |||
| 2 | Additive Effect (a) | −462.42 ** | −26.7305 ** | −0.08246 * | −15.5101 ** | −0.0063 ** | ||
| Dominance Effect (d) | 118.71 | 15.6455 ** | 0.1017 * | 3.184 | −0.00734 | |||
| Allele Substitution Effect (α) | −538 ** | −36.6914 ** | −0.1472 * | −17.5372 ** | −0.00162 ** | |||
| 11:g.73242290C>T | 1 | Additive Effect (a) | −51.7106 | −0.383 | 0.01289 | −1.5714 | −0.00237 | |
| Dominance Effect (d) | −137.38 | −0.7373 | 0.02938 | −3.3741 | 0.0067 | |||
| Allele Substitution Effect (α) | 19.1215 | −0.00287 | −0.00226 | 0.1682 | −0.00583 | |||
| 2 | Additive Effect (a) | −203.9 ** | −9.573 ** | −0.01824 | −8.3062 ** | −0.01506 * | ||
| Dominance Effect (d) | −135.25 | 0.9699 | 0.06063 | −1.5693 | 0.01771 | |||
| Allele Substitution Effect (α) | −140.15 * | −10.0302 ** | −0.04682 | −7.5665 ** | −0.02341 * |
Note: The number in the table represents the mean; * indicates p < 0.05; ** indicates p < 0.01.
Table 4.
Associations of haplotype blocks in the CYP7A1 and HADHB genes with milk yield and milk-composition traits in Chinese Holstein cattle during first and second lactations.
Table 4.
Associations of haplotype blocks in the CYP7A1 and HADHB genes with milk yield and milk-composition traits in Chinese Holstein cattle during first and second lactations.
| Block | Lactation | Haplotype Combination | Milk Yield (kg) | Fat Yield (kg) | Fat Percentage (%) | Protein Yield (kg) | Protein Percentage (%) |
|---|---|---|---|---|---|---|---|
| BLOCK1 | 1 | H1H1 (197) | 10,410 A ± 53.81 | 352.81 ABa ± 1.9 | 3.41 ± 0.03 | 312.82 A ± 2.41 | 3.01 ± 0.01 |
| H1H2 (282) | 10,329 A ± 46.52 | 346.8 Bb ± 1.64 | 3.38 ± 0.03 | 310.03 AB ± 2.23 | 3.01 ± 0.01 | ||
| H1H3 (155) | 10,125 B ± 57.38 | 343.65 Bb ± 2.02 | 3.41 ± 0.03 | 304.38 B ± 2.52 | 3.01 ± 0.01 | ||
| H2H2 (102) | 10,314 AB ± 68.66 | 351.65 ABab ± 2.42 | 3.41 ± 0.04 | 310.75 AB ± 2.85 | 3.02 ± 0.01 | ||
| H2H3 (127) | 10,466 A ± 63.22 | 356.37 Aa ± 2.23 | 3.42 ± 0.04 | 313.93 A ± 2.68 | 3.00 ± 0.01 | ||
| p value | <0.0001 | <0.0001 | 0.6801 | 0.0011 | 0.7621 | ||
| 2 | H1H1 (136) | 10,937 Aa ± 86.81 | 392.63 Aa ± 3.73 | 3.60 ± 0.03 | 327.99 A ± 2.71 | 3.00 ± 0.01 | |
| H1H2 (201) | 10,539 Bb ± 76.03 | 374.21 Bb ± 3.31 | 3.57 ± 0.03 | 316.09 B ± 2.40 | 3.00 ± 0.01 | ||
| H1H3 (104) | 10,453 Bb ± 91.26 | 372.18 Bb ± 3.89 | 3.57 ± 0.04 | 311.78 B ± 2.83 | 2.99 ± 0.01 | ||
| H2H2 (64) | 10,560 ABb ± 108.83 | 379.53 ABb ± 4.56 | 3.60 ± 0.04 | 319.76 AB ± 3.32 | 3.04 ± 0.02 | ||
| H2H3 (85) | 10,971 Aa ± 98.06 | 385.25 ABab ± 4.15 | 3.52 ± 0.04 | 329.89 A ± 3.02 | 3.01 ± 0.014 | ||
| p value | <0.0001 | <0.0001 | 0.3899 | <0.0001 | 0.1286 | ||
| BLOCK2 | 1 | H1H1 (118) | 10,243 B ± 66.47 | 349.59 b ± 2.33 | 3.43 ± 0.04 | 309.81 B ± 2.90 | 3.00 ± 0.01 |
| H1H3 (71) | 10,679 A ± 80.86 | 359.13 a ± 2.84 | 3.39 ± 0.04 | 323.14 A ± 3.30 | 3.02 ± 0.02 | ||
| H2H2 (278) | 10,336 B ± 52.06 | 353.69 ab ± 1.83 | 3.45 ± 0.03 | 312.8 B ± 2.45 | 3.02 ± 0.01 | ||
| p value | <0.0001 | 0.017 | 0.329 | 0.0004 | 0.3323 | ||
| 2 | H1H1 (79) | 10,988 Aa ± 108.25 | 391.81 Aa ± 4.58 | 3.58 ± 0.04 | 327.91 a ± 3.33 | 2.99 ± 0.02 | |
| H1H3 (50) | 10,544 Bb ± 131.80 | 369.04 Bb ± 5.51 | 3.51 ± 0.05 | 316.52 b ± 4.02 | 3.00 ± 0.02 | ||
| H2H2 (181) | 10,597 Bb ± 83.65 | 379.16 ABb ± 3.64 | 3.58 ± 0.03 | 319.04 b ± 2.65 | 3.02 ± 0.01 | ||
| p value | 0.0007 | 0.0006 | 0.4171 | 0.0088 | 0.1168 | ||
| BLOCK3 | 1 | H1H2 (239) | 10,194 ± 73.90 | 345.47 b ± 3.22 | 3.40 ± 0.03 | 305.64 B ± 2.34 | 3.00 ± 0.01 |
| H2H2 (580) | 10,292 ± 62.97 | 346.25 b ± 2.82 | 3.38 ± 0.03 | 308.43 AB ± 2.05 | 3.00 ± 0.01 | ||
| H2H3 (48) | 10,439 ± 118.76 | 357.32 a ± 4.93 | 3.43 ± 0.05 | 315.61 A ± 3.59 | 3.03 ± 0.02 | ||
| p value | 0.06 | 0.0315 | 0.3858 | 0.0103 | 0.2938 | ||
| 2 | H1H2 (176) | 10,456 Ab ± 79.36 | 312.66 b ± 3.40 | 3.58 ± 0.03 | 312.67 C ± 2.50 | 2.99 ± 0.01 | |
| H2H2 (370) | 10,700 Aa ± 67.79 | 320.34 a ± 2.97 | 3.55 ± 0.03 | 320.34 B ± 2.19 | 3.00 ± 0.01 | ||
| H2H3 (37) | 10,860 Aa ± 138.53 | 327.69 a ± 5.71 | 3.60 ± 0.06 | 327.69 A ± 4.18 | 3.02 ± 0.02 | ||
| p value | 0.0005 | 0.0052 | 0.3623 | <0.0001 | 0.496 |
The number in the table represents the mean ± standard deviation; the number in the bracket represents the number of cows with the corresponding genotype; the p value shows the significance for the genetic effects of SNPs; the superscript letters indicate the significance calculated for the effects of different genotypes via the comparison of each pair of pairs; a, b within the same column with different superscripts indicates p < 0.05; and A, B, C within the same column with different superscripts indicates p < 0.01.
Table 5.
Transcription factor binding sites (TFBSs) prediction for CYP7A1 and HADHB genes.
| Gene | SNP | Allele | Transcription Factor | Relative Score (≥0.80) | Predicted Binding Site Sequence |
|---|---|---|---|---|---|
| CYP7A1 | 14:g.24676921A>G | A | - | - | - |
| G | EBF1 | 0.89 | ATTCCAGGGA | ||
| SP1 | 0.88 | GGGACGGGG | |||
| 14:g.24675708G>T | G | ELK1 | 0.80 | GGCACTGAAA | |
| T | FOXC1 | 0.82 | TTTGTAAATGC | ||
| ZNF354C | 0.82 | ATGCAC | |||
| HADHB | 11:g.73256269T>C | T | PAX2 | 0.84 | GGTCGTGC |
| NR2F1 | 0.82 | GAAGGGTCGTGCG | |||
| C | TFAP2A | 0.92 | GCCGTGCGC |
Relative scores represent the correlation score for each predicted binding site, with higher values indicating a stronger possibility of binding. The SNP in the predicted binding-site sequence is underlined.
Disclaimer/Publisher’s Note: The statements, opinions and data contained in all publications are solely those of the individual author(s) and contributor(s) and not of MDPI and/or the editor(s). MDPI and/or the editor(s) disclaim responsibility for any injury to people or property resulting from any ideas, methods, instructions or products referred to in the content. |
© 2024 by the authors. Licensee MDPI, Basel, Switzerland. This article is an open access article distributed under the terms and conditions of the Creative Commons Attribution (CC BY) license (https://creativecommons.org/licenses/by/4.0/).
Share and Cite
MDPI and ACS Style
Chen, A.; Yang, Q.; Ye, W.; Xu, L.; Wang, Y.; Sun, D.; Han, B. Polymorphisms of CYP7A1 and HADHB Genes and Their Effects on Milk Production Traits in Chinese Holstein Cows. Animals 2024, 14, 1276. https://doi.org/10.3390/ani14091276
AMA Style
Chen A, Yang Q, Ye W, Xu L, Wang Y, Sun D, Han B. Polymorphisms of CYP7A1 and HADHB Genes and Their Effects on Milk Production Traits in Chinese Holstein Cows. Animals. 2024; 14(9):1276. https://doi.org/10.3390/ani14091276
Chicago/Turabian StyleChen, Ao, Qianyu Yang, Wen Ye, Lingna Xu, Yuzhan Wang, Dongxiao Sun, and Bo Han. 2024. "Polymorphisms of CYP7A1 and HADHB Genes and Their Effects on Milk Production Traits in Chinese Holstein Cows" Animals 14, no. 9: 1276. https://doi.org/10.3390/ani14091276
Note that from the first issue of 2016, this journal uses article numbers instead of page numbers. See further details here.