
Machine Learning Based Design of Railway Prestressed Concrete Sleepers
by
 , , and
Sakdirat Kaewunruen
1,* ,
,
Jessada Sresakoolchai
1,
Junhui Huang
1,
Yingyu Zhu
1,
Chayut Ngamkhanong
2 and
Alex M. Remennikov
3 1
Department of Civil Engineering, University of Birmingham, Birmingham B15 2TT, UK
2
Department of Civil Engineering, Chulalongkorn University, Phayathai Road, Pathumwan, Bangkok 10330, Thailand
3
School of Civil, Mining, and Environmental Engineering, University of Wollongong, Wollongong, NSW 2522, Australia
*
Author to whom correspondence should be addressed.
Appl. Sci. 2022, 12(20), 10311; https://doi.org/10.3390/app122010311
Submission received: 26 September 2022
/
Revised: 6 October 2022
/
Accepted: 10 October 2022
/
Published: 13 October 2022
(This article belongs to the Special Issue Innovative Solutions for the Railway Sector: Design and Experimentation)
Abstract
:The state-of-the-art design methods for railway prestressed concrete sleepers are currently based on the quasi-static stresses resulting from a simplification of dynamic wheel loads, and subsequently the quasi-static responses of concrete sleepers. This method has been widely used in practices to overcome the complexity of dynamic analysis and testing. A single load factor (or called dynamic impact factor) for a partial safety-factored design (or k factors for the test criteria) is commonly used to crudely account for dynamic train–track interactions over different levels of track irregularities. The dynamic impact factors for either design or testing are usually obtained from either (i) railway infrastructure managers (i.e., in EN 13230), or (ii) prescribed standardised factors (i.e., AS 1085.14, AREMA Chapter 30, JSA—JIS E 1201). The existing design concepts for prestressed concrete sleepers using either (i) an allowable stress design or (ii) the limit state design method require many iterations for calculations and optimisations. The design process to achieve optimal products suitable for track, operational, and environmental parameters is, thus, very time-consuming. On this ground, this study investigates the potential capability of machine learning (ML) to learn from large amounts of design data sets and then to facilitate the design and capacity prediction of railway prestressed concrete sleepers. Three ML algorithms are developed, namely deep learning, Bayesian Neural Network, and random forest. Through a combination of hand-calculated design data, industry design data, and experimental investigations in compliance with EN 13230, over 3000 sets of design data have been collected. These data sets are used to assimilate a comprehensive database for machine learning. Four indicators, namely mean squared error (MSE), root-mean-square error (RMSE), mean absolute error (MAE), and R2 are used to benchmark the accuracy and precision of machine learning models. Our results reveal that the random forest algorithm offers the best performance. The values of MSE, RMSE, MAE, and R2 are 0.54, 0.74, 0.25, and 0.99, respectively. Note that the Bayesian neural network also performs very well. In contrast, the deep learning algorithm performs worse than the others. The insight demonstrates machine learning’s capability to aid in the design of railway prestressed concrete sleepers, to satisfy both serviceability and ultimate limit states
1. Introduction
At present, ballasted railway tracks are still the dominant type of trackforms globally, which have been employed as a modern type of railway system for urban, suburban, metro, and freight rail networks. The track structure consists of various key components that guide and facilitate the safe, cost-effective, and smooth ride of trains. Railway sleepers are a critical part of the ballasted railway track system. The vertical load from the train wheels will be redistributed to rail pads, sleepers, ballast layer, and formation. The sleepers also play a key role in enhancing lateral track stability and maintaining the rail gauge. From the advent of the railway to the present, the vast majority of materials for railway sleepers are wood, concrete, and steel. In 1943, the first prestressed concrete sleepers were put into use, which demonstrates the advantages of large longitudinal, transverse resistance, and long service life [1]. An example of concrete sleepers reaching their end of life can be shown in Figure 1. Note that prestressed concrete sleepers are the most common type of railway sleepers in use globally [2]. It is estimated that as of 2013, the global investment in railway infrastructures accounted for a third of the total investment in the railway market, about USD 70 billion [3]. The design and manufacture of concrete sleepers has become one of the most critical and fundamental processes for enabling railway infrastructure construction work. In Europe, limit state design standards (on the basis of a performance-based design concept) can be referred to for railway concrete sleepers design such as BS EN 13230-2 [4] and UIC 713: 1ED 2004 [5]. For the design procedure, service life should be carefully considered because it can affect the performance requirements significantly. The other operational criteria that are critical to the design include static and dynamic vertical wheel loads, axle loads, load redistribution between sleepers, lateral loads, longitudinal loads, rail seat loads, and bending moments.
Fan et al. [6] demonstrated that the design of traditional prestressed concrete sleepers is inefficient and that large-scale parameter analysis consumes a lot of time and energy. Machine learning can learn the underlying rules and performance requirements from the design data features. It can perform a huge optimisation for the design in terms of required parameters and efficiency. The main work of designers today includes structural modelling, scheme adjustment, and design drawing. These tasks are time-consuming and repetitive, and the design technology for each task is declining. More and more young engineers are no longer willing to do this task [6].
With the rise of artificial intelligence, machine learning can be potentially introduced to the design of railway prestressed concrete sleepers. The learning speed of machine learning is relatively fast; machine learning can handle complex nonlinear problems, and it is free of human intervention. In recent years, it has been favoured by experts and scholars and is widely used for various applications. Machine learning is a method to learn rules and gain experience from large amounts of data, and then it can achieve the goal by intelligently screening or predicting new samples and new data through probabilistic and mathematical algorithms. Notably, most of the design data of the current prestressed concrete sleepers are recorded in practice, as part of the authoritative product-approval process. This becomes a comprehensive and truly effective source of design data sets that can benefit the development of machine learning for design automation. Over the decades, various machine learning algorithms have been developed for many engineering applications. They cover a variety of data and problem types presented in different machine learning problems [7]. It can be observed that different machine learning algorithms offer different prediction accuracy depending on the data structures, data features, and attributes [8].
This study aims to use machine learning in the design of railway prestressed concrete sleepers, in accordance with the limit state design method in EN13230. To automate complex design procedures, machine learning has been employed in the design of prestressed concrete sleepers. In this study, the maximum positive and negative bending moment capacities of prestressed concrete sleepers are the target predictions through machine learning. Therefore, the developed machine learning models are regression models. Note that the maximum positive bending moment at the rail seat and the maximum negative bending moment at the midspan of sleepers are the governing factors in the design. Key design features include the cross-section dimensions of the sleepers, eccentricity, total area of the prestressed tendons, tensile strength of prestressed tendons, and compressive strength of concrete. The machine learning algorithm has then been developed to predict the design capacities of railway prestressed concrete sleepers. Then, the performance of each model will be compared to select the most suitable model using different indicators. The novelty of the study is that it presents the application of machine learning in the support of a prestressed concrete sleeper design, which has never been accomplished before. As mentioned, this study aims to predict the bending moments that are critical in prestressed concrete sleeper design. The contribution of the study is that the developed machine learning model can be used to support the design process and shorten the time spent on the design.
2. Literature Review
Over the past decades, there have been many research investigations with respect to prestressed concrete sleepers. However, only several investigations pay special attention to the design, reliability, and safety factors that correlate the field condition to the design approaches. In Europe, EN13230 “Railway application-Track-Concrete sleepers and bearers” [4], which has been published by the European Committee for Standardization (CEN), indicates design requirements for railway concrete sleepers at rail seat sections and the centre (or midspan) section. The design procedures include the calculation of dynamic rail seat loads, calculation of bending moments, check of resultant stresses, static test verifications, and so on. The concept is similar to other standards such as UIC 713: 1ED 2004 [5], AS1085.14, AREMA Chapter 30, and JSA—JIS E 1201 [9,10]; however, the design methodology in Europe is based on the limit state design principle. First, the quasi-static loads that apply to sleepers have to be calculated based on the axle loads and speeds of the rolling stock. The serviceability limit state of the track is also an important parameter. Then, concrete sleepers are designed to ensure that they can safely bear the loads over their entire service life.
General manufacturing guidance for prestressed concrete sleepers was reviewed and recommended by fib [11]. However, the focus of the guidance was mainly placed on the manufacturing of concrete sleepers, with little evidence related to the design and realistic behaviours of sleepers throughout their entire service life. Note that European Standard EN 13230 [4] has very recently introduced a design guideline on a pilot stage (prEN13230-6), based on the UIC approach using quasi-static factors to represent dynamic loading, uncertainties of support conditions, track maintenance level, and so on. The new design guideline for dynamic loading and action calculations is still being validated by field data. In practice, the static resistance of concrete is usually used for structural design, in accordance with EuroCode2 (for concrete structures), because the high-cycle fatigue failure of sleepers is rarely observed in the field, if ever. As a result, cyclic tests become optional and uncommon, as per EN 13230. Table 1 shows the common critical issues related to railway concrete sleepers based on international survey outcomes from railway networks globally. More information can be found in [12].
Bai and Wang [13] demonstrated four steps to design and develop prestressed concrete sleepers, including force analysis, determination of shape size, design of bear capacity, and testing. After determining information about the key design parameters such as the geometry of the section and the design of load, the sleeper limit state and fatigue rupture can be analysed. The geometry of cross-sections, material strengths, and external load exist as key information in the design. When such parameters as material strengths and external loads can be determined, the sleeper cross-section can be optimised during the analysis and design.
When applying machine learning to predict the deformation of the shield tunnelling surface, Ding et al. [14] divided machine learning into three steps, including database building, model building, and model evaluation. Among them, the data were cleaned and normalised in establishing the database. Data cleaning was performed to remove outliers and null values from the database, while normalisation can eliminate the effects of magnitude between data. Fang et al. [15] quantified and normalised disaster factors when studying area landslides. They created the format of unified disaster factors, and the degree of impact can be uniformly evaluated. The dimensional differences are eliminated, reducing the error of the results. None of these feature factors are intuitive. Factor quantification and normalisation are required. As is seen from the above, normalisation and data cleaning are useful for machine learning. However, the data in this study are all intuitive numerical values, and the unit of them is unified.
The machine learning system is categorised into three types, Supervised Learning, Unsupervised Learning, and Reinforcement Learning [16]. In this study, the main purpose is to predict some unknown features (i.e., design capacities) that are needed through certain design data. Therefore, the appropriate machine learning type needs to be selected. Regression is a type of supervised learning, and its primary objective is to build an effective model that can predict the dependent characteristics from a variety of attribute variables. Regression analysis is performed to determine the correlation between two or more variables having cause–effect relations and to make a prediction for the topic by using relations. Regression using a single independent variable is called univariate regression analysis, while analysis using more than two independent variables is called multivariate regression analysis [16]. As can be seen from the previous studies, the regression algorithms in machine learning will apply to this study. Many algorithms can be used for regression such as deep learning, random forest, support vector regression, ridge regression, and so on [17].
Sharma et al. [18] believed that deep learning can be suitable for processing large data and complexity. It allows for big data analysis using relatively simple linear models. This was proven by Najafabadi et al. [19]. Deep learning has been used in some big data areas, such as computer vision [20] and speech recognition [21].
Yang and Yang [22] adopted an approach, which is the combination of Bayesian ridge regression and ensemble empirical mode decomposition, to handle complex time series of wind speeds. They successfully obtained the accurate, effective, and practical significance for a wind-speed-prediction value.
Awada et al. [23] developed a random forest prediction model to predict the likelihood that concrete-pouring requests would be accepted. Similarly, Cutler et al. [24] believed that random forests, as a common algorithm, are highly efficient and accurate. They perform well in processing big data [25]. Zhou et al. [26] proved that random forests are feasible in predicting land subsidence induced by tunnels.
In addition, machine learning is widely applied in different areas such as industry [27], manufacturing [28,29], composites [30], and so on.
From the above, it can be seen that deep learning, Bayesian ridge, and random forest are commonly applied to feature prediction using big data. However, three points are worth noting. First, there is not much research on applying machine learning to the design of building structures or engineering. Second, there are very few introductions and studies of machine learning algorithms that are suitable for railway sleeper design, and it is not known whether all three algorithms are suitable. Third, the advantages and disadvantages of these three algorithms applied to sleeper design are unknown. Therefore, this study will build on the ideas of the previous literature, trying to apply machine learning to the design of prestressed concrete sleepers, namely to predict the positive and negative maximum bending moments. Then, the comparison of the three popular algorithms mentioned above will be performed.
3. Methodology
In terms of the design of railway prestressed concrete sleepers, this study mainly implements EN13230 “Railway Application-Track-Concrete sleepers and bearers” [4]. The core design sections are in the second part of the standard (EN13230-2 Concrete Sleepers and Bearers) and the sixth part (EN13230-6 Design). In this study, Python has been adopted. First, Python code is relatively versatile for coding. Second, it is easy to be complied with and translated by users. Third, object-oriented programming (OOP) in Python has great flexibility. Fourth, Python offers more options in terms of graphics packages and toolsets [31].
The design of the railway prestressed concrete sleepers includes multiple iterative steps for the rail seat section and the centre section (or midspan) of the sleepers. In this study, these steps will be automated. The machine learning application has been developed to design and optimise the top width of sleepers, the bottom width of sleepers, the height of sleepers, the eccentric distance, area, and tensile strength of the prestressed reinforcement, and the compressive strength of the concrete. The maximum positive and negative bending moment capacities that the sleeper sections can bear will be predicted by using the machine learning algorithms developed. The purpose of this machine learning application is to aid in the design optimisation for railway concrete sleepers, which is the precursor to better materials’ waste reduction and end-of-life management of railway concrete sleepers in practice.
Deep learning, Bayesian ridge, and random forest will be adopted and customised for data learning and prediction. The suitability of each machine learning algorithm will be assessed by comparisons of prediction errors and key performance metrics. The design database containing about 3000 groups of data will be used for training and testing the machine learning algorithms.
3.1. Database
A machine learning algorithm is generally based on analyzing a large amount of data to find out the rules, new experiences, and knowledge (training process) in order to finally solve and predict subsequent problems by using these rules, experiences, and knowledge (testing process). Therefore, establishing a database is an important and indispensable step for successful machine learning development [14].
In such a database, there are seven input data attributes related to the materials’ strengths, materials information, and cross-section geometry. These data have been collected from both experimental data and design calculation data for sleeper product approvals. The data sets also incorporate relevant experimental data, which are obtained from numerous papers in the open literature. There are about 50 sets of experimental data from the open literature that could be used in accordance with EN 13230. Note that all relevant data from the open literature are fully referenced.
The data of design calculations contains two parts for training and testing, in a total of about 3000 data sets. Among them, the input data structure has been organised to assimilate the experimental data. Note that the output data attributes are design information, which can be calculated by Equation (1) using sectional analysis methods (e.g., in Euro Code 2) where is the design concrete tensile stress under characteristic bending moment and consideration of shrinkage and creeping, is the remaining force of prestressing at the end of the sleeper lifetime (N), is the cross-section of the sleeper (mm2), is the eccentricity of the prestress force (mm), is the section modulus (mm3), is the bending moment due to service load (Nm2), and is the concrete flexural tensile strength after fatigue loads (N/mm2). Equation (2) is obtained from the transformation of the formula in Equation (1). Equation (1) is derived from EN13230-6-2020 [4], taking into account the concrete compressive strength, characteristic bending moments, shrinkage, and creep of concrete. Additional design information also includes the strength of prestress tendons and the maximum tensile stress on the upper and lower surfaces. In this study, the simplified load distribution obtained from the standard [4] is adopted, as illustrated in Figure 2, where is axle load from nominal weight of rolling stock, is the characteristic value of the vertical wheel load, is factor used for the effect of speed, is the characteristic load on a rail seat of the sleeper for normal service dynamic loading, is the factor used for rail pad attenuation, is the factor used for longitudinal distribution of vertical loads between sleeper, is the factors used for variation of the for longitudinal load distribution between sleepers due to support faults, is the negative bending moment at centre section from dynamic rail seat load , is the positive bending moment at the rail seat from dynamic rail seat load , is the factor used for calculation of characteristic bending moment at rail seat due to irregularities in the support along the length of sleeper, and is the internal lever arm of the forces and ballast reaction acting on the sleeper at the rail seat section. Note that our machine learning can also incorporate the redistribution charts (which are commonly found in other sleeper design standards such as AS1085.14, AREMA Chapter 30, and so on), but it is not within the scope of the study at this stage.
The output data attributes obtained from the experimental data and the hand-calculation data will be compared to assess the accuracy and reliability of the adopted design standard. The results will be illustrated in a later section. The hand-calculation data used in this exercise will also be used later for model testing.
The input data attributes span across a large diversity of the design data (for example, concrete strength from 50 MPa to 120 MPa). The output data can also be traced by using the equations above as well as additional information in the design standard.
3.2. Machine Learning
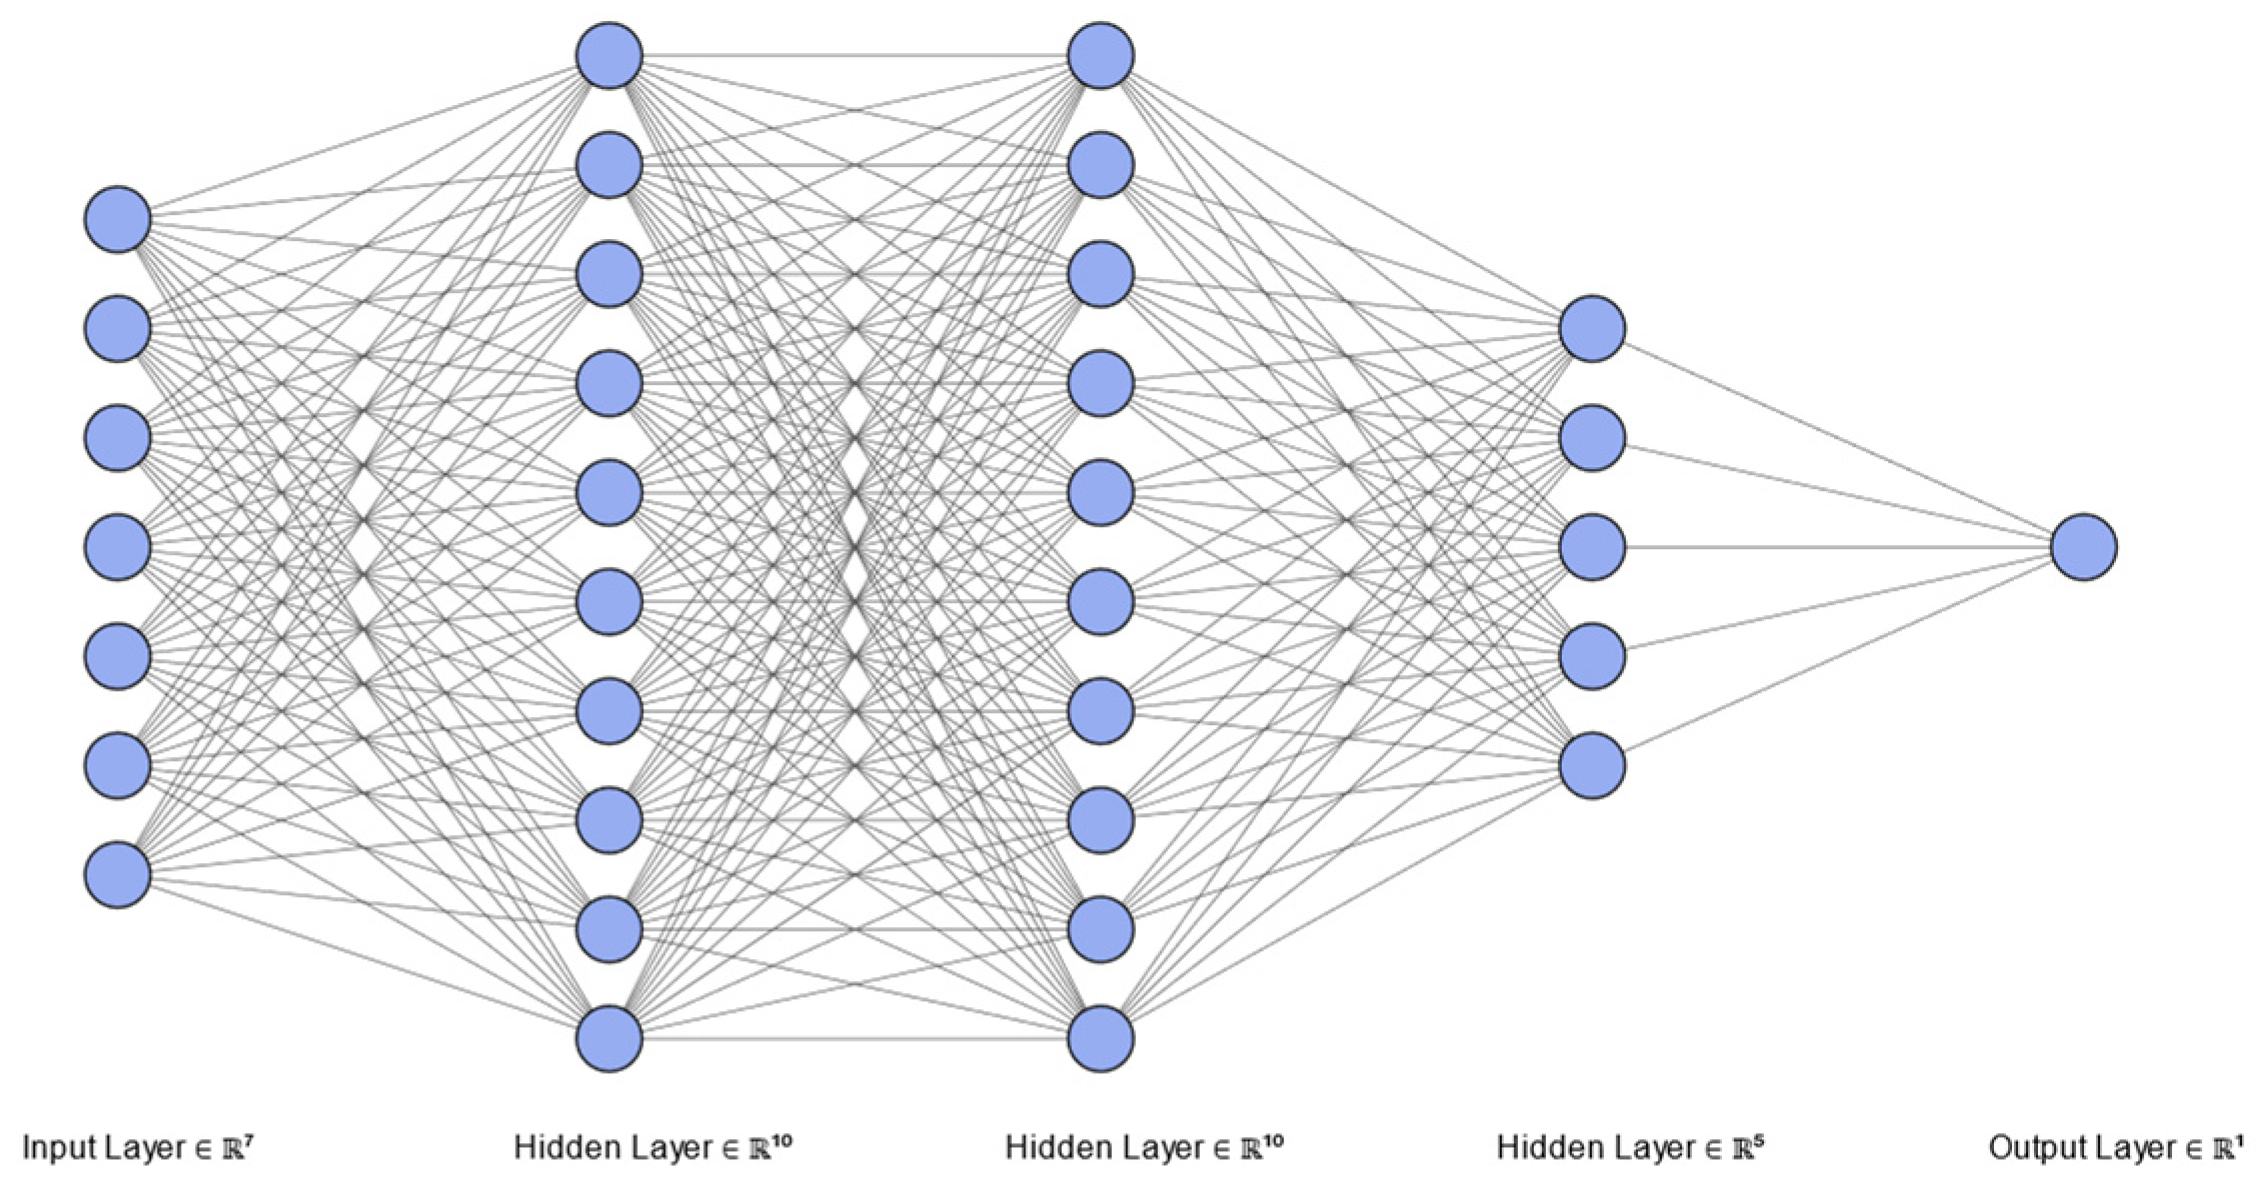
Deep learning is a machine learning concept based on artificial neural networks. For many applications, deep learning models outperform basic machine learning models and traditional data analysis methods [32]. The structure is deeper, containing a multi-layer perceptron with multiple hidden layers. Deep learning forms more abstract attribute categories of high-level representation or features by combining low-level features to discover distributed feature representation of data. The network architecture of deep learning used in the study is shown in Figure 3.
The encoding process covers a few steps. First, the design data is loaded for network training. The data in the database is divided into a training set and a test set. The training set occupies 70% of the database, and the test set occupies 30% of the database. Second, a machine learning model is constructed and customised to suit the input and output design attributes. In this model, four layers have been selected. Third, the networks, loss function and optimiser, averaging/weighting functions, and so on are defined. Fourth, the network training process commences. The training process will yield the results that help assess the machine learning algorithm. Fifth, after getting the results, the mean square error (MSE), root-mean-square error (RMSE), mean absolute error (MAE), and R square (R2) will be required, which will be used for evaluation model customisation, and then it will be determined whether the model can complete the design task sufficiently. The last part is the design prediction. The prediction algorithm will be rewritten, and the training model will be introduced into the prediction program to realise the input features of the design data and then aid in the prediction of design capacities of railway prestressed concrete sleepers.
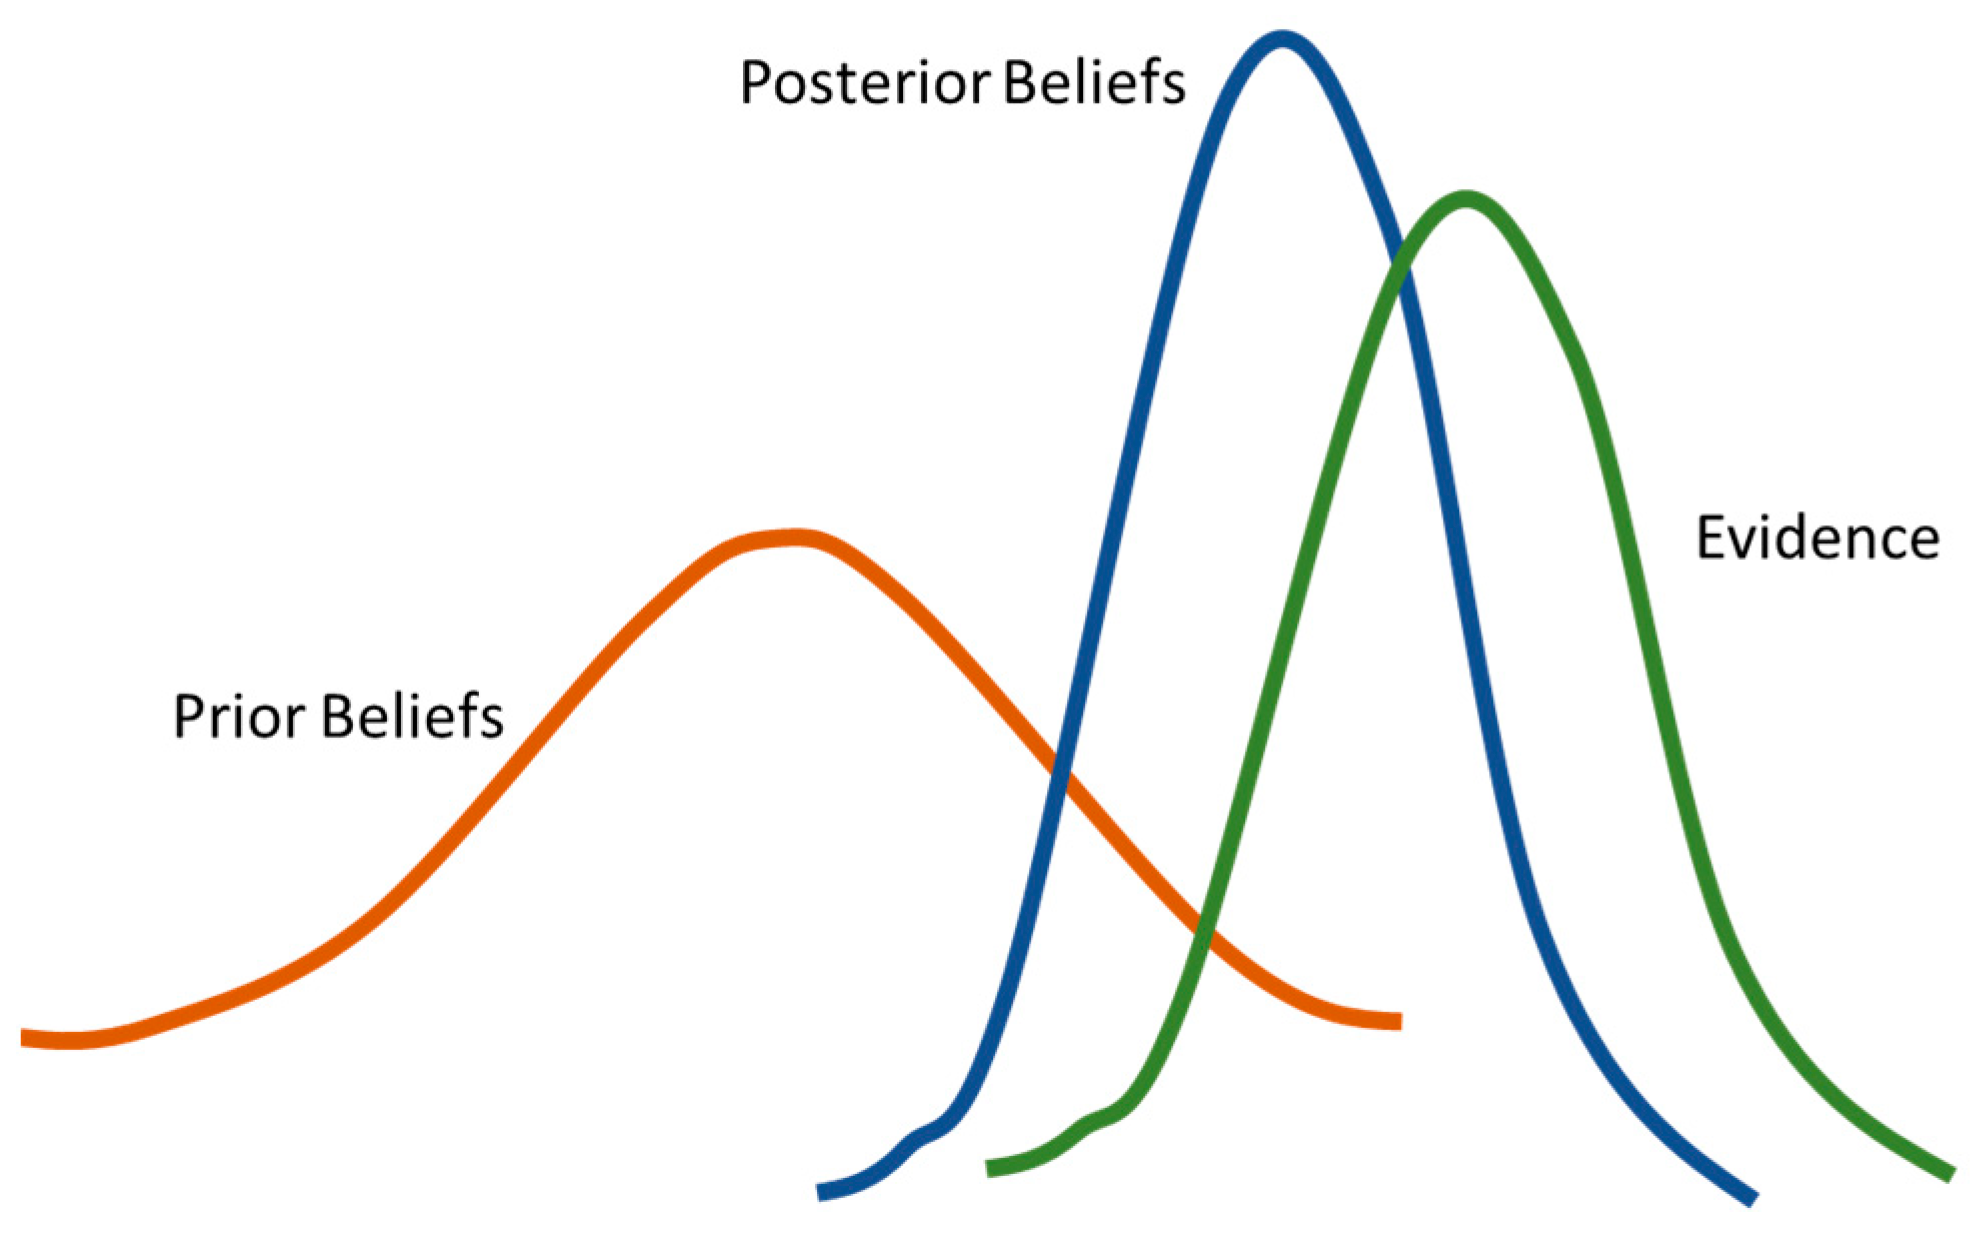
Bayesian network regression is a linear regression model solved by using the statistical Bayesian inference method [22]. The framework of Bayesian modelling has been praised for its ability to handle hierarchical data structures [33]. It combines the advantages of both Bayesian linear regression and ridge regression models. It has a very high utilisation rate of samples, reaching 100%, and can efficiently and accurately determine the complexity of the model [22]. The concept of the Bayesian linear regression is shown in Figure 4.
In the encoding process of the Bayesian model, the design data is first imported from Excel to partition the database. About 2416 sets of data will be used for training, representing approximately 80% of the total, with 605 data sets used for testing (about 20%). Second, the model dependency library is imported in order to build the Bayesian ridge model. Third, the model will be trained, and the results of the training will be evaluated by using MSE, RMSE, MAE, and R2. Lastly, based on the training model, the part of prediction will be added to realise the purpose of getting the input data and then getting the predicted data.
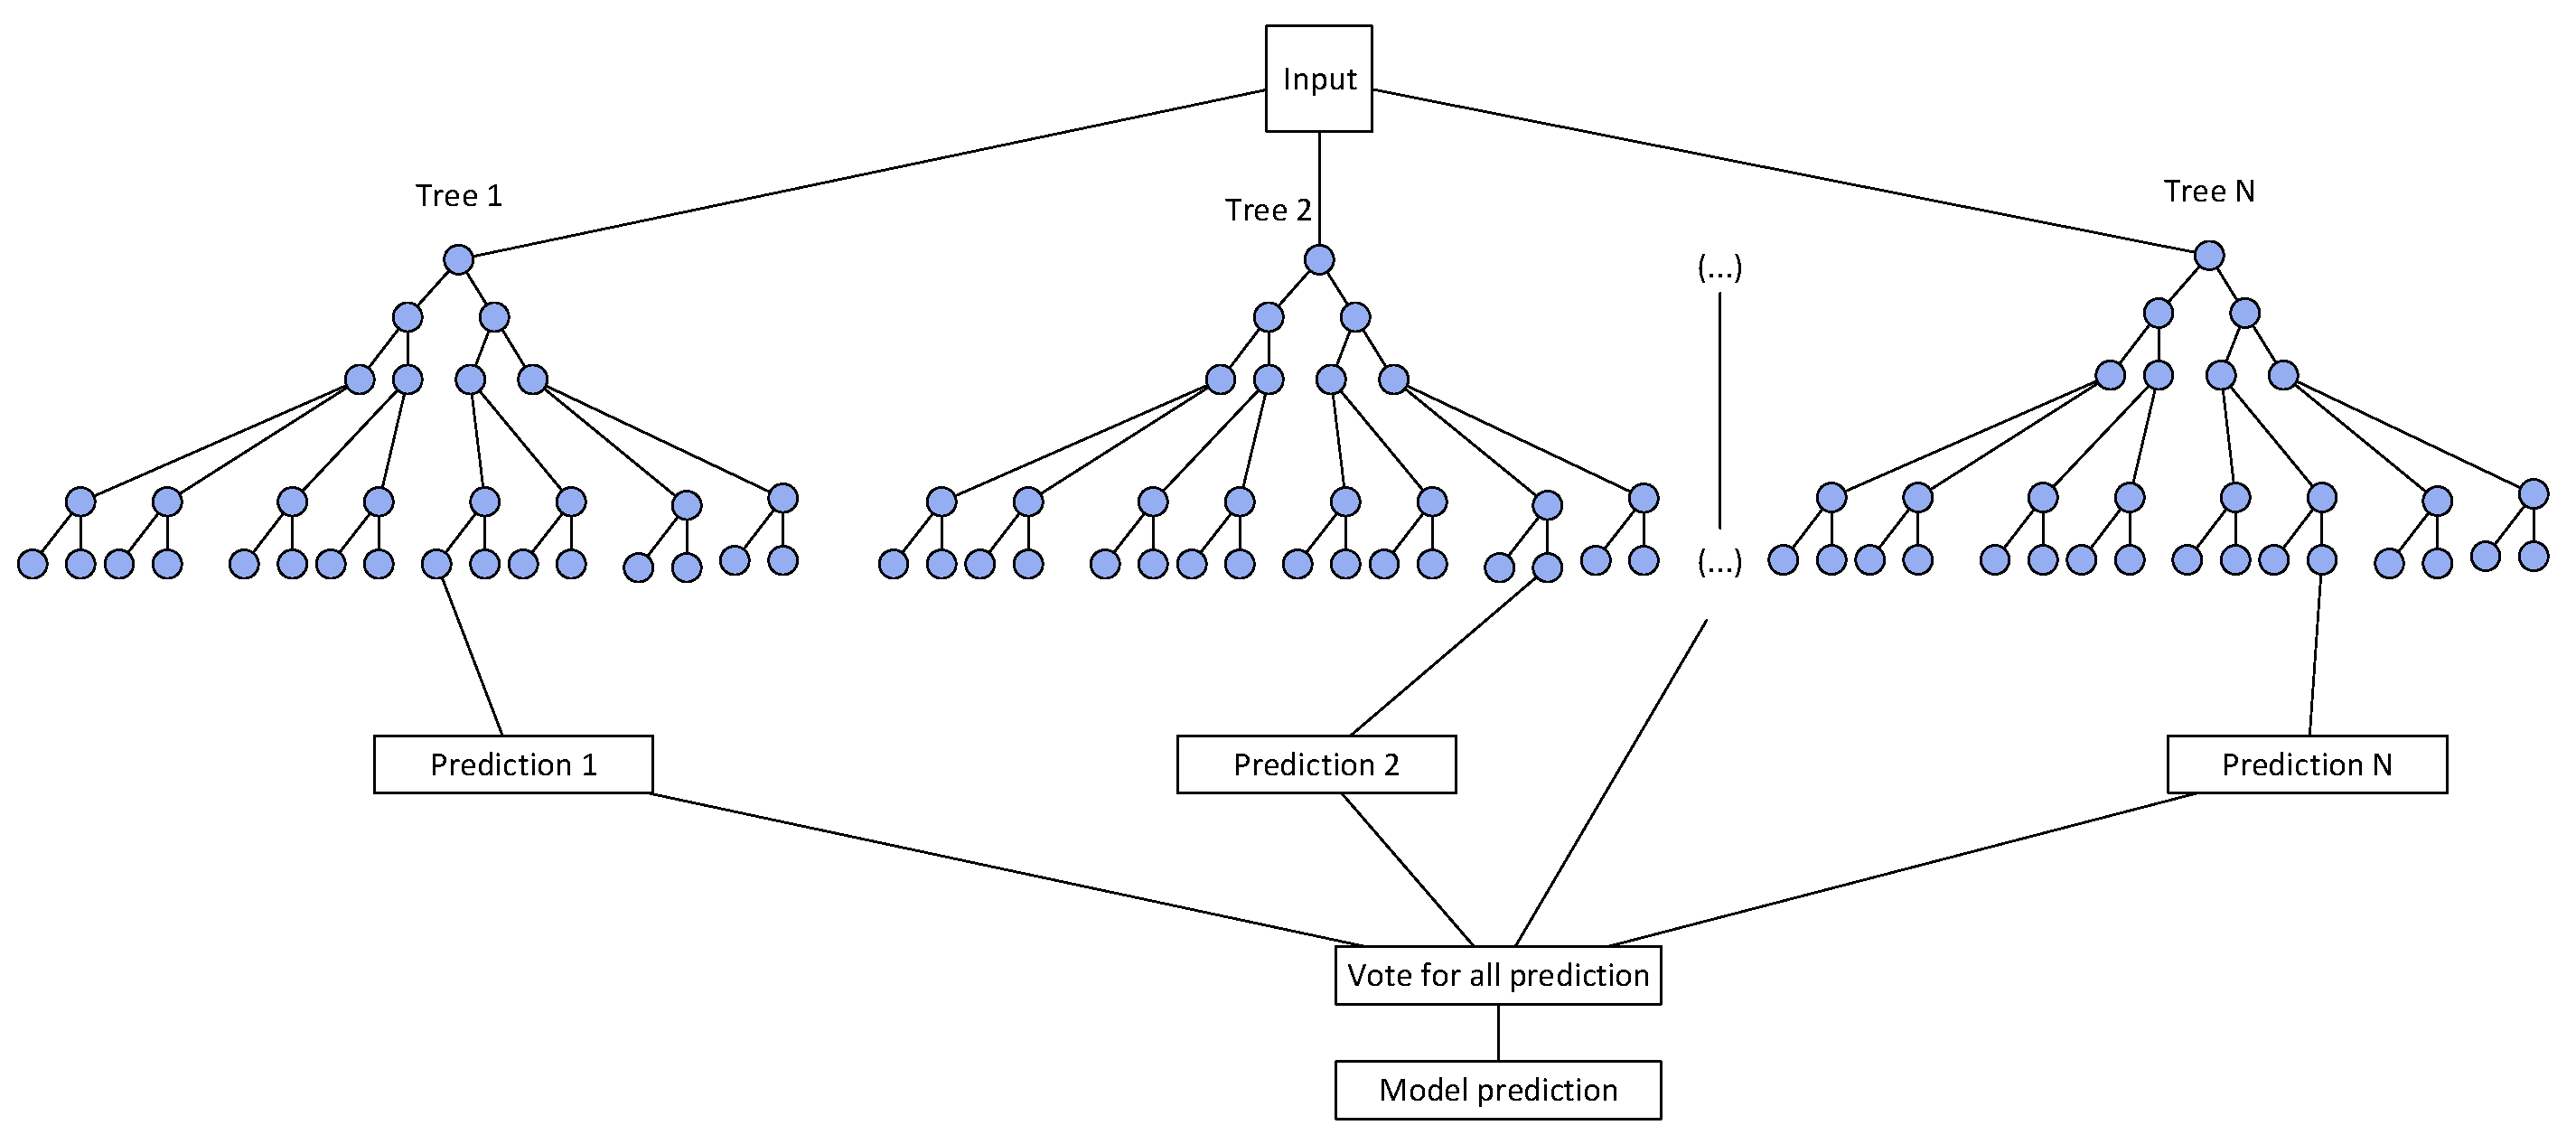
Random forest is a regression technique that combines the performance of many decision tree algorithms to predict the values of variables [35]. Random forest is not sensitive to multicollinearity, so the missing data and unbalanced data have little adverse impact on the prediction results, and up to thousands of feature variables can be used for accurate prediction [36]. This feature is attractive to design application when some design data is missing (or need to be guessed). The architecture of the random forest is shown in Figure 5.
4. Results and Discussion
4.1. Results
When developing the database, the vast majority of the data comes from design calculations. The hand design calculations will adopt the same design information of the cross-section as the experimental data. If the data from the hand calculation is the same or similar to the experimental data, the conditions of the data sets can be used for the data from subsequent hand calculations. Therefore, it is necessary to find out the two groups with similar data by comparison.
The results for the comparison of the experimental data and manual design data under the same cross-sections of railway prestressed concrete sleepers are shown in Figure 6. The results show a good correlation between the design standard (expected capacity from the manual calculation) and the experimental data (true capacity from sleeper testing). It can be seen that the design standard could either underestimate or overestimate the capacity of railway prestressed concrete sleepers. However, the correlation between expected and actual capacities is in a reasonably acceptable range.
The machine learning models have been well-trained for the design prediction of railway prestressed concrete sleepers. The models require an objective evaluation of the final results after training and testing. Predictions are the basis of decision-making, and the effect of the decision depends on a prediction performance with high accuracy and reliability. All four machine learning models have been tested with over 600 data sets. In this study, four performance parameters will be used to find out the accuracy of machine learning models, including MSE, RMSE, R2, and MAE, which are summarised in Table 2. It is worth noting that the lower MSE, RMSE, and MAE are preferable, while the higher R2 is preferable. It should be noted that the R2 can be negative, based on its equation, when the model performance is poor or the model cannot capture the trend of the data. MSE and RMSE tend to be higher than MAE because the values are powered in the calculation; however, they are used to present the effect of big error, which is clearer than MAE. R2 is used to explain how well the independent variables can explain the dependent variables. Every indicator has its own characteristic. Therefore, it is worth evaluating every indicator in terms of performance evaluation.
4.2. Discussion
From Figure 6, both the experimental data and the data from the hand calculation of some cross-sections of sleepers are different, but most of them are similar. The reasons these differences exist may be the following points.
- First, the design strength of the materials may be different from the actual material characteristics. In the test, the actual strength of materials of the sleepers, such as concrete and prestressed reinforcement, is not necessarily the same as the design data for which were recorded. However, most of the input data are calculated using the recorded design data. This may cause a discrepancy.
- Second, the loss of prestressing, in reality, can be different from the design estimation of loss. In the hand design calculation, according to the requirements of the code, the unified use of 40 years of loss of prestress is adopted. Around 25% of the total loss of prestress is commonly used in the design.
- Third, there are some discrepancies in the calculation. In various parts of the open literature, some key design data have not been given or tested directly, such as eccentricity and cross-section modulus. They need to be estimated through the design data. Therefore, many approximations are used in obtaining the values of these data sets. Through computational verification, this effect has relatively little impact on the calculation results, but some error still exists.
- Fourth, the measurement instruments and measurement conditions in the laboratory can cause an error. For example, there is a small deviation between the loading position and the recorded position, which directly affects the obtained bending moment data. Another example is that the effect of temperature is not considered in the calculation (assumed to be 20 °C). However, in the test, the temperature could cause the deformation of the prestressed concrete sleepers, affecting the experimental data.
Due to these effects, data sets with very similar data will be selected for subsequent computation and machine learning. However, due to the potential causes of the error, some improvement measures are proposed. First, it is critical to search for more options and collect and find more design data (especially to obtain more laboratory data). Second, temperature and other factors could be included in hand calculation to increase the accuracy of the calculation and make the design data from hand calculation closer to the actual performance (obtained from experimental tests).
The purpose of this study is to apply machine learning to the design of the railway prestressed concrete sleepers and to determine the most suitable machine learning technique among the three algorithms that have been developed. There are four indicators and parameters to measure the quality of the algorithms including mean squared error (MSE), root-mean-square error (RMSE), mean absolute error (MAE), and coefficient of determination (R2).
MSE (mean squared error) is an important indicator to measure the quality of different prediction algorithms, and it measures the deviation between the data of prediction and the true value. MSE is more sensitive to the outliers in the database, and it is ideal for ensuring that the model which has been trained does not have outlier predictions with large errors [37]. When the predicted data agrees exactly with the true data, the value of the MSE is equal to 0 [38]. Table 1 shows that the random forest algorithm is optimal, as the value of the MSE is only 0.54. The value of the MSE of the Bayesian ridge algorithm is 2.52. However, comparisons cannot be made visually due to the orders of magnitude differences between the predicted and true values [38]. However, it can be seen that the Bayesian ridge algorithm also performs well, while the deep learning algorithm is the worst. The MSE of the deep learning algorithm is as high as 31.73. This indicates that there are obvious outliers in the training model of the deep learning algorithm.
RMSE (root-mean-square error) has a similar meaning to MSE. It is also used to measure the deviation between the predicted data and the true data. However, it is more intuitive than MSE in orders of magnitude and is consistent with the observations [38]. When the value is closer to 0, the result is better. According to the comparison in Table 2, the value of the RMSE of the random forest algorithm is minimal, at only 0.79. In this study, the value size of the real data is almost always between 10 and 30. Thus, this error is very small and completely acceptable. The value of the RMSE of the Bayesian ridge algorithm is 1.59, which is also acceptable. However, the value of the RMSE of the deep learning algorithm is 5.63, which also, more intuitively, indicates the existence of obvious outliers.
MAE (Mean Absolute Error) is slightly different in definition from MSE, but interestingly, it provides an almost opposite property. MAE does not focus excessively on outliers [37]. It better reflects the actual situation of the error of the prediction data. When the value is closer to 0, the result is better. According to Table 2, the value of the MAE of the random forest algorithm is 0.32, which exhibits the best performance of the model. As above, this error is small by comparison with the true values. The value of the MAE of the Bayesian ridge algorithm is 1.14, which is also acceptable. However, the value of the MAE of the deep learning algorithm is 4.52. The accuracy of deep learning does not improve significantly, after greatly reducing the effect of outliers in the database. This shows that there could be big problems in this model architecture.
R2 refers to the correlation coefficient of the actual data and the predicted data. When the value of R2 is closer to 1, it is known that there is a better fit [39]. Normally, the acceptable value of R2 is greater than 80% [40]. The values of the R2 of the random forest algorithm and the Bayesian ridge algorithm are 0.99 and 0.95, respectively. Both values are very close to 1, so these two algorithms are reasonable. However, the value of the R2 of the deep learning algorithm is −0.01. This indicates that unacceptable overfitting could occur in the deep learning algorithm. Since there has never been a study covering this aspect, the performance of the models cannot be compared with others directly; the performances are, therefore, compared to the most similar study, in [17]. In that study, the highest R2 was 0.9752. It can be seen that the ranges of R2 from the Bayesian and random forest models are in the same range. Therefore, this is another piece of evidence that proves that the performance of the machine learning developed in this study is satisfying.
5. Conclusions
This study develops a new machine learning application to aid in the design of railway prestressed concrete sleepers. In this study, about 3000 sets of design data have been collected and used for machine learning development. The capabilities of machine learning for the design application have been demonstrated. The expected contribution of the study is fulfilled based on the performances of the developed machine learning model. The accuracies are high, while the overall errors are relatively low. This proves that the developed machine learning models can be applied in the design process of prestressed concrete sleepers. It is believed that the models can shorten the time of the design process. At the same time, is the models are another tool that designers can use to recheck a design based on the traditional approach. Based on a critical literature review, three machine learning techniques that are the most suitable for application have been considered, including deep learning, Bayesian learning, and the random forest technique. The quality and quantity of the database have a great impact on the algorithms of machine learning. Especially in the deep learning model, performance could be partly affected by the design data structure. The deep learning algorithm does not perform well in this study, although the design database was simultaneously cleaned and normalised. It is suggested that (i) more historical data be collected to expand the design databases and (ii) the data structure be simplified for deep learning.
The random forest algorithm performs very well in this study. The method forbids a simple interpretation of the relationship between response and predictor variables, and the data are generally overfitted. Our results reveal that this algorithm outperforms other machine learning techniques.
Based on the investigations into all three machine learning models, it can be seen that the random forest algorithm and Bayesian network can be successfully applied to the design of railway prestressed concrete sleepers. Machine learning can help automate the complex and repetitive procedures of the design of railway prestressed concrete sleepers. Notably, the deep learning algorithm did not perform very well, considering all performance indicators.
Future work will benchmark the results with other machine learning models [41], in order to improve the automation process. In addition, other parameters will also be considered to be predicted using machine learning, such as the other dimensions of sleepers, spacing of sleepers, or type of sleepers. The insight will be essential in enabling the component digital twin, aiding in the design and manufacture of railway prestressed concrete sleepers. This is the precursor to a reduction in material waste and an improvement in the circular economy of railway prestressed concrete sleepers.
Author Contributions
Conceptualisation, S.K. and Y.Z.; methodology, Y.Z.; software, Y.Z.; validation, J.S., J.H., and C.N.; formal analysis, Y.Z.; investigation, Y.Z.; resources, Y.Z.; data curation, A.M.R.; writing—original draft preparation, Y.Z.; writing—review and editing, J.S.; visualisation, J.H.; supervision, C.N.; project administration, A.M.R.; funding acquisition, S.K. All authors have read and agreed to the published version of the manuscript.
Funding
This research was funded by the European Commission grant number 691135.
Institutional Review Board Statement
Not applicable.
Informed Consent Statement
Not applicable.
Data Availability Statement
The data presented in this study are available on request from the corresponding author.
Acknowledgments
The authors also wish to thank the European Commission for the financial sponsorship of the H2020-RISE project no. 691135 “RISEN: Rail Infrastructure Systems Engineering Network”, which enables a global research network that addresses the grand challenge of railway infrastructure resilience and advanced sensing in extreme environments (www.risen2rail.eu, accessed on 30 September 2021). The APC is kindly sponsored by the MDPI’s Invited Paper Initiative.
Conflicts of Interest
The authors declare no conflict of interest.
References
- Jing, G.; Siahkouhi, M.; Riley Edwards, J.; Dersch, M.S.; Hoult, N.A. Smart railway sleepers—A review of recent developments, challenges, and future prospects. Constr. Build. Mater. 2021, 271, 121533. [Google Scholar] [CrossRef]
- Kaewunruen, S.; Fu, H.; Ye, C. Numerical studies to evaluate crack propagation behaviour of prestressed concrete railway sleepers. Eng. Fail. Anal. 2022, 131, 105888. [Google Scholar] [CrossRef]
- Kaewunruen, S.; Remennikov, A.M.; Murra, M.H. Briefing: Limit States Design of Railway Concrete Sleepers; Thomas Telford Ltd.: London, UK, 2012. [Google Scholar]
- EN 13230-2:2009; Railway Applications-Track-Concrete Sleepers and Bearers Part 2: Prestressed Monoblock Sleepers. The British Standards Institution: London, UK, 2009.
- UIC 713: 1ED 2004; Designof Monoblock Concrete Sleepers. International Union of Railways: France, Paris, 2004.
- Fan, J.; Wang, C.; Song, L. Research and application of intelligent computation in civil engineering. J. Build. Struct. 2022, 43, 1–22. [Google Scholar] [CrossRef]
- Jordan, M.I.; Mitchell, T.M. Machine learning: Trends, perspectives, and prospects. Science 2015, 349, 255–260. [Google Scholar] [CrossRef]
- Chen, B.; Han, J.-Y.; Tang, X.-L.; Xia, B.-R. Prediction Model for Elongation of Tension Leveling Based on Machine Learning Algorithm and Numerical Analysis. J. Northeast. Univ. 2022, 43, 236. [Google Scholar]
- Kaewunruen, S.; Remennikov, A.M. Structural safety of railway prestressed concrete sleepers. Aust. J. Struct. Eng. 2009, 9, 129–140. [Google Scholar] [CrossRef]
- Kaewunruen, S.; Remennikov, A.M.; Murray, M.H. Introducing a new limit states design concept to railway concrete sleepers: An Australian experience. Front. Mater. 2014, 1, 8. [Google Scholar] [CrossRef] [Green Version]
- Fib. Concrete Railway Sleepers; Fédération Internationale du Béton (Fib): Lausanne, Switzerland, 1987. [Google Scholar]
- You, R.; Li, D.; Ngamkhanong, C.; Janeliukstis, R.; Kaewunruen, S. Fatigue life assessment method for prestressed concrete sleepers. Front. Built Environ. 2017, 3, 68. [Google Scholar] [CrossRef] [Green Version]
- Bai, L.; Wang, J. Design and Calculation of Prestressed Concrete Sleeper; Concrete and Cement Products: Shanghai, China, 2009. [Google Scholar]
- Ding, Z.; Li, X.; Zhang, X. Research and prospect of surface deformation prediction of shield tunneling based on machine learning. Hazard Control. Tunn. Undergr. Eng. 2021, 2, 27–30. Available online: http://tunnel.sdujournals.com/EN/Y2022/V4/I3/1 (accessed on 6 June 2021).
- Fang, R.; Liu, Y.; Huang, Z. A review of the methods of regional landslide hazard assessment based on machine learning. Chin. J. Geol. Hazard Control 2021, 32, 1–8. [Google Scholar]
- Kadam, V.S.; Kanhere, S.; Mahindrakar, S. Regression techniques in machine learning &applications: A review. Int. J. Res. Appl. Sci. Eng. Technol. 2020, 8, 826–830. [Google Scholar]
- Marie, H.S.; Abu el-hassan, K.; Almetwally, E.M.; El-Mandouh, M.A. Joint Shear Strength Prediction of Beam-Column Connections using Machine Learning via Experimental Results. Case Stud. Constr. Mater. 2022, 17, e01463. [Google Scholar] [CrossRef]
- Sharma, N.; Sharma, R.; Jindal, N. Machine learning and deep learning applications-a vision. Glob. Transit. Proc. 2021, 2, 24–28. [Google Scholar] [CrossRef]
- Najafabadi, M.M.; Villanustre, F.; Khoshgoftaar, T.M.; Seliya, N.; Wald, R.; Muharemagic, E. Deep learning applications and challenges in big data analytics. J. Big Data 2015, 2, 1. [Google Scholar] [CrossRef]
- Krizhevsky, A.; Sutskever, I.; Hinton, G.E. ImageNet classification with deep convolutional neural networks. Commun. ACM 2017, 60, 84–90. [Google Scholar] [CrossRef] [Green Version]
- Hinton, G.; Deng, L.; Yu, D.; Dahl, G.E.; Mohamed, A.-R.; Jaitly, N.; Senior, A.; Vanhoucke, V.; Nguyen, P.; Sainath, T.N.; et al. Deep neural networks for acoustic modeling in speech recognition: The shared views of four research groups. IEEE Signal Process. Mag. 2012, 29, 82–97. [Google Scholar] [CrossRef]
- Yang, Y.; Yang, Y. Hybrid prediction method for wind speed combining ensemble empirical mode decomposition and Bayesian ridge regression. IEEE Access 2020, 8, 71206–71218. [Google Scholar] [CrossRef]
- Awada, M.; Srour, F.J.; Srour, I.M. Data-driven machine learning approach to integrate field submittals in project scheduling. J. Manag. Eng. 2021, 37, 04020104. [Google Scholar] [CrossRef]
- Cutler, D.R.; Edwards, T.C., Jr.; Beard, K.H.; Cutler, A.; Hess, K.T.; Gibson, J.; Lawler, J.J. Random forests for classification in ecology. Ecology 2007, 88, 2783–2792. [Google Scholar] [CrossRef]
- Li, X. Using “random forest” for classification and regression. Chin. J. Appl. Entomol. 2013, 50, 1190–1197. [Google Scholar]
- Zhou, J.; Shi, X.; Du, K.; Qiu, X.; Li, X.; Mitri, H.S. Feasibility of random-forest approach for prediction of ground settlements induced by the construction of a shield-driven tunnel. Int. J. Geomech. 2017, 17, 04016129. [Google Scholar] [CrossRef]
- Khorasani, M.; Loy, J.; Ghasemi, A.H.; Sharabian, E.; Leary, M.; Mirafzal, H.; Cochrane, P.; Rolfe, B.; Gibson, I. A review of Industry 4.0 and additive manufacturing synergy. Rapid Prototyp. J. 2022, 28, 1462–1475. [Google Scholar] [CrossRef]
- Qin, J.; Hu, F.; Liu, Y.; Witherell, P.; Wang, C.C.L.; Rosen, D.W.; Simpson, T.W.; Lu, Y.; Tang, Q. Research and application of machine learning for additive manufacturing. Addit. Manuf. 2022, 52, 102691. [Google Scholar] [CrossRef]
- Lu, C.; Shi, J. Relative density prediction of additively manufactured Inconel 718: A study on genetic algorithm optimized neural network models. Rapid Prototyp. J. 2022, 28, 1425–1436. [Google Scholar] [CrossRef]
- Griffin, D.W.P.; Mirza, O.; Kwok, K.; Kaewunruen, S. Composite slabs for railway construction and maintenance: A mechanistic review. IES J. Part A Civ. Struct. Eng. 2014, 7, 243–262. [Google Scholar] [CrossRef]
- Ozgur, C.; Colliau, T.; Rogers, G.; Hughes, Z. MatLab vs. Python vs. R. J. Data Sci. 2017, 15, 355–371. [Google Scholar] [CrossRef]
- Janiesch, C.; Zschech, P.; Heinrich, K. Machine learning and deep learning. Electron. Mark. 2021, 31, 685–695. [Google Scholar] [CrossRef]
- Shi, Q.; Abdel-Aty, M.; Lee, J. A Bayesian ridge regression analysis of congestion’s impact on urban expressway safety. Accid. Anal. Prev. 2016, 88, 124–137. [Google Scholar] [CrossRef]
- NSS. Bayesian Statistics Explained to Beginners in Simple English. 2019. Available online: https://www.analyticsvidhya.com/blog/2016/06/bayesian-statistics-beginners-simple-english/ (accessed on 25 September 2022).
- Breiman, L. Random Forests. Mach. Learn. 2001, 45, 5–32. [Google Scholar] [CrossRef] [Green Version]
- Zhang, J.; Guo, W.; Song, B.; Zhou, Y.; Zhang, Y. Performance Prediction of Asphalt Pavement Based on Random Forest. J. Beijing Univ. Technol. 2021, 47, 1256–1263. [Google Scholar]
- Seif, G. Understanding the 3 Most Common Loss Functions for Machine Learning Regression. Data Sci. 2019. Available online: https://towardsdatascience.com/understanding-the-3-most-common-loss-functions-for-machine-learning-regression-23e0ef3e14d3 (accessed on 25 September 2022).
- Shcherbakov, M.V.; Brebels, A.; Shcherbakova, N.L.; Tyukov, A.P.; Janovsky, T.A.; Kamaev, V.A.E. A survey of forecast error measures. World Appl. Sci. J. 2013, 24, 171–176. [Google Scholar]
- Tseranidis, S.; Brown, N.C.; Mueller, C.T. Data-driven approximation algorithms for rapid performance evaluation and optimization of civil structures. Autom. Constr. 2016, 72, 279–293. [Google Scholar] [CrossRef] [Green Version]
- Colton, J.A.; Bower, K.M. Some misconceptions about r2. International Society of Six Sigma Professionals. EXTRA Ordinary Sense 2022, 3, 20–22. Available online: http://wserver.crc.losrios.edu/~larsenl/ExtraMaterials/MisconceptionsR2.pdf (accessed on 25 September 2022).
- Li, X.; Wang, Y. Applying various algorithms for species distribution modelling. Integr. Zool. 2013, 8, 124–135. [Google Scholar] [CrossRef]
Figure 1.
End-of-life railway prestressed concrete sleepers. Concrete is relatively intact in many sleepers after 50 years, raising a concern for better design optimisation. (Courtesy: Abetong AB).
Figure 1.
End-of-life railway prestressed concrete sleepers. Concrete is relatively intact in many sleepers after 50 years, raising a concern for better design optimisation. (Courtesy: Abetong AB).

Figure 2.
Load distribution for the determination of bending moments [4].
Figure 2.
Load distribution for the determination of bending moments [4].

Figure 3.
The network architecture of deep learning in the study.

Figure 4.
The concept of the Bayesian model, modified from [34].
Figure 4.
The concept of the Bayesian model, modified from [34].

Figure 5.
The architecture of random forest.

Figure 6.
Comparison between experimental data and hand-calculated data.


Table 1.
Most commonly found problems related to railway concrete sleepers based on international survey outcomes from railway industry networks globally (ranked from 1 to 8, with 8 being the most critical).
Table 1.
Most commonly found problems related to railway concrete sleepers based on international survey outcomes from railway industry networks globally (ranked from 1 to 8, with 8 being the most critical).
| Main Causes | Problems | North American Response | International Response |
|---|---|---|---|
| Lateral load | Abrasion on rail seat | 6.43 | 3.15 |
| Shoulder/fastening system wear or fatigue | 6.38 | 5.5 | |
| Vertical dynamic load | Cracking from dynamic loads | 4.83 | 5.21 |
| Derailment damage | 4.57 | 4.57 | |
| Cracking from centre binding | 4.5 | 5.36 | |
| Manufacturing and maintenance defects | Tamping damage | 4.14 | 6.14 |
| Others (e.g., manufactured defect) | 3.57 | 4.09 | |
| Environmental considerations | Cracking from environmental or chemical degradation | 3.5 | 4.67 |
Table 2.
Comparison of models’ prediction accuracy.
| Model | MSE | RMSE | MAE | R2 |
|---|---|---|---|---|
| Bayesian ridge | 2.52 | 1.59 | 1.14 | 0.95 |
| Random forest | 0.54 | 0.74 | 0.25 | 0.99 |
| Deep learning | 31.73 | 5.63 | 4.52 | −0.01 |
Publisher’s Note: MDPI stays neutral with regard to jurisdictional claims in published maps and institutional affiliations. |
© 2022 by the authors. Licensee MDPI, Basel, Switzerland. This article is an open access article distributed under the terms and conditions of the Creative Commons Attribution (CC BY) license (https://creativecommons.org/licenses/by/4.0/).
Share and Cite
MDPI and ACS Style
Kaewunruen, S.; Sresakoolchai, J.; Huang, J.; Zhu, Y.; Ngamkhanong, C.; Remennikov, A.M. Machine Learning Based Design of Railway Prestressed Concrete Sleepers. Appl. Sci. 2022, 12, 10311. https://doi.org/10.3390/app122010311
AMA Style
Kaewunruen S, Sresakoolchai J, Huang J, Zhu Y, Ngamkhanong C, Remennikov AM. Machine Learning Based Design of Railway Prestressed Concrete Sleepers. Applied Sciences. 2022; 12(20):10311. https://doi.org/10.3390/app122010311
Chicago/Turabian StyleKaewunruen, Sakdirat, Jessada Sresakoolchai, Junhui Huang, Yingyu Zhu, Chayut Ngamkhanong, and Alex M. Remennikov. 2022. "Machine Learning Based Design of Railway Prestressed Concrete Sleepers" Applied Sciences 12, no. 20: 10311. https://doi.org/10.3390/app122010311
Note that from the first issue of 2016, this journal uses article numbers instead of page numbers. See further details here.