Radial Gradient Pressure Effects on Flow Behavior in a Dual Volute Turbocharger Turbine


1
Automotive Simulation and Optimal Design Research Laboratory, School of Automotive Engineering, Iran University of Science and Technology, Tehran 1684613114, Iran
2
Mechanical Engineering Department, Iran University of Science and Technology, Tehran 1684613114, Iran
*
Author to whom correspondence should be addressed.
Appl. Sci. 2018, 8(10), 1961; https://doi.org/10.3390/app8101961
Submission received: 1 August 2018
/
Revised: 2 September 2018
/
Accepted: 6 October 2018
/
Published: 17 October 2018
(This article belongs to the Special Issue Radial Turbomachinery Aerodynamics)
Abstract
:The pressure gradient in the dual volute radial turbocharger turbines is the primary source of the vortices’ formation in rotor passages. The effects of the upstream non-uniform flow conditions on the development of secondary flows are not well known. In this study, the effect of highly skewed and non-uniform mass flow on the secondary vortices in different admission cases in a dual entry turbine was investigated using CFD modeling. The results agree well with the experiment, and show that increasing the inequality of the pressure between the entries leads to a reduction in the turbine’s performance. Some useful energy dissipates due to mixing the flows of the entries. Isolating the rotor sectors in the tongues region was applied with the purpose of limiting the mixing. Also, the vortices’ behavior in the rotor passages with different surface pressure ratios for the passage sides were investigated for both equal and partial admission. The surface pressure of the airfoil pressure side was more effective on the tip and trailing edge vortex than the suction side, while the leading-edge root vortex did not change by any variation in the surface pressure ratio. The vortices’ center location shifted with the pressure variation, and consequently, by decreasing the pressure level, the center of the tip vorticity turned to the upstream sections, and the leading-edge root vortex center moved closer to the pressure side.
1. Introduction
The flow behavior of radial turbines has attracted the attention of many researchers [1]. Twisting the blade along the span and the passage produces an inherently three-dimensional (3D) flow. Different admission conditions add extra complexity in the case of dual volute turbines. Double entry turbines are used in automotive turbochargers for preserving the pulsating exhaust flow energy [2]. Dual entry turbines work most of the time with the unbalanced flow. In the partial admission situation, only one entry is fed [3]. Several studies have been published over the years regarding the effects of unequal admission effects on turbine performance. Copeland et al. [4,5,6] and Copeland [7] performed detailed studies on a double volute turbine. Their results showed that increasing the inequality between the internal mass flows of the entries leads to an efficiency drop, especially at the lower powers. Copeland [7] found some dependency between the two entries of the dual volute, even when they were kept entirely separate. They reported that a significant interaction of two entries also adds considerable dissipation in the interspace region between the stator and the rotor [6]. The results showed that the flow developing from high-pressure entry into this region chocks the flow from the other entry with the low-pressure fluid.
Newton et al. [8] focused on the loss generation in a partial admission case. They found that the entropy produced in the non-flowing section of the rotor wheel had the same magnitude as that in the working section. Also, they showed that when the vortices in the non-flowing area entered into the flowing part of the volute, further losses will be created. When the primary objective is to increase turbine efficiency and the total pressure ratio, secondary flow should be defined and controlled [9]. Secondary flow regions are always the origin of higher losses. The cascade passage vortex, corner vortex, tip clearance vortex, horseshoe vortex, and annulus end wall boundary layer are some of the well-known vortex structures in axial turbines; they are not independent mechanisms, and as can be observed in experiments, they overlap and interact [9].
Sieverding studied the secondary flows in turbines [10]. Blade loading, load distribution, the incidence, and the inlet boundary layer affect the secondary flow characteristics. Classic secondary flows in axial turbines are known [9]. However, there is a lack of knowledge regarding the understanding of the physical origin of the correlated “secondary loss” also in the effects of the upstream non-uniform flow conditions on the formation of secondary flows [11]. Several studies investigated the secondary vortices in a linear cascade. Moustafa compared a linear and an annular cascade with the same two-dimensional blade geometry that was employed [12]. He showed that the radial pressure gradient in the annular cascades changes the pressure loss distribution compared to the linear passage, which experiences no such pressure gradient. A radial pressure gradient is added to the flow everywhere in the annular passage, because the flow area in the cascade passage increases from the hub to the tip of the adjacent blades [13]. From the pressure side to the suction side, the radial pressure gradient increases [14]. Flow visualization studies by Goldstein and Spores [15], Langston et al. [16], Sieverding and Bosche [17], and Wang et al. [18] have indicated that the pressure-side leg of the horseshoe vortex is a dominant constituent of the passage vortex system. Ciorciar et al. investigated the effect of periodically incoming wakes on the axial loss development [19]. They found higher front-loading results in a lower intensity of the secondary flow downstream of the trailing edge. Also, there are lots of research studies about radial turbines. Mohammad Putra et al. [20] presented an investigation of secondary flow phenomena in a radial one-entry scroll turbine nozzle. They showed instead of the passage vortex of the axial turbines, the “inflow” vortex caused by the unsymmetrical flow in radial turbines can be recognized. Marsan and Moreau studied the effect of rotor–stator interaction and tip leakage flow on the secondary flow of radial turbines [21].
None of the past studies investigated the effect of the radial pressure gradient on the secondary flow structure. In dual turbocharger turbines, the second inlet in unequal admission adds additional radial pressure gradients. Due to its significant effect on vortex formation and flow behavior, in this study, it was investigated briefly. In this article, the effect of the pressure side and suction side surface pressure on all of the passage vortices’ size, intensity, and central location is investigated. Vorticity contours at different sections in the streamwise direction as well as pressure loss in the spanwise directions of rotor passages in the case of partial and equal admission were studied. Choosing passages with a similar surface pressure ratio (SPR) in partial and equal admission gives the possibility of studying pressure magnitude effects on the vortices.
Furthermore, limiting the inlet charge mixing in the interspace region with the purpose of increasing the efficiency was investigated.
2. Computational Analysis
Three-dimensional (3D) CFD analysis was performed for a mixed flow dual entry turbocharger turbine. The turbine was constructed by ABB turbo systems. The geometry map of the turbine and experimental data was taken from Copeland et al. (2010) [7]. For equal and unequal admission modeling, a whole turbine, which includes the double entry volute, a stator with 24 blades, a rotor with 12 blades, and a diffuser were used. The rotor and stator were modeled with Ansys BladeGen software and modified in Ansys DesignModeler. The volute model was constructed in SolidWorks 2016. All of the turbine components were assembled in DesignModeler. Table 1 records some of the geometry characteristics of the rotor and the stator.
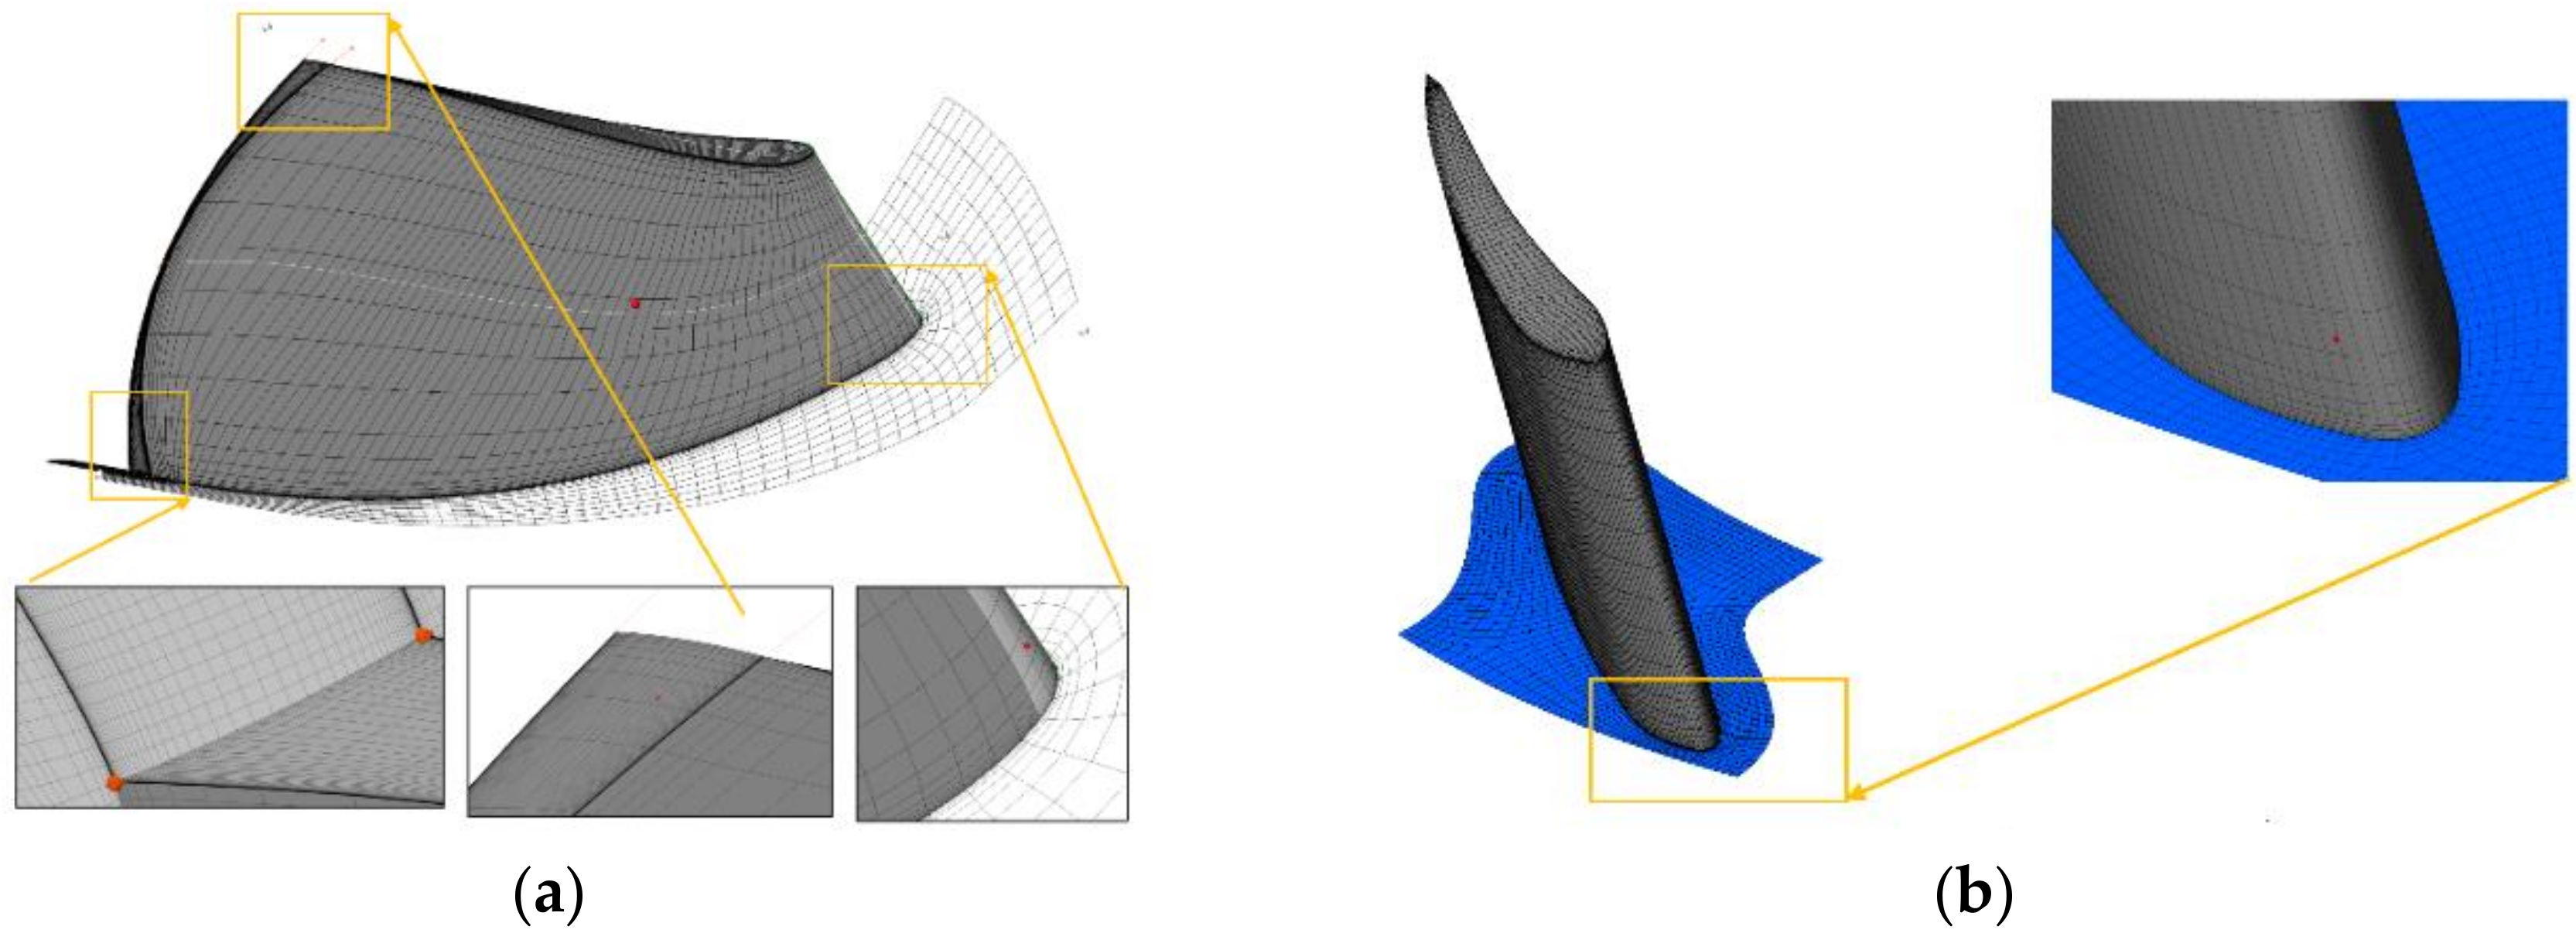
The computational analysis was performed using the ANSYS CFX 17 CFD package. CFX is a commercial CFD code and it’s pre- and post-processors include many functions for the turbomachinary analysis. In a dual volute turbine, the flow around the rotor is introduced non-uniformly, so an acceptable result can only be obtained by taking all of the circumference into account. A frozen rotor interface was implemented between the rotor and the stator. A structured mesh was generated for the rotor and stator mesh using TurboGrid-11. In the tip clearance gap, at least 10 nodes were assumed. Different cell numbers were used to find the most proper mesh density; specifications of the trials for rotor and stator are depicted in Table 2. Between the applied grid resolutions, rows 4 and 5 show the least variation in the efficiency and mass flow. However, there is a significant difference in their CPU time. Therefore, as a balance between the precision, computational expenditure, and grid independence, mesh size in the fourth row of Table 3 was selected. Furthermore, to ensure that all of the flow features were simulated, contour plots at different streamwise locations were produced and compared with raising the mesh size, until the flow features remained without any changes. Figure 1 shows the structured mesh of the rotor and nozzle passages with detailed enlargements of the areas of interest.
The finite volume method was used to discretize and solve the governing flow equations. The high-resolution scheme was used for the calculation of the advection term. The Reynolds number was at the stator inlet, so the flow was assumed to be fully turbulent. The standard k-ϵ was implemented for turbulence modeling. The root mean square (RMS) residual level was set as 1 × 10⁻⁵, this is a good convergence by CFX [22] code from Ansys. Y+ values were obtained that were lower than two in most places. In the other areas, the maximum Y+ was 6. The minimum cell angle of all of the domains was 15 degrees. The boundary conditions were taken from experimental data from Copeland et al. (2010) [7]. Total pressure at the entrance, static pressure at the exit, and temperature were used for boundary conditions (Table 3). In equal admission, the turbine was simulated in five cases, and in unequal admission, four cases were considered. In partial admission, one of the entries is empty of charge, while the other one is full (Table 3, Case 6).
3. Comparison with Experimental Data
Validation of the turbine model can be investigated by four performance parameters defined by Equations (1) to (4). Equation (1) gives the mass flow parameter:
where is the mass flow rate (), T is temperature (K), and P is pressure (Pa). is the dimensionless pressure ratio evaluated using Equation (2):
is the total inlet pressure and is the exit static pressure. The velocity ratio is defined by Equation (3):
where is the isentropic flow velocity, U is the blade speed (m/s), N is the turbine speed (rev/s), is the rotor mean inlet diameter (m), and is the specific heat capacity for constant pressure (J/kg/K). The efficiency definition is the total-to-static isentropic efficiency calculated by Equation (4):
In this equation, is the rotational speed (rad/s), is the torque (Nm), and is the ratio of specific heats. The mass flow ratio is evaluated as Equation (5), which is a useful parameter that is used to define the degree of inequality and varies from 1 in full admission to 0 in partial admission [23].
In this study we use from (1-MFR) which is more instinctive number, because it changes from 0 in equal admission where the inequality is equal to zero, to one in partial admission with maximum inequality. is the mass flow of the low-pressure limb, and is the mass flow of the high-pressure limb.
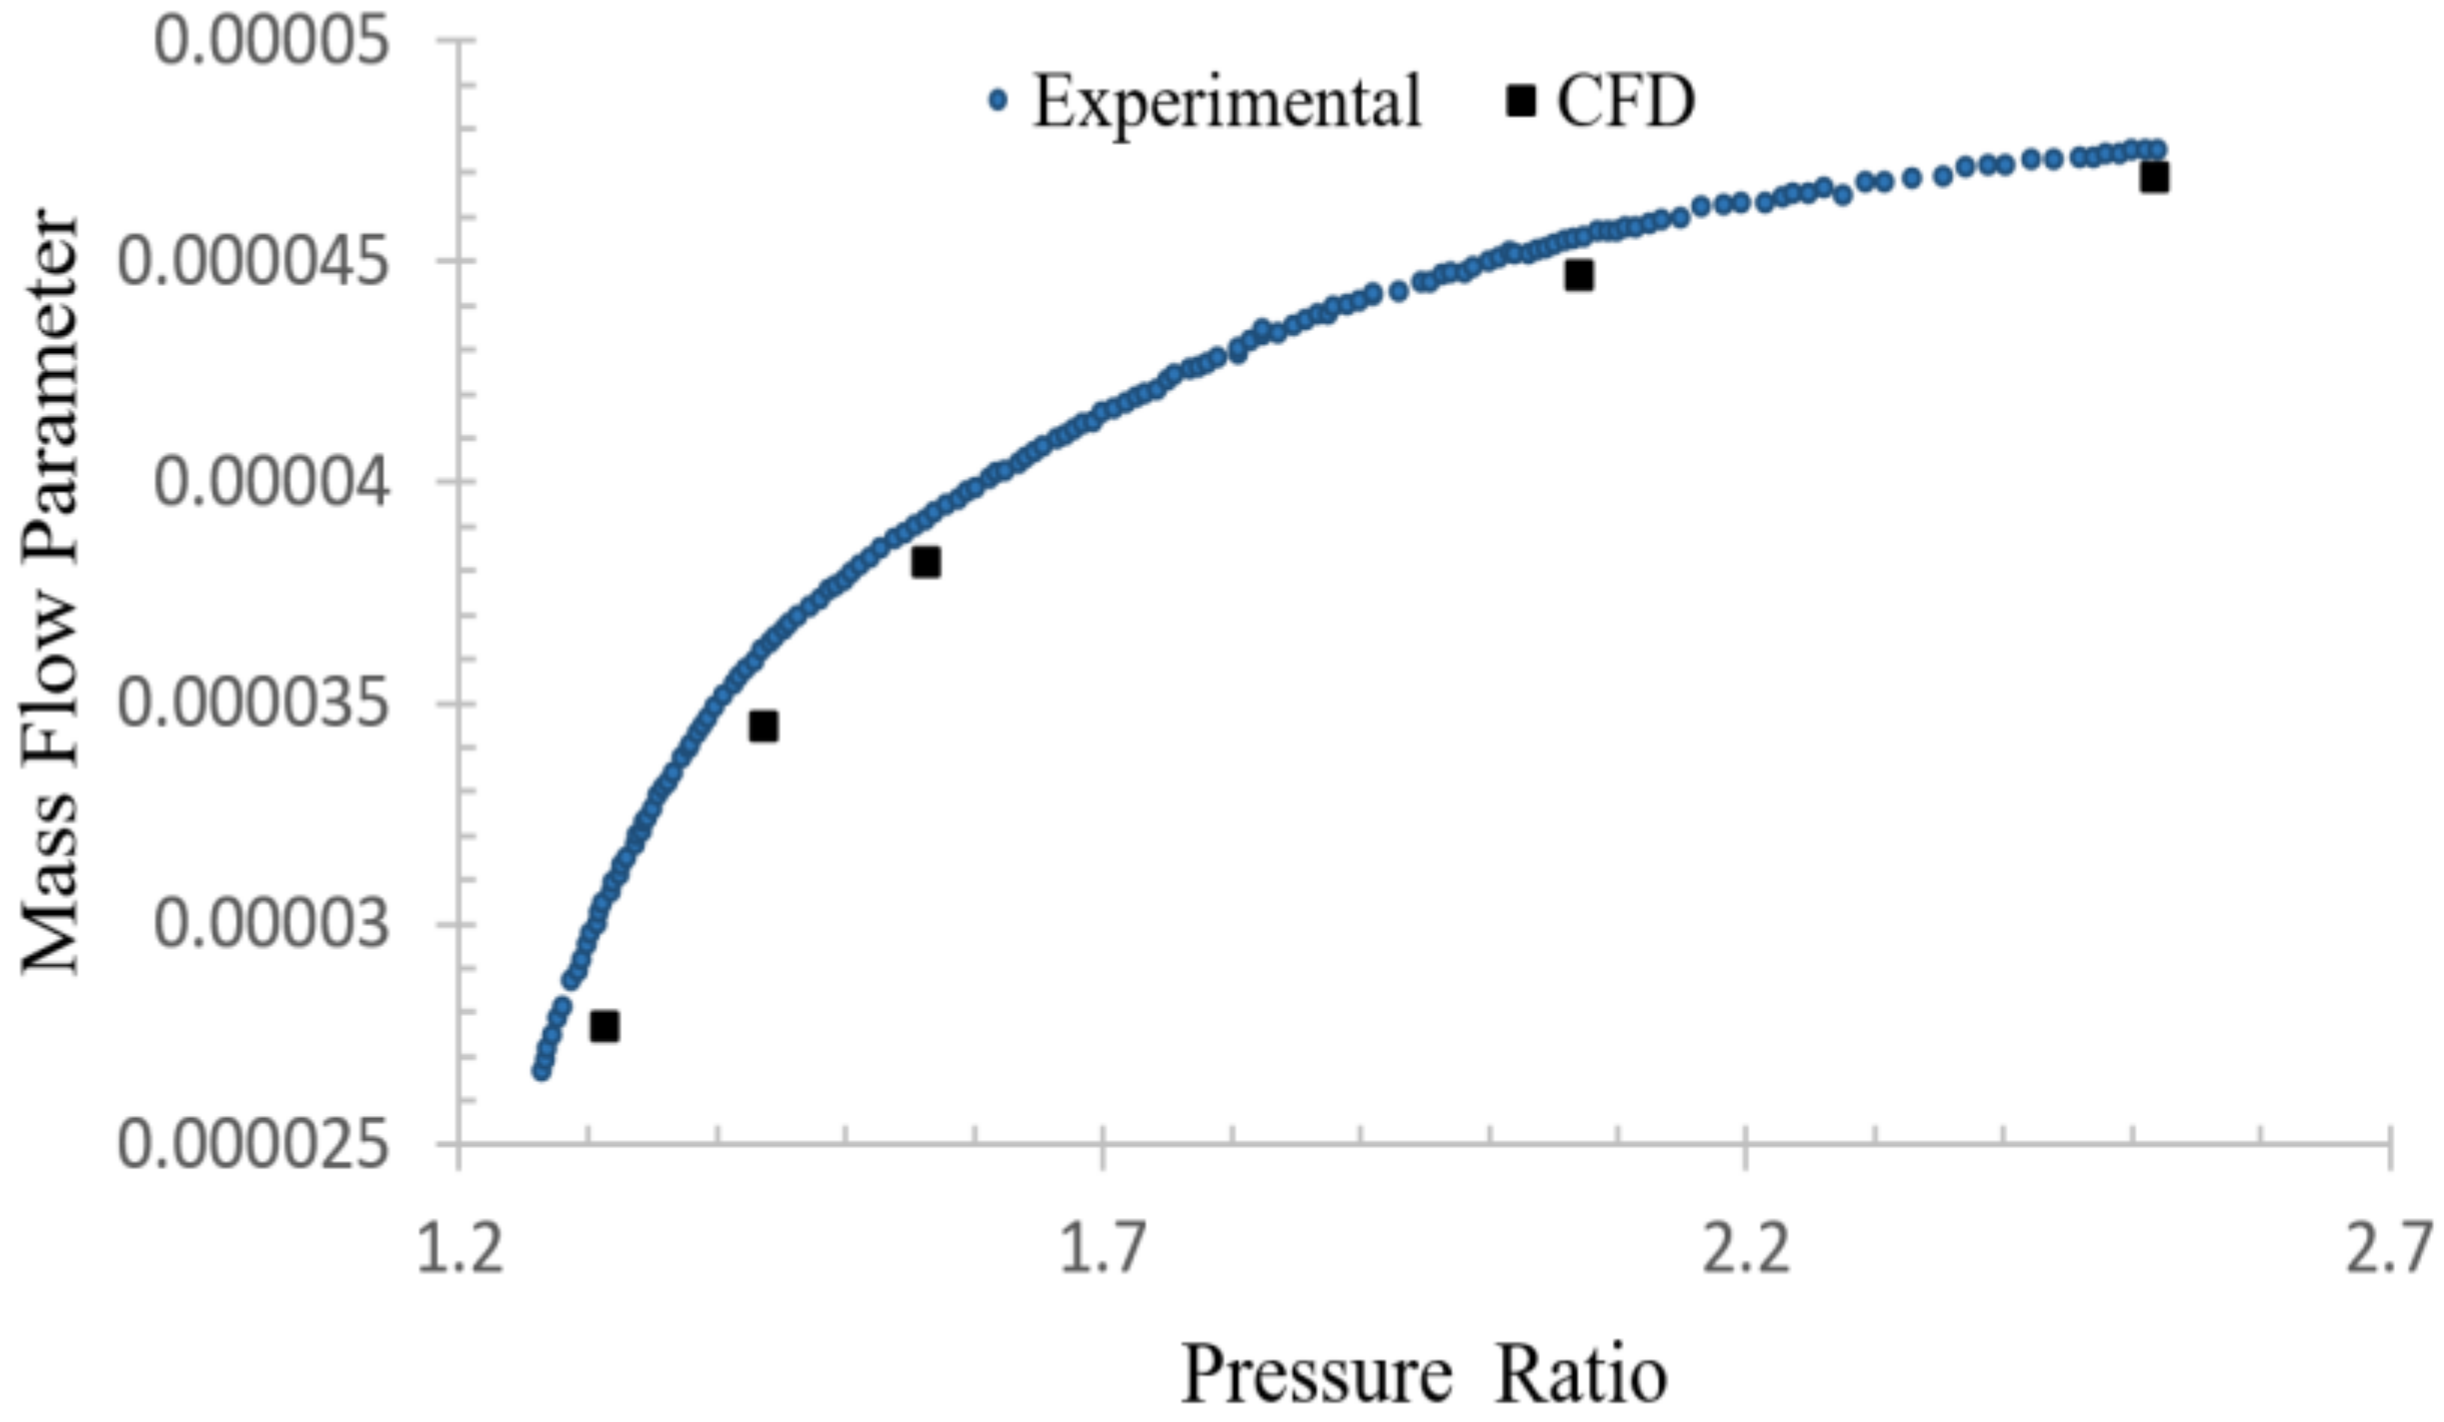
The results were validated by the experimental measurements of Copeland et al. (2010) [7] for both mass flow parameter and efficiency in a full admission case. Figure 2 presents the relative mass flow parameter versus the total-to-static pressure ratio in equal admission. The mass flow that is characteristic of the model coincides with the experimental data well. Less than an eight percent discrepancy can be seen at the lowest pressure ratio, while at a higher pressure ratio, this is one percent.
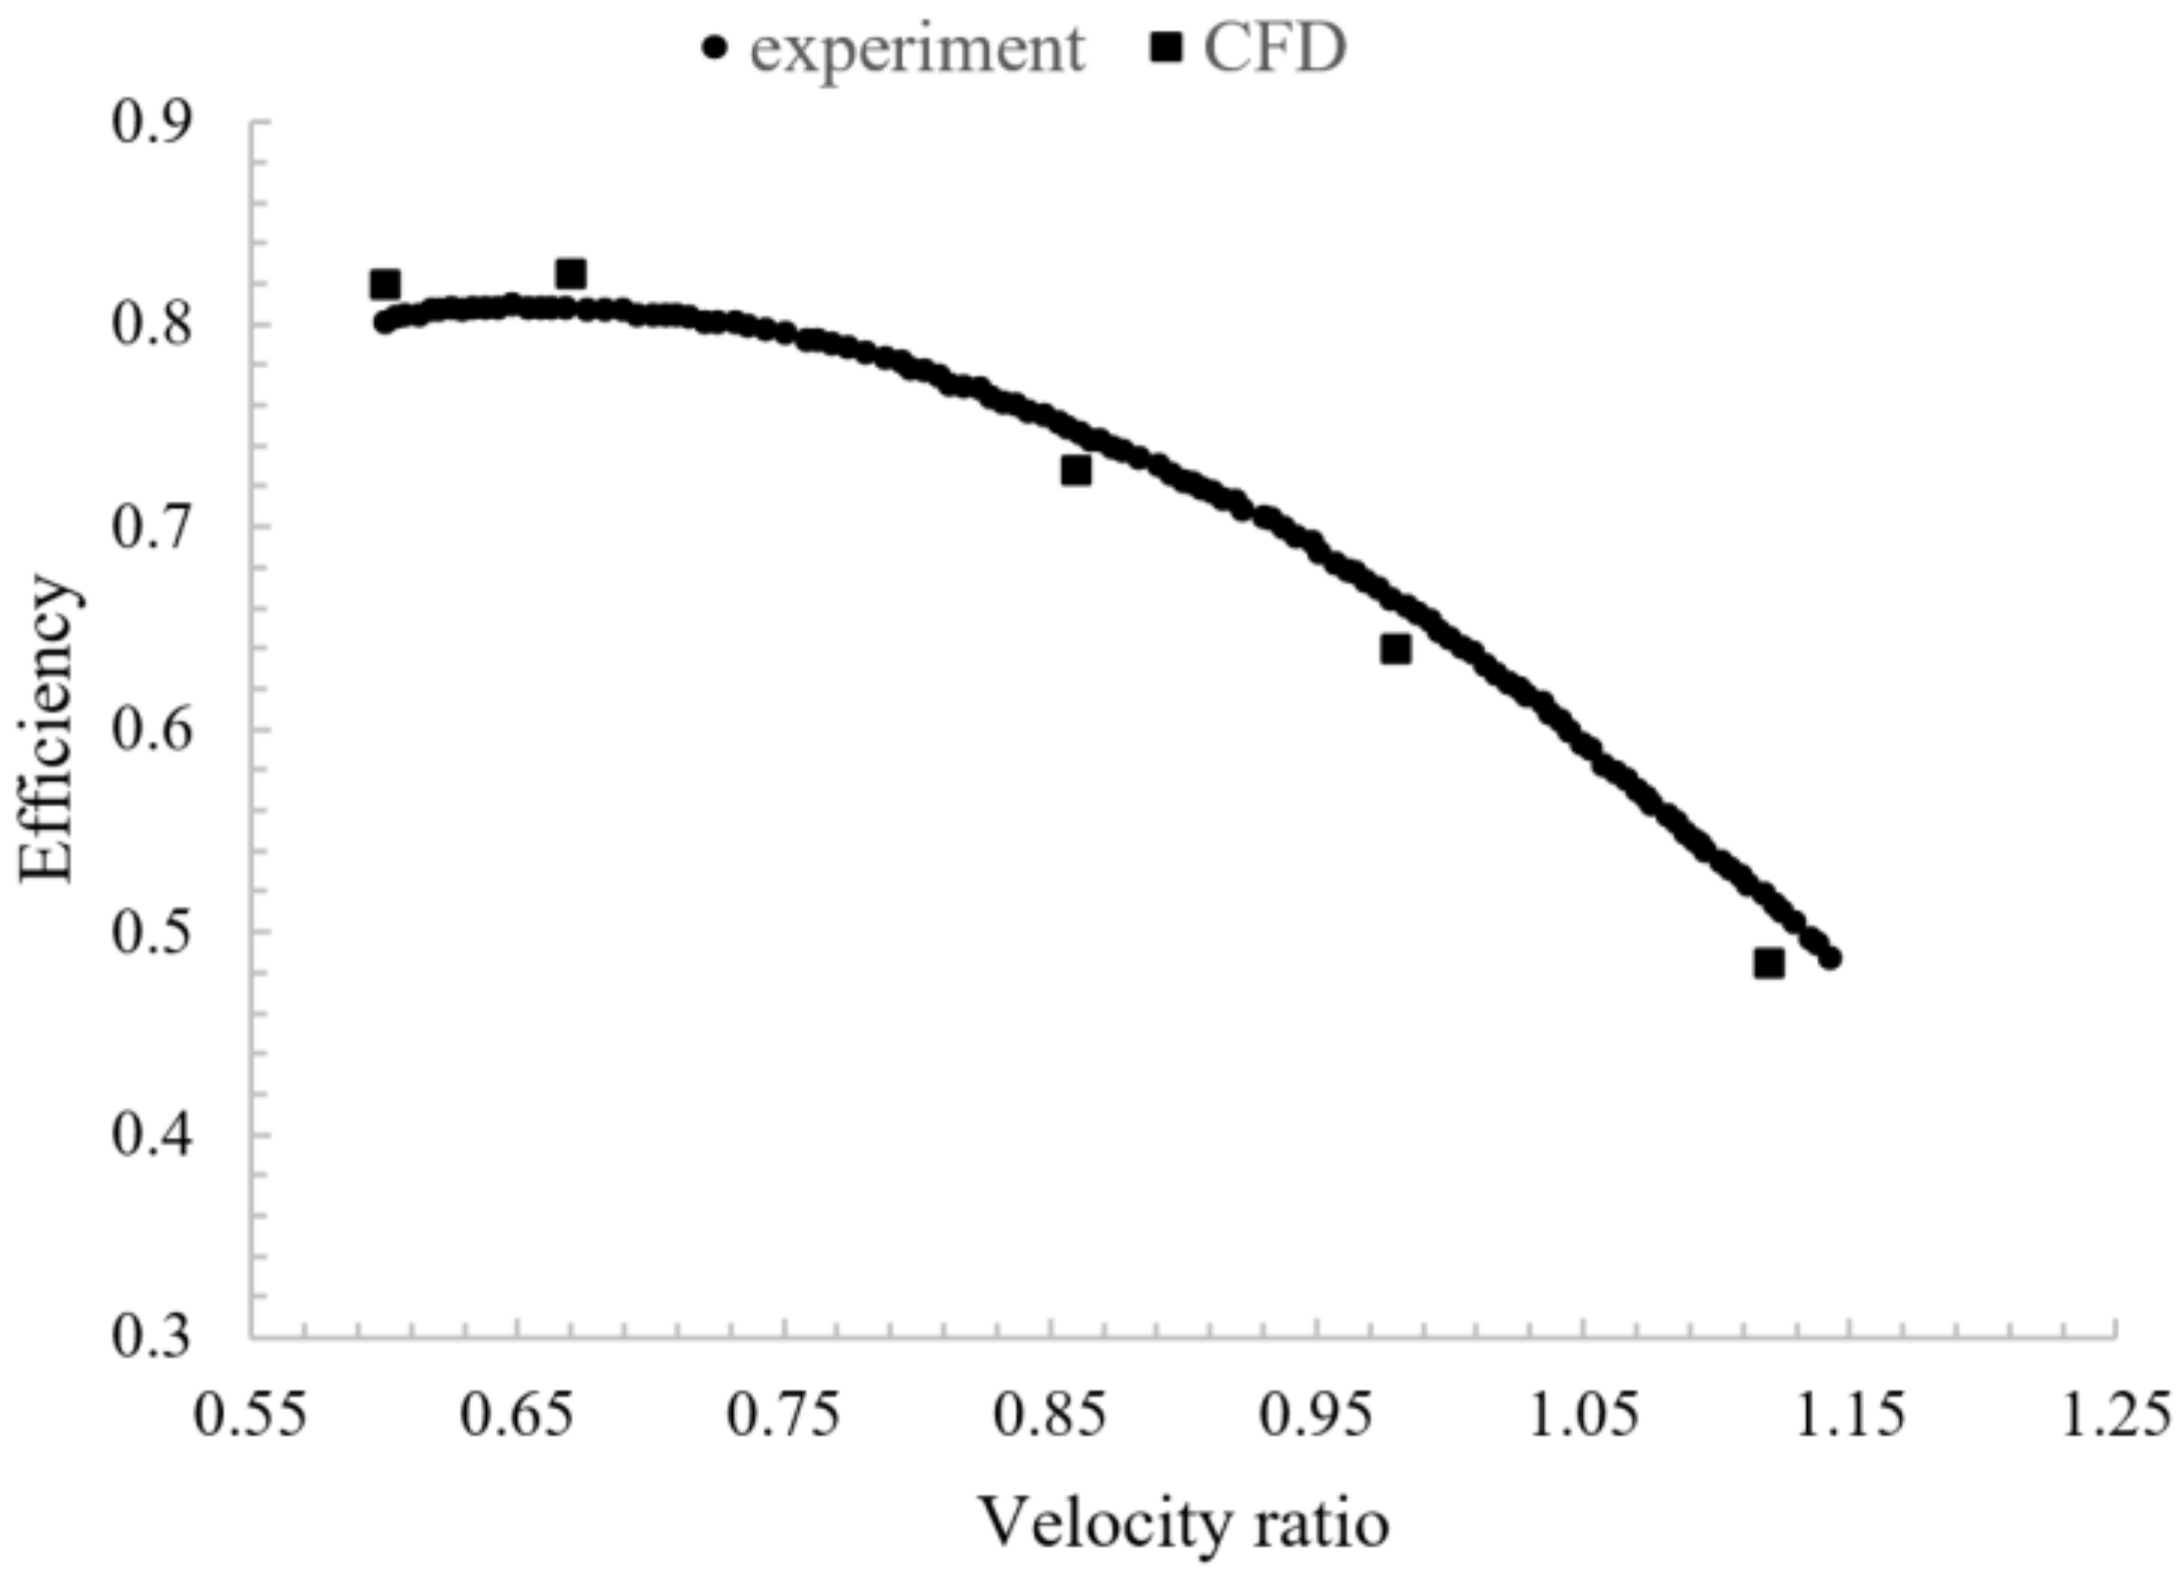
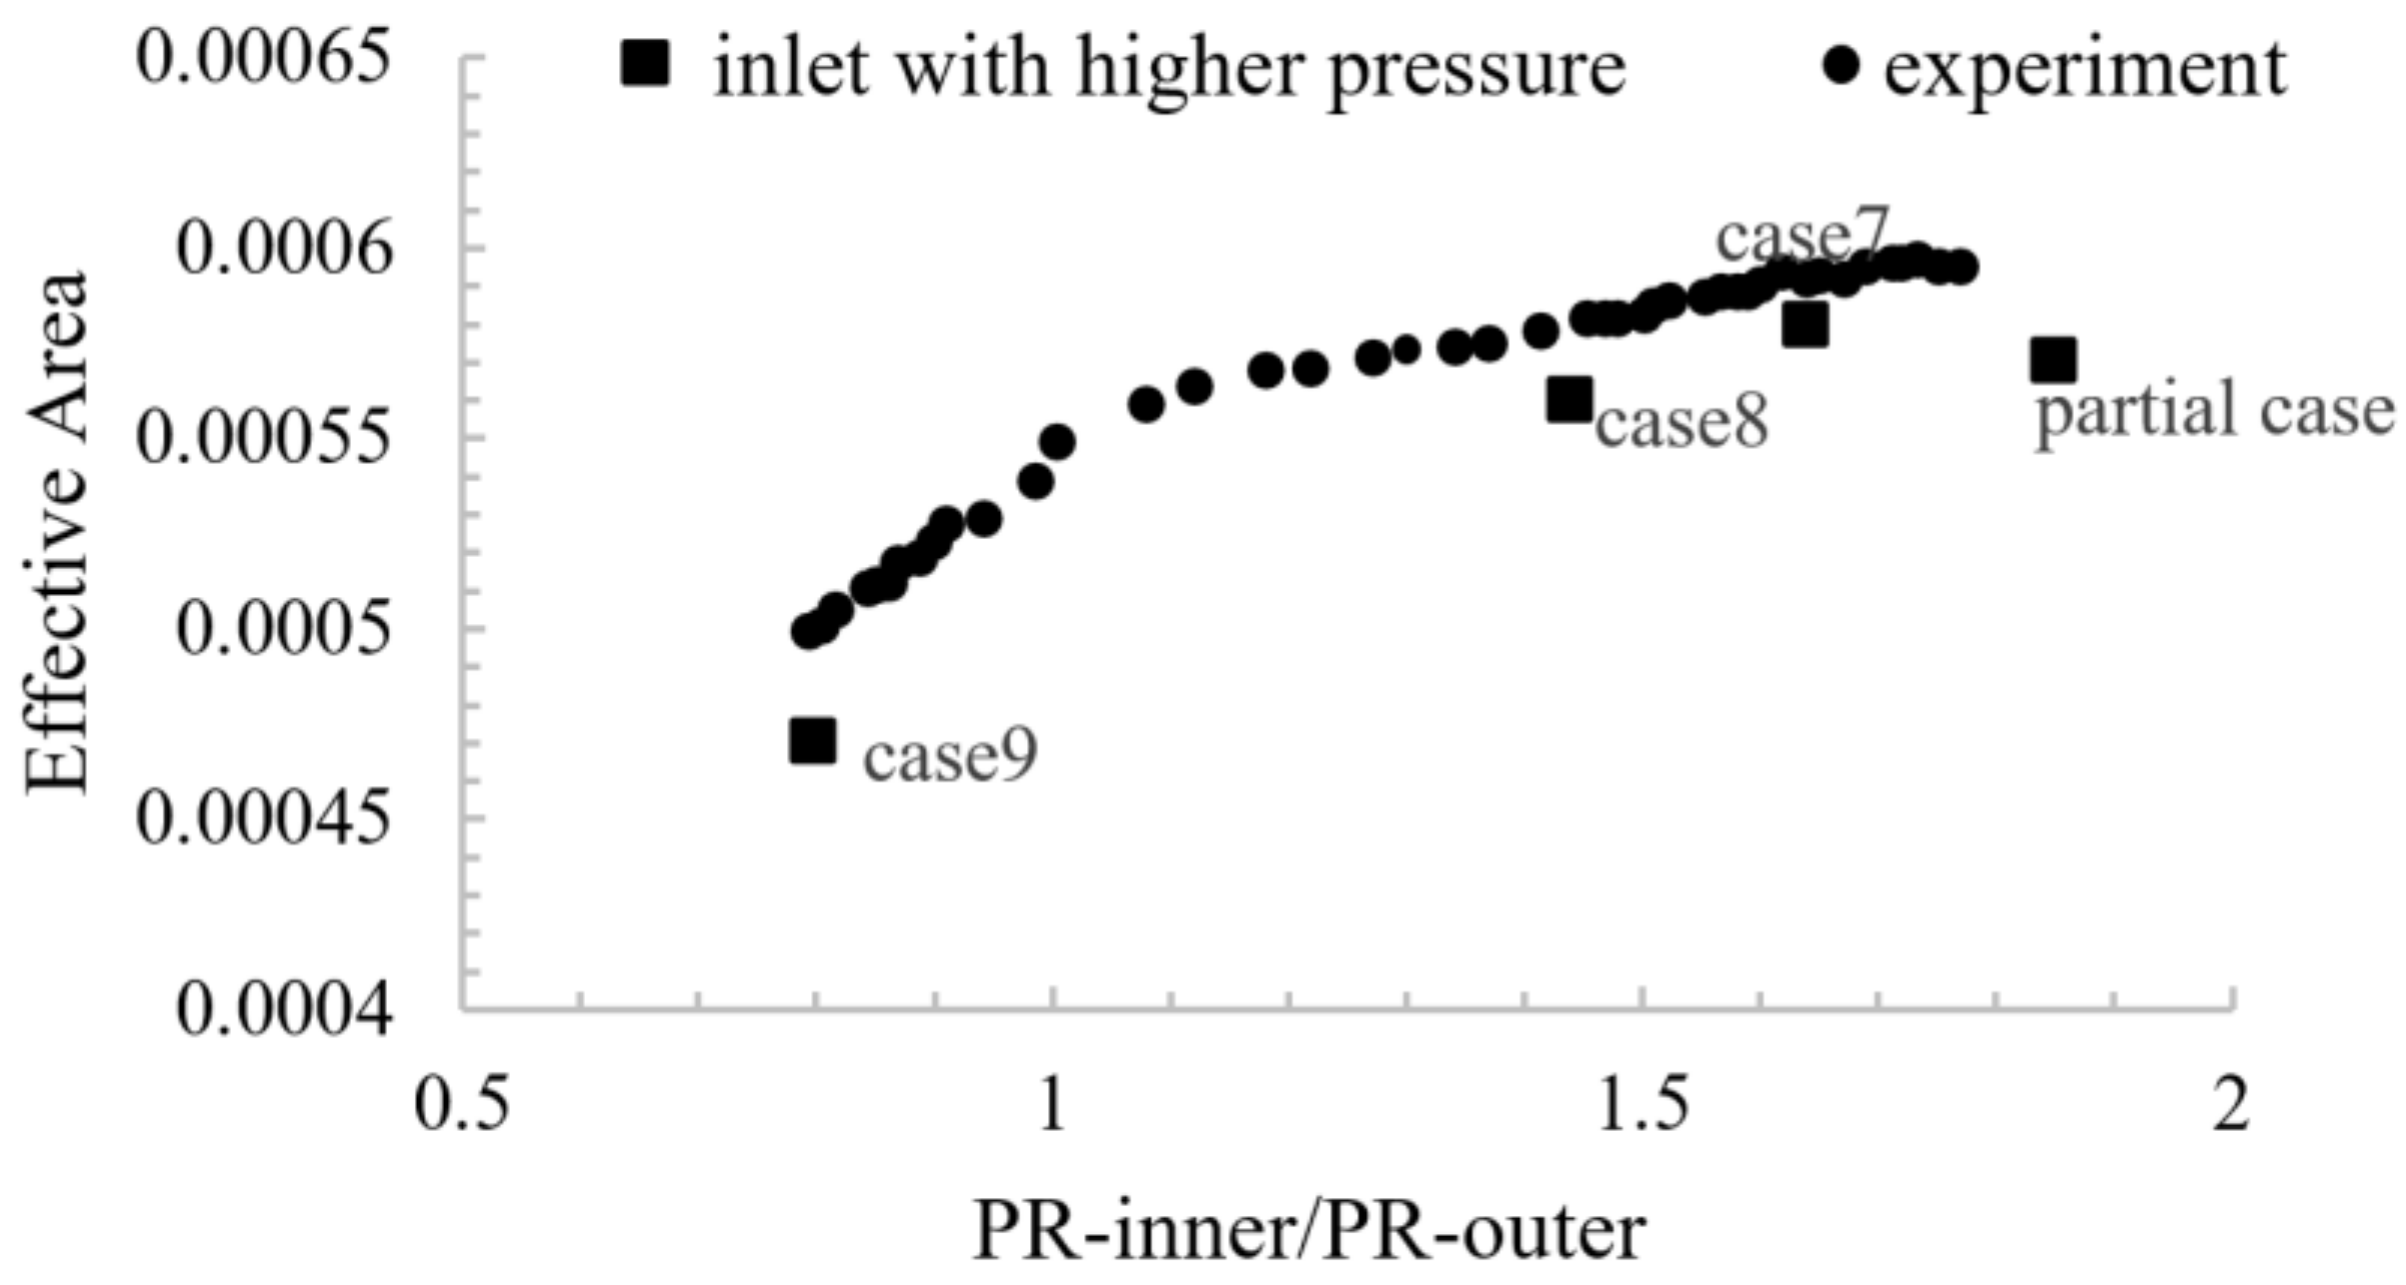
Figure 3 depicts the relative total-to-static efficiency against the velocity ratio in a full admission case. In the lower efficiencies, the enormous uncertainty in the experimental result, which can be as high as ±5%, leads to more discrepancy [7], although applying the k-ϵ turbulence modeling can be the other reason for this difference. For unequal admission validation, a parameter related to mass flow is required. In this study, the effective area that is a standard parameter in this field is used. The effective area stands from the idea of assuming each entry as a swapping area nozzle, and is defined with Equation (6) [4]. This parameter expresses the swallowing capacity of a turbine.
Figure 4 compares the calculated effective area of the lower entry with the measured data under various degrees of admission. In comparison with the equal admission results, the CFD simulation of unequal admission had more discrepancies with experimental results.
4. Method
In partial admission conditions, the efficiency is lower than the equal admission conditions. The entropy generation of the interspace region, S.s (suction-side) passage, and P.s (pressure-side) passage significantly increase in partial admission rather than equal admission [8]. The highest entropy generation of the interspace area occurs near the tongues region where the high-velocity fluid from the flowing entry mixes with the lower velocity fluid in the non-flowing region [8]. This mixing, which dissipates some useful work, can be eliminated by changing the geometry of two stator vanes in the tongue region, with the aim of isolating two sectors completely. Efficiency was studied in four unequal admission cases when isolating was applied, and without isolating.
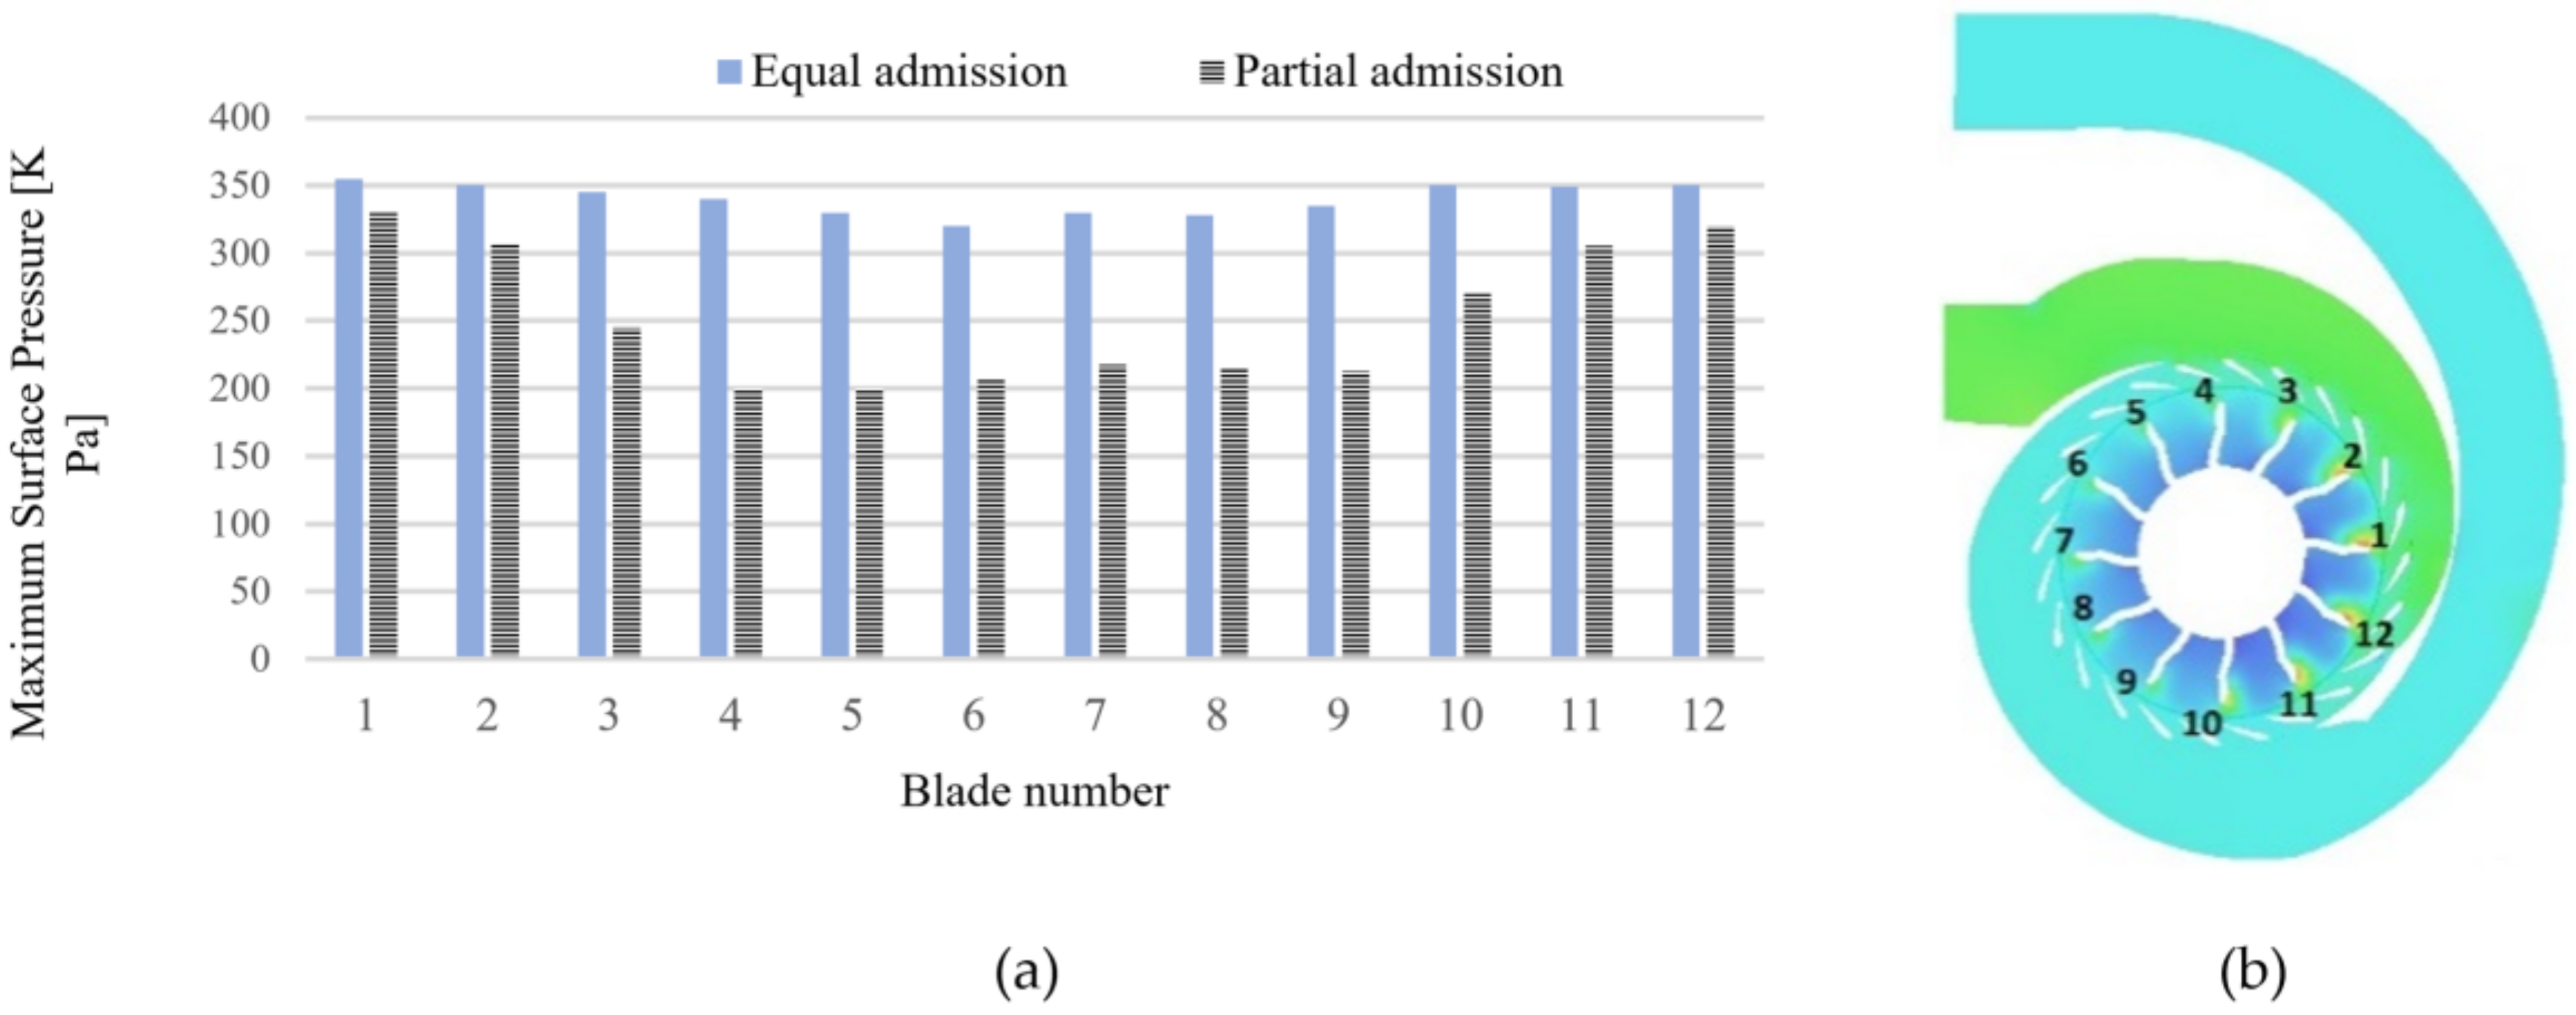
Figure 5 presents the blade numbers and their surface pressure in partial and equal admission.
As can be seen in Figure 5, even at equal admission, surface pressure on the rotor blades is not equal, which is because of non-uniform inlet pressure from volute. The difference in surface pressure level on the rotor blades in partial admission is more severe due to the unequal mass flow of volute entries. In some passages, the pressure of the pressure side is higher than the pressure of the suction side and reversely in some others; the pressure of the pressure side is lower than the pressure of the suction side. In both the equal and partial cases, there are some passages with equal surface pressure on both sides (passages 10–11 in the equal case, and passages 4–5 in partial admission).
The pressure difference magnitude of the passage sides can affect the flow behavior inside the rotor passages. To study the effect of this pressure gradient, two passages that have similar surface pressure but on the reverse side were selected in both cases. Passages 5–6 and 6–7 in equal admission, and passages 3–4 and 9–20 in partial admission were selected because of their equivalent inequality.
For convenience in investigating the effectiveness of this inequality, the surface pressure ratio (SPR) number is defined with Equation (7):
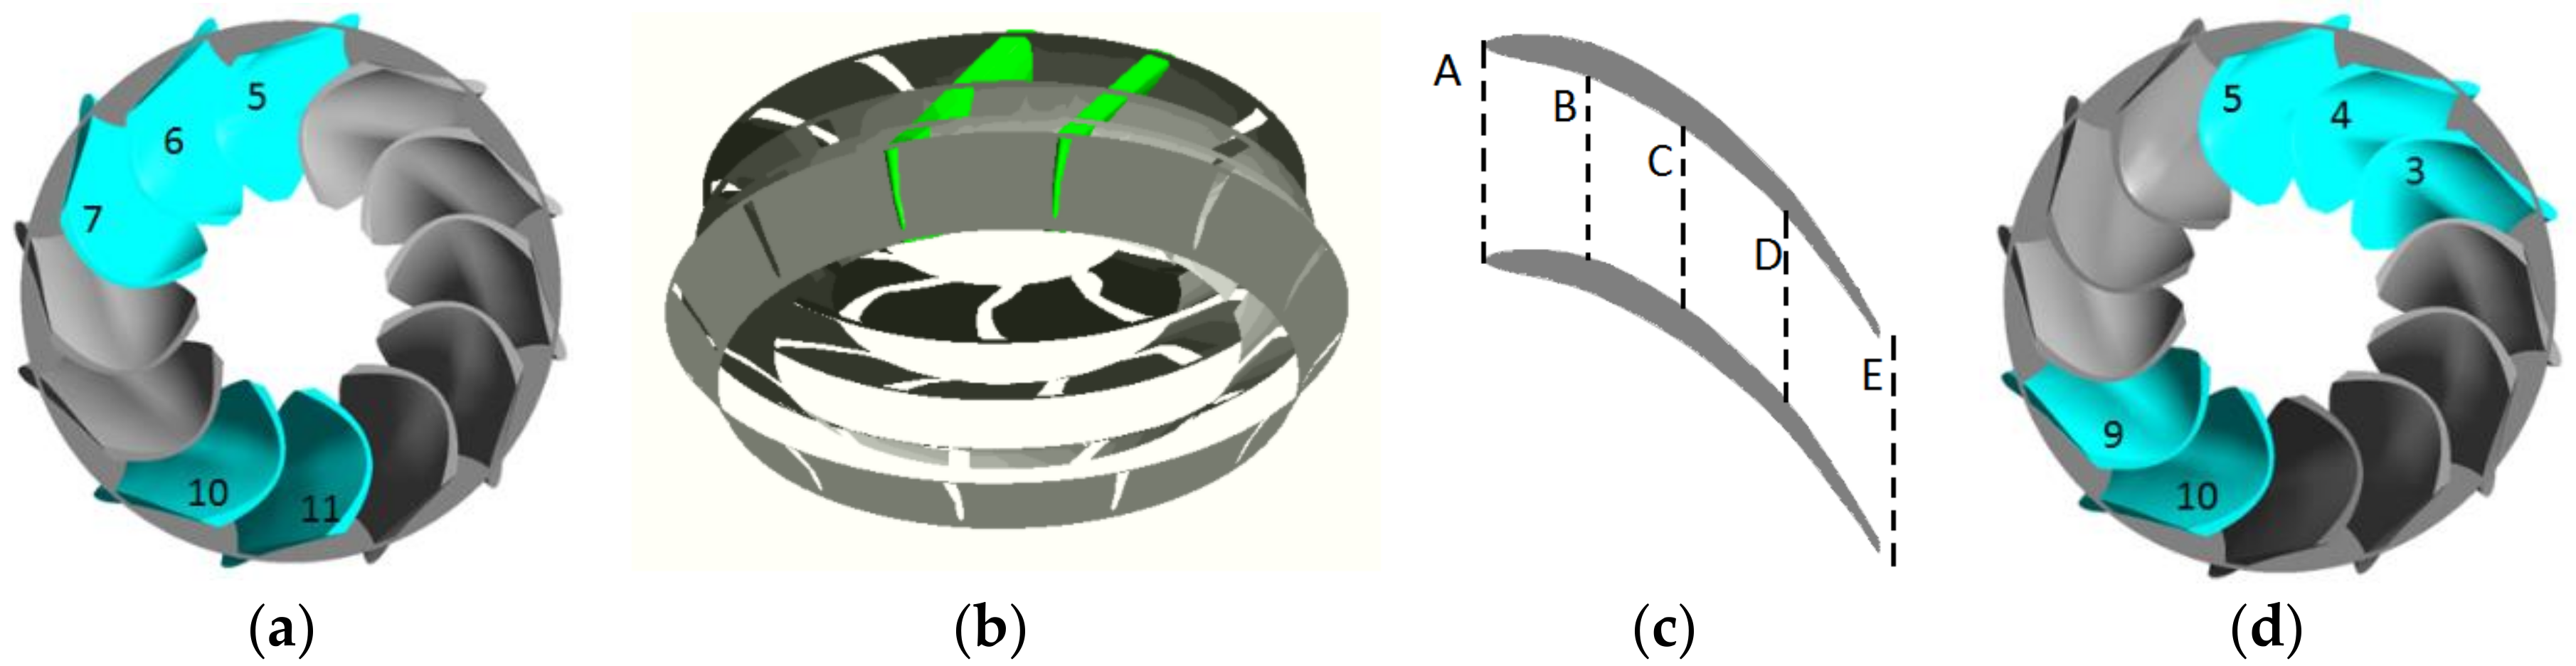
Passages with similar SPR in partial and equal admission are selected and demonstrated in Table 4 and Figure 6. Such a strategy for passage selection made it possible to study the effect of the pressure gradient and pressure level on the vortices’ behavior through the rotor passages.
The flow vorticity intensity is calculated and showed on contours of vorticity in five sections in streamwise locations. Three vortex cores in the passage were recognized; their intensity and the vortices’ center location was investigated. The chosen passages in both the cases and section locations and orientation are depicted in 3D and also a blade-to-blade two-dimensional (2D) view in Figure 6.
Then, the total pressure loss contours of the understudied rotor passages were depicted in the four sections in the span-wise direction. Also, the velocity components gradient was depicted in meridional sections for equal and partial admission.
5. Result and Discussion
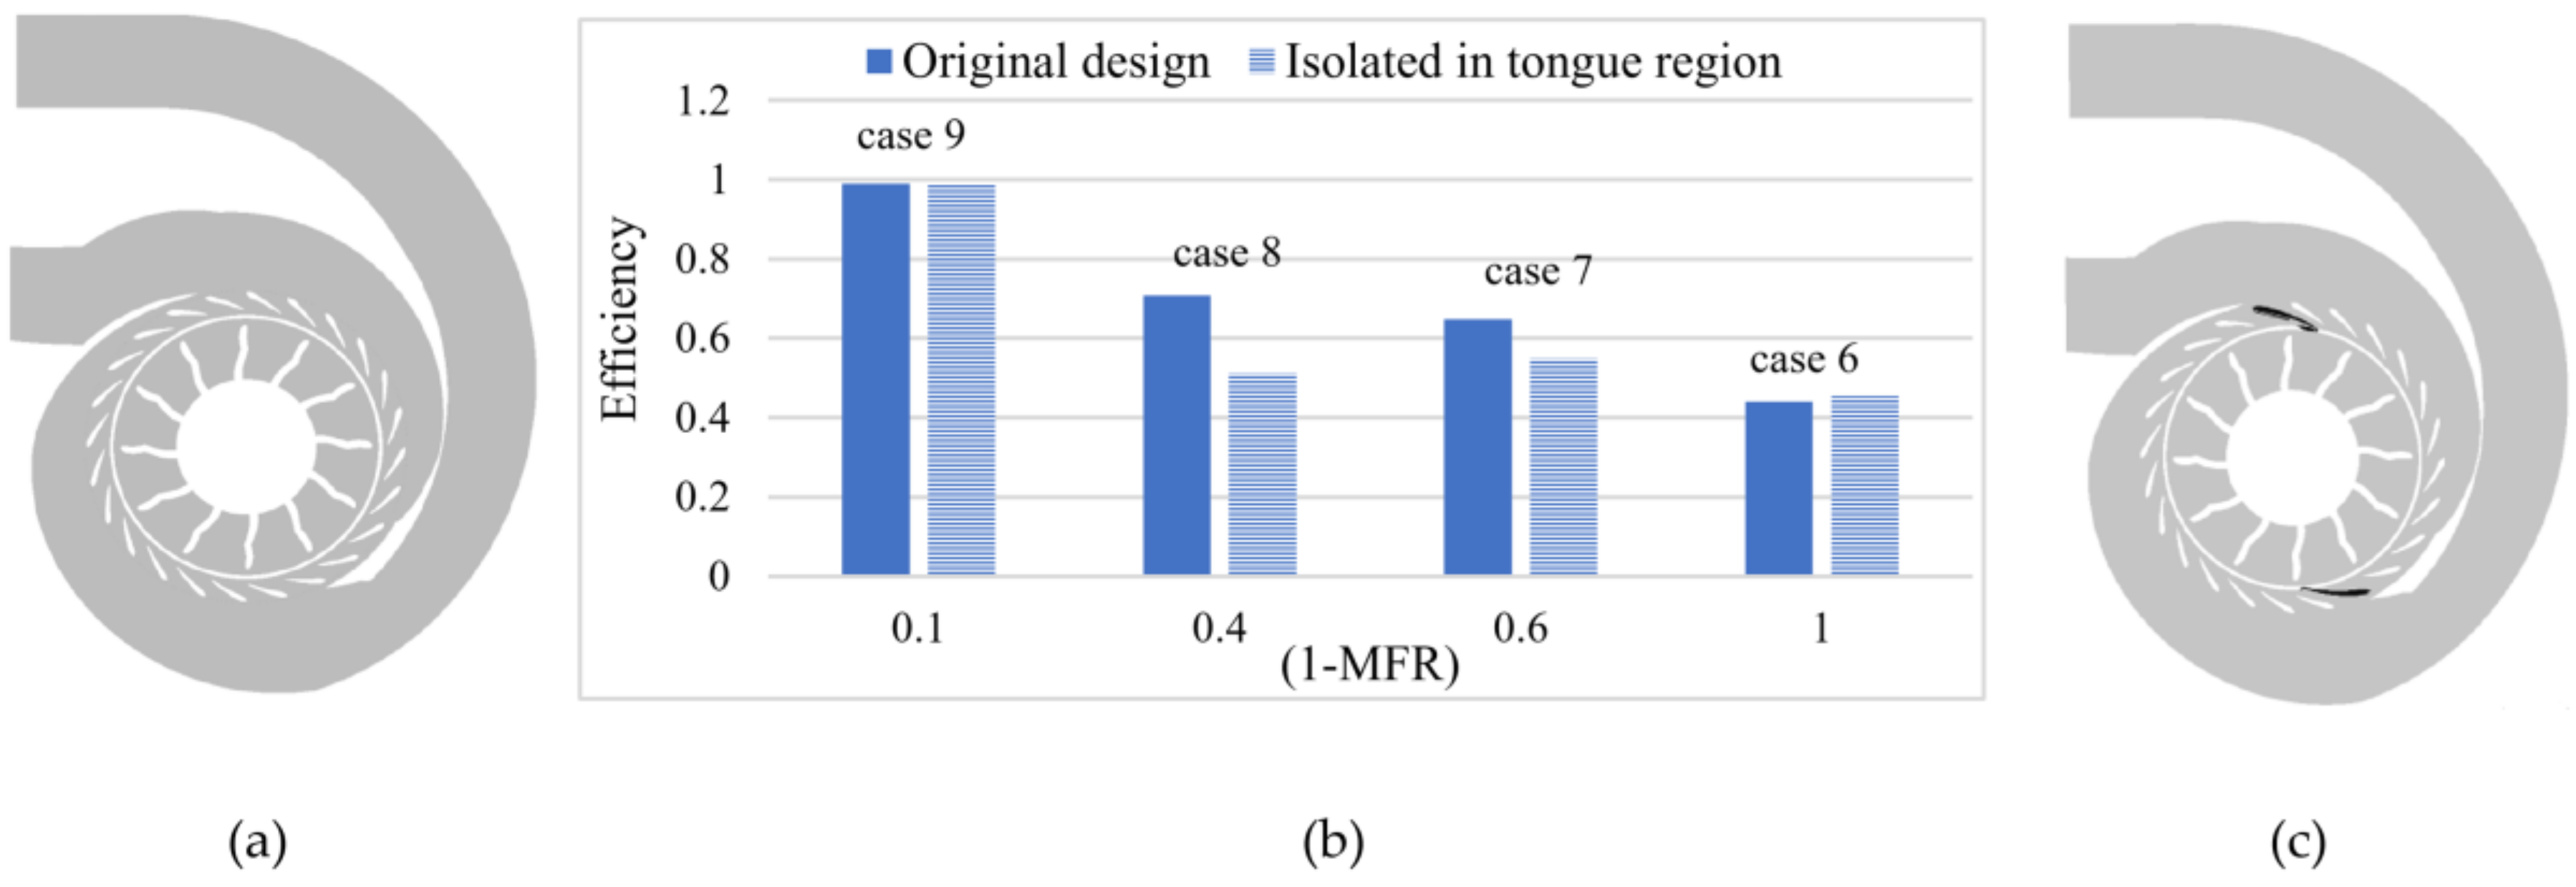
In partial admission situation, the double entry turbine works in windmill mode. The empty part of the rotor uses the useful power provided in the flowing part. The dissipated work generates entropy, and so causes a reduction in the turbine efficiency. Figure 7 illustrates the turbine efficiency in four unequal admission cases. Efficiency decreased with increasing the flow inequality of the two volute limbs. The turbine efficiency when the interspace region between the stator and rotor was isolated in two tongue regions was showed in four different (1-MFR) number which shows the degree of inequality of each case (Equation (5)).
The performance change in relation to the isolating in a different inequality of incoming flow from entries is shown in Table 5. The mean for category 1 (original) is approximately 0.697, and the mean for category 2 (isolated) is approximately 0.627, which is 0.9 times the power output without the isolating. So, isolating leads to an efficiency drop.
Isolating prevented the flow from the previous limb from rotating and entering with proper incidence. Also, the flow with high momentum flow was stroked to the isolator, which leads to it missing its energy. The section just upstream of the volute tongue has the lowest isentropic availability, and therefore operates at the highest efficiency [24]. Through isolating in this way, the effective area of the stator passage that is related to these two passages is decreased, which may lead to the blockage of these two stator passages. All of these effects enhance the interspace and stator losses. When the high-velocity fluid mixes with the lower velocity fluid, high entropy is generated in the interspace region. If isolating is applied, it helps to decrease the waste of energy in this mixing loss. A higher MFR leads to a higher efficiency gain. Cases 6, 7, and 8, respectively, have higher MFR, so the efficiency gain is decreased from cases 6 to 8. Interspace losses in the non-flowing sector contribute a significant portion to the overall losses in the turbine, but in the full admission case, the entropy generation in the Interspace regions is minimal throughout the whole operating range of the turbine [25]. So, in the case 9 which is almost an equal admission (MFR = 0.9) isolating in tongue region has no significant impact. In this case, all the passages are full of high and equal momentum flow and efficiency is not affected by isolating.
5.1. Vorticity Contours
Pressure gradient in the span-wise direction leads to originating the horseshoe vortex. The horseshoe vortex is divided into two branches at the blade leading edge, one of these branches moves near the S.s, and the other one moves near the P.s. The major secondary flow that grows in the passages originates from these legs [1].
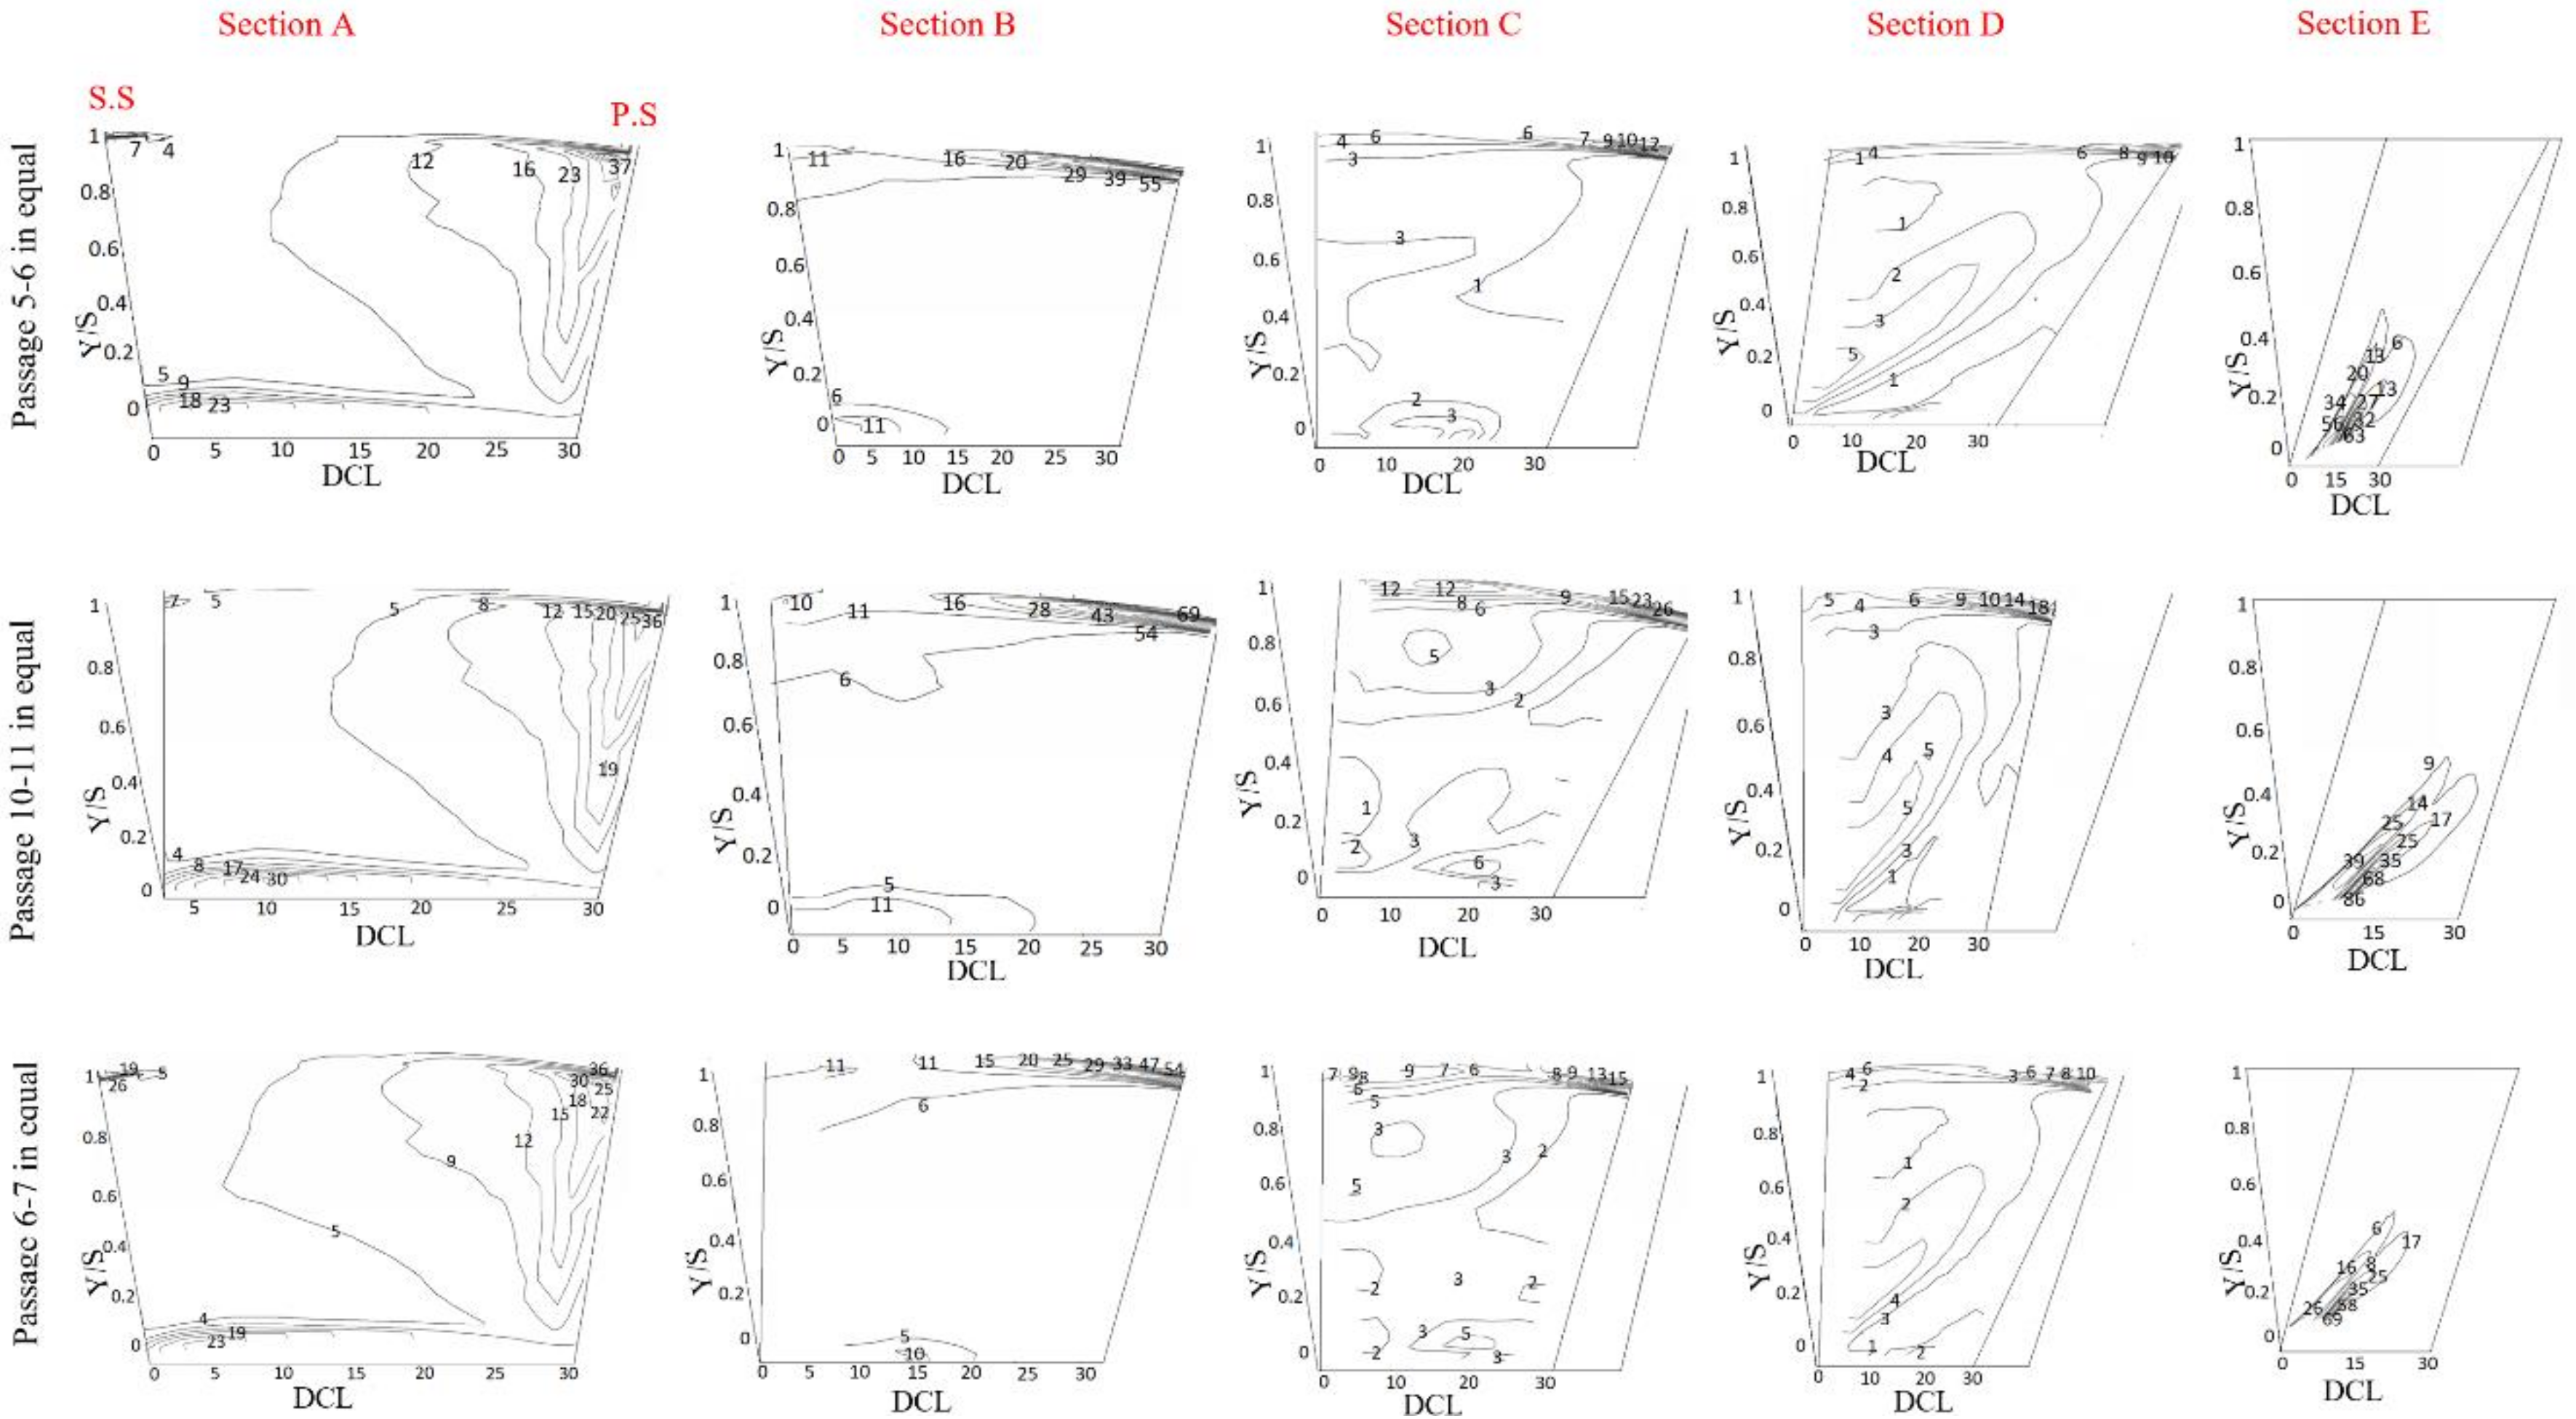
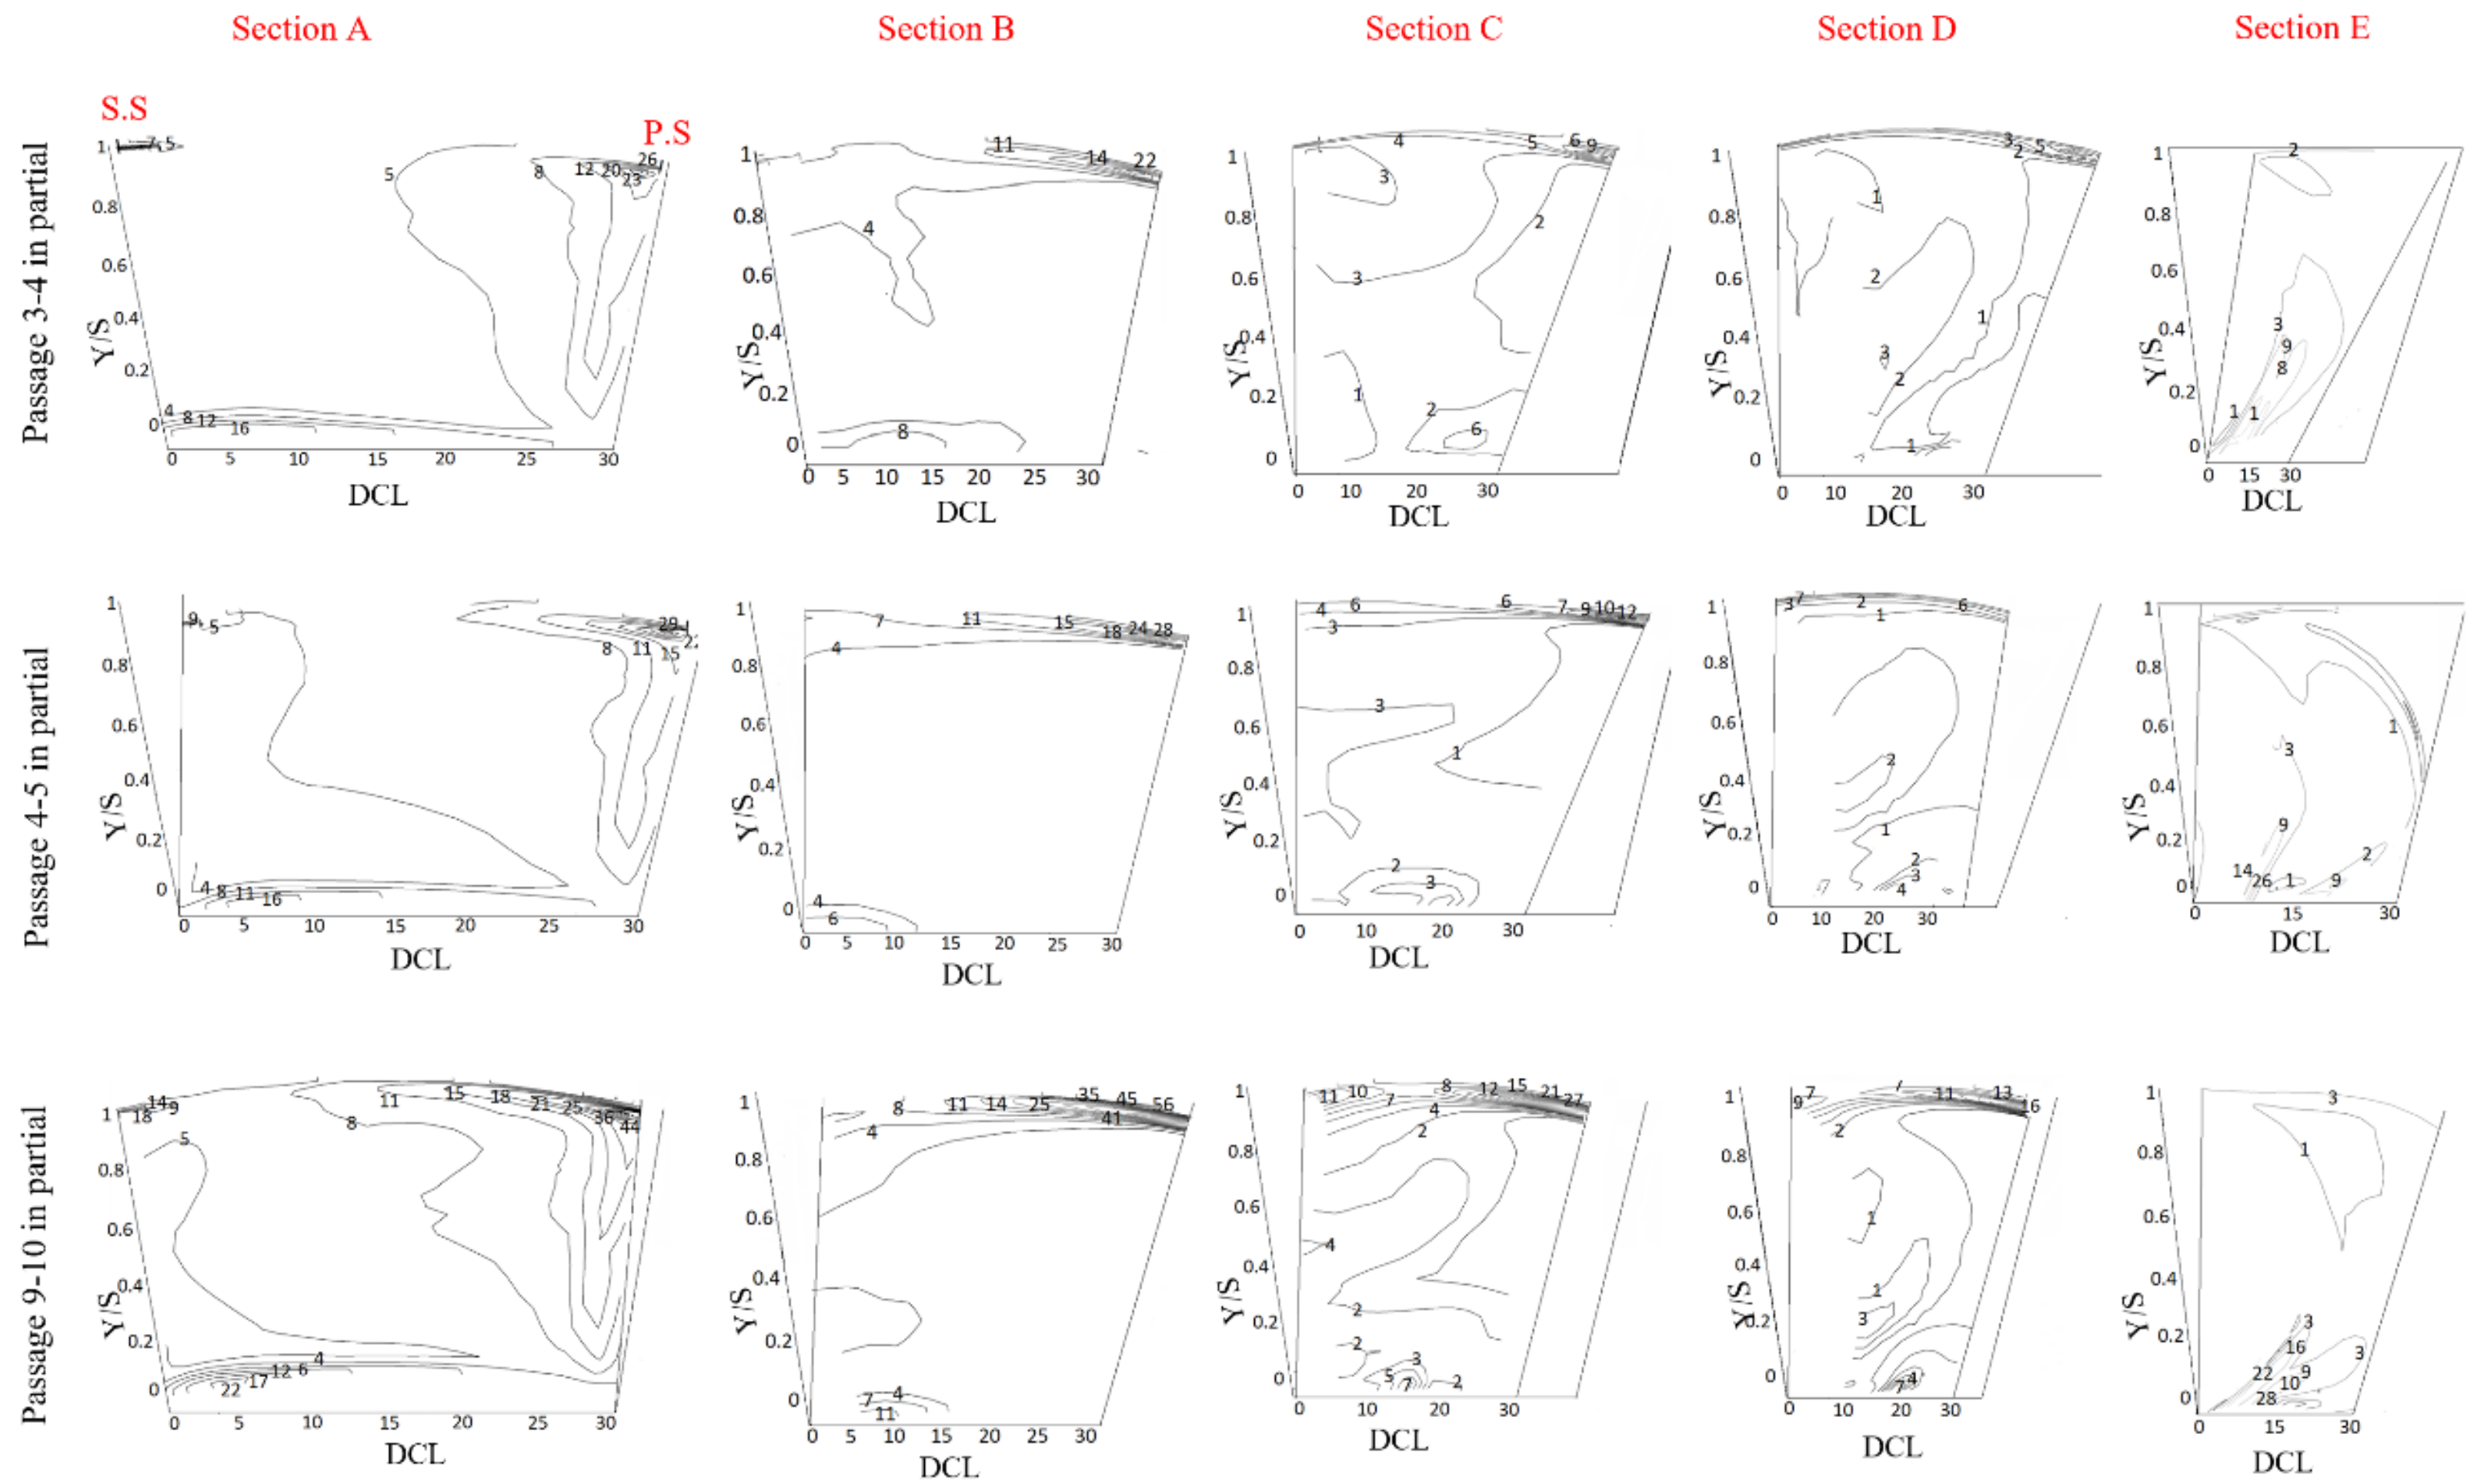
Figure 8 and Figure 9 show the vorticity contours on stream-wise sections in three passages in equal admission and partial admission cases. The contours demonstrate three major vortex flows. One of them locates near the hub endwall region (leading edge root vortex-LR vortex), the other one is in the tip region near the P.s (Tip vortex) with a central location near the section b, and the last one is in the middle of the passage with central location after the trailing edge (Tr. V).
5.1.1. Tip Vortex Variation
A higher pressure inequality of the passage’s sides (SPR-1) leads to more widespread tip vortex; also, pressure-side pressure is more effective on the extension of the tip vortex (Figure 8, Section A). Although the pressure level in passages 10–11 is higher than in passages 6–7, its tip vortex size is smaller than in passages 6–7, because of the lower pressure difference (Figure 8, Section A). The source of the tip vortex is the pressure gradient, so the SPR numbers that are closer to 1 lead to the smaller vortex width. For the same reason, although passages 9–10 with an SPR of 0.88 have a lower pressure level in the entrance, they resulted in the bigger tip vortex in comparison with passages 4–5 with SPR of 1 (Figure 9, Section A). In the same way, in passages 5–6 (Figure 8, Section A), with SPR = 1.02, a more extended tip vortex than passages 10–11 with an SPR of 1 can be seen. The pressure-side pressure level has more impact on the extension of this vortex than suction-side pressure, so in passages with higher pressure at P.s, a wider tip vortex is expected. So, in passages 5–6, a more widespread tip vortex can be seen than in passages 6–7.
In the case of intensity, passages 10–11 have the most powerful vortex because of the higher pressure level on both sides (Figure 8, Section B). The tip vortex takes place near the pressure side, so the higher pressure of the P.s leads to the stronger tip vortex core (Figure 8, Section B). Therefore, in passages 5–6, the tip vortex has a higher intensity than in passages 6–7. The tip vortex center is located close to Section B. In equal admission, when the SPR changed 2% from unity, the vorticity width extended 16% more. Furthermore, an 8% drop in the pressure level caused that maximum of vorticity intensity at the tip vortex center to decrease by 10%.
In the partial case (Figure 9, Section A), the P.s pressure of passages 3–4 is more than the P.s pressure of passages 4–5, so, its tip vorticity is more widespread than that in passages 4–5, but in comparison with passages 9–10, it has a smaller vortex because of the lower inequality. Passage 9–10 has a very strong tip vortex, which is because of being in the vicinity of the tongue region, where the mixing loss is dominant.
The center of the tip vortex in passages 3–4 and 4–5 is located in Section A, but in passages 9–10, it is placed at Section B, which showed a decreasing pressure level that caused it to shift the center of the tip vortex to the previous sections.
5.1.2. Leading-Edge Root Vortex Variation
The interaction between the stagnation point of the blade and the incoming flow forms the leading-edge root vortex (LR vortex). Comparing vorticity contours in passages 6–7 and 5–6 (Figure 8, Section A) with a higher SPR and equal pressure level with passages 10–11 show that the SPR does not have any impact on the LR vortex, and only the pressure level affects the strength of this vorticity and the location of its center. Increasing the pressure level caused that LR vortex center to move further to the right-hand side (closer to the P.s (Figure 8, Section A)). The pressure magnitude significantly affected the strength of the LR vortex, so in passages 10–11, which had a higher pressure level, a stronger LR vortex can be found (Figure 8, Section A). In equal admission, when the SPR changed 2% from unity, the vorticity width did not change; also, with an 8% drop in the pressure level, the maximum of the vorticity intensity at the LR vortex core decreased by 23%.
In the partial case, by comparing passages 9–10 and 3–4, it is clear that the SPR did not affect LR vortex the same as the equal admission (Figure 9, Section A). Again, similarly with equal admission, displacement of the LR vortex center to the right-hand side is apparent in Figure 9 with the increasing surface pressure level in the partial case. Although the pressure level of passages 4–5 (Figure 9, Section A) with the SPR number of 1, is the lowest among all, it has an equal pressure on its P.s with passages 3–4, so their LR vortex is similar.
5.1.3. Trailing-Edge Vortex Variation
After the trailing edge zone at Section E, a strong vortex forms because of the transportation of low energetic material, which is located symmetrically in the lower half-span of the blades (Figure 8, Section E). This vortex has two heads; the right-hand head is stronger than the left-hand one. The vorticity of the left-hand side was affected more by the P.s pressure, and the right one was affected more by the S.s. With the increasing pressure level from passages 6–7 and 5–6 to 10–11 (Figure 8, Section E), the vorticity magnitude grows. In equal admission, when pressure level increased by 8%, the maximum of the vorticity intensity at the center of the right head of the trailing-edge vortex (Tr. vortex), which is closer to the P.s, rises about 19%, but the left-hand side of this vortex, which is closer to the S.s, grows 12%. Therefore, it can be concluded that the Tr. vortex is more affected by the P.s pressure level than the S.s pressure.
Investigating the passages in the partial case shows that, by sufficiently decreasing the pressure, the left-hand side of the Tr. vortex almost disappeared, but the right-hand side is affected less (Figure 9, Section E).
5.2. Pressure Loss
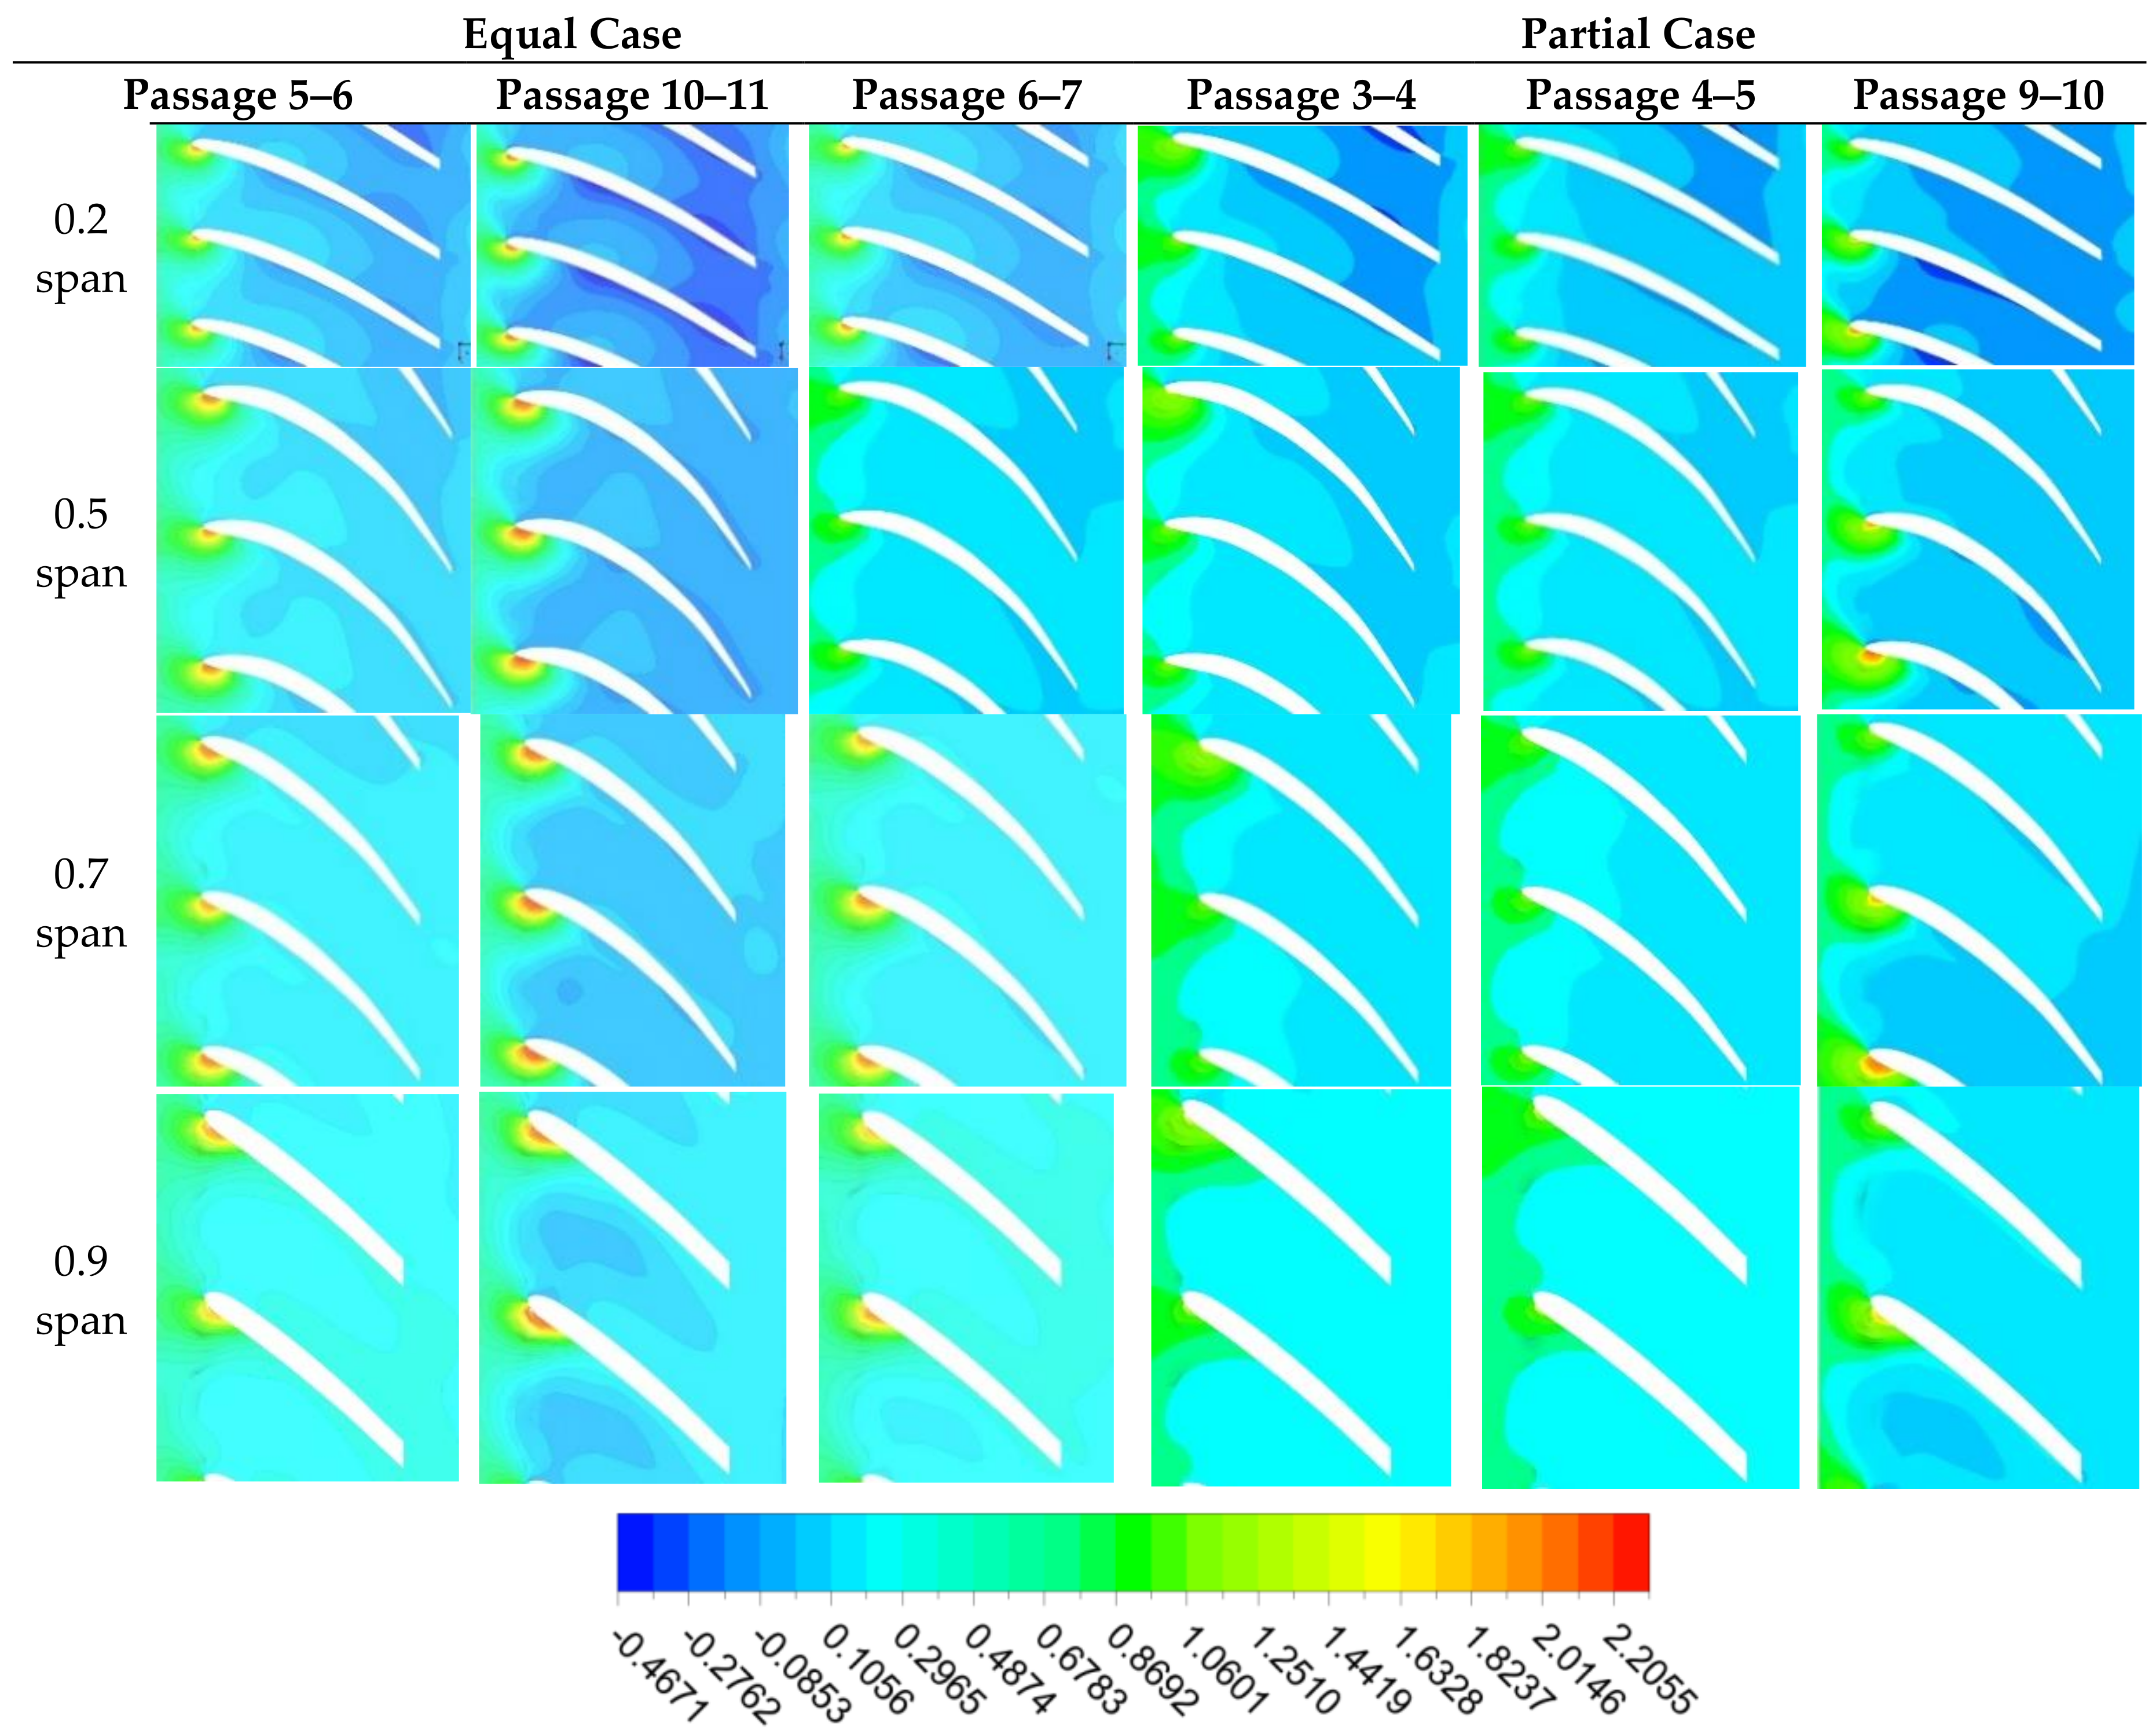
Vortices are one of the most important sources of pressure loss. The regions with the value of total pressure loss coefficients higher than 0.30 can be considered to be the secondary vortex flow region [1]. The total pressure loss is defined by the difference between the local total pressure and the reference total pressure at the passage inlet [1].
Total pressure loss coefficient ( is obtained by Equation (8) [26]:
Figure 10 shows the total pressure loss coefficient contours of the understudied passages in different spans. From Figure 10, it is clear that the tip vortex (next to the P.s) is the most severe vortex with the highest total pressure loss coefficient value. The total pressure losses in the tip vortex core region are more than 10 times the total pressure losses in the free stream region with a total pressure loss coefficient of less than 0.2. The LR vortex near the S.s is compressed under the 0.2 span height, while the trailing edge (Tr.) vortex is located under the mid-height of the passage. The LR vortex adjacent to the suction side disappears while moving in the spanwise direction. The total pressure loss coefficient variation and the difference between the hub and shroud on the suction side are higher than the pressure side.
5.3. Velocity Gradient
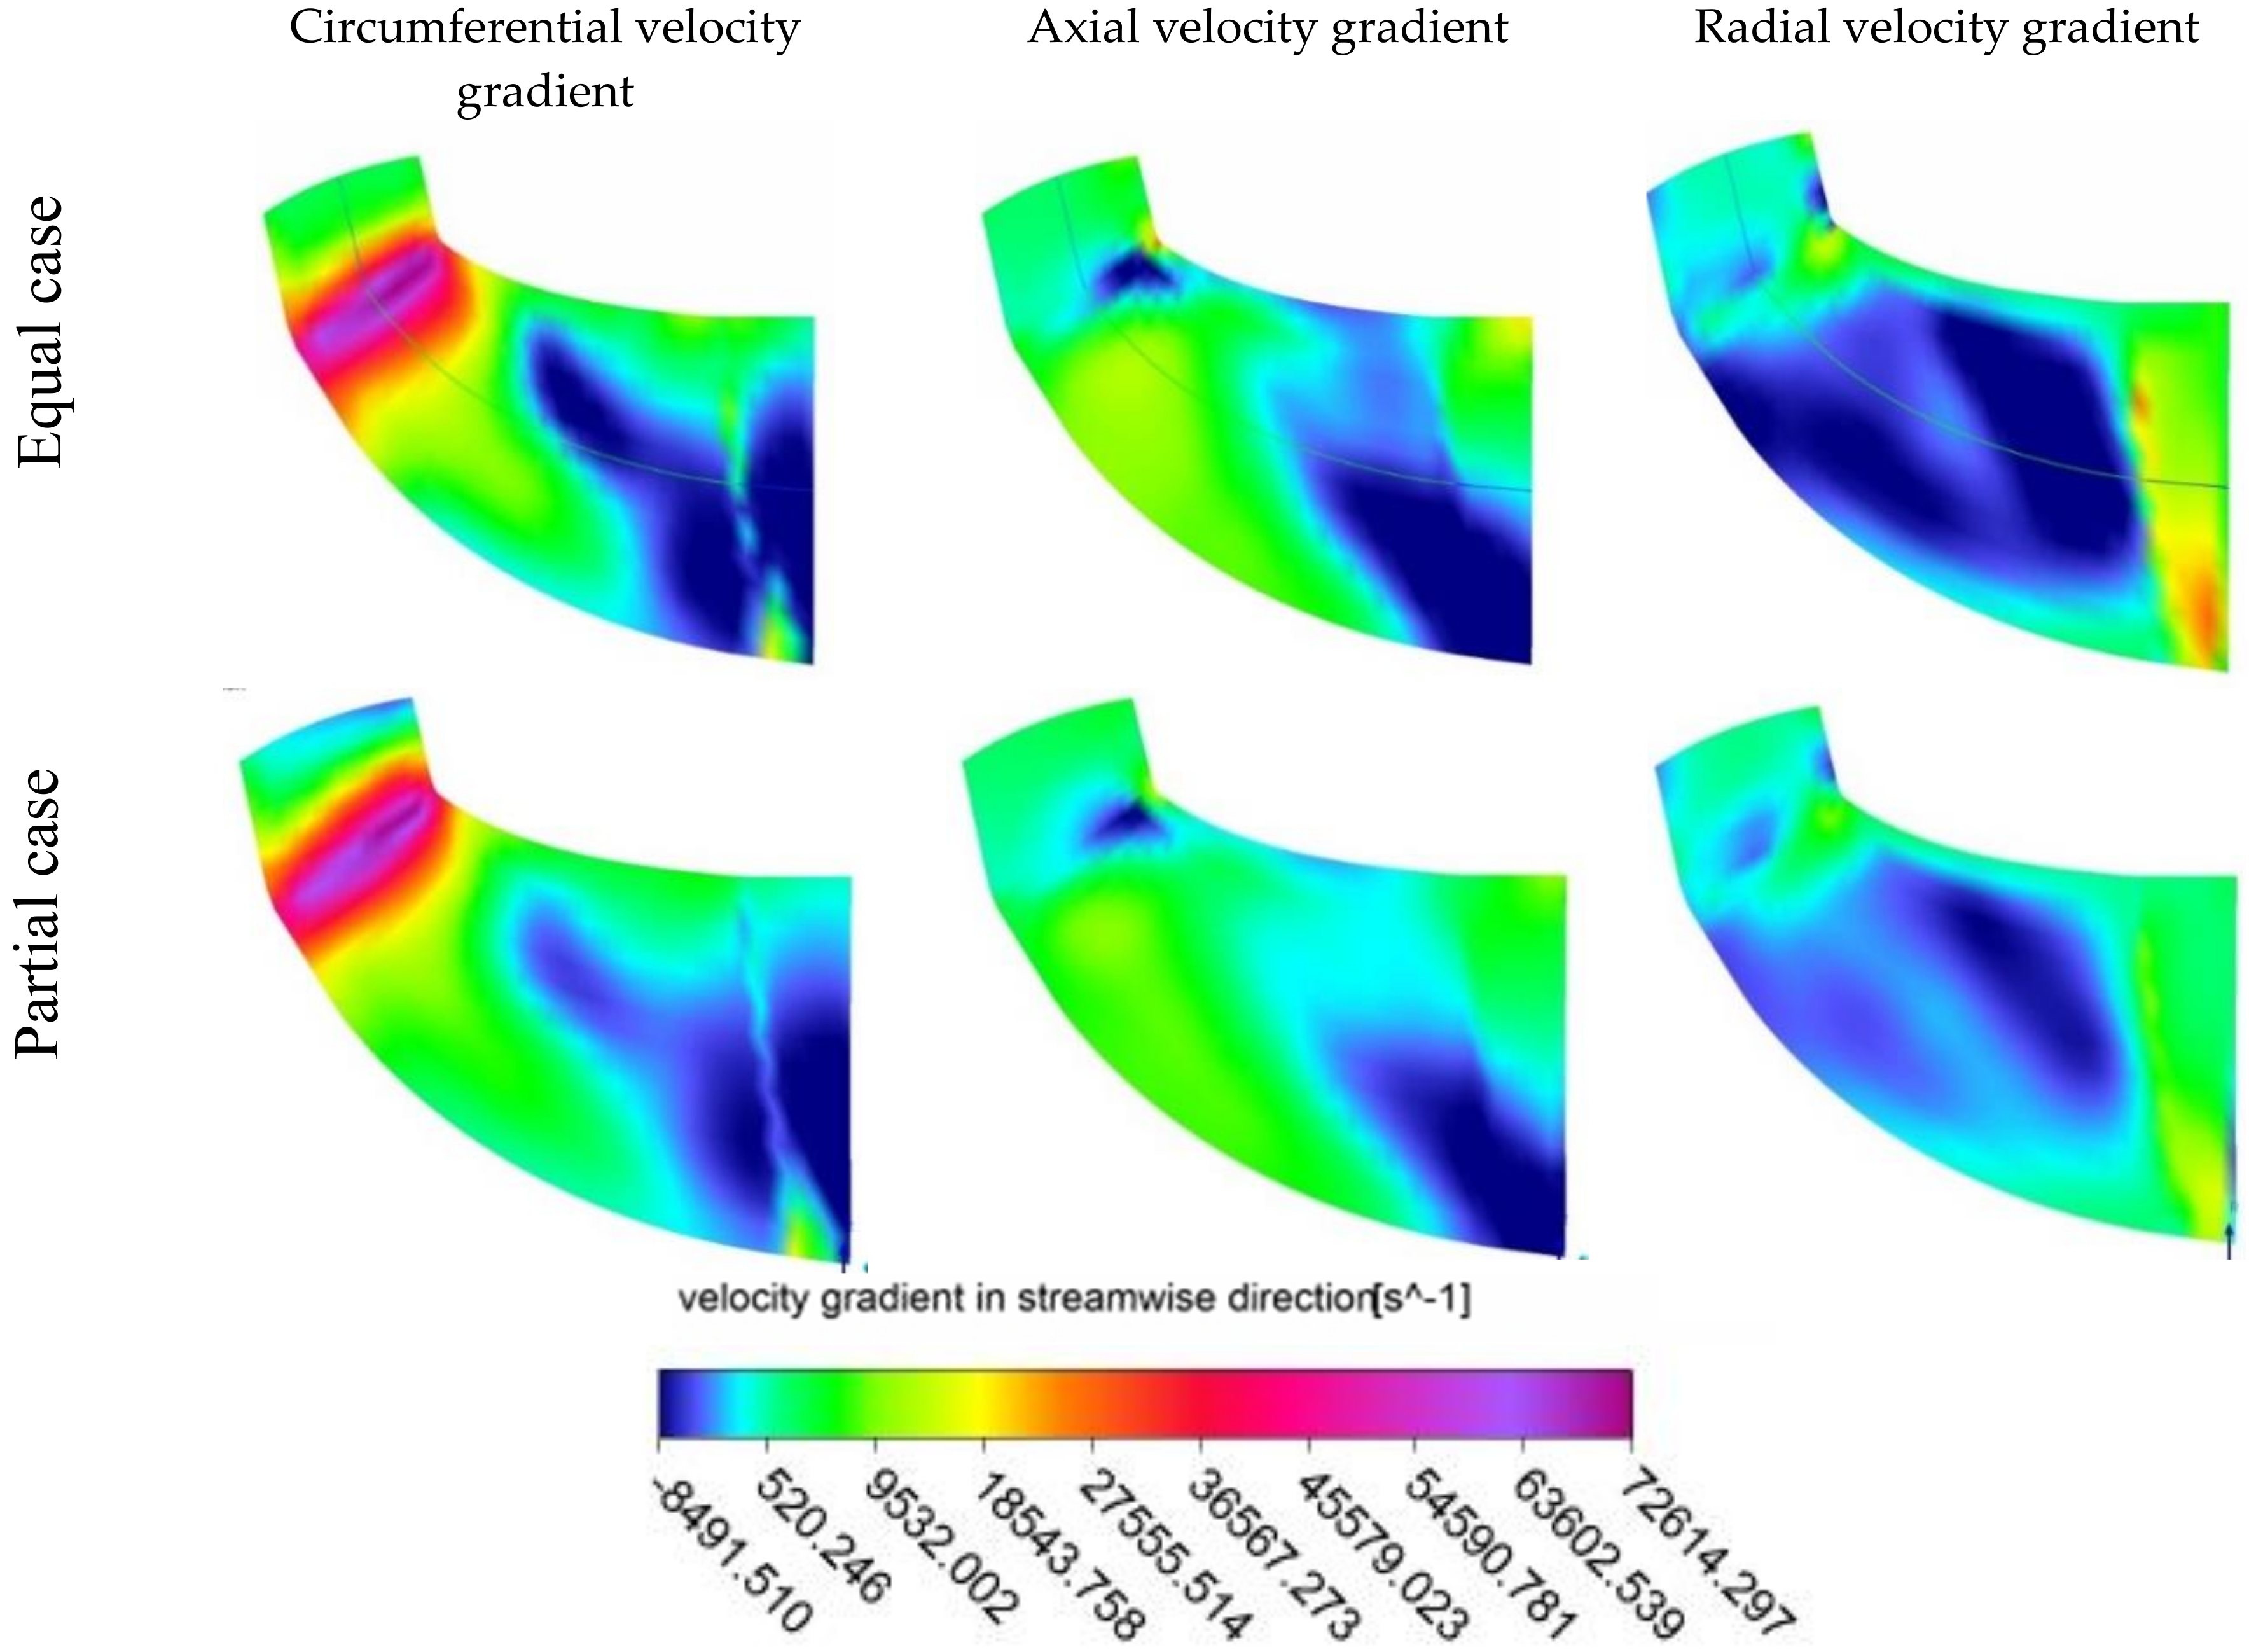
Vorticity is obtained by the curl of the velocity vector. In order to study which component of velocity has a higher contribution in each aforementioned vorticity type, it is useful to study the velocities’ gradient behavior in the different diameters of the rotor in the streamwise direction. The gradient of the velocity components are calculated by Equation (9); is representative of radial velocity, circumferential velocity, and axial velocity:
In Figure 11, the meridional view of the velocity component gradients in the streamwise direction in equal and partial cases is indicated. The meridional view shows the contour averaged in the circumferential direction.
In equal admission, all of the velocities’ components change more severely than partial admission. Circumferential velocity has the highest variation among all of them in the streamwise direction in the different diameters of the rotor. It increases sharply at the leading edge, and after that, it starts to diminish at about the mid-length of the blade. Axial velocity has the lowest gradient in comparison with the other velocity components, and in equal admission, its variation is similar to the partial admission except for two small regions in the shroud tip at the leading edge and trailing edge. The radial velocity increases at the leading and trailing edge of the blade in the streamwise direction.
The Tr. vortex is located at the trailing edge, which caused a sharp radial velocity increase, but a reduction in the axial and circumferential components of the velocity. In the LR vortex, circumferential velocity increases sharply, but radial velocity decreases strongly, and axial velocity is not affected significantly. In the tip vortex, the circumferential velocity increases hugely, the axial velocity drops significantly, and the radial velocity increases slightly.
6. Conclusions
In this study, a dual volute turbocharger turbine was investigated. The turbine performance reduces with increasing the inequality of the inlet pressure of the volute limbs. Isolating was applied to reduce the interaction of the entries in the interspace region. The results show that:
- Separating the rotor sectors in the interspace region near the tongues leads to an efficiency drop because of preventing the flow from rotating and entering with favorable incidence to the rotor, and because of reducing the effective area of the two stator vanes in the isolating area; however, isolating helps to decrease the dissipation of momentum in the mixing loss, and a higher MFR leads to a higher efficiency gain. This efficiency gain can compensate the pre-mentioned generated entropy in partial case, but not in the other unequal cases.
Then, the non-uniform inlet flow to the rotor in the equal and partial admission cases was investigated to find the effectiveness of the pressure level and gradient on the extent, intensity, and central location of vortices in the passages, and these results were obtained:
- With the decreasing pressure level, the center of the tip vortex shifted to the previous sections.
- The P.s pressure level affects the tip vortex more than the S.s pressure.
- The intensity of the tip vortex core is more affected by pressure level than the SPR.
- The SPR is more effective in the wide-spreading of the tip vortex than the pressure level and higher inequality (SPR-1), resulting in a more expanded but weaker tip vortex. In equal admission, when SPR changed 2% from unity, the maximum of vorticity intensity at the center of the tip vortex decreased by 10%.
- SPR does not have any impact on the LR vortex, and only the pressure level affects the vortices’ strength and the location of the vortex center. In equal admission, when the SPR changed 2% from the unity, the vorticity width did not change; also, with an 8% drop in the pressure level, the maximum of vorticity intensity at the LR vortex core decreased by 23%.
- The LR vortex center moves to the right-hand side with the increasing pressure level.
- The P.s pressure level affects the Tr. vortex more than the S.s pressure level. When the pressure level increased by 8%, the maximum of vorticity intensity at the center of the right head of the Tr. vortex, which is closer to the P.s, rises about 19%, but the left-hand side of this vortex, which is closer to the S.s, grows 12%.
- Considering the passages in the partial case shows that with sufficiently decreasing pressure, the left-hand side of the Tr. vortex almost disappears, but the right-hand side is affected less.
- Rising the pressure of each passage side enhances the vorticity of the other Tr. vortex’s head side.
- The Tr. vortex is located at the trailing edge, which caused a sharp growth in the radial velocity there, but also caused a decline in the axial and circumferential components of the velocity.
- In the LR vortex, the circumferential velocity increases sharply, but the radial velocity decreases strongly, and the axial velocity is not affected significantly.
- In the tip vortex, circumferential velocity increases hugely, axial velocity drops significantly, and radial velocity increases slightly.
Author Contributions
A.S. made the geometry model. The research has done by supervision of M.H.S.F., A.K. and A.S. carried out the simulations, methodology and the analysis. A.S. and A.K. wrote and refined the paper. All authors have read and approved the final manuscript.
Funding
This research received no external funding.
Conflicts of Interest
The authors declare no conflict of interest.
Nomenclature
| Isentropic flow velocity | |
| Rotor mean inlet diameter | |
| Mass flow | |
| N | Speed of rotation |
| P | Pressure |
| PR | Pressure ratio |
| MP | Mass parameter |
| T | temperature |
| η | Efficiency |
| S.s | Suction side |
| P.s | Pressure side |
| Pressure loss coefficient | |
| Isentropic flow area | |
| Tr. vortex | Trailing-edge vortex |
| LR vortex | Leading-edge Root Vortex |
| SPR | Surface pressure ratio |
| U | Blade speed |
| (1-MFR) | Degree of inequaity (Equation (5)) |
| CFX | Ansys code |
| Subscripts | |
| 0 | Stagnation conditions, Volute inlet station |
| 1 | Nozzle inlet station |
| 2 | Rotor inlet |
| 3 | Rotor exit |
| eff | Effective |
| Inner | Inner limb entry |
| Is | Isentropic process |
| O | Reference value |
| Outer | Outer limb entry |
| s | Static condition |
| T | Total condition |
| t-s | Total to static |
| LP | Low pressure |
| HP | High pressure |
| DCL | Degree in Circumferential location |
| ~ | Approximate component |
References
- Acharya, S.; Mahmood, G.I. Turbine Blade Aerodynamics; The Gas Turbine Handbook; National Energy Technology Laboratory (NETL)-DOE: Pittsburgh, PA, USA, 2006; Volume 1. [Google Scholar]
- Watson, N.; Janota, M.S. Turbocharging the Internal Combustion Engines, 1st ed.; The Macmillan Press Ltd.: London, UK, 1982; ISBN 978-1-349-04024-7. [Google Scholar]
- Chiong, M.S.; Rajoo, S.; Martinez-Botas, R.F.; Costall, A.W. Engine Turbocharger Performance Prediction: One-Dimensional Modeling of a Twin Entry Turbine. Energy Convers. Manag. 2012, 57, 68–78. [Google Scholar] [CrossRef]
- Copeland, C.; Seiler, M.; Martinez-Botas, R.F. Unsteady Performance of a Double Entry Turbocharger Turbine with a Comparison to Steady Flow Conditions. J. Turbomach. Trans. ASME 2012, 134, 021022. [Google Scholar] [CrossRef]
- Copeland, C.; Seiler, M.; Martinez-Botas, R.F. Comparison Between Steady and Unsteady Double-Entry Turbine Performance Using the Quasi-Steady Assumption. J. Turbomach. ASME 2011, 133, 031001. [Google Scholar] [CrossRef]
- Copeland, C.D.; Newton, P.J.; Martinez-Botas, R.; Seiler, M. The Effect of Unequal Admission on the Performance and Loss Generation in a Double-Entry Turbocharger Turbine. J. Turbomach. ASME 2012, 134, 021004. [Google Scholar] [CrossRef]
- Copeland, C. The Evaluation of Steady and Pulsating Flow Performance of a Double-Entry Turbocharger Turbine. Ph.D. Thesis, Imperial College of Science Technology and Medicine, University of London, London, UK, 2010. [Google Scholar]
- Newton, P.; Copeland, C.D.; Martinez-Botas, R.; Seiler, M. An audit of aerodynamic loss in a double entry turbine under full and partial admission. Int. J. Heat Fluid Flow 2012, 33, 70–80. [Google Scholar] [CrossRef] [Green Version]
- Reising, S.; Schiffer, H.P. Non-Axisymmetric End Wall Profiling in Transonic Compressors. Part I: Improving the Static Pressure Recovery at Off-Design Conditions by Sequent/ial Hub and Shroud End Wall Profiling. In Proceedings of the ASME Turbo Expo, Power for Land, Sea and Air (GT2009-59133), Orlando, FL, USA, 8–12 June 2009; pp. 11–24. [Google Scholar] [CrossRef]
- Severing, C.H. Recent Progress in the Understanding of Basic Aspects of Secondary Flows in Turbine Blade Passages. J. Eng. Gas Turbines Power ASME 1985, 107, 248–257. [Google Scholar] [CrossRef]
- Ciorciari, R.; Kirik, I.; Niehuis, R. Effects of Unsteady Wakes on the Secondary Flows in the Linear T106 Turbine Cascade. J. Turbomach. ASME 2014, 136, 091010. [Google Scholar] [CrossRef]
- Moustapha, S.H.; Paron, G.J.; Wade, J.H.T. Secondary Flows in Cascades of Highly Loaded Turbine Blades. J. Eng. Gas Turbines Power ASME 1985, 107, 1031–1038. [Google Scholar] [CrossRef]
- Boletis, E. Effects of Tip Endwall Contouring on the Three-Dimensional Flow Field in an Annular Turbine Nozzle Guide Vane: Part 1-Experimental Investigation. J. Eng. Gas Turbines Power ASME 1985, 107, 983–990. [Google Scholar] [CrossRef]
- Sieverding, C.H.; Hove, W.; Van Boletis, E. Experimental Study of the Three-Dimensional Flow Field in an Annular Turbine Nozzle Guidevane. J. Eng. Gas Turbines Power ASME 1984, 106, 437–444. [Google Scholar] [CrossRef]
- Goldstein, R.J.; Spores, R.A. Turbulent Transport on the Endwall in the Region between Adjacent Turbine Blades. J. Eng. Gas Turbines Power ASME 1988, 110, 862–869. [Google Scholar] [CrossRef]
- Langston, L.S.; Nice, M.L.; Hooper, R.M. Three-Dimensional Flow within a Turbine Cascade Passage. J. Eng. Gas Turbines Power ASME 1997, 99, 21–28. [Google Scholar] [CrossRef]
- Sieverding, C.H.; Bosche, V.P. The Use of Colored Smoke to Visualize Secondary Flows in a Turbine-Blade Cascade. J. Fluid Mech. 1983, 134, 85–91. [Google Scholar] [CrossRef]
- Wang, H.P.; Olson, S.J.; Goldstein, R.J.; Eckert, E.R.G. Flow visualization in a linear turbine cascade of high performance turbine blades. J. Turbomach. 1997, 119. [Google Scholar] [CrossRef]
- Ciorciar, R.; Schubert, T.; Niehuis, R. Numerical Investigation of Secondary Flow and Loss Development in a Low-Pressure Turbine Cascade with Divergent Endwalls. Int. J. Turbomach. Propuls. Power 2018, 3, 5. [Google Scholar] [CrossRef]
- Putra, M.A.; Joos, F. Investigation of Secondary Flow Behavior in a Radial Turbine Nozzle. J. Turbomach. ASME 2013, 135, 11. [Google Scholar] [CrossRef]
- Marsan, A.; Moreau, S. Analysis of the flow structure in a radial turbine. In Proceedings of the 11th European Conference on Turbomachinery Fluid dynamics & Thermodynamics ETC11, Madrid, Spain, 23–25 March 2015. [Google Scholar]
- Ansys Inc. CFX 14.0 Theory Guide. In ANSYS 14.0 Help; Ansys Inc.: Canonsburg, PA, USA, 2011. [Google Scholar]
- Fottner, L. Review on Turbomachinery Blading Design Problems; AGARD Lecture Series No. 167; Reproduction Ltd Harford House: Toronto, ON, Canada, 1989. [Google Scholar]
- Tacina, R.; Grobman, J. Analysis of Total-Pressure Loss and Airflow Distribution for Annular Gas Turbine Combustors; NASA TN D-5385; National Aeronautics and Space Administration: Washington, DC, USA, August 1969. [Google Scholar]
- Newton, P.J. An Experimental and Computational Study of Pulsating Flow within a Double Entry Turbine with Different Nozzle Settings. Ph.D. Thesis, Imperial College of Science Technology and Medicine, University of London, London, UK, February 2014. [Google Scholar]
- Padzillah, M.H.; Rajoo, S.; Martinez-Botas, R.F. Numerical Assessment of Unsteady Flow Effects on a Nozzled Turbocharger Turbine. In Proceedings of the ASME Turbo Expo 2012, Copenhagen, Denmark, 11–15 June 2012. [Google Scholar]
Figure 1.
(a) Rotor blade mesh (b) Stator blade mesh.

Figure 2.
Comparison of computed and measured mass flow parameter against pressure ratio.

Figure 3.
Comparison of computed and measured efficiency against velocity ratio.

Figure 4.
Effective area versus pressure ratio.

Figure 5.
(a) Surface pressure on the all of the turbine blades in equal and partial admission; (b) definition of blade passages.
Figure 5.
(a) Surface pressure on the all of the turbine blades in equal and partial admission; (b) definition of blade passages.

Figure 6.
Selected passages and sections on the turbine blades (a) in equal admission; (b) in three-dimensional (3D) view; (c) in two-dimensional (2D) view; (d) in partial admission.
Figure 6.
Selected passages and sections on the turbine blades (a) in equal admission; (b) in three-dimensional (3D) view; (c) in two-dimensional (2D) view; (d) in partial admission.

Figure 7.
(a) Original geometry; (b) efficiency drop with increasing the pressure inequality of two limbs (c) separated in tongue region (A and B).
Figure 7.
(a) Original geometry; (b) efficiency drop with increasing the pressure inequality of two limbs (c) separated in tongue region (A and B).

Figure 8.
Vorticity contours at specified sections in blade passages 5–6, 10–11, and 6–7 of the equal case in spanwise location against the degree in circumferential location (DCL).
Figure 8.
Vorticity contours at specified sections in blade passages 5–6, 10–11, and 6–7 of the equal case in spanwise location against the degree in circumferential location (DCL).

Figure 9.
Vorticity contours at specified sections in blade passages 3–4, 4–5, and 9–10 of the partial case in the spanwise location against the degree in circumferential location (DCL).
Figure 9.
Vorticity contours at specified sections in blade passages 3–4, 4–5, and 9–10 of the partial case in the spanwise location against the degree in circumferential location (DCL).

Figure 10.
Total pressure loss coefficient contours in various span heights in blade passages 5–6, 10–11, and 6–7 of the equal case and in blade passages 3–4, 4–5, and 9–10 of the partial case.
Figure 10.
Total pressure loss coefficient contours in various span heights in blade passages 5–6, 10–11, and 6–7 of the equal case and in blade passages 3–4, 4–5, and 9–10 of the partial case.

Figure 11.
Meridional view of velocity component gradients in the streamwise direction in equal and partial cases.
Figure 11.
Meridional view of velocity component gradients in the streamwise direction in equal and partial cases.


Table 1.
Turbine geometry parameters.
| Root mean radius at trailing edge of rotor [mm] | 52 |
| Length of axial chord of rotor [mm] | 40 |
| Tip gap height of rotor (% of blade span) | 3 |
| Inlet cone angle of rotor | 55.1° |
| Exit cone angle of rotor | 7.2° |
| Nozzle vane angle | 70° |
| Total pressure ratio (Design point) | 2.1 |
| Design shaft speed 20,000 rpm | 53,344 |
| Hub-to-tip-ratio rotor blade | 0.84 |
| Nozzle throat diameter [mm] | 4.405 |
| Blade width of nozzle [mm] | 12.963 |
Table 2.
Mesh intensity study.
| Trial | Number of Elements | Stage Total-to-Static Efficiency (%) | Mass Flow Rate (kg/s) | CPU Time (h) | |
|---|---|---|---|---|---|
| Nozzle | Rotor | ||||
| 1 | 153,545 | 254,354 | 58.354985 | 0.495454 | 12 |
| 2 | 436,565 | 625,873 | 60.865447 | 0.502279 | 23 |
| 3 | 835,463 | 1,135,512 | 62.096835 | 0.506682 | 46 |
| 4 | 1,465,436 | 1,825,434 | 61.5592978 | 0.505397 | 75 |
| 5 | 1,980,345 | 2,538,034 | 61.453565 | 0.505322 | 105 |
Table 3.
Boundary condition.
| Case 1 | Case 2 | Case 3 | Case 4 | Case 5 | Case 6 | Case 7 | Case 8 | Case 9 | |
|---|---|---|---|---|---|---|---|---|---|
| Total Pressure[pa] At lower inlet | 259,358 | 210,792 | 159,073 | 146,303 | 134,649 | 199,407 | 211,063 | 197,334 | 204,222 |
| Total Pressure[pa] At Upper inlet | 258,085 | 209,949 | 158,700 | 146,002 | 134,605 | WALL | 130,799 | 149,485 | 264,643 |
Table 4.
The strategy of passages selection and their surface pressure ratio (SPR) number.
| Surface Pressure | Equal Admission Case | SPR | Partial Admission Case | SPR |
|---|---|---|---|---|
| S.s < P.s | 5–6 | 1.02 | 3–4 | 1.25 |
| S.s = P.s | 10–11 | 1 | 4–5 | 1 |
| S.s > P.s | 6–7 | 0.973 | 9–10 | 0.88 |
Table 5.
Performance variation.
| Variable | Studied Cases | Minimum | Maximum | Mean |
|---|---|---|---|---|
| original | 4 | 0.440 | 0.990 | 0.697 |
| isolated | 4 | 0.455 | 0.990 | 0.62 |
© 2018 by the authors. Licensee MDPI, Basel, Switzerland. This article is an open access article distributed under the terms and conditions of the Creative Commons Attribution (CC BY) license (http://creativecommons.org/licenses/by/4.0/).
Share and Cite
MDPI and ACS Style
Sajedin, A.; Shojaeefard, M.H.; Khalkhali, A. Radial Gradient Pressure Effects on Flow Behavior in a Dual Volute Turbocharger Turbine. Appl. Sci. 2018, 8, 1961. https://doi.org/10.3390/app8101961
AMA Style
Sajedin A, Shojaeefard MH, Khalkhali A. Radial Gradient Pressure Effects on Flow Behavior in a Dual Volute Turbocharger Turbine. Applied Sciences. 2018; 8(10):1961. https://doi.org/10.3390/app8101961
Chicago/Turabian StyleSajedin, Azadeh, Mohammad Hasan Shojaeefard, and Abolfazl Khalkhali. 2018. "Radial Gradient Pressure Effects on Flow Behavior in a Dual Volute Turbocharger Turbine" Applied Sciences 8, no. 10: 1961. https://doi.org/10.3390/app8101961
Note that from the first issue of 2016, this journal uses article numbers instead of page numbers. See further details here.