An Integrated Design and Optimization Approach for Radial Inflow Turbines—Part II: Multidisciplinary Optimization Design


1
Shaanxi Engineering Laboratory of Turbomachinery and Power Equipment, Institute of Turbomachinery, School of Energy and Power Engineering, Xi’an Jiaotong University, Xi’an 710049, China
2
Collaborative Innovation Center of Advanced Aero-Engine, Beihang University, Beijing 100191, China
3
China Shipbuilding New Power Co., Ltd., Beijing 100097, China
*
Author to whom correspondence should be addressed.
Appl. Sci. 2018, 8(11), 2030; https://doi.org/10.3390/app8112030
Submission received: 31 August 2018
/
Revised: 14 October 2018
/
Accepted: 18 October 2018
/
Published: 23 October 2018
(This article belongs to the Special Issue Radial Turbomachinery Aerodynamics)
Abstract
:This paper proposes an integrated design and optimization approach for radial inflow turbines consisting of an automated preliminary design module and a flexible three-dimensional multidisciplinary optimization module. The latter was constructed by an evolution algorithm, a genetic algorithm-assisted self-learning artificial neural network and a dynamic sampling database. The 3-D multidisciplinary optimization approach was validated by the original T-100 turbine and the T-100re turbine obtained from the automated preliminary design approach, for maximizing the total-to-static efficiency and minimizing the rotor weight while keeping the mass flow rate constant and stress limitation satisfied. The validation results indicate that the total-to-static efficiency is 89.6%, increased by 1.3%, and the rotor weight is reduced by 0.14 kg (14.6%) based on the T-100re turbine, while the efficiency is 88.2%, increased by 2.2% and the weight is reduced by 0.49 kg (37.4%) based on the original T-100 turbine. Moreover, the T-100re turbine shows better performance at the preliminary design stage and conserves this advantage to the end, though both the aerodynamic performance of the T-100 and the T-100re turbine are improved after 3-D optimization. At the same time, it is implied that the preliminary design plays an essential role in the radial inflow turbine design process, and it is hard for only 3-D optimization to get a further performance improvement.
1. Introduction
It is well known that the design of radial inflow turbines is an inevitably multidisciplinary problem, which needs iterations between aerodynamic performance and mechanical feasibility. This complexity makes the design of radial inflow turbines a time-consuming task in the past decades and pushes forward tremendous growth in numerical optimization research [1,2,3] at the same time.
Bonaiuti et al. [4] proposed a multiobjective and multipoint design approach for a turbomachinery blade. This approach coupled inverse design and optimization techniques to reduce geometric parameters necessary to accurately represent the blade geometry, thus it facilitated the use of automatic optimization for more complex problems. He et al. [5] developed an optimization system which also coupled inverse design and optimization techniques, but it introduced a stage-by-stage strategy to facilitate multistage optimization. Fu [6,7] developed an integrated optimization design approach for radial inflow turbines, in which the aerodynamic performance, the stress constraint, and the rotor weight were considered sequentially. An initial design is generated in the first iteration, and then the outlet radius and the axial length are reduced by a small step in the following iterations until the aerodynamic performance, the stress constraint, and the weight constraint are all satisfied. Al Jubori et al. [8] presented a 3-D multiobjective optimization technique combined a response surface method and multiobjective method. The optimization of the blade geometry was performed using 20 design variables for both nozzle and rotor blades, based on the B-splines’ technique to represent the blade angles and thickness distribution. The results of the optimized geometry with R245fa showed that the turbine’s and the cycle’s thermal efficiencies were increased higher by 13.95% and 17.38%, respectively.
Verstraete et al. [9] conducted a multidisciplinary optimization for a micro gas turbine compressor in order to maximize the efficiency while keeping maximum centrifugal stress at the specified level. Mueller et al. [10] performed a multidisciplinary optimization for a turbocharger radial turbine. The differential evolution algorithm and the artificial neural network (ANN) were used to improve the efficiency and reduce the impeller inertia while limiting the stress to an allowable level at reasonable computational cost. Van den Braembussche et al. [11] conducted a multidisciplinary multipoint optimization for a transonic turbocharge compressor. The operating range is guaranteed by a two-step optimization procedure. The first one is used to satisfy the choking mass flow rate and the second one to evaluate the performance curve with specified choking mass flow rate. Shao [12] presented a multidisciplinary integrated design and optimization method for radial inflow turbines in which aerodynamic performance and structure realization were considered simultaneously.
Samad et al. [13] evaluated the multiple surrogate models including response surface, radial basis neural network, and the Kriging method. An average model was built from those individual surrogate models according to the global error level. The results show that more robust approximation can be achieved than individual surrogates. Öksüz et al. [14] developed a multiploid genetic optimization method to handle a multiobjective blade aerodynamic optimization problem and found that the method proposed successfully accelerates the optimization.
Generally, the objective of numerical optimization strategy of turbomachinery is to construct a coupled system fully considering the interaction effects of aerodynamic performance, solid mechanics and sometimes acoustics with the aid of artificial intelligence techniques. A typical numerical optimization system consists of four modules, the parameterization module, the computational flow dynamics- and computational structural mechanics (CFD and CSM)-based high-fidelity evaluation module, the optimization algorithm module, and the metamodel module. In optimization research, evolutionary algorithms (EAs) are particularly effective for turbomachinery problems due to their robustness and capability to handle discontinuous and multimodal objective functions. However, numerical optimization involves a huge number of fitness evaluations which hinder its practical application especially for large-scale computational cases, and therefore metamodel techniques become more and more attractive in recent years.
A metamodel, which is also referred to as a surrogate model and approximation model, is a quick response model of the fitness function used to replace the time- and resource-consuming CFD and CSM based on high fidelity evaluation tools. There are a variety of techniques for constructing metamodel such as response surface [15,16], radial basis functions [17], Kriging [18], ANN, etc. Two strategies are mainly used in the literature to build the metamodel. The first one is based on an extremely coarse database initially and then updates dynamically according to the error level [9], and the second one is a one-shot strategy based on a very large database and does not update during the optimization process [2,19].
It is well-known that the design procedure of a turbomachinery mainly includes two steps, one is the preliminary design, and the other is the 3-D design. The preliminary design is fundamental and it provides some main geometry parameters and aerodynamic performance parameters to the sequential 3-D design. In this study, an integrated design and optimization approach for radial inflow turbines was proposed, which consists of an automated preliminary design module and a flexible 3-D multidisciplinary optimization module. In Part I [20], an automated preliminary design approach for radial inflow turbines has been developed to reduce the dependency on human expertise by Genetic Algorithm (GA) driving exploration of the design space. The approach was verified by T-100 turbine [21] and the redesign work was conducted to demonstrate it. The results show that through the redesign, the total-to-static efficiency of T-100 turbine increases by 1.0% under design condition and the rotor weight decreases by 0.35 kg (26.7%), which also indicates the importance of the preliminary design.
As Part II of this integrated design approach, a 3-D multidisciplinary optimization method is developed to maximize the total-to-static efficiency and minimize the rotor weight while keeping the mass flow rate constant and guaranteeing the mechanical integrity of the rotor. Based on the geometrical and aerodynamic parameters of T-100 turbine and T-100re turbine obtained in Part I [20], the nozzle aerodynamic optimization and rotor multidisciplinary optimization for the two turbines are carried out in this paper, respectively.
2. 3-D Optimization Methodology
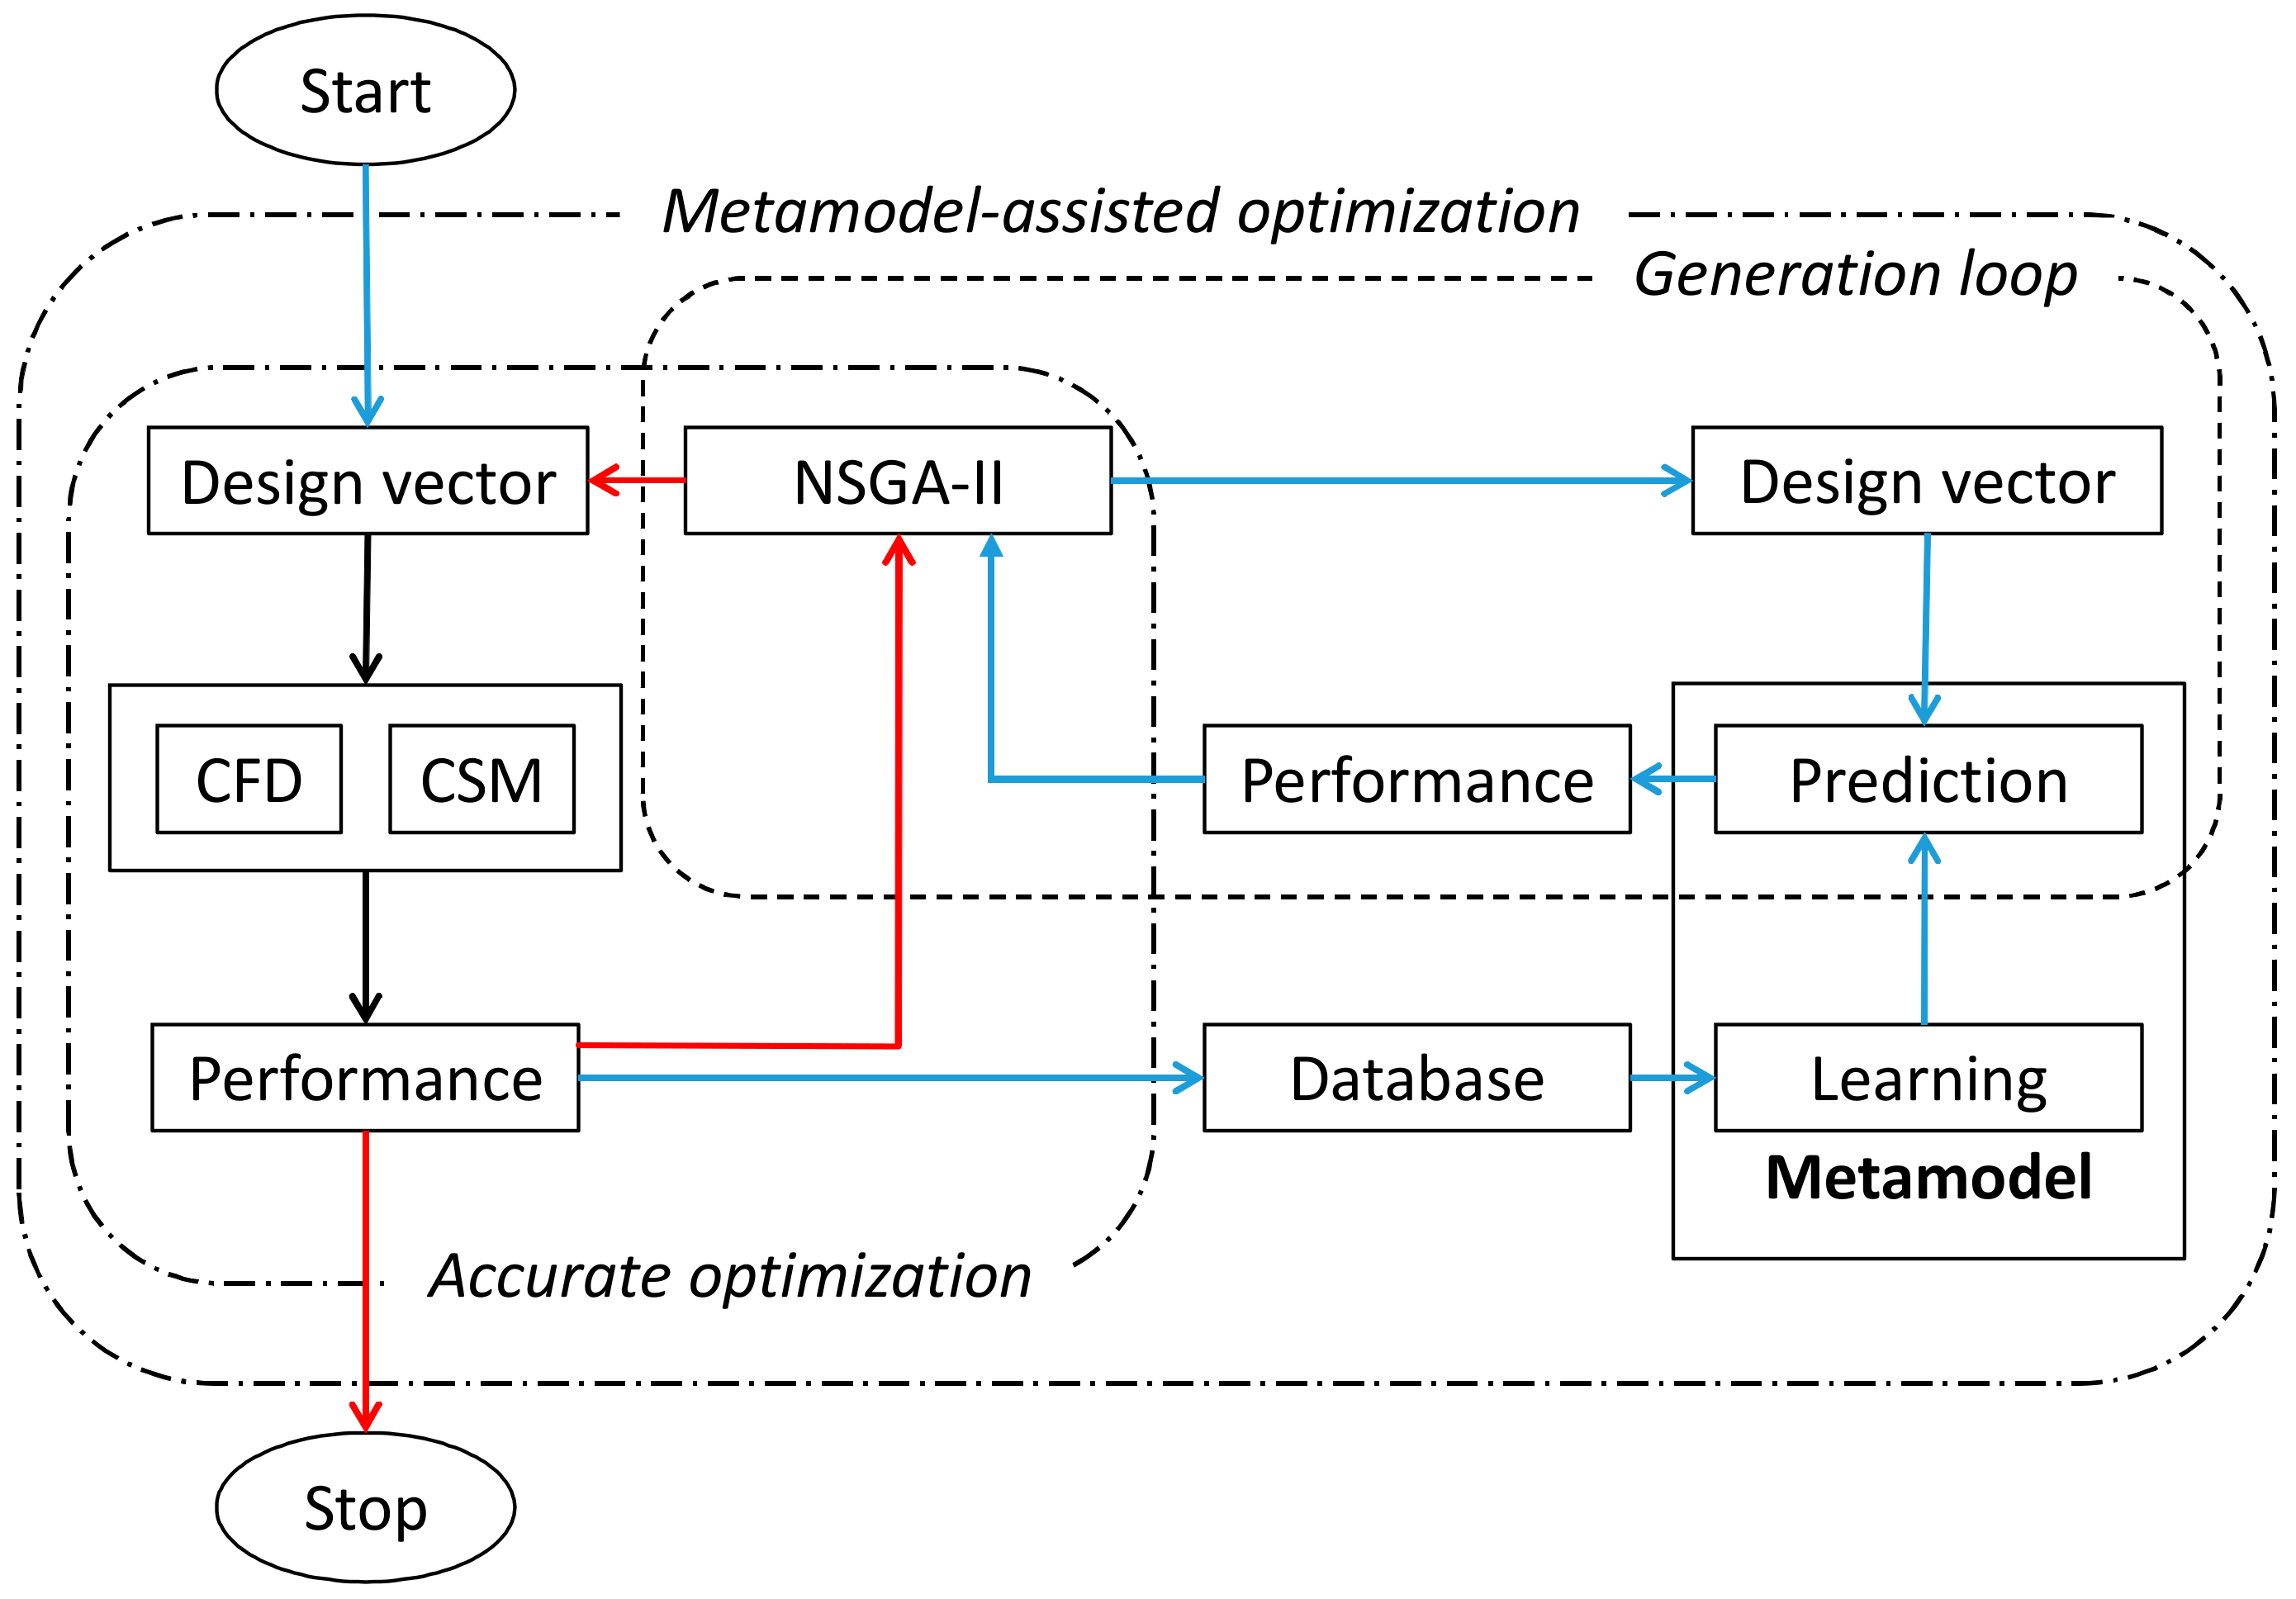
In this paper, a flexible 3-D multidisciplinary optimization system is developed and Figure 1 shows its flowchart. The system makes use of an optimization algorithm, a metamodel, a dynamic sampling database and high fidelity simulation codes for CFD and CSM analyses, respectively. Four optimization algorithms are integrated into this system, including genetic algorithm (GA), differential evolution algorithm (DEA) [22], nondominated sorting genetic algorithm (NSGA-II) [23] and simulated annealing algorithm (SAA). Besides, three metamodel techniques including the Kriging method, artificial neural network (ANN), and support vector machine (SVM) are integrated into this system.
It is to be noted that NSGA-II used in this paper is from a toolbox called Inspyred, which is a free, open source framework for creating biologically-inspired computational intelligence algorithms in Python, and the algorithms provided in Inspyred are all tested through benchmark test problems with excellent convergence. Also, NSGA-II is relatively popular and widely used in turbomachinery design optimization area. Many papers can be found within ASME (American Society of Mechanical Engineering) proceedings and journals that use this algorithm to drive their optimization.
In the present work, NSGA-II and ANN are used to perform the optimization and shorten the computational time. The system can easily switch between the accurate optimization and metamodel-assisted optimization. The initial database is generated using the Latin center hypercube method and then evaluated by high fidelity CFD and CSM codes. The metamodel is then built based on the database and used to substitute the computational tools (CFD and CSM). After a specified number of generations, 10 new individuals will be added in the database and the metamodel will be updated for better performance. The 10 new individuals are selected through a dynamic sampling algorithm, which makes the sampling as uniform as possible for fear that the database only reflects a subzone of the whole design space.
The ANN topology (number of hidden layers and the number of neurons per hidden layer) and the initial weight are optimized using GA because they greatly affect the precision of the obtained ANN. The population size for the ANN optimization is 10, the maximum generation is 15, and then the time for constructing metamodel increases, but the performance of the obtained metamodel is improved at the same time. The measurement for the ANN training is the mean relative error.
In the present paper, the optimization is conducted for T-100 and T-100re turbines, respectively, so as to assess the preliminary design influence of the radial inflow turbine according to the final results. Aerodynamic optimization is firstly performed for the nozzle, and multidisciplinary optimization is then performed for the rotor. The nozzle aerodynamic optimization involves two strategies. Accurate optimization (red loop in Figure 1) without metamodel is adopted for T-100 nozzle optimization and metamodel-assisted optimization (blue loop in Figure 1) is adopted for T-100re nozzle optimization. Both T-100 and T-100re rotors use the accurate optimization because the GA optimized ANN becomes time-consuming as the database grows. The detailed information about the metamodel is described in the discussion section.
The objective for the nozzle optimization is to maximize the total-to-static efficiency while keeping the mass flow rate constant. The main purpose is to lower the nozzle flow loss and improve the match between the nozzle and the rotor. The objective for the rotor optimization is to maximize the total-to-static efficiency and minimize the rotor weight while keeping the mass flow rate constant and the stress at the allowable level. The main purpose is to further improve the turbine aerodynamic performance and regulate the rotor to satisfy stress constraint.
3. Model Parameterization and Multidisciplinary Optimization
3.1. Parameterization of Nozzle and Rotor
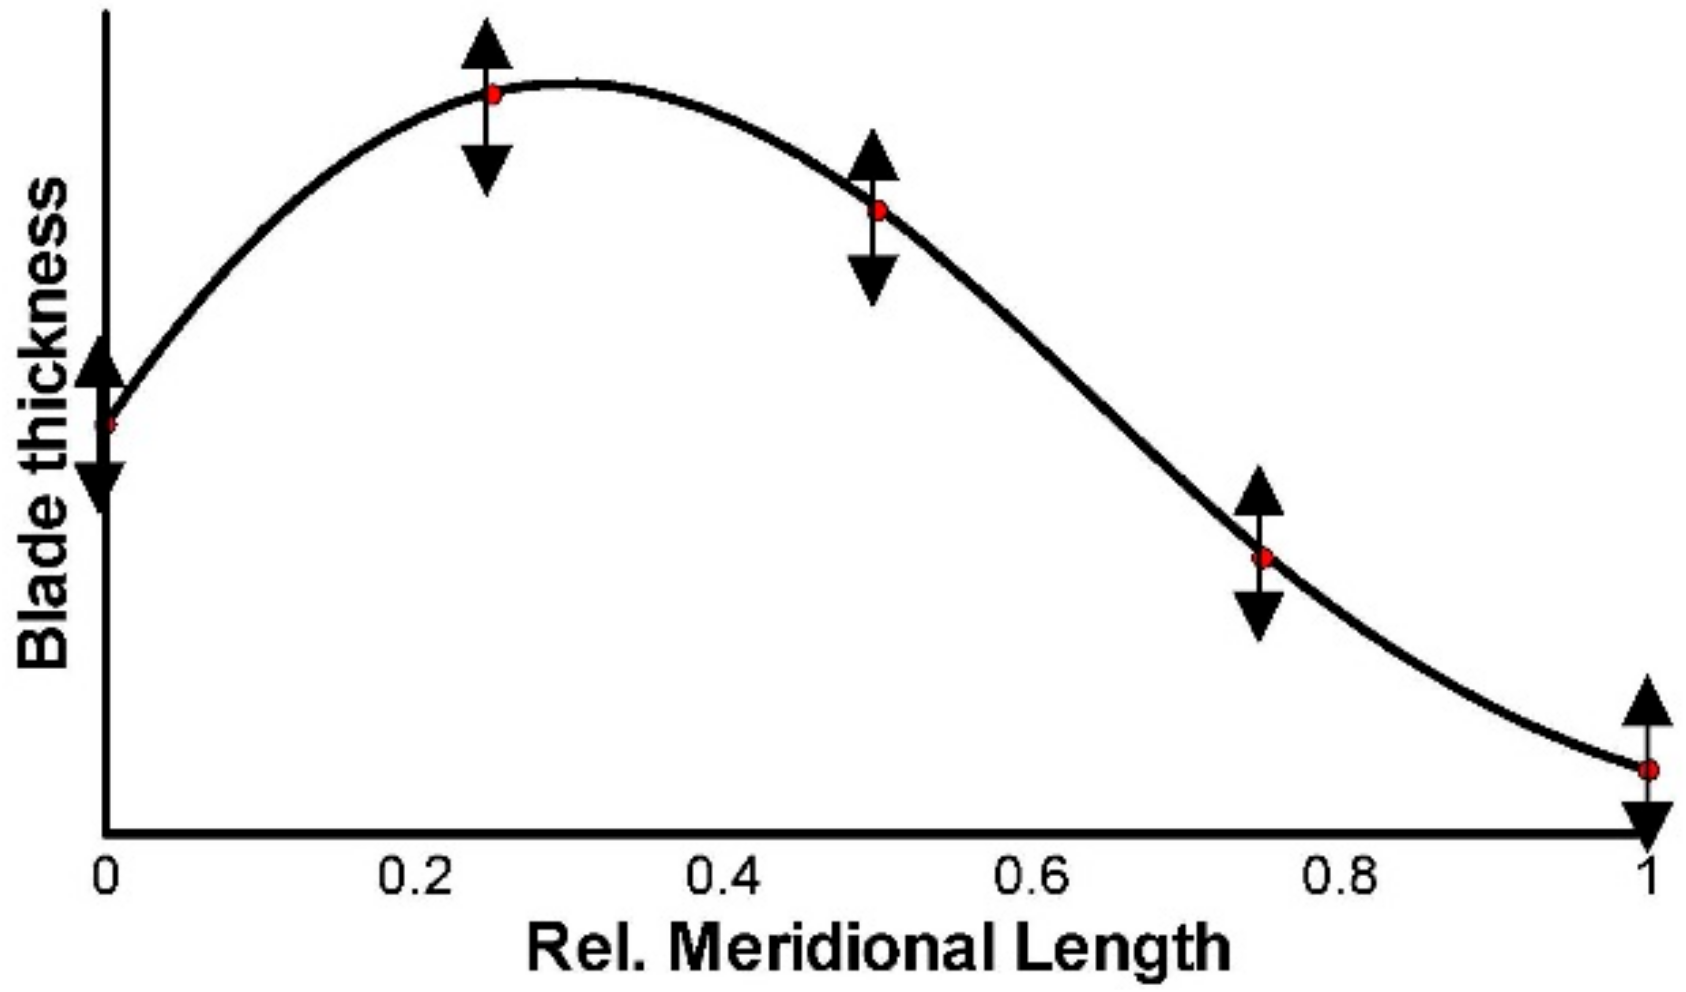
The parameterization of the turbine nozzle and rotor is based on Bezier and BSpline curves. The blade profile is defined by the blade thickness and beta-angle (the angle between the camber line and the meridional direction) distributions (see Figure 2 and Figure 3). The nozzle blade is controlled by one section, thus the nozzle blade is a straight blade without lean and twist.
The thickness and beta-angle distributions are parameterized by five control points, respectively. The first control point of the beta-angle distribution is fixed at 60° and the last control point of the thickness distribution is fixed at 0.3 mm (0.6 mm for the trailing edge diameter). Therefore, eight variables are involved in the nozzle optimization.
The variation range for the beta-angle on each variable control point is set to ±10% of its complement angle. The variation range for the thickness on each variable control point is also set to ±10% of the local thickness. The scope that the nozzle blade varies is examined to make sure that an adequate design space is provided and no interference happens.
The rotor is defined by: (1) the meridional contour of both the solid and fluid domain (Figure 4); (2) the beta-angle distribution of the camber line at hub, middle and tip sections (same as the nozzle parameterization in Figure 2); and (3) the thickness distribution is normal to the camber line at the hub and tip sections (same to the nozzle parameterization in Figure 3).
Figure 4 shows the definition of the meridional contours of both the solid and fluid domain. The solid hub firmly holds all the blades against the centrifugal force. An initial back face profile is given and parameterized with seven control points, the first and the last two control points are fixed, and the other four control points can be modified in a prescribed range as indicated by the arrows in Figure 4a. The blade patch corresponds to where the blade is located, and its hub and shroud profiles are defined with five control points, respectively. The first control points of both curves are fixed such that the inlet blade height is kept constant and no translation occurs for the entire geometry. The rest control points can be modified by the optimization program and the possible variation in axial and radial direction is indicated by arrows in Figure 4b.
In Figure 2, the rotor blade camber line at the hub, middle, and tip section is defined through beta-angle distribution with five equally spaced control points, respectively. The first control point at the hub section is fixed and the rest can be modified in a prescribed range. The 3-D camber line can be obtained using the transformation according to Figure 7 in Part I [20]. The thickness distribution is added and normal to the camber line at the hub and tip sections in both directions, and the blade shape between the two sections is interpolated. The thickness distribution is parameterized using the B-Spline curve with five control points in Figure 3, and the thickness at each control point can also be modified by the optimization program in a specified range.
The parameterization method mentioned above will provide the blade profiles at different layers. They are 3-D curves consisted of discrete points out there. The blade profile on each layer represents the blade geometry at a certain relative blade height. Then an open source 3-D modeling software called FreeCAD, which is released by Matra Datavision Inc in France, is used to perform a skinning to envelop the blade profile to form a solid blade entity. After that, the meridional profile including the hub profile, back profile and front line are loaded in to revolve a cylinder. At last, the intersection part of the blade and the cylinder is chamfered. All of the procedures can be done automatically through coding without opening up the GUI (Graphical User Interface), so a lot of time can be saved during this section. That’s the whole parameterization workflow for a cluster of discrete points to form a solid rotor entity which can be used for the following CFD and CSM analyses.
For the CFD analysis, the computation domain is between the shroud and the hub surface. For the CSM analysis, the computation domain is all inside the solid rotor entity.
3.2. Multidisciplinary Optimization
In the process of multidisciplinary optimization, the blade number of both T-100 and T-100re design is fixed and not optimized in the 3-D optimization stage, because extra difficulty will be imported for the rotor shell cut which is essential for the CSM analysis.
Regarding to the optimization variables, if a control point has variation in two coordinate directions, radial direction, and axial direction, it will have two variables in shape optimization process. Therefore, the total number of optimization variables for rotor optimization is 40, among which five variables for the solid hub back face profile, 11 for the hub and shroud meridional profiles, 14 for the beta-angle distribution, and 10 for the thickness distribution. In addition, four dependent variables whose positions are linked to one of the design variables are involved.
Table 1 shows the design parameters of T-100 turbine and T-100re turbine, and they are set in the optimization. It should be noted that the rotor rotational speed of T-100re turbine is higher than that of original T-100 turbine, after the T-100 turbine was redesigned by the automated preliminary design proposed in Part I [20].
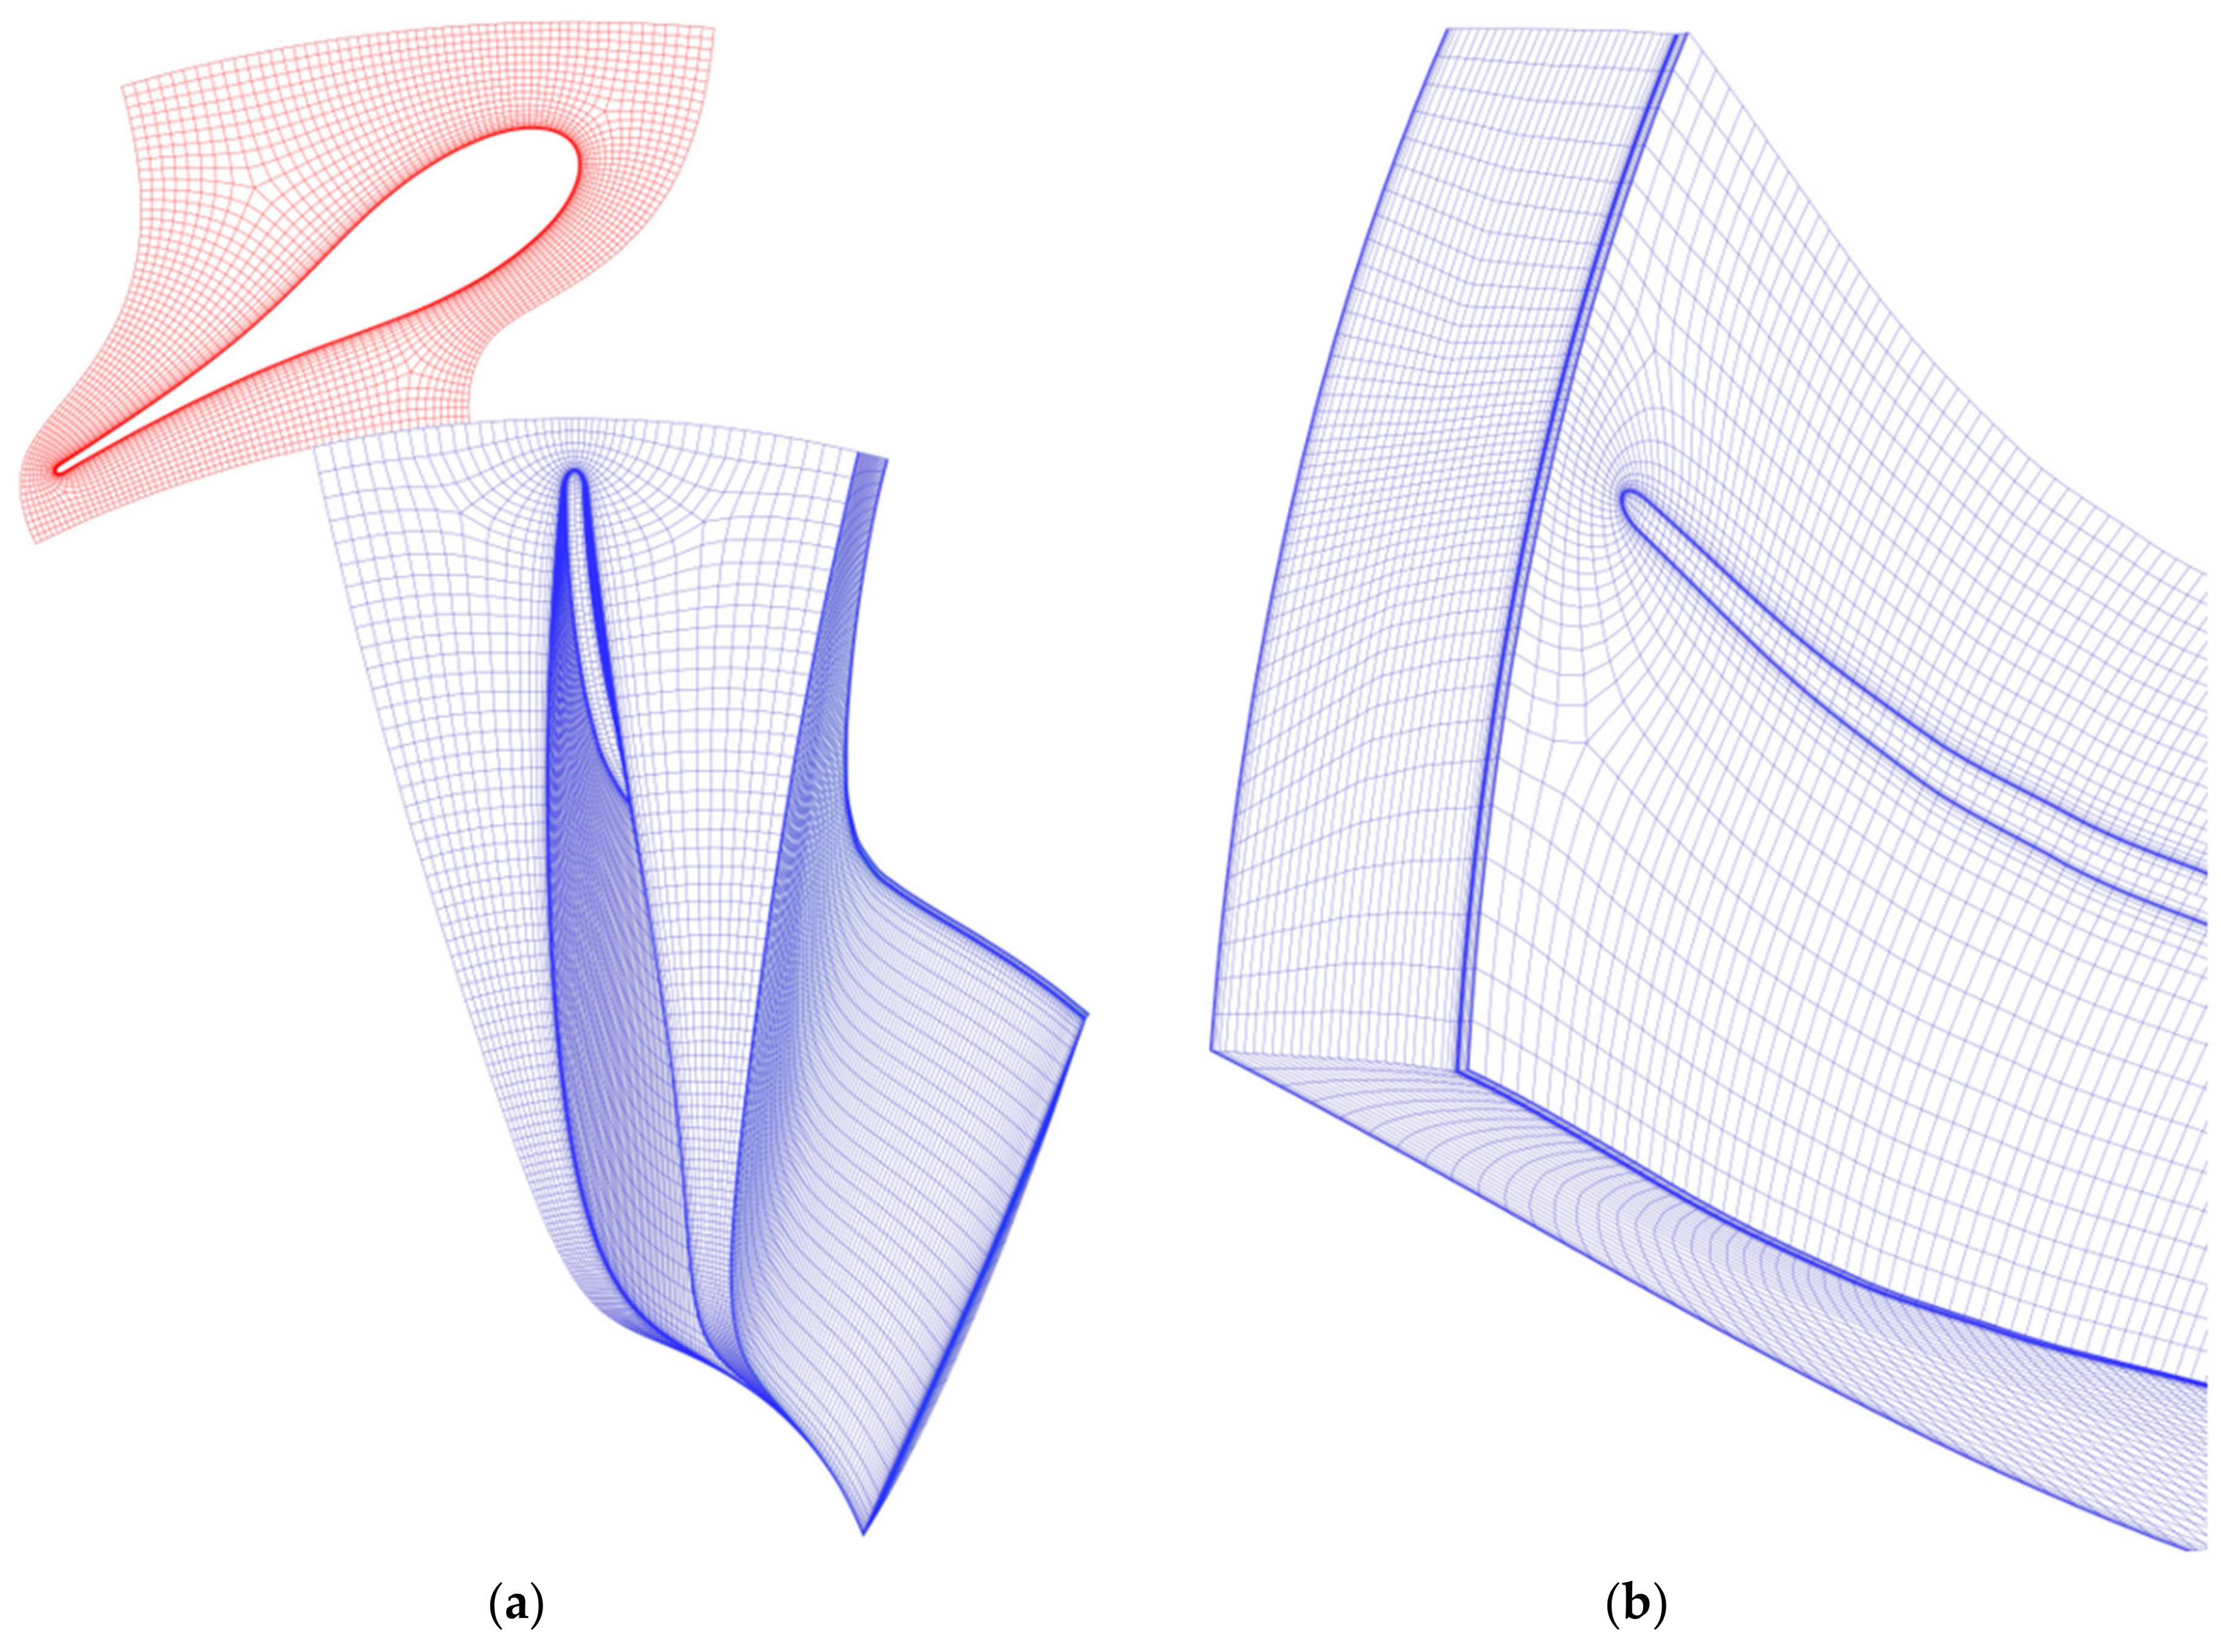
The flow simulations are conducted using ANSYS CFX, a commercial CFD software. The total grid number of CFD is 478,613, as shown in Figure 5, in which the grid numbers of the nozzle, the rotor, and the diffuser are 156,925, 289,363 and 32,325, respectively. The RANS coupled with the SST turbulence model is solved with the first layer y+ less than 2. It is worth mentioning that the mesh number and the turbulence model used were verified by mesh independency and various turbulence models provided in ANSYS CFX, respectively. The details of verification can be found in Reference [12] published by our research group.
In this paper, the software ANSYS Workbench is applied as the CSM solver. The total grid number of CSM is 555,663, as shown in Figure 6. The coupling of the CFD and the CSM solvers adopt a loose couple strategy, which at first evolves a CFD evaluation and then a CSM evaluation, and the aerodynamic change caused by the rotor deformation is not considered. That is to say, the effect of flow solid interaction was neglected because the blade of radial inflow turbines is relatively much more rigid than that of axial turbines. The deformation of the rotor blade is so small that its effect is negligible in this study for the aerodynamic performance.
Figure 7 illustrates the convergence history of flow simulation for a single CFD evaluation. It can be seen that the higher convergence precision is obtained in a short time.
4. Results and Discussion
In this study, optimization is conducted for T-100 and T-100re turbine, respectively.
For T-100 turbine: (1) an accurate aerodynamic optimization for the nozzle is conducted firstly; and (2) an accurate multidisciplinary optimization for the rotor is then performed.
For T-100re turbine: (1) an automated GA-driven preliminary design based on T-100 design parameters was conducted firstly [20], (2) a metamodel-assisted aerodynamic optimization for the nozzle is then performed, and (3) an accurate multidisciplinary optimization for the rotor is conducted finally.
4.1. Nozzle Optimization Results
The T-100 nozzle optimization has evolved for 34 generations and 1020 CFD calculations are performed. The optimal solution has an increase in total-to-static efficiency () by 0.1% and a decrease in total pressure loss () by 0.3%, compared with the T-100 baseline design. The change of the mass flow rate (m) is less than 0.01% which is acceptable. Figure 8 and Table 2 show the comparison between the baseline design and the optimal design. It can be seen that the improvement is very small because the T-100 turbine is a well-developed design itself.
The T-100re nozzle optimization has evolved 30 iterations, and 600 CFD computations are involved. Though the CFD computational cost is lower than the simple accurate optimization, the ANN training time becomes longer as the database grows, and the training time even exceeds the CFD computation time at the later stage of the optimization. In general, the final cost of the metamodel-assisted optimization is nearly the same as the T-100 accurate optimization. Therefore, the rotor optimization will not use a metamodel anymore.
However, the present metamodel training strategy does result in high precision ANN. Figure 9 shows the mean relative error of the ANN prediction and it can be seen that the error level is adequate to provide a high precision prediction. The computational cost of the present work is not high itself, therefore it is not cost-effective to use this GA-optimized ANN in this situation, but it is still useful for large-scale computational cases.
The optimal solution of T-100re nozzle optimization has an increase in total-to-static efficiency by 0.1% and a decrease in total pressure loss by 5.4%, compared with the T-100re baseline design. The change in the mass flow rate is less than 0.01%. Figure 10 shows the comparison of T-100re nozzle profiles between the baseline and the optimized. From Table 2, it can be seen that the total-to-static efficiency increases by 1%, which is the same as the growth after the preliminary design optimization in Part I [20]. Both designs are improved after the nozzle aerodynamic optimization.
4.2. Rotor Optimization Results
Both T-100 rotor optimization and T-100re rotor optimization evolved for 35 generations and took nine days on a workstation with two CPUs (main frequency 2.4 GHz, total 16 compute cores). A single evaluation including CFD and CSM analysis took approximately 25 min. Table 3 shows the performance at every design stage for comparison. It can be seen that the increase of the total-to-static efficiency achieved in the rotor optimization for T-100 and T-100re turbine are 0.7% and 1.2%, respectively. Comparing T-100re optimized design with T-100 baseline design, the total-to-static efficiency has been increased by 2.2%.
According to Table 3, T-100 rotor weighs 1.31 kg after the preliminary design, and 1.12 kg after the rotor optimization, so 14.5% of the weight is cut down. The T-100re rotor weighs 0.96 kg after the preliminary design, and 0.82 kg after the rotor optimization, so 14.6% of the weight is cut down. Comparing T-100re optimized design with T-100 baseline design again, the rotor weight decreases by 0.49 kg (37.4%). Both rotors are available regarding the stress level.
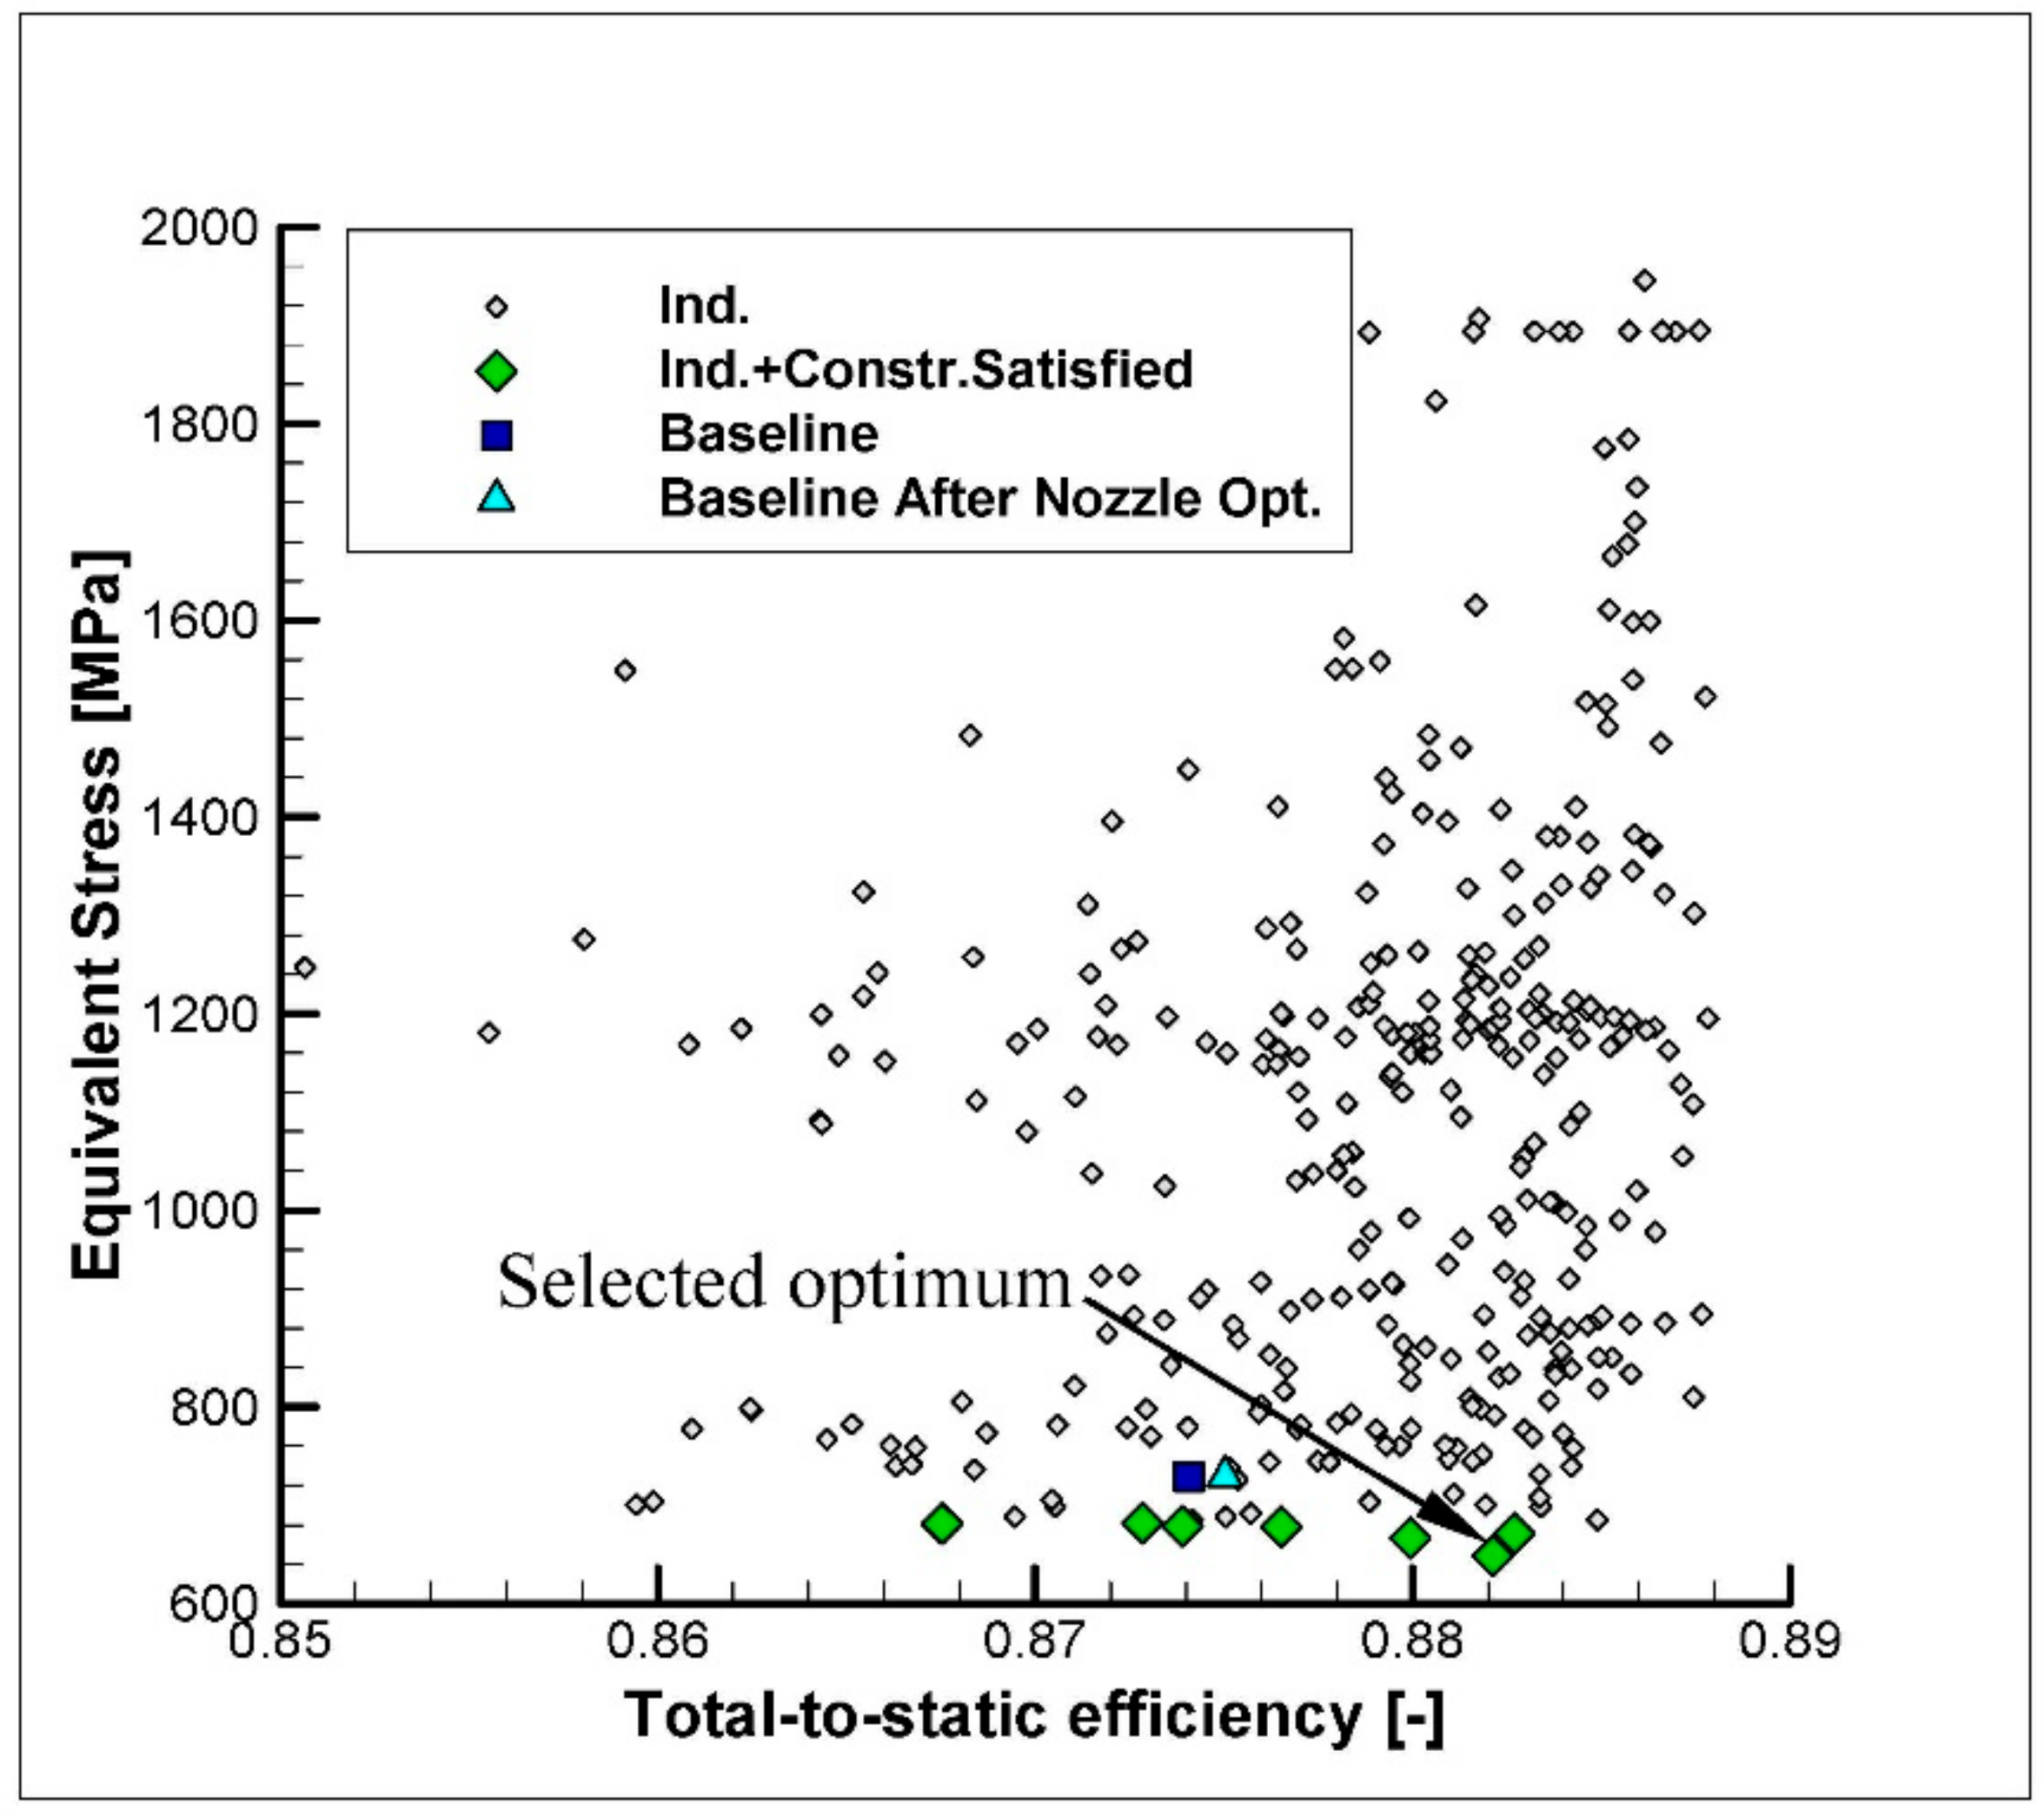
Figure 11 shows the 2-D objective space obtained from T-100 rotor optimization after 35 generations. Each symbol represents a radial turbine design which has been analyzed successfully by the CFD and CSM solver as the rotor optimization adopts the accurate optimization strategy. The designs that satisfy all constraints are indicated with a green color, the baseline design from the very beginning is presented by a blue square, and the baseline design after the nozzle optimization is by a light blue delta. It can be seen that most designs were generated with a higher total-to-static efficiency and a lower weight compared to the baseline design.
However, most designs violate the equivalent stress constraint (Figure 12), the apparent Pareto front towards the lower left-hand corner in Figure 11 can be considered as the pure aerodynamic Pareto optimal solutions. Only seven individuals satisfy all constraints, which also demonstrates the highly conflicting relationship between the total-to-static efficiency and the equivalent stress. In the constraint-satisfied solutions, the four individuals generated in the early phase of the optimization (Gen 3~9 in Figure 11) are not competitive, so only the three individuals generated in the later phase (Gen 21~28) can be considered as the optimal solutions.
In T-100 rotor optimization, the individual from Gen 22 is selected as the best trade-off solution (selected optimum), because it has the lowest weight (1.12 kg), the lowest stress (649 MPa), and higher efficiency of 88.2%, which is quite close to the best achieved (88.3% at Gen 28). The total-to-static efficiency increases by 0.7%, and the rotor weight decreases by 14.5%. The maximum stress is lower than the maximum allowable stress (684 MPa), and the change of mass flow rate is 0.13%, which is acceptable.
Figure 13 and Figure 14 show the 2-D objective space obtained from T-100re rotor optimization. It can be seen from Figure 14 that most individuals violate the equivalent stress constraint too, so the apparent Pareto front cannot be considered as trade-off solutions. Actually, there are 19 individuals satisfying all the constraints, which are indicated in green color in Figure 13. The best trade-off solution is selected from Gen 30 (selected optimum). The optimal rotor weighs 0.82 kg (reduced by 14.2%), generates a maximum stress of 676 MPa (lower than the maximum allowable stress), achieves a total-to-static efficiency of 89.6% (increased by 1.2%) and changes the mass flow rate less than 0.3%.
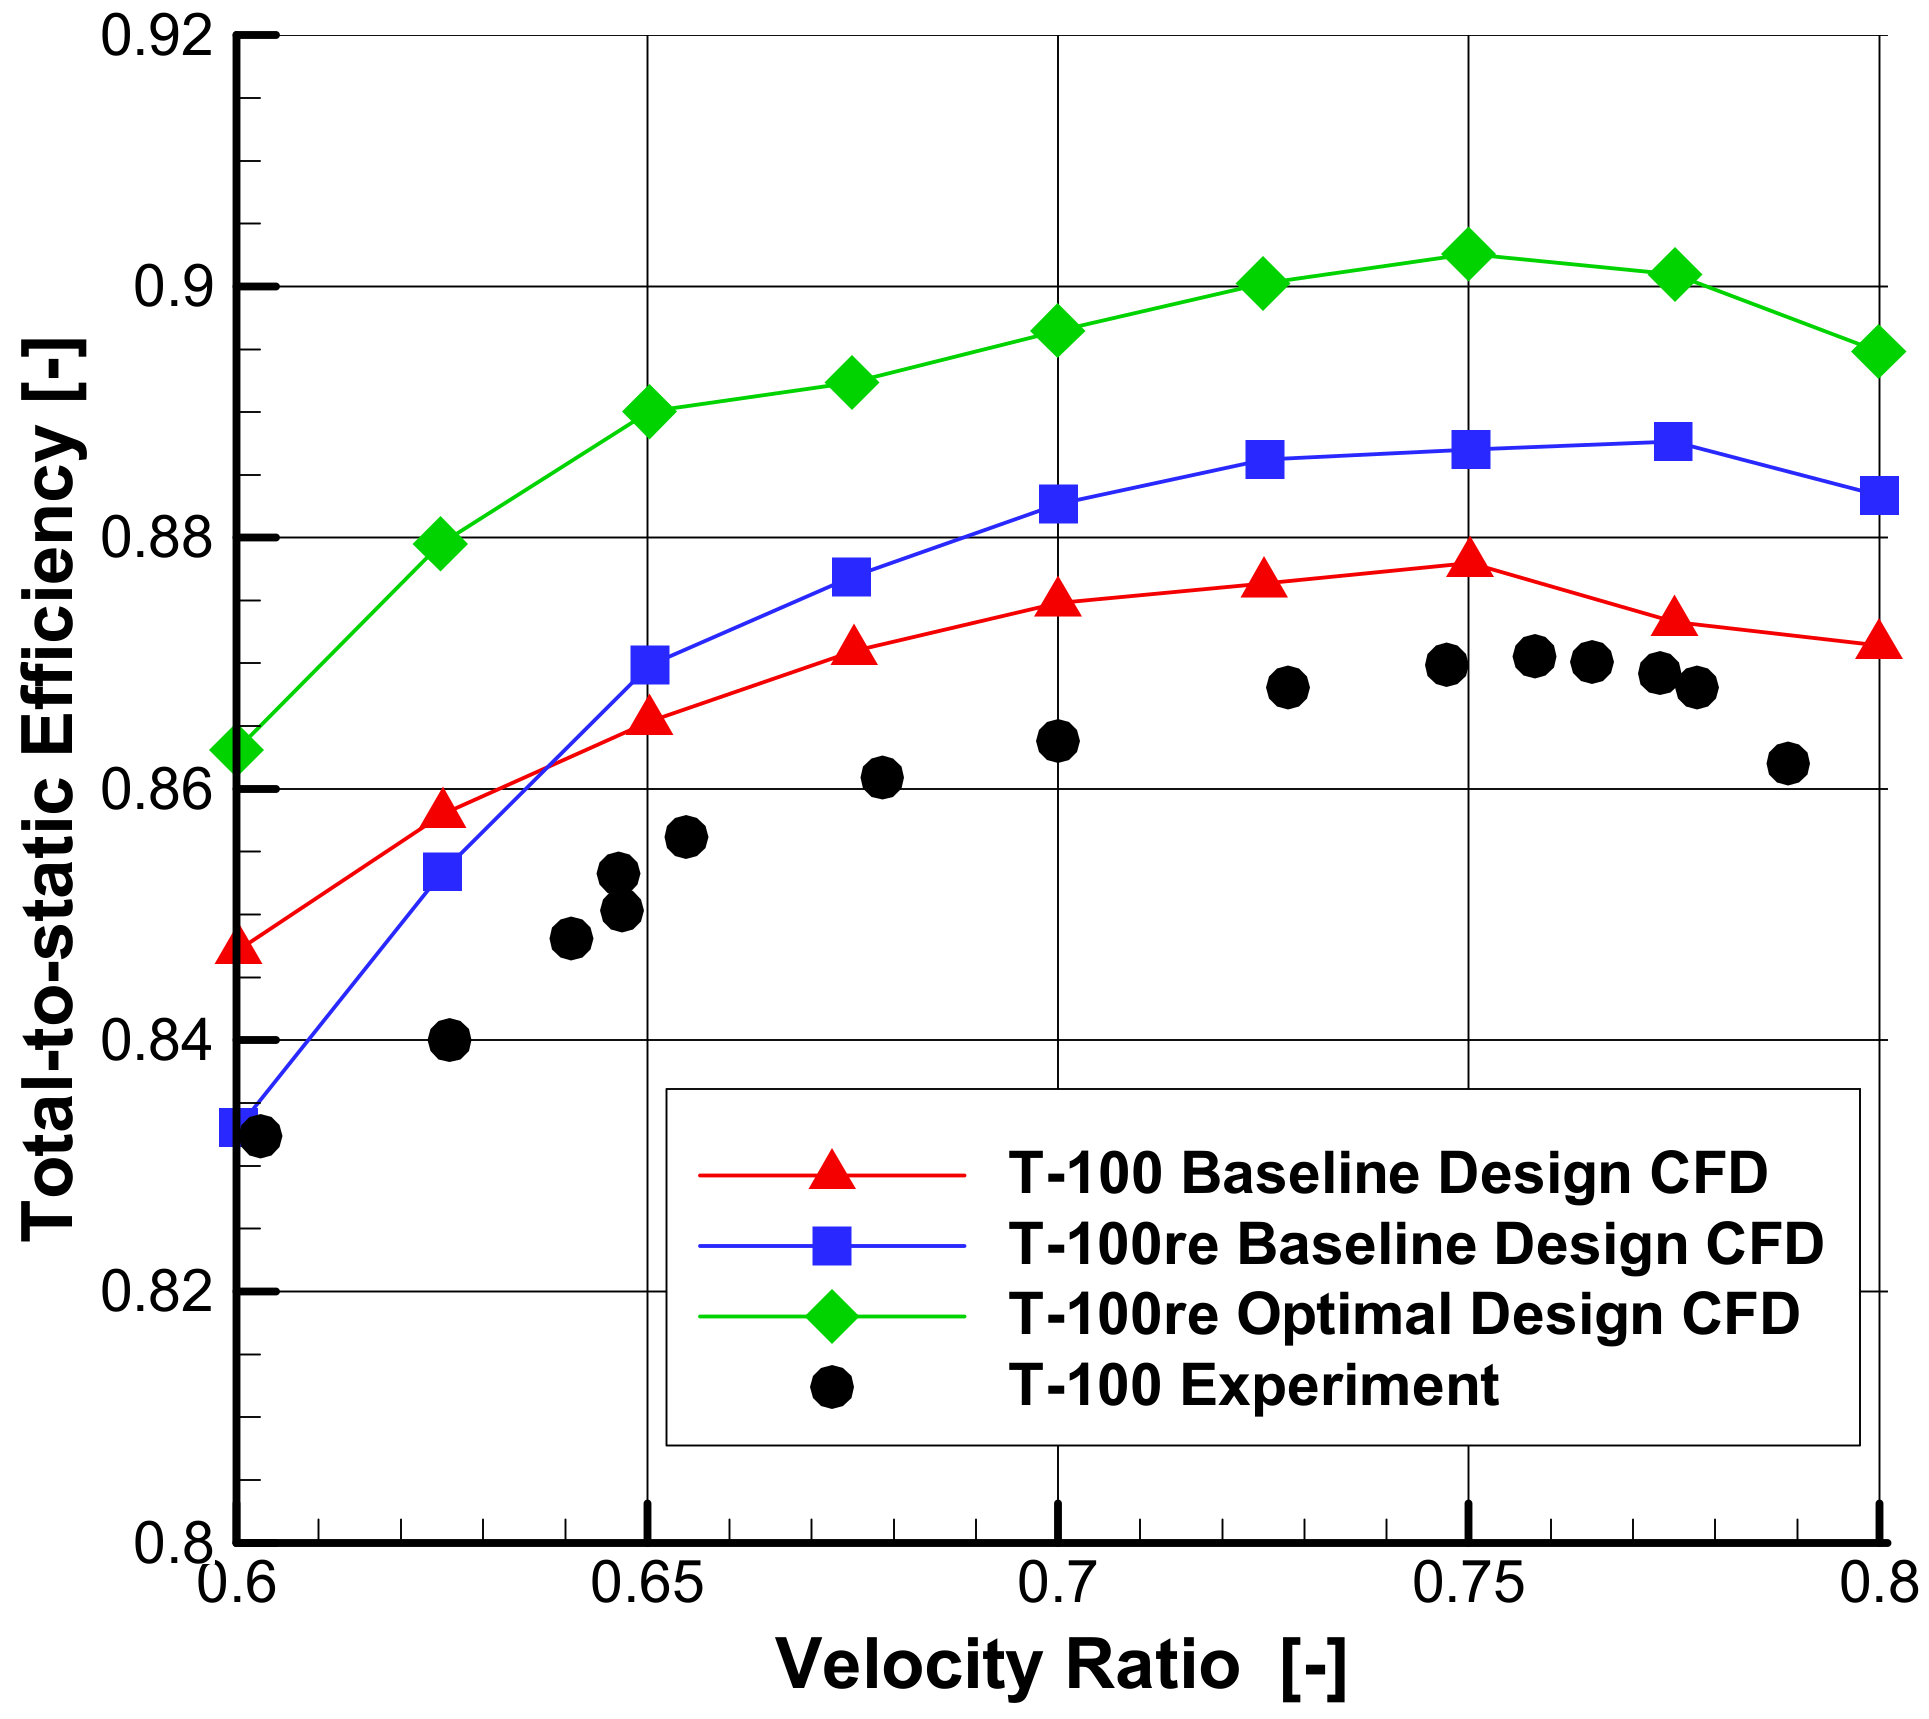
Figure 15 shows the performance map under a range of velocity ratios. It can be seen that T-100re optimal design show better performance under all conditions. In the rotor parameterization, very small variation range is specified for the first three control points of the beta-angle distribution on the hub, mid, and tip sections in order to avoid performance deterioration under the off-design condition, and it is proved to be effective. Therefore, there is no need to conduct multipoint optimization for the rotor.
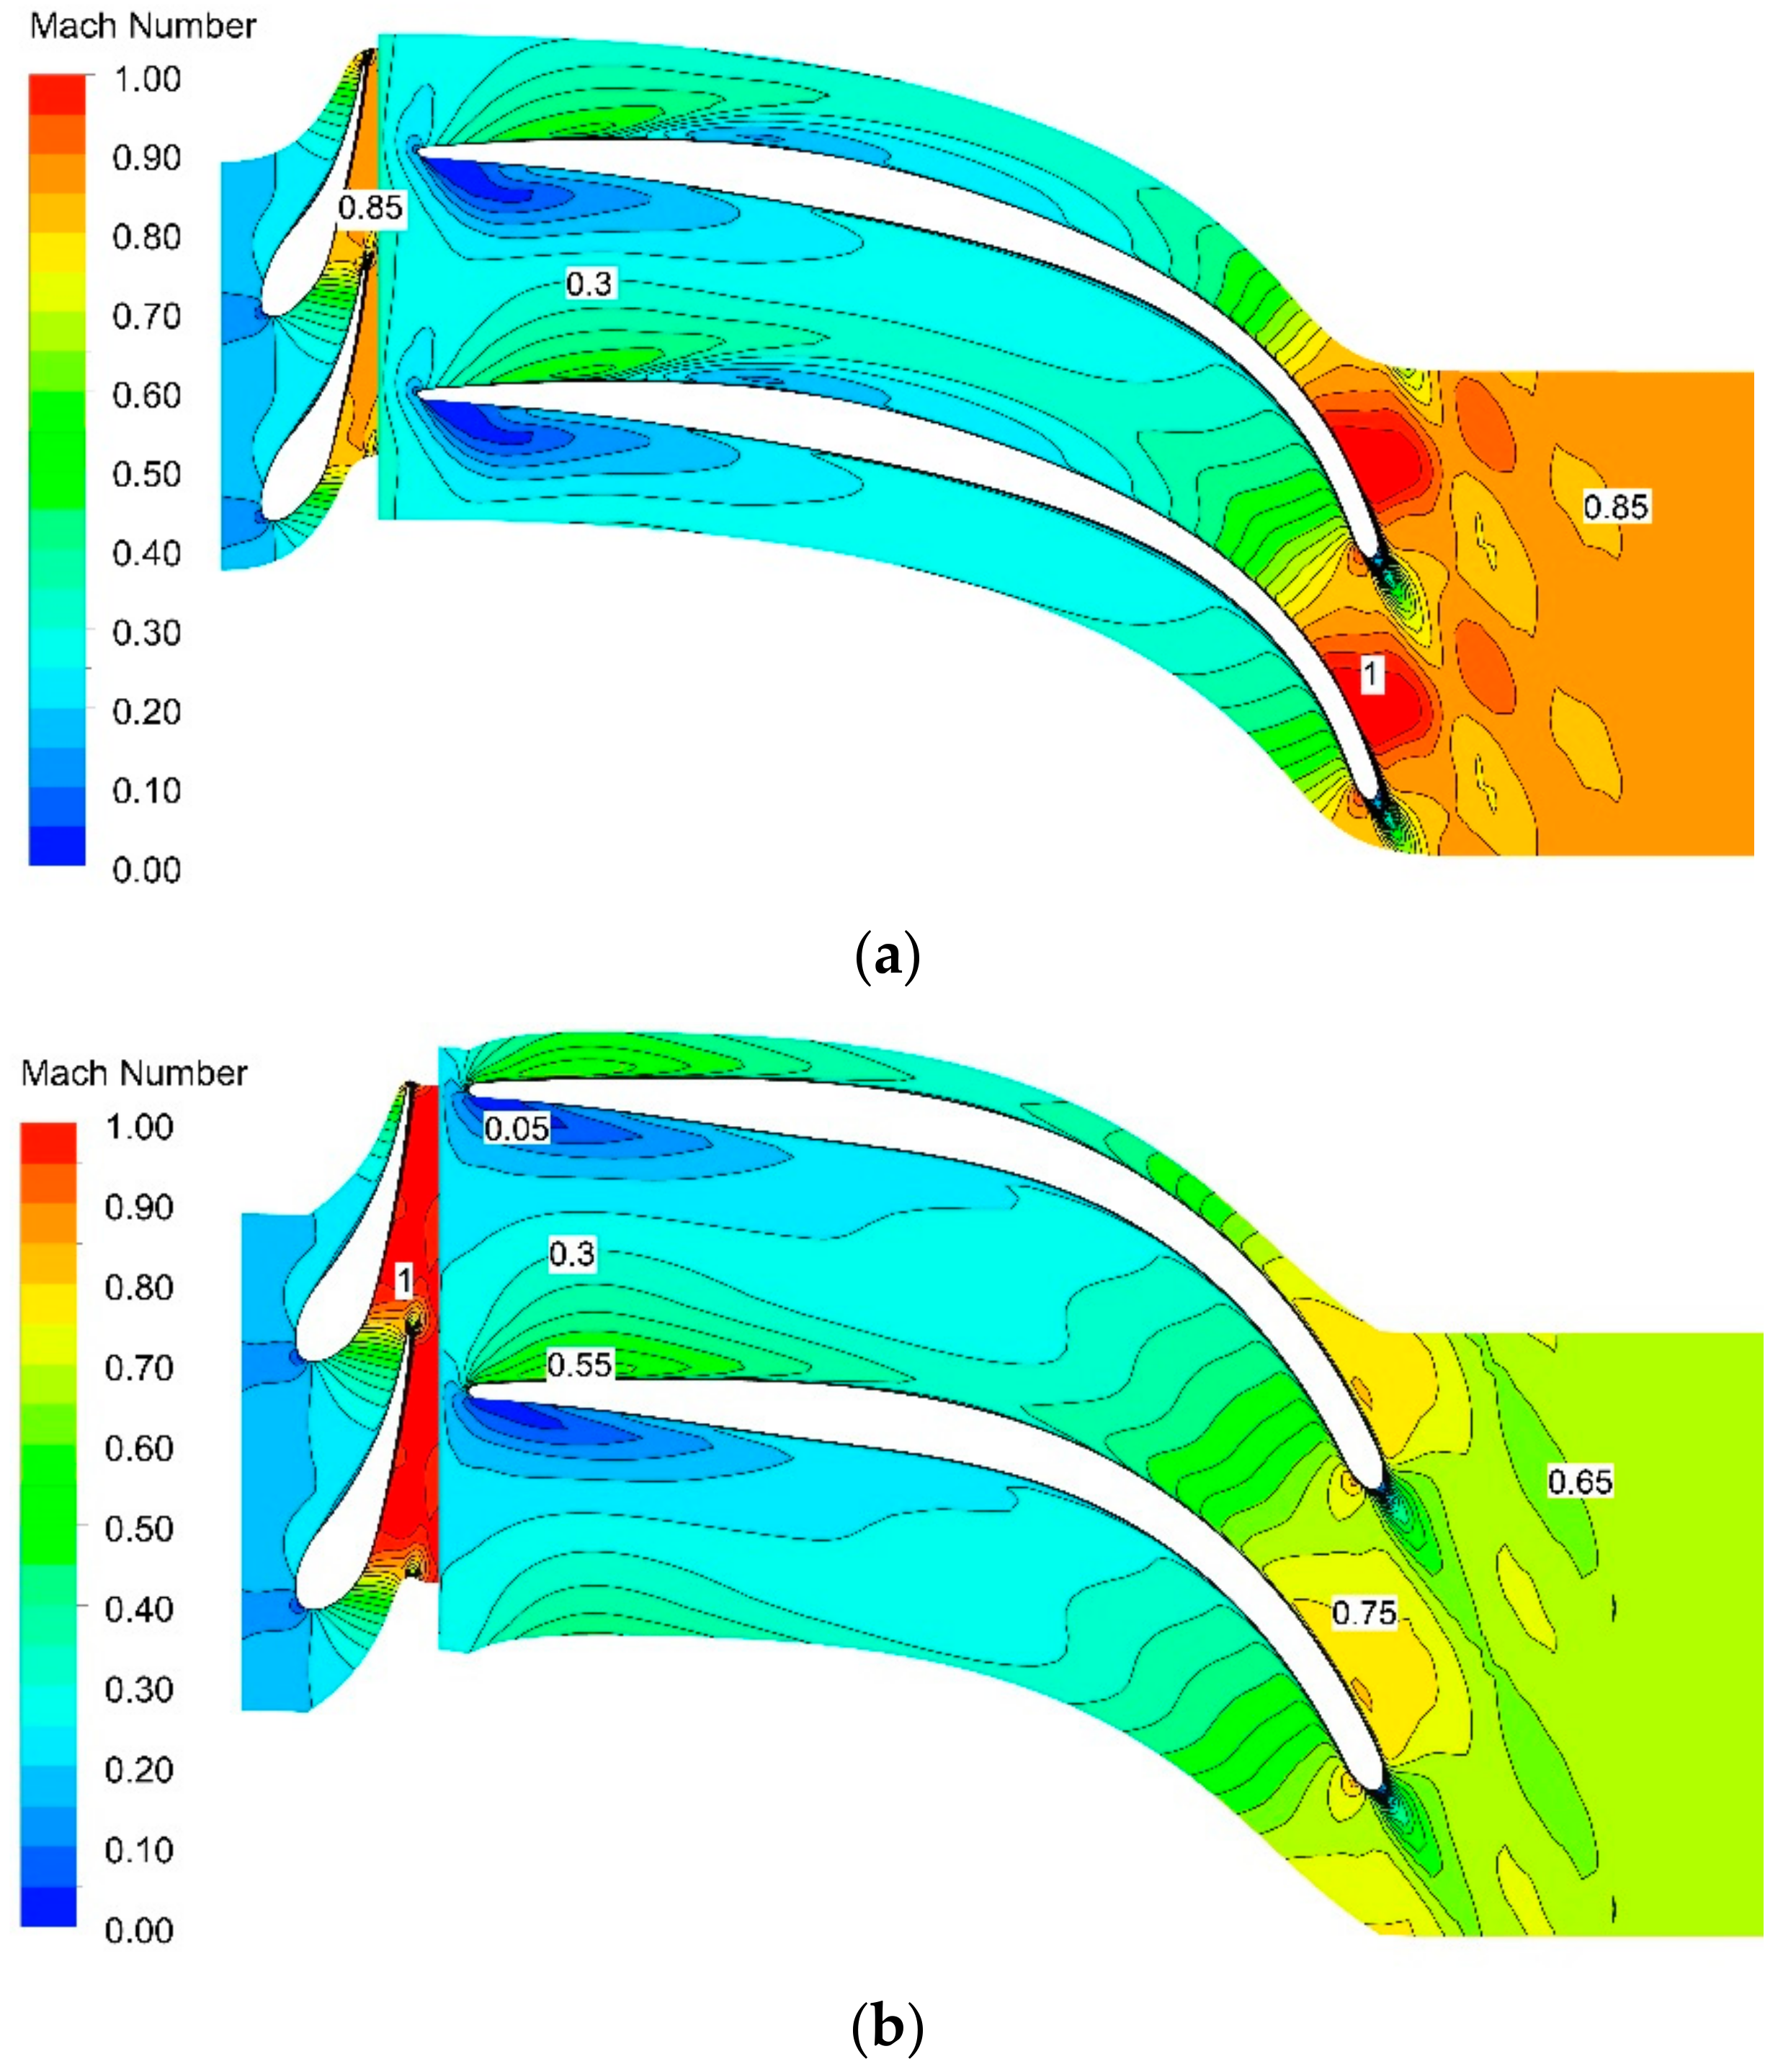
Figure 16 shows the comparison of Mach number contours between the original T-100 turbine and the optimal T-100re turbine at mid-span section under design condition. At the outlet of the nozzle, the Mach number of T-100 turbine is lower than that of the T-100re turbine, while it is adverse at the outlet of the rotor. It is indicated that the enthalpy drop of the T-100re turbine in the nozzle and the rotor is well redistributed after 3-D optimization, and the range of lower Mach number in the rotor passage is reduced because of its higher rotational speed and reasonable rotor geometry. In addition, the absolute outlet velocity of the T-100re turbine is 216.38 m/s, lower than that of T-100 turbine, 167.24 m/s, so the total-to-static efficiency of the turbine is improved.
4.2.1. Meridional Optimization Results
Figure 17 and Figure 18 show the change of meridional contours after the rotor optimization. It can be seen that both optimized rotors have a thinner backplate and a larger trailing edge height which has a backward axial sweep. The thinner backplate contributes the most to reduce the rotor weight. The lower hub contour benefits the rotor weight also, but at the risk of higher stress. The backward axial swept trailing edge also reduces the rotor weight a little, but most importantly it lowers the centrifugal force concentrating on the outlet hub region. Figure 19 shows the comparison of meridional contours between T-100 baseline and T-100re optimized design. It can be seen that T-100re optimized design is much more compact.
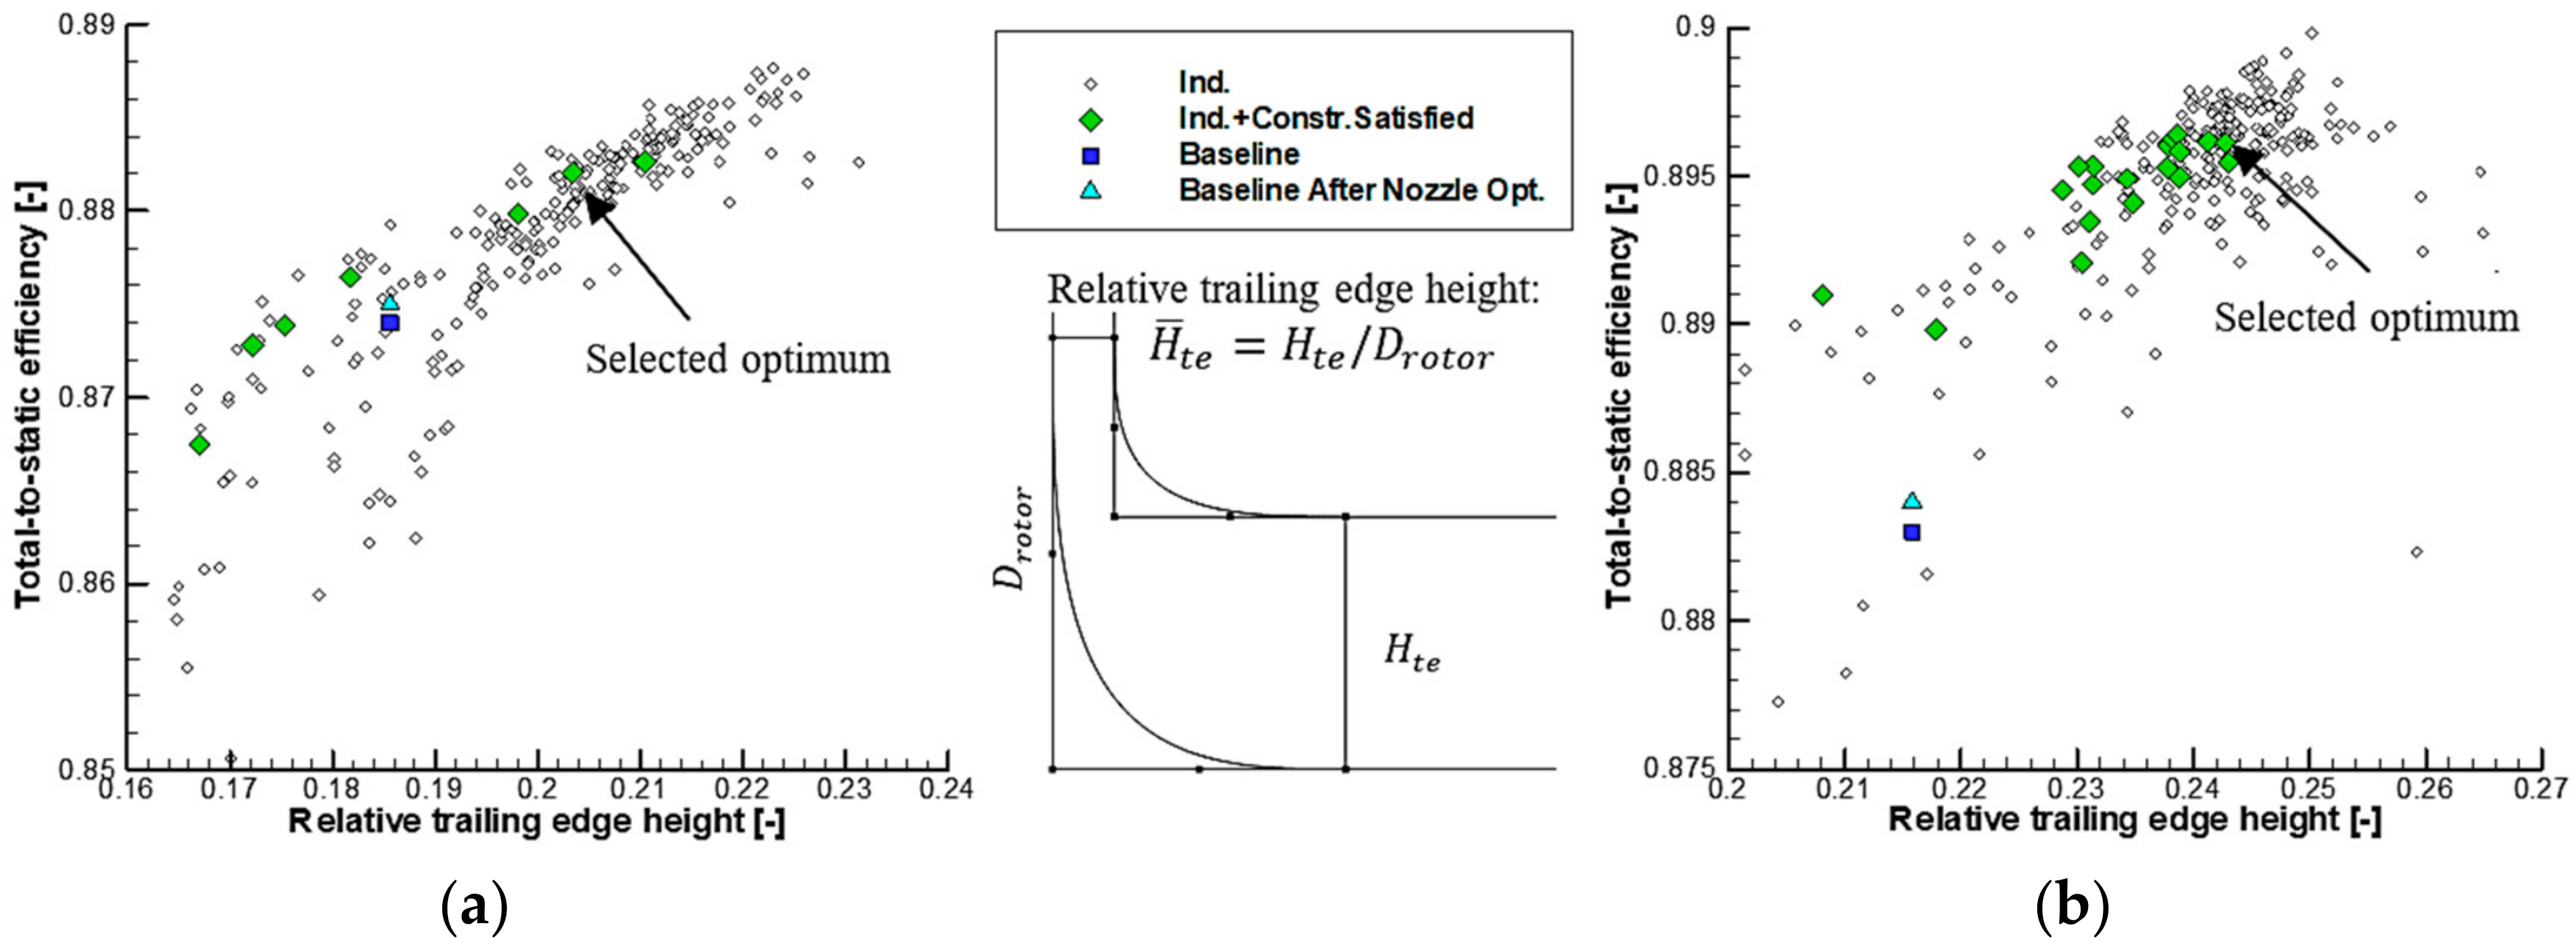
Figure 20 shows the total-to-static efficiency alone with the relative trailing edge height. It indicates that the larger trailing edge height could improve the aerodynamic performance of the radial inflow turbine, but most individuals violate the stress constraint. Figure 21 shows the equivalent stress with respect to the sweep direction. It can be seen that backward axial sweep benefits the stress for both T-100 and T-100re rotor, which reveals that the centrifugal force concentrating on the hub region decreases due to the axial sweep of the trailing edge at the tip. The conflicted relationship between aerodynamic performance and centrifugal force is especially true in this area, so higher trailing edge height with backward axial sweep becomes a trade-off solution between these two aspects.
4.2.2. Blade Angle Optimization Results
The blade angle (beta-angle) distribution does not affect the rotor weight too much, but does affect the aerodynamic performance and the stress level. In this study, the blade angle distributions at three sections (hub, middle, and tip) are optimized. The last beta-angle () on each section indicates the blade turning, which correlates to the aerodynamic performance. Figure 22 shows the total-to-static efficiency with respect to the last trailing edge beta-angle at the hub, middle, and tip sections. It can be seen that promising designs tend to have a bigger blade turning at each section for both T-100 and T-100re rotor, and the trend is more obvious at the middle and tip sections of T-100re rotor. The label of the horizontal axis in Figure 22 indicates the variation range specified for . It can be seen that the range specified for at each section is sufficient because no concentration happens on two sides.
4.2.3. Blade Thickness Optimization Results
Figure 23a shows the blade thickness distribution at hub section for T-100 rotor. It can be seen that the peak value of T-100 thickness is larger than the baseline design, and the location moves backward. The new thickness distribution results in a reasonable maximum stress of 649 MPa, as indicated in Figure 24a.
It can be seen from Figure 23b that the peak value of T-100re thickness is smaller than that of the baseline design, and the location also moves backward. The maximum stress in Figure 24b is larger than that of T-100 optimal design because of higher rotational speed, but still lower than the allowable value. A high-stress zone indicated by a red circle in Figure 24b appears on the suction surface near the rotor outlet just under the mid-span. This is due to the high blade turning on the mid and tip sections. It means this area is exposed under bending force which is also a reflection of the conflicting relationship between aerodynamics and stress.
5. Conclusions
This study presents an integrated design and optimization approach for radial inflow turbines and it is applied to the redesign of T-100 turbine in the Sundstrand Power Systems T-100 Multipurpose Small Power Unit. In this paper, as Part II, a flexible 3-D multidisciplinary optimization system is developed. Both nozzle aerodynamic optimization and rotor multidisciplinary optimization are performed using the present approach for T-100 and T-100re turbines, respectively. Higher total-to-static efficiency and lighter rotor weight are pursued in the whole process. From the above study, the mainly following conclusions can be drawn:
- (1)
- Preliminary design plays a critical role in the design process of radial inflow turbines. Therefore, it is necessary to carry out an automated preliminary design and optimization for making a good foundation. In the present work, the total-to-static efficiency increases by 2.2%, and the rotor weight decreases by 0.49 kg (37.3%), comparing with that only conducting 3-D optimization on the T-100 baseline design. The centrifugal stress is constrained at the allowable level.
- (2)
- Large trailing edge height results in an improved efficiency, but does deteriorate the stress condition. Backward sweep trailing edge lowers the stress level, which compensates for the negative effect of trailing edge enlargement. Large blade turning at the middle and tip sections improve the efficiency, but moves the high-stress zone toward blade mid-span on the suction surface, which adds extra bending forces. In general, the stress level can be controlled through blade thickness and blade angle adjustment.
- (3)
- In the design process of radial inflow turbines, some key parameters like the blade number, rotor inlet diameter, and blade height can be easily optimized in the preliminary design stage using some correlations, while some local geometry parameters cannot be adjusted here and only be optimized subsequently in the 3-D design stage. Therefore, an integrated design optimization approach can be established by combining the automated preliminary design module and the 3-D multidisciplinary optimization module.
Author Contributions
Conceptualization, Q.D.; Methodology, Q.D. and S.S.; Software, L.F. and H.L; Writing-Original Draft Preparation, S.S.; Writing-Review & Editing, Q.D. and Z.F.
Funding
This study is partially supported by the Specialized Research Fund for the Doctoral Program of Higher Education of China (Grant No. 20130201130005).
Conflicts of Interest
The authors declare no conflict of interest.
References
- Chahine, C.; Seume, J.R.; Verstraete, T. The influence of metamodeling techniques on the multidisciplinary design optimization of a radial compressor impeller. In Proceedings of the ASME Turbo Expo 2012, Copenhagen, Denmark, 11–15 June 2012. [Google Scholar]
- Shao, S.; Deng, Q.H.; Feng, Z.P. Aerodynamic optimization of the radial inflow turbine for a 100kW-class micro gas turbine based on metamodel-semi-assisted method. In Proceedings of the ASME Turbo Expo 2013, San Antonio, TX, USA, 3–7 June 2013. [Google Scholar]
- Guo, Z.D.; Song, L.M.; Zhou, Z.M.; Li, J.; Feng, Z.P. Aerodynamic analysis and multi-objective optimization design of a high pressure ratio centrifugal impeller. J. Eng. Gas Turbines Power 2015, 137, 092602-14. [Google Scholar] [CrossRef]
- Bonaiuti, D.; Zangeneh, M. On the coupling of inverse design and optimization techniques for the multiobjective, multipoint design of turbomachinery blades. J. Turbomach. 2009, 131, 021014. [Google Scholar] [CrossRef]
- He, L.; Shan, P. Three-dimensional aerodynamic optimization for axial-flow compressors based on the inverse design and the aerodynamic parameters. J. Turbomach. 2011, 134, 031004. [Google Scholar] [CrossRef]
- Fu, L.; Shi, Y.; Deng, Q.H.; Li, H.Z.; Feng, Z.P. Integrated optimization design for a radial turbine wheel of a 100 kW-class microturbine. J. Eng. Gas Turbines Power 2011, 134, 012301. [Google Scholar] [CrossRef]
- Fu, L. Comprehensive Design Method, Internal Flow Characteristics and Experimental Investigation of Micro Radial Turbine with Millimeter-Scale. Ph.D. Thesis, Xi’an Jiaotong University, Xi’an, China, 2011. [Google Scholar]
- Al-Jubori, A.M.; Al-Dadah, R.; Mahmoud, S. Performance enhancement of a small-scale organic Rankine cycle radial-inflow turbine through multi-objective optimization algorithm. Energy 2017, 131, 297–311. [Google Scholar] [CrossRef]
- Verstraete, T.; Alsalihi, Z.; Van den Braembussche, R.A. Multidisciplinary optimization of a radial compressor for micro gas turbine applications. J. Turbomach. 2010, 132, 031004. [Google Scholar] [CrossRef]
- Mueller, L.; Alsalihi, Z.; Verstraete, T. Multidisciplinary optimization of a turbocharger radial turbine. J. Turbomach. 2013, 135, 021022. [Google Scholar] [CrossRef]
- Van den Braembussche, R.A.; Alsalihi, Z.; Verstraete, T.; Matsuo, A.; Ibaraki, S.; Sugimoto, K.; Tomita, I. Multidisciplinary multipoint optimization of a transonic turbocharger compressor. In Proceedings of the ASME Turbo Expo 2012, Copenhagen, Denmark, 11–15 June 2012. [Google Scholar]
- Shao, S. Multidisciplinary Integrated Design and Optimization Method for Radial Inflow Turbines. Ph.D. Thesis, Xi’an Jiaotong University, Xi’an, China, 2015. [Google Scholar]
- Samad, A.; Kim, K.Y.; Goel, T.; Haftka, R.T.; Shyy, W. Shape optimization of turbomachinery blade using multiple surrogate models. In Proceedings of the FEDSM2006, Miami, FL, USA, 17–20 July 2006. [Google Scholar]
- Öksüz, Ö.; Akmandor, İ.S. Multi-objective aerodynamic optimization of axial turbine blades using a novel multilevel genetic algorithm. J. Turbomach. 2010, 132, 041009. [Google Scholar] [CrossRef]
- Ratter, H.; Çağlar, Ş.; Gabi, M. A coupled blade adjustment and response surface method for the optimization of radial fans without housing. In Proceedings of the ASME Turbo Expo 2014, Düsseldorf, Germany, 16–20 June 2014. [Google Scholar]
- Cavazzuti, M. Optimization Methods: From Theory to Design, Scientific and Technological Aspects in Mechanics; Springer: Berlin/Heidelberg, Germany, 2013. [Google Scholar]
- Biancolini, M.E. Fast Radial Basis Functions for Engineering Applications; Springer International Publishing AG: Cham, Switzerland, 2017. [Google Scholar]
- Li, M.; Li, G.; Azarm, S. A kriging metamodel assisted multi-objective genetic algorithm for design optimization. J. Mech. Des. 2008, 130, 031401. [Google Scholar] [CrossRef]
- Cravero, C.; Macelloni, P.; Briasco, G. Three-dimensional design optimization of multistage axial flow turbines using a RSM based approach. In Proceedings of the ASME Turbo Expo 2012, Copenhagen, Denmark, 11–15 June 2012. [Google Scholar]
- Deng, Q.H.; Shao, S.; Fu, L.; Luan, H.F.; Feng, Z.P. An integrated design and optimization approach for radial inflow turbines—Part I: Automated preliminary design. Appl. Sci. 2018. accepted for publication. [Google Scholar]
- Jones, A.C. Design and test of a small, high pressure ratio radial turbine. J. Turbomach. 1996, 118, 362–370. [Google Scholar] [CrossRef]
- Storn, R.; Price, K. Differential evolution—A simple and efficient heuristic for global optimization over continuous spaces. J. Glob. Optim. 1997, 11, 341–359. [Google Scholar] [CrossRef]
- Deb, K.; Pratap, A.; Agarwal, S.; Meyarivan, T. A fast and elitist multiobjective genetic algorithm: NSGA-II. IEEE Trans. Evol. Comput. 2002, 6, 182–197. [Google Scholar] [CrossRef] [Green Version]
Figure 1.
Flowchart of the optimization system. CFD: computational flow dynamics, CSM: computational structural mechanics, NSGA: nondominated sorting genetic algorithm.
Figure 1.
Flowchart of the optimization system. CFD: computational flow dynamics, CSM: computational structural mechanics, NSGA: nondominated sorting genetic algorithm.

Figure 2.
Blade angle definition.

Figure 3.
Blade thickness definition.

Figure 4.
Definition of the meridional contour. (a) Backface profile parameterization; (b) hub and shroud parameterization.
Figure 4.
Definition of the meridional contour. (a) Backface profile parameterization; (b) hub and shroud parameterization.

Figure 5.
Computational mesh of flow simulation. (a) Whole computation domain of flow area; (b) rotor inlet mesh.
Figure 5.
Computational mesh of flow simulation. (a) Whole computation domain of flow area; (b) rotor inlet mesh.

Figure 6.
A Computational mesh of solid simulation.

Figure 7.
Convergence curves of flow simulation.

Figure 8.
Comparison of T-100 nozzle profiles.

Figure 9.
Mean relative error of the ANN prediction. ANN: artificial neural network.

Figure 10.
Comparison of T-100re nozzle profiles.

Figure 11.
Change of rotor weight along with total-to-static efficiency (T-100).

Figure 12.
Change of equivalent stress along with total-to-static efficiency (T-100).

Figure 13.
Change of rotor weight along with total-to-static efficiency (T-100re).

Figure 14.
Change of equivalent stress along with total-to-static efficiency (T-100re).

Figure 15.
Comparison of total-to-static efficiency.

Figure 16.
Comparison of Mach number contour at mid-span section. (a) T-100 turbine (original), (b) T-100re turbine (optimal).
Figure 16.
Comparison of Mach number contour at mid-span section. (a) T-100 turbine (original), (b) T-100re turbine (optimal).

Figure 17.
Meridional contour of the baseline and the optimized design (T-100).

Figure 18.
Meridional contour of baseline and optimized design (T-100re).

Figure 19.
Meridional contour of T-100 baseline and T-100re optimized design.

Figure 20.
Change of blade trailing edge height along with total-to-static efficiency. (a) T-100, (b) T-100re.
Figure 20.
Change of blade trailing edge height along with total-to-static efficiency. (a) T-100, (b) T-100re.

Figure 21.
Change of trailing edge sweep along with equivalent stress. (a) T-100, (b) T-100re.

Figure 22.
Change of total-to-static efficiency along with trailing edge blade angle. (a) T-100, (b) T-100re.
Figure 22.
Change of total-to-static efficiency along with trailing edge blade angle. (a) T-100, (b) T-100re.


Figure 23.
Thickness distribution at hub section. (a) T-100, (b) T-100re.

Figure 24.
Stress of T-100 and T-100re optimized design. (a) T-100 optimized, (b) T-100re optimized.
Figure 24.
Stress of T-100 and T-100re optimized design. (a) T-100 optimized, (b) T-100re optimized.


Table 1.
Design parameters of T-100 turbine and T-100re turbine.
| Items | Unit | Value |
|---|---|---|
| Fluid | [-] | Air |
| Inlet total temperature | [K] | 1056.5 |
| Inlet total pressure | [kPa] | 580.4 |
| Mass flow rate | [kg/s] | 0.33 |
| Number of nozzle vanes | [-] | 19 |
| Number of rotor blades | [-] | 16 |
| Pressure ratio | [-] | 5.73 |
| Power | [kW] | 121 |
| Rotational speed (T-100) | [r/min] | 106,588 |
| Rotational speed (T-100re) | [r/min] | 114,185 |
Table 2.
Performance comparison between T-100 and T-100re turbines after nozzle optimization.
| T-100 | m [kg/s] | [-] | [-] |
|---|---|---|---|
| T-100 baseline | 0.330 | 0.874 | 2.503 |
| T-100 optimized | 0.328 | 0.875 | 2.495 |
| T-100re baseline | 0.329 | 0.883 | 2.814 |
| T-100re optimized | 0.328 | 0.884 | 2.660 |
Table 3.
Performance comparison between T-100 and T-100re turbines after rotor optimization.
| Objectives | Preliminary Design | Nozzle Opt. | Rotor Opt. | |
|---|---|---|---|---|
| Mean Line | CFD | |||
| T-100 [-] | 0.864(exp.) | 0.874 | 0.875 | 0.882 |
| T-100re [-] | 0.874 | 0.883 | 0.884 | 0.896 |
| T-100 [kg] | 1.31 | - | - | 1.12 |
| T-100re [kg] | 0.96 | - | - | 0.82 |
© 2018 by the authors. Licensee MDPI, Basel, Switzerland. This article is an open access article distributed under the terms and conditions of the Creative Commons Attribution (CC BY) license (http://creativecommons.org/licenses/by/4.0/).
Share and Cite
MDPI and ACS Style
Deng, Q.; Shao, S.; Fu, L.; Luan, H.; Feng, Z. An Integrated Design and Optimization Approach for Radial Inflow Turbines—Part II: Multidisciplinary Optimization Design. Appl. Sci. 2018, 8, 2030. https://doi.org/10.3390/app8112030
AMA Style
Deng Q, Shao S, Fu L, Luan H, Feng Z. An Integrated Design and Optimization Approach for Radial Inflow Turbines—Part II: Multidisciplinary Optimization Design. Applied Sciences. 2018; 8(11):2030. https://doi.org/10.3390/app8112030
Chicago/Turabian StyleDeng, Qinghua, Shuai Shao, Lei Fu, Haifeng Luan, and Zhenping Feng. 2018. "An Integrated Design and Optimization Approach for Radial Inflow Turbines—Part II: Multidisciplinary Optimization Design" Applied Sciences 8, no. 11: 2030. https://doi.org/10.3390/app8112030
Note that from the first issue of 2016, this journal uses article numbers instead of page numbers. See further details here.