A Simplified Method to Predict the Heat Release Rate of Industrial Nitrocellulose Materials

1
College of Ocean Science and Engineering, Shanghai Maritime University, Shanghai 201306, China
2
School of the Environment and Safety Engineering, Jiangsu University, Zhenjiang 212013, China
*
Author to whom correspondence should be addressed.
Appl. Sci. 2018, 8(6), 910; https://doi.org/10.3390/app8060910
Submission received: 3 May 2018
/
Revised: 22 May 2018
/
Accepted: 30 May 2018
/
Published: 1 June 2018
(This article belongs to the Section Materials Science and Engineering)
Abstract
:To better understand the fire risk of nitrocellulose (NC) used for the civil industry, the combustion properties of NC-alcohol humectant (isopropanol and ethanol) and -plasticizer (dibutyl phthalate) mixtures were investigated experimentally in this work. Flames with considerable sparks were observed for nitrocellulose-humectant samples, while the nitrocellulose-plasticizer mixture exhibited extremely bright flames without obvious sparks. The flame heights for all the samples were determined from the video record. According to the fundamentals of fire phenomena, a simplified model to predict the heat release rates of current NC samples was developed based on the flame height data. By combining the experiment results by ISO 5660 and stoichiometric equations, the critical parameter is recalculated as 3251, 3228, and 3201 kJ/kg for NC-I, NC-E, and NC-D samples, respectively. Ultimately, the heat release rates predicted by the modified model coincided well with that measured by ISO 5660.
1. Introduction
Nitrocellulose (NC), also called cellulose nitrate, is widely served as an important ingredient in military and civilian industries for the production of explosives, propellants, lacquers, films, and etc. [1,2,3] NC materials prepared from cotton are fluffy white solids, which tend to be spontaneously ignited and deflagrable. They are sensitive to initiation by percussion or electrostatic discharge and can be desensitized by the addition of water or alcohol [4].
Previous studies on NC primarily concentrate upon the effects of nitrogen content [5], moisture [6,7], particle size [3,8,9,10], inorganic salt [11], etc. on its thermal behaviors. The characteristics of morphological behavior [12,13] and spontaneous ignition [14,15] are involved in some references, while the thermal decomposition is one of the most comprehensively concerned topics [1,2,3,5,6,7,9,10,11,13]. This is because thermal analysis by means of DSC, DTA, and TG acts as a crucial point in the kinetic studies of NC, which will help to determine the mechanism of pyrolysis reactions and to calculate the parameters of the Arrhenius equation [5,10,16]. These data are required for energetic materials and their related compounds to be quantified for performance and safety in their manufacture, handling, storage, and application [17,18].
Among the above literature pertaining to NC, there exist some consensuses that the experiments are usually conducted with a very small dose of sample and by virtue of thermal analysis instruments. This might be helpful in determining the thermal instability of NC, but probably not applicable to elaborate the fire property or combustion behavior of NC. On 12 August 2015 (8/12 accident), a catastrophic accident occurred in Tianjin Port in China, causing 165 deaths, 798 injuries, and direct economy loss of about $1 billion [19,20,21]. The direct cause of the accident was identified as the dissipated wetting agents of NC, which results in the thermal runaway and subsequent fires and explosions [19,21], as seen in Figure 1. The perniciousness of industrial NC fires is of great severity, while scarce work is conducted to examine the combustion behavior of NC.
Jessup and Prosen [22] presented the heats of combustion of samples of pure NC from cotton linters and wood pulp via the bomb calorimetric measurements. Zhang et al. [3] employed a digital high-speed photography to measure the burn rates of prepared NC samples with different particle sizes. The effects of pressure and initial fuel temperature on the burning rate of NC-based propellants were also experimentally examined by previous researchers [23,24]. Recently, He and Wei et al. [25,26] attempted to employ ISO 5660 to investigate the combustion properties of NC-alcohol humectant and -dibutyl phthalate (DBP) plasticizer mixtures. The amount of sample used in their tests are quite small, i.e., 1 g and 2 g, filled in a crucible with rectangular area of 10 cm2, which is relatively marginal for evaluating the heat release rate (HRR) of NC. For more practical situations, examinations on the HRR of NC samples with larger scale are of great necessity.
The HRR is so important that it has been described as the single most important variable in fire hazard [27,28]. To quantitatively evaluate the fire load of a NC sample, one available method is to measure the HRR by means of corresponding apparatus, while in most cases, for example the industrial-scale NC fires, the HRR should be predicted via pre-existing calculation model to tell the severity of fire. Considering the intrinsic connection between flame appearance (reflected in flame height ) and HRR , summarized as the correlation of , an attempt is made in this work to establish a simplified model to predict the HRR based on the flame height data of NC. Then, the predicted HRR will compare with the measured HRR by ISO 5600 to seek for further modification. Other fire behaviors of NC samples are also measured and discussed. Three NC samples identical to that in [25,26] are adopted to perform the current experiments.
2. Experimental Setup
Due to the high potential spontaneous ignition of pure NC, some additives, served as humectant or plasticizer, are mixed with it to improve its stability in the process of production, storage, and transportation. Moreover, previous attempts on the measurements of HRR and mass loss rate (MLR) of pure NC met with difficulty due to its deflagration with a combustion duration less than 1 s [25]. Thus, all the NC samples in current study are finished products with annexing agents. Three NC samples will be tested. Two of them are NC with alcohol humectant, i.e., 30 wt % isopropanol (C3H8O, labeled as NC-I) and 30 wt % ethanol (C2H6O, labeled as NC-E), exhibiting as the similar white and soft fibers. The other one is NC with 19.5 wt % dibutyl phthalate (DBP, labeled as NC-D), which is a mixture of NC fiber and plasticizer, compressed together to form into a strip structure. All the samples are commercial products for coating. Before the tests, all the samples are stored in a tightly sealed environment to prevent the evaporation of alcohol humectant or other sample contamination.
The nitrogen content is a key parameter for evaluating the performance of NC, and the thermal stability of NC decreases with increasing nitrogen content [4]. To eliminate this factor, the nitrogen contents of current NC substrates are selected as consistent as possible, i.e., 12%, 11.86%, and 11.96% for NC-I, NC-E, and NC-D, respectively, all of which fall into the range of 11.5–12.2% classified as H-type according to the Chinese standard “Specification for Nitrocellulose of Lacquers” (WJ9028-2005) [29]. Comparative tests on NC-I and NC-E also indicate that the 0.14% difference in nitrogen content could hardly affect the microstructure and thermal behavior of NC [25]. Thus, the effect of nitrogen content on the combustion behavior of NC sample is not the research focus and can be reasonably neglected. It is also worthwhile to note that the chemical stability of NC depends on the removal of all traces of acid in the manufacturing process [4]. The acidity of current NC samples is not larger than 0.04%, and its influence on the combustion process is also unnecessary to be concerned. Additionally, other physical parameters of the additives are presented in Table 1 for further discussion.
The three NC samples are burned in two square steel burners with side lengths (L) of 8 cm and 10 cm, respectively, which are 2 cm in depth and 0.32 cm ± 0.01 cm in wall thickness. For NC-I and NC-E with fiber structures, the samples are filled in the burners to a height of 1 cm from the bottom. The initial weight for the burner with L = 8 cm is 10 g, and correspondingly, to guarantee the consistent bulk density, that for burner with L = 10 cm is 15.63 g, with ±0.2 g variation. For comparison, the NC-D samples with strip structure are also prepared with identical initial weights for the two dimensions. All the information pertaining to experimental configurations is listed in Table 2. The arrangements of the three samples for L = 8 cm are illustrated in Figure 2. Although efforts have been made to arrange the NC samples into the burner to achieve the similar bulk density, there is randomness in the preparation of NC sample due to their irregular fiber and strip structures. Uneven sample surface shown in Figure 2 would lead to some uncertainty of the tests. Thus, all the experimental data used for analysis in current study are the average values over several repeated tests.
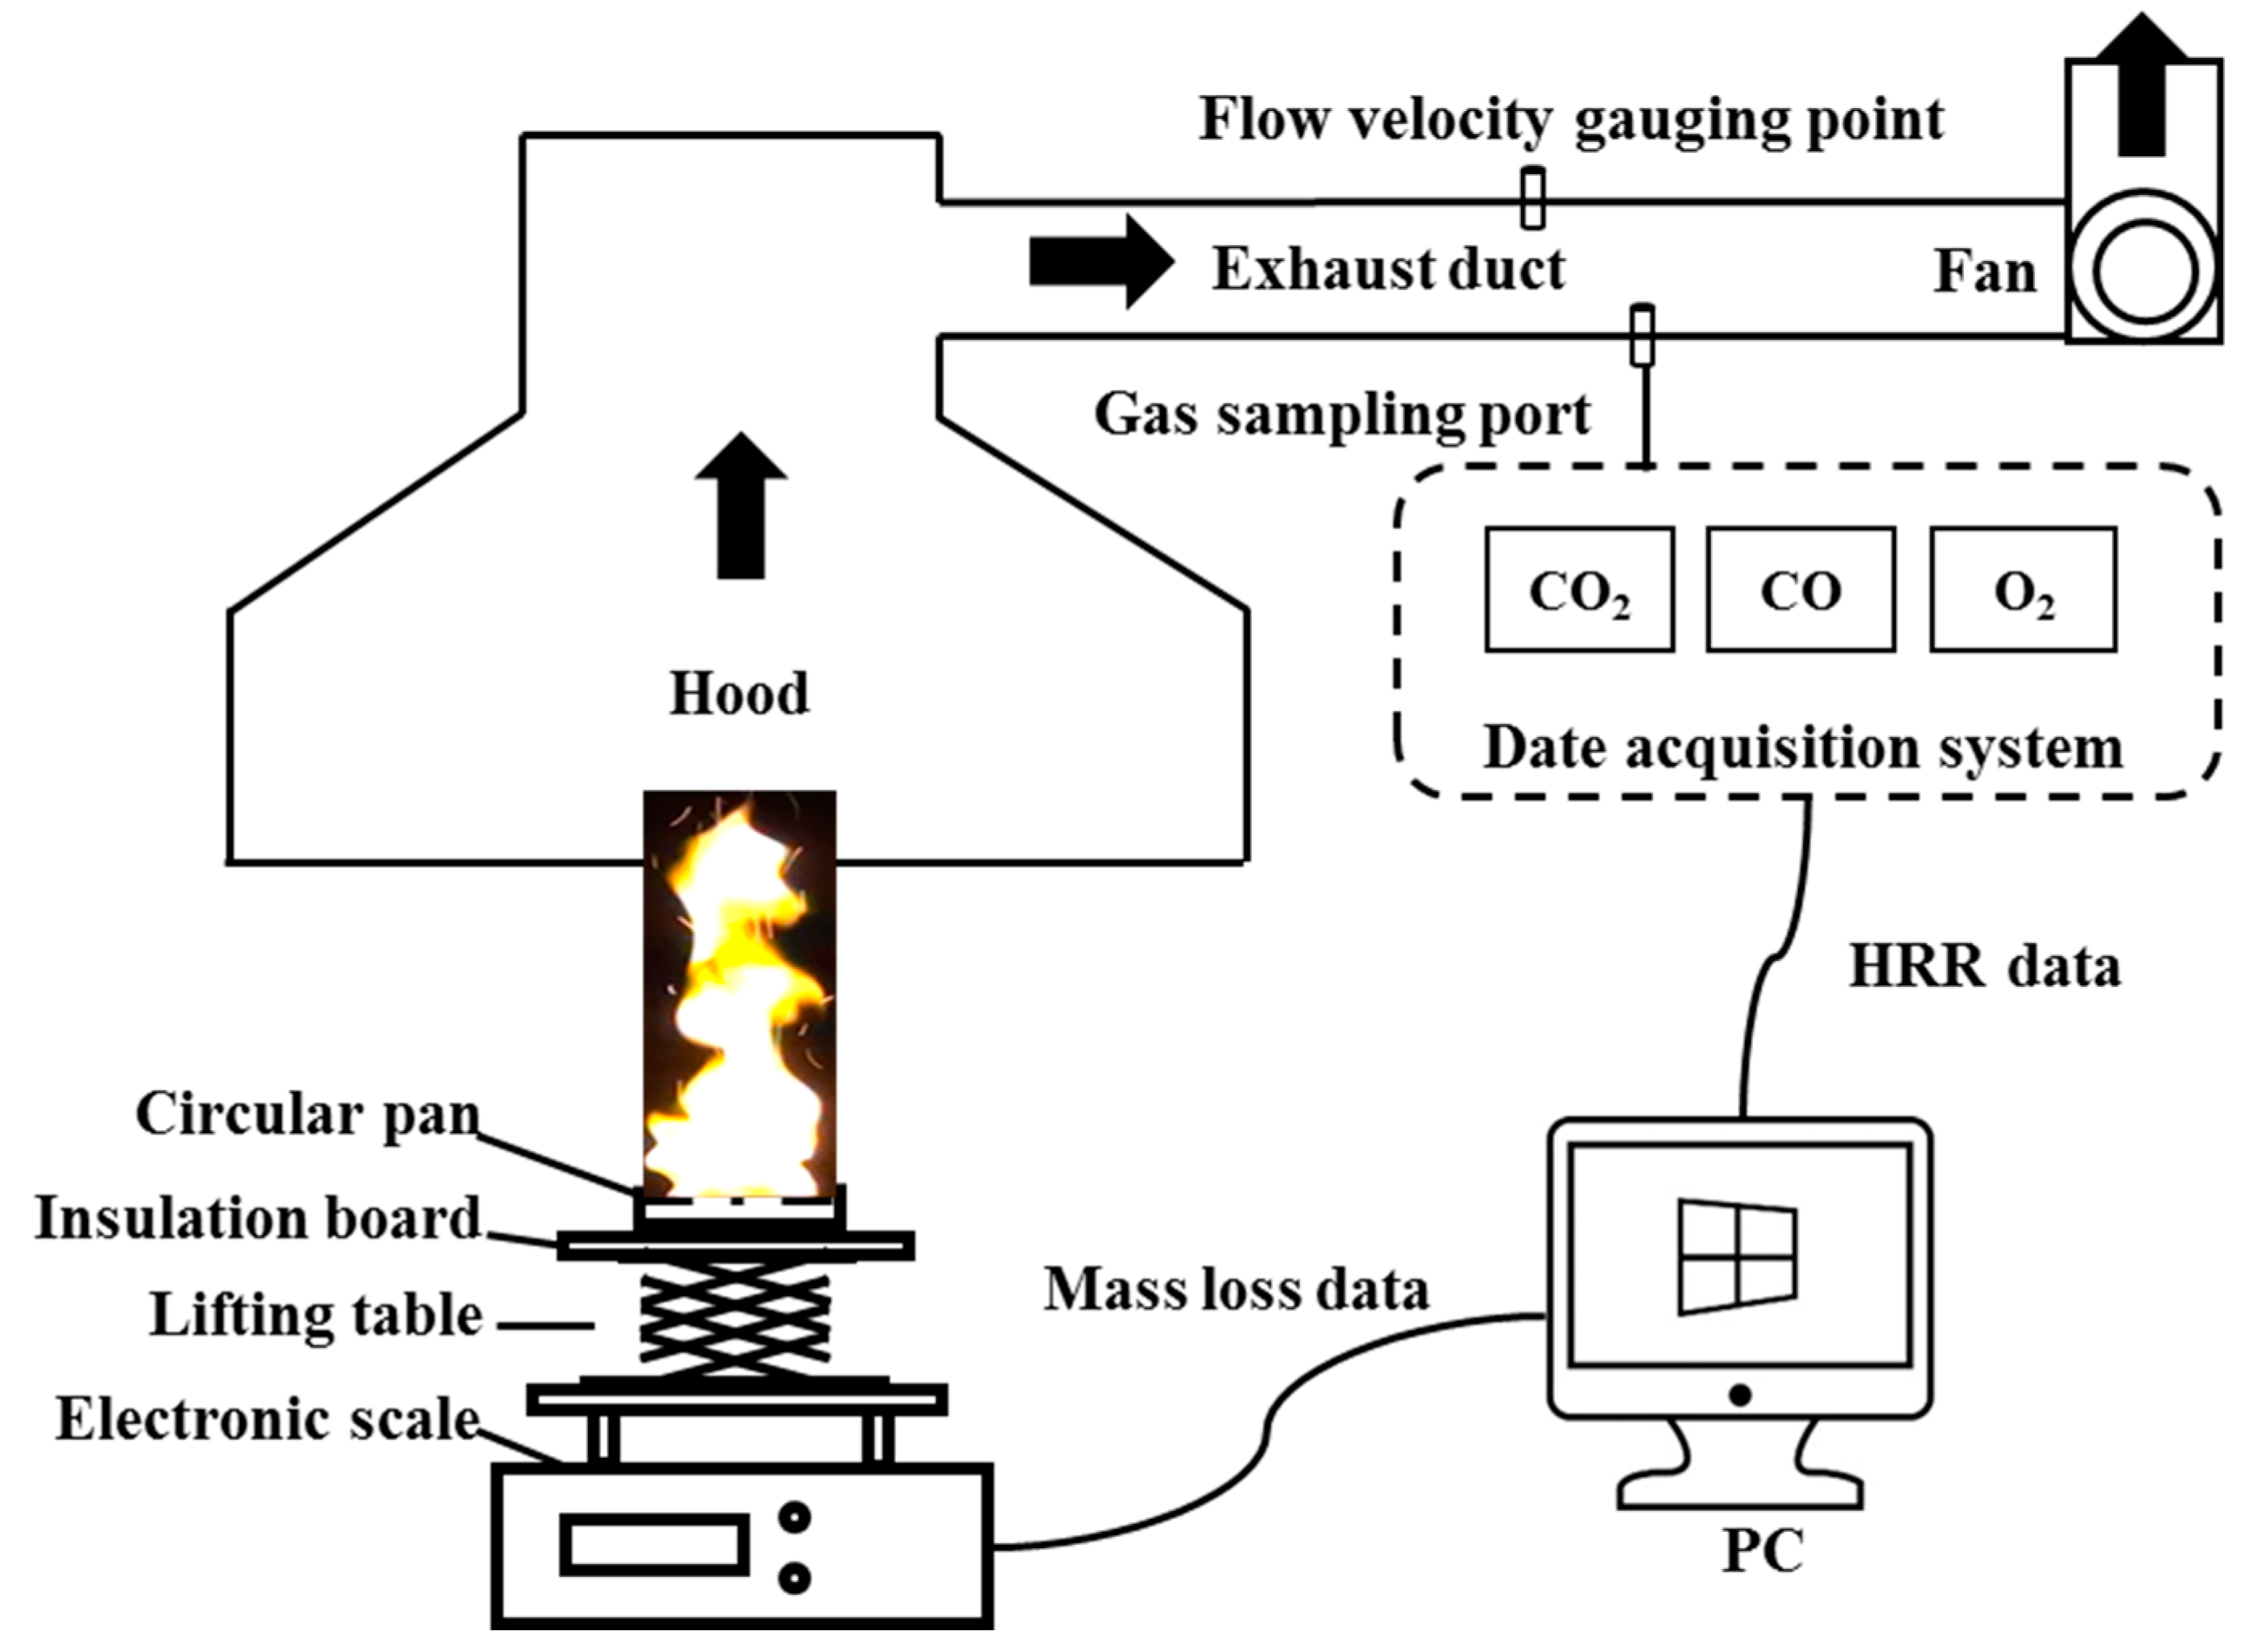
In order to achieve the research goal, the experiments in Table 2 are firstly performed in an open space. An electronic scale (Mettler Toledo XP10002S, Mettler-Toledo, Zurich, Switzerland) with a readability of 0.01 g is used to measure the history of mass loss, which will be further processed to give the MLR. A square insulation board with 20 cm side is placed beneath the burner to shield the electronic scale from elevated temperature. A 25-fps high-resolution camera (Sony, HDR-XR160E) is employed to record the whole burning process for acquiring the flame height data. Then, the experiments above will be retested by means of the ISO 5660 to acquire the HRR data with the absence of incident radiation, as illustrated in Figure 3. The ventilation conditions are determined by the airflow speed of the pump. A volumetric flow rate of 0.035 m3/s is set to remove gases by the pump which meets the ventilation efficiency stipulated in ISO 5660 standard [31,32]. The gases are continuously sampled via a Servomex 4100 gas analyzer (Servomex Group Limited, Surrey, UK) to monitor the concentrations of O2, CO2, and CO, which will be transferred to the PC to calculate the HRR based on the oxygen consumption principle. For all the tests, the samples are ignited in the middle of the burner with a butane lighter.
3. Results and Discussion
3.1. General Observations
Figure 4 presents three groups of instantaneous flame images for NC-I, NC-E, and NC-D (L = 8 cm), respectively, at typical moments (50th, 150th, 250th, 450th, and 650th frame) after ignition. The flocculent NC-I and NC-E samples exhibit similar combustion behaviors, which are significantly different from NC-D with strip structure. Preliminary comparative research on NC-I and NC-E has revealed that the alcohol humectants barely affect the physical microstructure and thermal decomposition of NC substrate [25]. The alcohol additives improve the stability of pure NC, resulting in an attenuated combustion process instead of a violent deflagration. As observed in Figure 4a,b, the flames rapidly cover the whole exposed surface of NC samples in less than 2 s, and then evolve into a relatively stable combustion, followed by a decay process with the decreasing burning area. Additionally, the flames appear to be faintly yellow, accompanied by considerable luminous rising sparks. In contrast, the flame of NC-D sample spreads over the burner surface more slowly within 6–10 s. The combustion proceeds with glaring white flames, and sparks can scarcely be observed, as shown in Figure 4c.
During the combustion, the surface of the NC melts or decomposes at the front edge of the flame, producing combustible vapors. In the case of the alcohol additives, the disruptive combustion might occur, leading to release of the sparks. This results from the formation of bubbles of alcohol vaporizing in the molten NC which bursts, causing little droplets of NC to form and burn to form sparks. However, it does not happen with the higher boiling point plasticizer which evaporates to form the yellow sooty flame. The effect of disruptive burning is well known in heavy fuel oil combustion containing water or alcohol [33,34], which might be helpful in understanding the flame appearances of NC samples in Figure 4.
3.2. Flame Height
To quantitatively evaluate the flame appearances of the three NC samples, the MATLAB-based binarization method developed by Hu et al. [35] is employed to acquire the flame height data in current study. Be more specified, the video records are firstly converted into gray images frame by frame, and then binarized to obtain flame envelopes. The flame heights of the three samples with L = 8 cm during the whole combustion process are plotted in Figure 5 together with their corresponding histories of MLR. Previous research demonstrates that the flame height can be correlated with the 2/5 power of HRR or MLR [36,37]. Thus, the variation range of flame height is not as much as that of MLR, as shown in Figure 5.
In a very short time after ignition, MLR curves of NC-I and NC-E rapidly reach to a plateau, reflecting as the relatively stable combustion illustrated in Figure 4, which is defined as quasi-steady burning stage for further discussion. Meanwhile, it should be noticed that the flame heights in Figure 5 are remarkably decentralized, i.e., the flame heights exhibit regular and reproducible intense oscillations. The flame oscillation frequency, f, can be roughly estimated as 1.5D−1/2, where D is the hydraulic diameter of the burner [38]. Hence, the oscillation frequencies for L = 8 cm and 10 cm pool dimensions in the current study are 4.99 and 4.46 Hz, respectively. The luminous time-sequenced images are analyzed via a fast Fourier transform method to obtain the oscillation frequency, and the ultimate results in the quasi-steady burning stage are listed in Table 3, all of which are close to the predicted values, indicating that the current image recording speed is acceptable.
To further assess the oscillation amplitudes of flame heights, the flame oscillation intensity, , defined as the ratio of the half of difference between the highest () and lowest () heights to the mean flame length (), is introduced here, i.e., [39]. For the convenience of comparison, only the results in the quasi-steady burning stage are calculated for NC-I and NC-E, and the flame heights in the vicinity of maximum MLR (±2 s) are also used to give the values of f, , and for NC-D. As presented in Table 3, values for NC-I and NC-E are in close proximity to each other, regardless of the pool dimensions, while they are distinctly larger than that for NC-D, indicating that the flocculent NC samples with alcohol humectants exhibit more drastic flame oscillation amplitude than NC-D with strip structure. In spite of that, values for current NC samples are still larger than that for n-heptane pool fire with similar dimension ( = 0.22) [37] and for gaseous methane flame ( = 0.14) under atmospheric pressure [39]. To quantify the flame heights, the average flame height in each second, i.e., 25 frames, is calculated for further discussion, as shown in Figure 6.
3.3. Prediction of HRR
In general, flame height is closely relevant to the air entrainment, i.e., the flame should extend to a certain height where the total amount of air engulfed along this height is sufficient to fulfill the combustion process [30]. Therefore, as expounded in Section 3.1, the flame height should be intrinsically related to the pyrolysis rate of the combustible. Conventionally, their relationship is summarized as:
where is the hydraulic diameter of the burner equivalent to [34]. Here, As the flame height is concretely plotted in Figure 6, Equation (1) can be used to solve for , i.e.,:
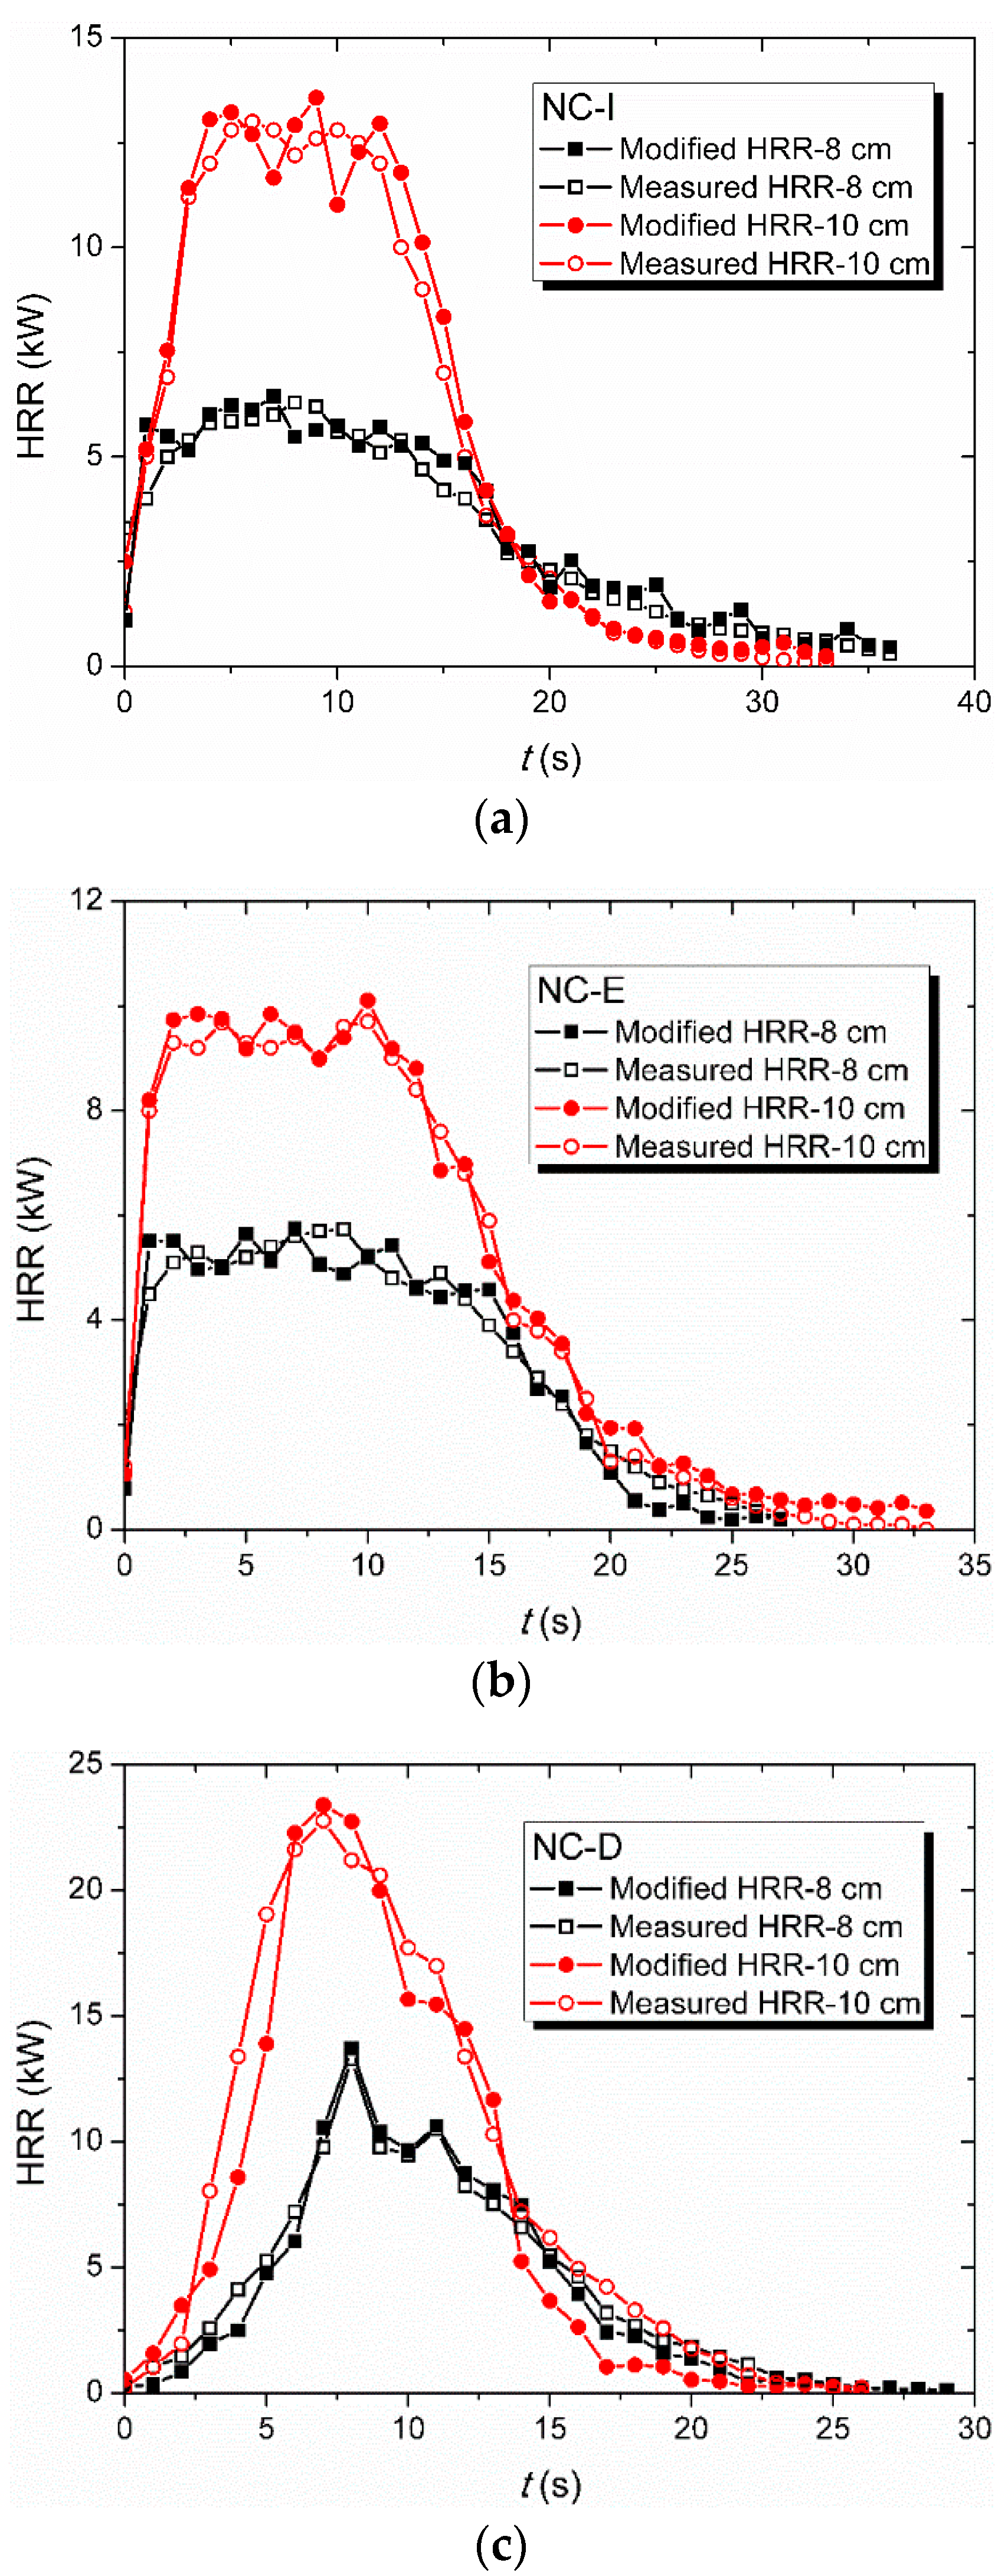
The calculated HRRs together with corresponding HRRs measured by the cone calorimeter are plotted in Figure 7. It clearly shows that the prediction model derived from Equation (1) can well predict the general variation trend of HRR for the three NC samples, while the HRR values tend to be underestimated, especially when the HRRs are relatively larger. The average values in quasi-steady burning stages predicted by Equation (2) for NC-I are 18.8% and 18.6% lower than the measured HRR values for sides of 8 cm and 10 cm, respectively, while that for NC-E are 16.1% and 13.0%. Figure 7c further demonstrates the feasibility of Equation (2) in predicting the unsteady combustion process. However, the accuracy of the prediction model needs to be improved in consideration of the discrepancy shown in Figure 7.
In effect, the coefficient 0.235 in Equation (1) is a typical empirical value applicable for a larger number of gaseous and liquid fuels under normal atmospheric conditions. Its feasibility for NC samples needs to be further clarified. Equation (1) is originally expressed as the following form [40]:
with the dimensionless parameter N defined as:
Apart from the environmental parameters, i.e., the specific heat of air , ambient temperature , gravitational acceleration and air density , the actual heat of combustion and mass stoichiometric ratio of air to volatiles substantially depend on the physical properties of combustibles. Based on Equations (3) and (4), the HRR can be recalculated as:
where is constant for the fixed ambient environment. When remains within the range of 2900–3200 kJ/kg, the coefficient 0.235 might be adequate for the rough estimation of HRR [36,37]. However, to precisely predict the HRRs, has to be reconsidered for current NC samples due to its 3/2 power law relationship with HRR.
3.3.1. Determination of
Provided the combustion efficiency is constant during the whole combustion process for a given fuel, the HRR should be linearly related to the MLR [27,41]. The HRRs versus MLRs for the three NC samples are presented in Figure 8, where their proportional relation can be observed, and the fitted slopes represent the corresponding actual heats of combustion of the three fuels, i.e., 16.57, 15.20, 13.50 kJ/g for NC-I, NC-E and NC-D, respectively. As claimed in [22], for pure NC from cotton linter with nitrogen content of 11.49–12.14%, the heat of combustion falls in between 10.67 kJ/g and 10.27 kJ/g; for pure NC from wood pulp with nitrogen content of 11.74–12.12%, the value is between 10.50–10.27 kJ/g. In any case, the heats of combustion of pure NC with nitrogen content of 11.86–12% in current tests should be lower than the fitted values in Figure 8. One reasonable explanation for this might be the addition of humectant or plasticizer. The heats of combustion for isopropanol, ethanol and DBP are 33.08 kJ/g, 29.68 kJ/g, and 30.99 kJ/g [30], respectively, which will inevitably upgrade the heat of combustion of NC samples.
3.3.2. Determination of
The chemical formula of NC can be written as C6H7O2(OH)x(ONO2)y, where . The customary way to define the composition of NC is to express the nitrogen content as a percentage by weight, i.e., the nitrogen content mentioned before, which is termed as [4]. The average number of nitrate groups present in NC can be calculated as:
Thus, for NC-I, NC-E, and NC-D samples, their NC substrates can be further specified as C6H7O2(OH)0.74(ONO2)2.26, C6H7O2(OH)0.78(ONO2)2.22, C6H7O2(OH)0.75(ONO2)2.25, respectively. In general, their difference in nitrate group is quite small because of their slight difference in nitrogen content. Assuming all the combustion yields are in the most stable forms, i.e., complete combustion, the chemical reactions for NC and their corresponding humectants and plasticizer can be written as follows:
for NC-I:
for NC-E:
for NC-D:
According to the definition of , it can be determined as:
where is the stoichiometric mole ratio of oxygen to fuel, and and are the molecular weights of air and fuel, respectively. As the weight percentage of addition agent (denoted as ) is given in current study, the average value for NC-humectant or NC-plasticizer mixtures can be reasonably expressed as:
Based on the equation above, the average values for NC-I, NC-E, and NC-D are estimated as 5.097, 4.709, and 4.217, respectively. Combined with the actual heat of combustion derived by Figure 8, can be correspondingly modified as 3251, 3228, and 3201 kJ/kg. Substituting these values in Equation (5), the model based on the flame height will be further modified to give the predicted HRR, as plotted in Figure 9. It indicates that for all three samples, the modified and measured HRRs intertwine with each other for the two tested pool dimensions, implying the modified model would help to predict the HRR more accurately.
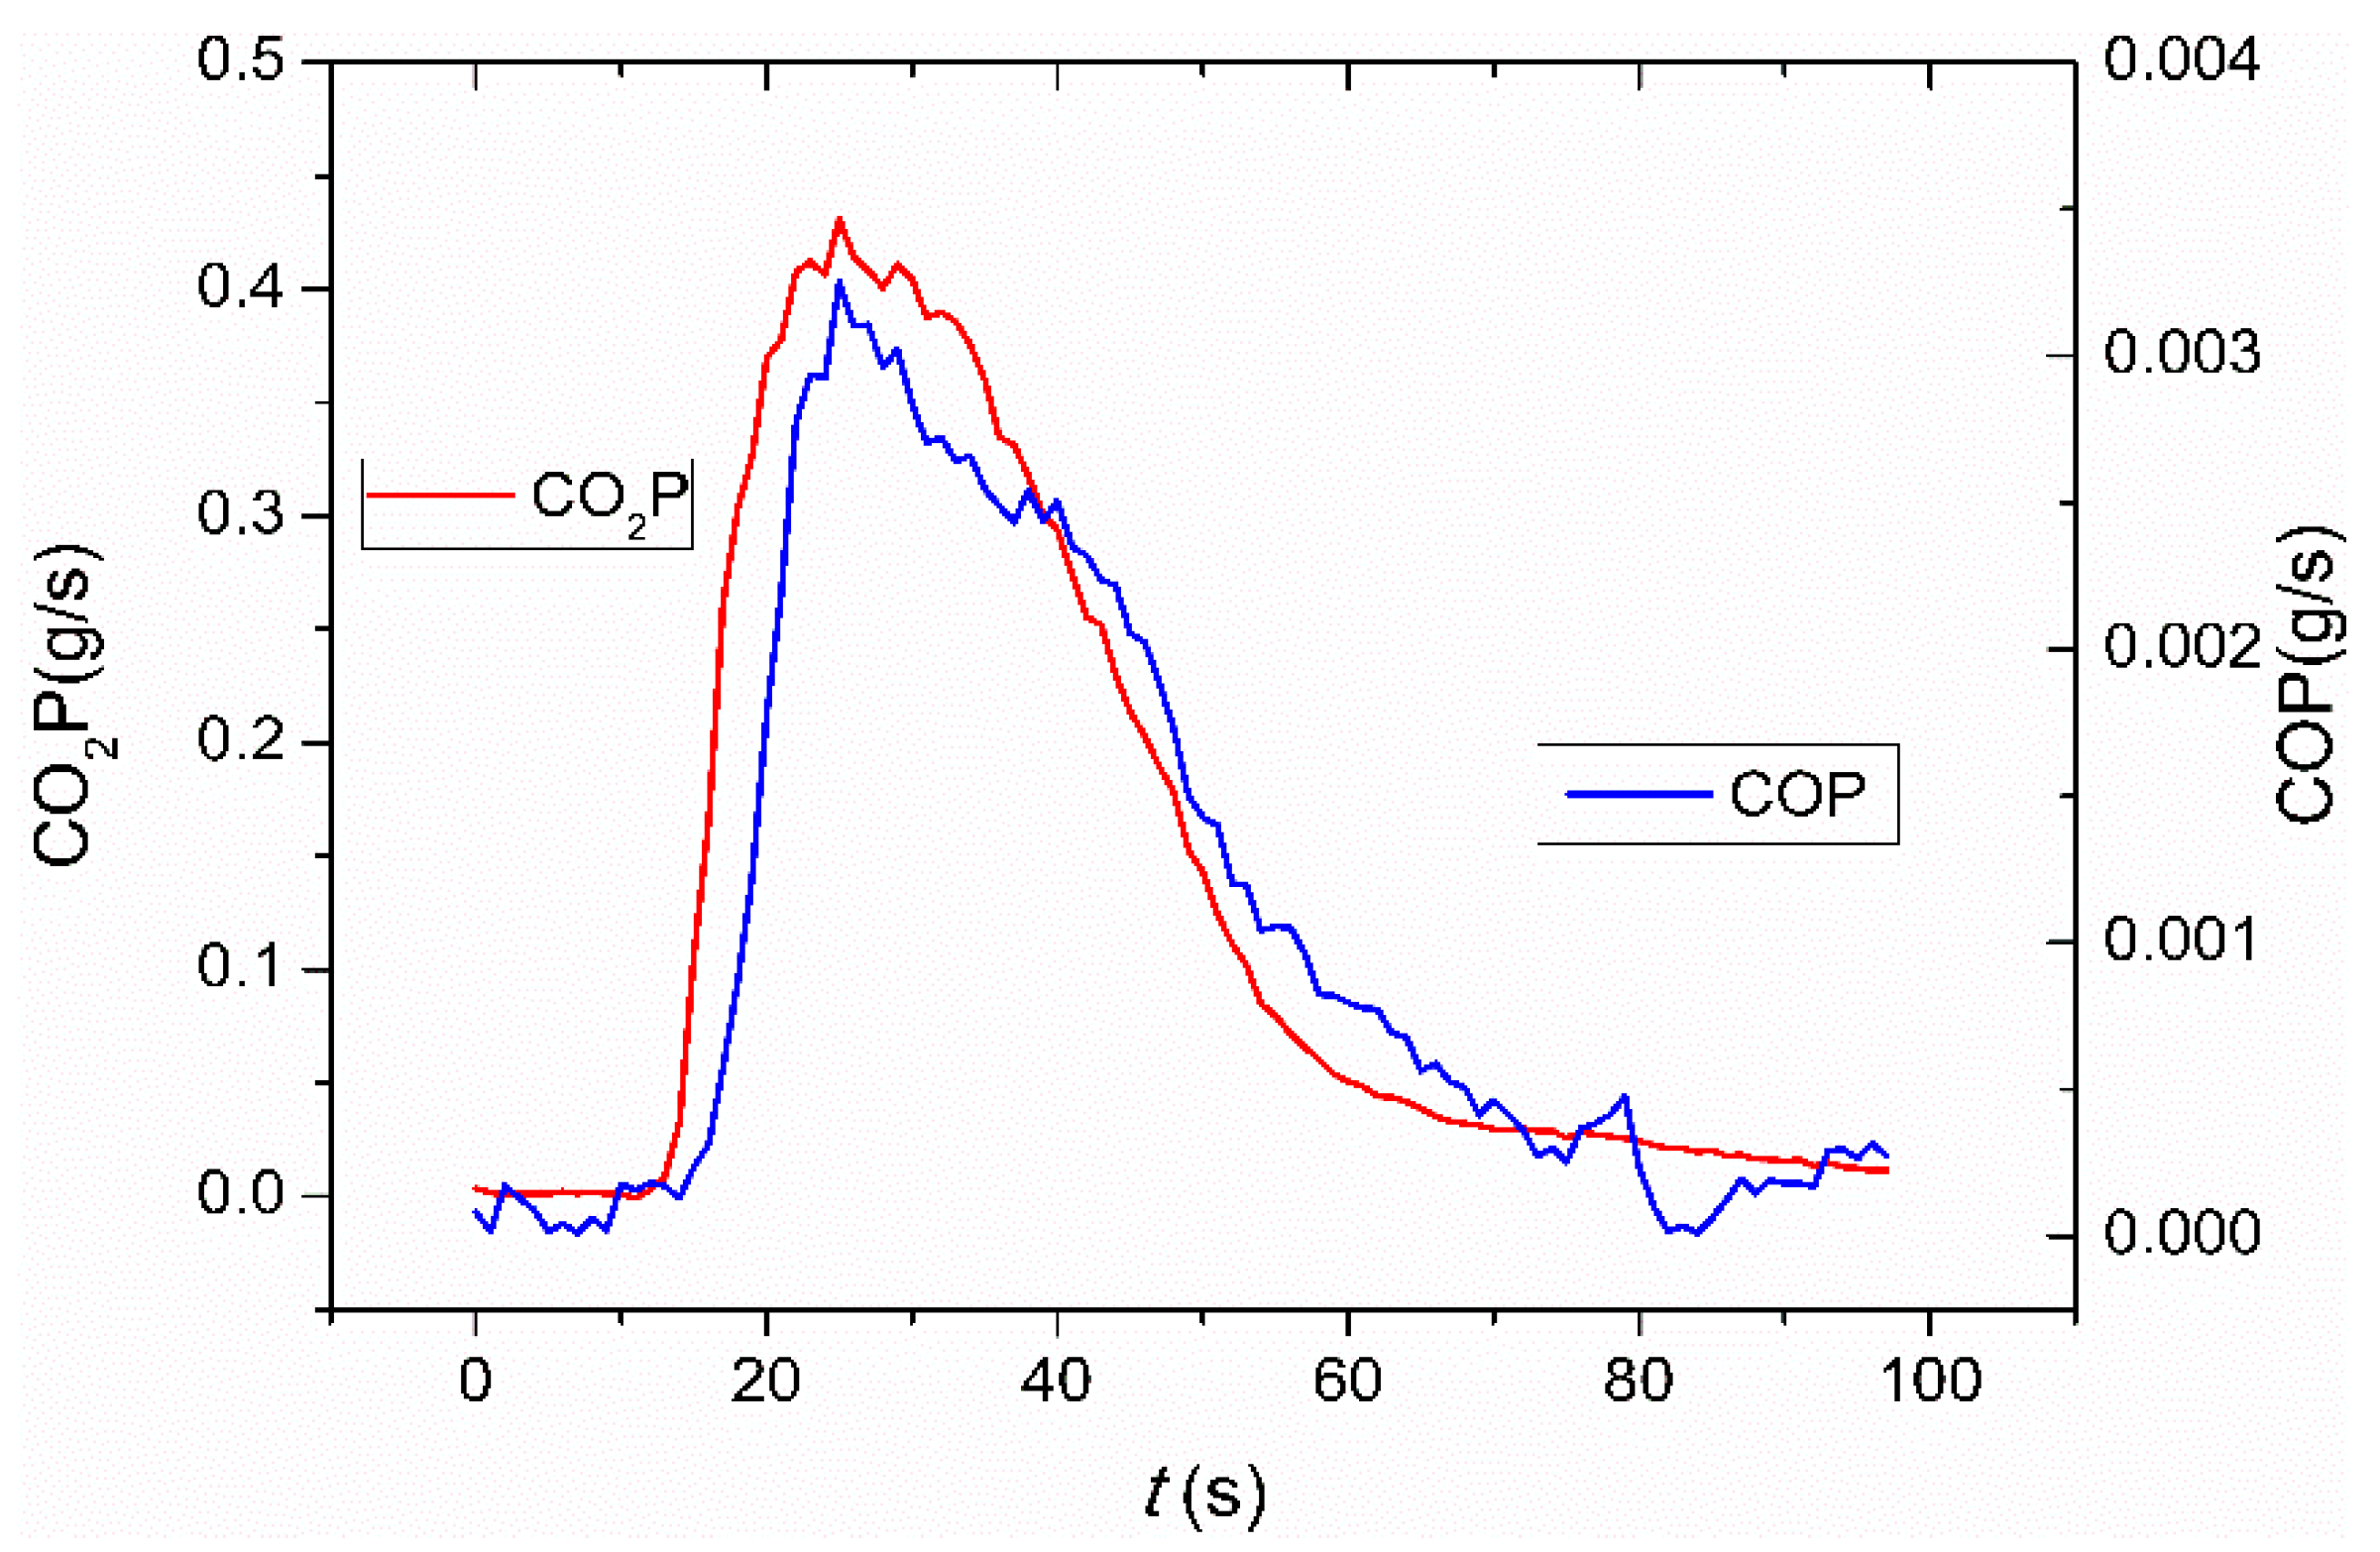
However, because of the violent oscillation of flames of NC samples shown in Figure 5, the evident fluctuation of HRR derived from flame height can be observed, exhibiting serration patterns. The predicted HRRs in quasi-steady burning stage are in the vicinity of the measured ones for NC-I and NC-E samples. Specifically, for NC-I, the average values for the predicted values are slightly higher than that for the tested results by about 1.8% and 1.7% for L = 8 cm and 10 cm configurations, respectively, while that for NC-E are 1.3% and 1.1%. It is interesting to note that the predicted HRR by Equation (5) denotes the total HRR, which is reasonably higher than the measured HRR by ISO 5660. Meanwhile, the relative amount of CO and CO2 indicates the combustion efficiency of samples. A typical result of mass production rates of CO and CO2 for 8 cm NC-D sample is depicted in Figure 10, where the concentration of CO2 are almost two orders of magnitude than that of CO. Both NC-I and NC-E samples also present the similar results. Thus, the current tests are reasonably assumed as complete combustions, or the measured HRRs are slightly lower than the total HRRs, as shown in Figure 9.
Moreover, the application range for Equations (1) and (3) is limited in [36]. Given the flame spread at the beginning and the reduction in the effective burning area during the decay stage, the diameter should be smaller than . The relatively smaller HRR at the beginning and the end together with the reduction of leads to the uncertainty of the feasibility of Equations (1) and (3). It is also difficult to identify the change of effective burning area in the two stages. In the prediction model, the diameter is roughly approximated as a constant . Thus, there are some errors in the calculation of HRR for the situations with smaller burning area and HRR.
4. Concluding Remarks
The combustion properties of NC-isopropanol, -ethanol, and -dibutyl phthalate mixtures are experimentally examined in this paper. From the video records, the flame heights of the three NC samples with two burner dimensions were determined and further applied to establish a simplified model to predict the heat release rates of the samples. From the MLR and HRR data by ISO5660, the actual heats of combustion for NC-I, NC-E, and NC-D were identified as 16.57, 15.20, 13.50 kJ/kg, respectively. These data together with values determined from the stoichiometric equations of mixtures were further employed to recalculate the critical parameter as 3251, 3228, and 3201 kJ/kg for NC-I, NC-E, and NC-D, respectively. Through the modified model, the HRR can be predicted more accurately based on the flame height data. Specifically, for NC-I, the average values for the predicted values are slightly higher than that for the tested results by about 1.8% and 1.7% for L = 8 cm and 10 cm configurations, respectively, while that for NC-E are 1.3% and 1.1%. This might be attributed to the incomplete combustion of NC samples.
The bench-scale experiments in current study have provided some insights on the fire hazards of NC-humectant and -plasticizer mixtures and indicate the possibility of the prediction on their heat release rate with a more accurate and simplified model. This prediction method is applicable to NC sample with burning area equivalent to the current dimensions, while it may not be directly extrapolated to the larger or even industrial scale unless further validation is conducted. Additionally, other commonly-used NC-humectant or -plasticizer mixtures should be tested to determine the heat of combustion and further verify the generalization of the current model. It is also worthwhile to note that a fixed bulk density is designated for NC-I and NC-E. In fact, however, the bulk density will influence the combustion properties of the samples, which deserves further examination in future studies.
Author Contributions
J.L. and M.C. design and perform the experiments; and J.L. analyzed the data and wrote the paper.
Acknowledgments
This research was financially supported by Shanghai Sailing Program (grant no. 18YF1409600).
Conflicts of Interest
The authors declare no conflict of interest.
References
- De la Ossa, M.Á.F.; Torre, M.; García-Ruiz, C. Determination of nitrocellulose by capillary electrophoresis with laser-induced fluorescence detection. Anal. Chim. Acta 2012, 745, 149–155. [Google Scholar] [CrossRef] [PubMed]
- Zhang, X.; Hikal, W.M.; Zhang, Y.; Bhattacharia, S.K.; Li, L.; Panditrao, S.; Wang, S.; Weeks, B.L. Direct laser initiation and improved thermal stability of nitrocellulose/graphene oxide nanocomposites. Appl. Phys. Lett. 2013, 102. [Google Scholar] [CrossRef]
- Zhang, X.; Weeks, B.L. Preparation of sub-micron nitrocellulose particles for improved combustion behavior. J. Hazard. Mater. 2014, 268, 224–228. [Google Scholar] [CrossRef] [PubMed]
- Akhavan, J. The Chemistry of Explosives; Royal Society of Chemistry: London, UK, 2011. [Google Scholar]
- Pourmortazavi, S.M.; Hosseini, S.G.; Rahimi-Nasrabadi, M.; Hajimirsadeghi, S.S.; Momenian, H. Effect of nitrate content on thermal decomposition of nitrocellulose. J. Hazard. Mater. 2009, 162, 1141–1144. [Google Scholar] [CrossRef] [PubMed]
- Guo, S.; Wang, Q.S.; Sun, J.H.; Liao, X.; Wang, Z.S. Study on the influence of moisture content on thermal stability of propellant. J. Hazard. Mater. 2009, 168, 536–541. [Google Scholar] [CrossRef] [PubMed]
- Iqbal, M.M.; Liang, W. Modeling the moisture effects of solid ingredients on composite propellant properties. Aerosp. Sci. Technol. 2006, 10, 695–699. [Google Scholar] [CrossRef]
- Książczak, A.; Książczak, T.; Ostrowski, M. Intermolecular interactions and phase equilibria in nitrocellulose-s-diethyldiphenylurea system. J. Therm. Anal. Calorim. 2003, 74, 575–581. [Google Scholar] [CrossRef]
- Makashir, P.; Mahajan, R.; Agrawal, J. Studies on kinetics and mechanism of initial thermal decomposition of nitrocellulose: Isothermal and non-isothermal techniques. J. Therm. Anal. Calorim. 1995, 45, 501–509. [Google Scholar] [CrossRef]
- Sovizi, M.; Hajimirsadeghi, S.; Naderizadeh, B. Effect of particle size on thermal decomposition of nitrocellulose. J. Hazard. Mater. 2009, 168, 1134–1139. [Google Scholar] [CrossRef] [PubMed]
- Katoh, K.; Higashi, E.; Nakano, K.; Ito, S.; Wada, Y.; Kasamatsu, J.; Miya, H.; Yamamoto, M.; Wada, Y. Thermal behavior of nitrocellulose with inorganic salts and their mechanistic action. Propell. Explos. Pyrot. 2010, 35, 461–467. [Google Scholar] [CrossRef]
- Fensom, D.; Fordham, S. A microscopical study of the solution of nitrocotton by nitroglycerine. Trans. Faraday Soc. 1947, 43, 538–542. [Google Scholar] [CrossRef]
- Mahajan, R.; Makashir, P.; Agrawal, J. Combustion behaviour of nitrocellulose and its complexes with copper oxide. Hot stage microscopic studies. J. Therm. Anal. Calorim. 2001, 65, 935–942. [Google Scholar] [CrossRef]
- Katoh, K.; Le, L.; Arai, M.; Tamura, M. Study on the spontaneous ignition of cellulose nitrate effect of the type of storage atmosphere (I). Sci. Technol. Energy Mater. 2003, 64, 236–240. [Google Scholar]
- Katoh, K.; Le, L.; Arai, M.; Tamura, M. Study on the spontaneous ignition of cellulose nitrate effect of the type of storage atmosphere (II). Sci. Technol. Energy Mater. 2004, 65, 77–81. [Google Scholar]
- Binke, N.; Rong, L.; Zhengquan, Y.; Yuan, W.; Pu, Y.; Hu, R.; Yang, Q. Studies on the kinetics of the first order autocatalytic decomposition reaction of highly nitrated nitrocellulose. J. Therm. Anal. Calorim. 1999, 58, 403–411. [Google Scholar] [CrossRef]
- Kapoor, I.P.S.; Srivastava, P.; Singh, G. Preparation, characterization and thermolysis of phenylenediammonium dinitrate salts. J. Hazard. Mater. 2008, 150, 687–694. [Google Scholar] [CrossRef] [PubMed]
- Pourmortazavi, S.M.; Fathollahi, M.; Hajimirsadeghi, S.S.; Hosseini, S.G. Thermal behavior of aluminum powder and potassium perchlorate mixtures by DTA and TG. Thermochim. Acta 2006, 443, 129–131. [Google Scholar] [CrossRef]
- Fu, G.; Wang, J.; Yan, M. Anatomy of Tianjin Port fire and explosion: Process and causes. Process Saf. Prog. 2016, 35, 216–220. [Google Scholar] [CrossRef]
- Willey, R.J.; Murphy, J.; Baulch, A. The explosion in Tianjin, China, August 12, 2015. Process Saf. Prog. 2015, 34, 313–314. [Google Scholar] [CrossRef]
- Zhao, B. Facts and lessons related to the explosion accident in Tianjin Port, China. Nat. Hazards 2016, 84, 707–713. [Google Scholar] [CrossRef]
- Jessup, R.S.; Prosen, E. Heats of combustion and formation of cellulose and nitrocellulose (cellulose nitrate). J. Res. Natl. Bureau Stand. 1950, 44, 387–393. [Google Scholar] [CrossRef]
- Yaman, H.; Çelik, V.; Değirmenci, E. Experimental investigation of the factors affecting the burning rate of solid rocket propellants. Fuel 2014, 115, 794–803. [Google Scholar] [CrossRef]
- Degirmenci, E. Effects of grain size and temperature of double base solid propellants on internal ballistics performance. Fuel 2015, 146, 95–102. [Google Scholar] [CrossRef]
- He, Y.; He, Y.P.; Liu, J.H.; Li, P.; Chen, M.Y.; Wei, R.C.; Wang, J. Experimental study on the thermal decomposition and combustion characteristics of nitrocellulose with different alcohol humectants. J. Hazard. Mater. 2017, 340, 202–212. [Google Scholar] [CrossRef] [PubMed]
- Wei, R.C.; He, Y.P.; Liu, J.H.; He, Y.; Mi, W.Z.; Wang, J. Experimental study on the fire properties of nitrocellulose with different structures. Materials 2017, 10. [Google Scholar] [CrossRef] [PubMed]
- Babrauskas, V. Heat release rates. In SFPE Handbook of Fire Protection Engineering; Spinger: New York, NY, USA, 2016. [Google Scholar]
- Babrauskas, V.; Peacock, R.D. Heat release rate: The single most important variable in fire hazard. Fire Saf. J. 1992, 18, 255–272. [Google Scholar] [CrossRef]
- National Defense Science and Technology Industry Committee. Specification for Nitrocellulose of Lacquers; WJ9028–2005; National Defense Science and Technology Industry Committee: Beijing, China, 2005. [Google Scholar]
- Drysdale, D. An Introduction to Fire Dynamics; John Wiley & Sons: Hoboken, NJ, USA, 2011. [Google Scholar]
- Babrauskas, V. Development of the cone calorimeter—A bench-scale heat release rate apparatus based on oxygen consumption. Fire Mater. 1984, 8, 81–95. [Google Scholar] [CrossRef]
- Babrauskas, V. The cone calorimeter. In SFPE Handbook of Fire Protection Engineering; Spinger: New York, NY, USA, 2016. [Google Scholar]
- Street, P.J. The combustion of single droplets of some fuel oils and alternative liquid fuel combinations. J. Inst. Energy 1980, 53, 154. [Google Scholar]
- Jacques, M.T.; Jordan, J.B.; Williams, A.; Hadley-Coates, L. The combustion of water-in-oil emulsions and the influence of asphaltene content. Symp. Int. Combust. 1977, 16, 307–319. [Google Scholar] [CrossRef]
- Hu, X.K.; He, Y.P.; Li, Z.H.; Wang, J. Combustion characteristics of n-heptane at high altitudes. Proc. Combust. Inst. 2011, 33, 2607–2615. [Google Scholar] [CrossRef]
- Heskestad, G. Fire plumes, flame height, and air entrainment. In SFPE Handbook of Fire Protection Engineering; Springer: New York, NY, USA, 2016. [Google Scholar]
- Zhou, Z.H.; Yao, W.; Li, H.H.; Yuen, R.; Wang, J. Experimental analysis of low air pressure influences on fire plumes. Int. J. Heat Mass Transf. 2014, 70, 578–585. [Google Scholar] [CrossRef] [Green Version]
- Cetegen, B.M.; Ahmed, T.A. Experiments on the periodic instability of buoyant plumes and pool fires. Combust. Flame 1993, 93, 157–184. [Google Scholar] [CrossRef]
- Wang, J.W.; Fang, J.; Guan, J.F.; Zeng, Y.; Zhang, Y.M. Flame volume and radiant fraction of jet diffusion methane flame at sub-atmospheric pressures. Fuel 2016, 167, 82–88. [Google Scholar] [CrossRef]
- Heskestad, G. Luminous heights of turbulent diffusion flames. Fire Saf. J. 1983, 5, 103–108. [Google Scholar] [CrossRef]
- Yao, W.; Hu, X.K.; Rong, J.Z.; Wang, J.; Zhang, H. Experimental study of large-scale fire behavior under low pressure at high altitude. J. Fire Sci. 2013, 31, 481–494. [Google Scholar] [CrossRef]
Figure 1.
The scene of catastrophic fire and explosion caused by NC in Tianjin Port, China.
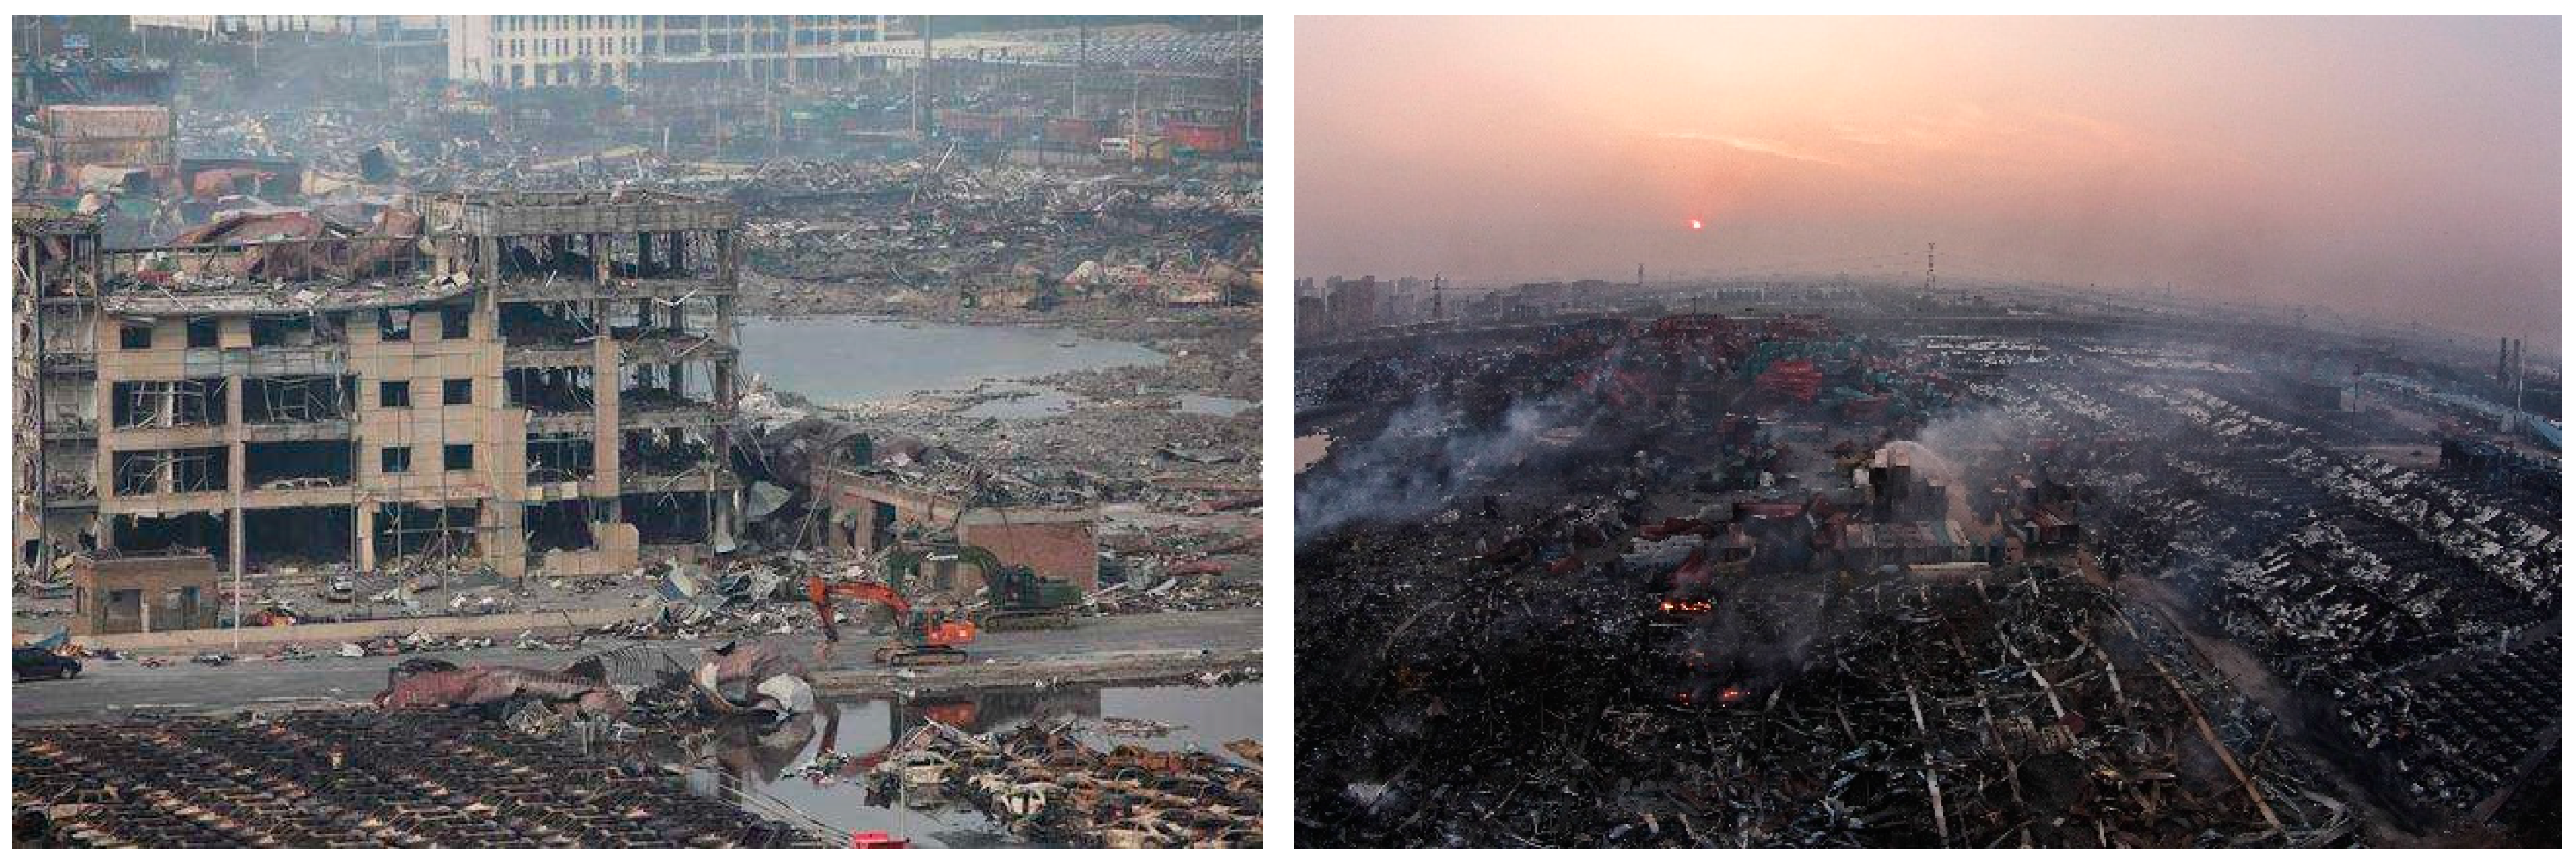
Figure 2.
Photos of arrangements of the three samples for the burner dimension with L = 8 cm.

Figure 3.
Schematic of the experimental setup of ISO 5660 tests.

Figure 4.
Flame appearances of tests with L = 8 cm at typical moments of 2, 6, 10, 18, 26 s after ignition: (a) NC-I; (b) NC-E; and (c) NC-D, where the reference value H = 76 cm.
Figure 4.
Flame appearances of tests with L = 8 cm at typical moments of 2, 6, 10, 18, 26 s after ignition: (a) NC-I; (b) NC-E; and (c) NC-D, where the reference value H = 76 cm.

Figure 5.
Variation of flame height together with corresponding MLR for cases with L = 8 cm: (a) NC-I; (b) NC-E; and (c) NC-D.
Figure 5.
Variation of flame height together with corresponding MLR for cases with L = 8 cm: (a) NC-I; (b) NC-E; and (c) NC-D.


Figure 6.
Flame heights for all the configurations.

Figure 7.
Comparisons of the predicted and measured HRRs: (a) NC-I; (b) NC-E; and (c) NC-D.


Figure 8.
Determination of heat of combustion for: (a) NC-I; (b) NC-E; and (c) NC-D.

Figure 9.
Comparisons of the modified and measured HRRs: (a) NC-I; (b) NC-E; and (c) NC-D.

Figure 10.
Comparison of mass production rates of CO and CO2 in a typical burning of 8 cm NC-D sample.
Figure 10.
Comparison of mass production rates of CO and CO2 in a typical burning of 8 cm NC-D sample.

Table 1.
Physical parameters of the additives [30].
Table 1.
Physical parameters of the additives [30].
| Additives | Chemical Formula | Molecular Weight (g/mol) | Density (kg/m3) | Heat of Combustion (kJ/g) | |
|---|---|---|---|---|---|
| Humectant | Isopropanol | C3H8O | 60.06 | 786 | 33.08 |
| Ethanol | C2H6O | 46.07 | 789 | 29.68 | |
| Plasticizer | Dibutyl phthalate | C16H22O | 278.34 | 1047 | 30.99 |
Table 2.
Detailed information of experimental configurations.
| Samples | L (cm) | Bulk Density (kg/m3) | Atmospheric Pressure (kPa) | Ambient Temperature (°C) | Relative Humidity (%) | Measurements |
|---|---|---|---|---|---|---|
| NC-I | 8, 10 | 156.3 | 100.3 ± 0.3 | 28 ± 2 | 40 ± 3 |
|
| NC-E | 8, 10 | 156.3 | ||||
| NC-D | 8, 10 | — |
Table 3.
Summary of key information from MLR and flame height.
| Sample | L (cm) | Ave./Max. MLR (g/s) | f (Hz) | zf-m (m) | If |
|---|---|---|---|---|---|
| NC-I | 8 | 0.52 | 5.13 | 0.35 | 0.77 |
| 10 | 1.03 | 4.55 | 0.50 | 0.64 | |
| NC-E | 8 | 0.51 | 5.02 | 0.33 | 0.72 |
| 10 | 0.95 | 4.52 | 0.42 | 0.71 | |
| NC-D | 8 | 1.14 | 4.42 | 0.53 | 0.44 |
| 10 | 1.79 | 4.93 | 0.70 | 0.36 |
© 2018 by the authors. Licensee MDPI, Basel, Switzerland. This article is an open access article distributed under the terms and conditions of the Creative Commons Attribution (CC BY) license (http://creativecommons.org/licenses/by/4.0/).
Share and Cite
MDPI and ACS Style
Liu, J.; Chen, M. A Simplified Method to Predict the Heat Release Rate of Industrial Nitrocellulose Materials. Appl. Sci. 2018, 8, 910. https://doi.org/10.3390/app8060910
AMA Style
Liu J, Chen M. A Simplified Method to Predict the Heat Release Rate of Industrial Nitrocellulose Materials. Applied Sciences. 2018; 8(6):910. https://doi.org/10.3390/app8060910
Chicago/Turabian StyleLiu, Jiahao, and Mingyi Chen. 2018. "A Simplified Method to Predict the Heat Release Rate of Industrial Nitrocellulose Materials" Applied Sciences 8, no. 6: 910. https://doi.org/10.3390/app8060910
Note that from the first issue of 2016, this journal uses article numbers instead of page numbers. See further details here.