Effect of Silica Nanoparticles on Fluid/Rock Interactions during Low Salinity Water Flooding of Chalk Reservoirs


Institute of Energy and Petroleum Technology, University of Stavanger, 4036 Stavanger, Norway
*
Author to whom correspondence should be addressed.
Appl. Sci. 2018, 8(7), 1093; https://doi.org/10.3390/app8071093
Submission received: 11 June 2018
/
Revised: 29 June 2018
/
Accepted: 2 July 2018
/
Published: 5 July 2018
(This article belongs to the Special Issue Nanofluids and Their Applications)
Abstract
:The main objective of this work is to address the adsorption of Silica nanoparticles (NPs) dispersed in different brines on chalk surfaces and their effect on fluid/rock interaction. Isothermal static and dynamic adsorption on chalk are addressed here. Isothermal static adsorption showed increased adsorption of NPs at higher salinity. The tests were performed to cover wide range of injection scenarios with synthetic seawater (SSW) and low salinity water (LSW). The selected LSW composition here is based on 1:10 diluted SSW, which has shown to have superior performance compared to other ion compositions. The dynamic adsorption tests of NPs showed reduction of calcite dissolution of about 30% compared to LSW alone. That is, silica nanofluid hinders calcite dissolution i.e., has less effect on chalk matrix integrity which is a major concern in chalk reservoir, if low salinity is employed for enhanced oil recovery. Both scanning electron microscope images and pressure drop across the core during nanofluid injection indicated no throat blockage. Based on ion tracking and the monitored pH, the mechanism(s) for NP adsorption/desorption are suggested. The results from this study suggests a synergy wherein adding relatively small amount of silica NPs can improve the performance of low salinity floods.
1. Introduction
Nanofluids (NFs) have recently attracted attention from researchers in different disciplines. One of their fields of application is enhanced oil recovery (EOR) from petroleum reservoirs [1,2,3,4]. With sizes below 100 nm and high specific surface area, nanoparticles (NPs) are suitable for subsurface porous media applications since they can pass through the pore throats of porous media without blocking them and enhance oil recovery at relatively low volume concentrations [5,6] via wettability alteration [7,8,9].
The work here is performed using silica NPs. Many researchers have conducted core flooding studies and demonstrated the potential of silica NPs to increase oil recovery [2,10,11,12,13,14,15,16]. Adsorption and transport of nanoparticles in porous media is of primary importance for subsurface applications as this determines the effectiveness of the nanofluid injection. However, most of the work has been focused on the adsorption and transport behaviour of NPs in sandstones [17,18,19]. Few investigations have addressed the applicability of NPs to carbonate reservoirs [20,21,22,23,24]. Nazari Moghaddam, et al. [25] compared the performance of different types of NPs in altering the wettability of carbonate reservoirs. Al-Anssari, et al. [26] reported that silica NPs adhere to the calcite surface irreversibly and can alter the wettability of oil/mixed-wet to water-wet state. The efficiency of wettability change by silica NPs was shown to be enhanced at higher temperatures [20]. Apart from wettability change, silica NPs have also been shown to reduce oil-water interfacial tension thereby improving the mobility of oil phase [27,28,29] and stabilize oil in water emulsions [30,31,32,33] for EOR application. Monfared, et al. [34] studied the adsorption of silica NPs on calcite surfaces. They reported that salinity has a positive effect on the adsorption process. However, adsorption of silica NPs on the chalk surface is not well understood.
Chalk reservoirs are generally speaking tight, with permeabilities ranging from 1–7 mD and porosity of about 50%. Low salinity water flooding has emerged as an effective technique for improving oil recovery from some reservoirs [35,36,37,38,39,40,41,42]. However, increased calcite dissolution induced by low salinity interaction with chalk during flooding may lead to loss of rock integrity [43]. Previous work in our lab investigated the adsorption different silica NPs on sandstone minerals and its effect on fines migration [44]. We found the silica NPs modifies the sandstones minerals and it can be utilized to overcome the problem of formation damage induced during low salinity flooding in sandstones.
To best of our knowledge, the adsorption behaviour of silica NPs on chalk and its effect on fluid/rock interactions has not been addressed previously. This work aims to address the adsorption desorption mechanisms of silica NPs at different salinity conditions and suggest a synergy between silica NPs and low salinity water flooding of chalk reservoirs. The first part of the study addresses the stability of the used nanofluids. Thereafter, static adsorption of the NPs on calcite at different salinities is addressed. The adsorption of silica NPs on chalk surface is visualized by performing scanning electron microscopy (SEM). Dynamic adsorption of NPs during injection into chalk and its effect on fluid/rock interaction was investigated. Finally, the effect of NP on the fluid/rock interactions during continuous nanofluid injection in the presence of hydrocarbons is addressed. Three types of cases are investigated, with silica NPs mixed with seawater or low salinity water (LSW) and with mix injection as the third case. The last of these represents the situation for most oil fields, especially those in the North Sea where primary flooding has been with seawater. The fluid/rock interaction has been addressed here to shed light on the possible mechanisms, which may help in deciding when to apply the technology. The results from this study suggests a synergy wherein adding a small amount of silica NPs can improve the performance of low salinity floods by reducing the risk of matrix integrity loss and reservoir subsidence in chalk reservoirs.
2. Materials and Methods
The silica NPs used in this study were provided by Nyacol Nano Technologies Inc. (Ashland, MA, USA). The DP 9711 product was acquired at a 30 wt. % concentration in deionized water (DIW) and with a pH of 3. The DP9711 product has a proprietary surface coating but Singh and Mohanty [45] reported that DP 9711 is coated with polyethylene glycol. For ease, these NPs are referred to as DP in this study. The NPs as claimed by the manufacturer have an average particle size of 20 nm. As and when required, the NFs used in this study were prepared from the stock fluid by diluting it with appropriate brines. Stevns Klint (SK) outcrop chalk cores were used as the porous media. SK chalk is 99% pure biogenic with a high porosity range of 45–50% and a relatively low absolute permeability of 4 mD [36]. SK chalk matrix material and its petro-physical properties resembles chalk reservoirs, which makes it useful in the analysis [46]. Calcite mineral powder acquired from Honeywell Riedel-de Haen was of analysis grade with a surface area of 0.23 (m2/g) calculated previously by the water adsorption isotherm [47]. The model oil used in this study was n-decane (n-C10) acquired from Merck (Drammensveien, Oslo, Norway). Stearic acid (SA) was added to n-decane at a concentration of 0.005 mol/L to prepare the synthetic oil. The properties of the synthetic oil are listed in Table 1, estimated from PVT Sim.
Zetasizer Nano ZSP from Malvern Instruments (Malvern, Worcestershire, UK) was used to characterize the average hydrodynamic diameter and zeta potential of the NPs. Scanning electron microscopy was performed on a Supra 35 VP SEM by Ziess (Oberkochen, Baden-Württemberg, Germany) with an integrated EDXRF analyzer to visualize the adsorption of the NPs on the SK chalk samples treated with NF. NP concentration during isothermal static adsorption tests and NP dynamic adsorption in brines was measured using a dual beam UV-Vis 1700 spectrophotometer from Shimadzu Corporation (Nakagyo-ku, Kyoto, Japan). The schematic of the core flooding setup used in this study is shown in Figure 1. The concentration of the cations in the effluents was determined by a Dionex ICS-5000 ion chromatograph from Thermo Fisher Scientific (Waltham, MA, USA). Inductive coupled plasma and optical emission spectrometry (ICP-OES) was carried out by an Optima 4300 DV from PerkinElmer (Waltham, MA, USA)to quantitatively determine the trace amounts of elements eluted and to determine the NP concentration in the effluent for chalk cores injected with DIW.
2.1. Brines
Synthetic seawater (SSW) and LSW produced by a 1:10 dilution of SSW with DIW were the brines used in this study. The ionic compositions of the brines are listed in Table 2.
2.2. Isothermal Static Adsorption
A series of batch adsorption experiments were performed at room temperature to address the adsorption of the silica NPs on the calcite surface. The concentration of NPs was systematically varied to address the effect of NPs’ concentration on the adsorption process. The experiments were performed in DIW and SSW as the media for studying the effect of salinity on the adsorption process. A known amount of mineral was added to NF at a predetermined concentration. The dispersion was agitated on a rotary agitator for 24 h. Thereafter, the mineral was removed from the dispersion and the concentration of the NPs in the fluid was determined by measuring their absorption in a dual beam spectrophotometer at 240 nm, comparing it with the constructed calibration curve and making baseline corrections.
2.3. Dynamic Adsorption of NPs in Chalk Core
The objectives of the tests were to study the adsorption profile of the NPs and their interaction with the minerals (mainly calcite). The dried chalk cores were vacuum-saturated with DIW or brine (LSW/SSW) and loaded into the core holder. A confining pressure of 25 bar was applied, and injection was performed at a constant flow rate of 10 PV/day at room temperature. After injecting several PVs of DIW/brine (pre-flush), 1.5 pore volume (PV) of slug with LiCl tracer was injected. Thereafter, the injection was switched to the original fluid to conduct a post-flush. For the tests SK1 & 2, the DIW (ions free) was injected and the effluent was analyzed for Ca to follow the calcite dissolution. Tests SK3 and 4 were performed with SSW and LSW, respectively. Details of the experiment are listed in Table 3.
2.4. Effect of Oil on the Interaction of the NPs and Mineral
The purpose of these tests to confirm the interaction of NPs with mineral surface in presence of synthetic oil (n-C10+ 0.005 M SA). The cores were first dried at 100 °C in a vacuum oven until the weight stabilized. The cores were then vacuum-saturated with SSW and loaded in the core holder. Several PVs of synthetic oil were flooded into the core until initial water saturation (Swi) was obtained. Thereafter, the cores were aged in synthetic oil for a period of two weeks at 50 °C to render them oil-wet. The experiments were performed at 70 °C under a confined pressure of 25 bar and against 10 bar of back pressure in two stages. In order to mimic the field status (water flooded), different scenarios were studied as shown in Table 4. The injection rates were small to be able to account for the kinetics of the interaction. From our previous studies with LSW alone [43], two flow rates were used 4 and 16 PV/day. Thereafter, the injection was switched to NF and the flow was at 4 and 16 PV/day. The details of the experimental tests are listed in Table 4.
The effluent fluids were collected and analyzed for pH and ion concentration. The pressure drop across the core was monitored. Since oil was produced, a rough estimation of potential recovery was estimated. However, the recovered oil is not optimized but is just given as indication.
3. Results and Discussion
This section is divided into subsections to fulfil the objectives of this work. The subsections are: (1) NF characterization to address their sizes and stability with different injection fluids, the effect of temperature on size, their zeta potential in the different waters. (2) Adsorption of NP onto the calcite surface in different waters—i.e., the effect of the salinity on the adsorption. (3) Dynamic adsorption of NPs during injection into chalk and its effect on fluid/rock interaction and (4) Effect of NP on the fluid/rock interactions during continuous nanofluid injection in the presence of hydrocarbons.
3.1. NF Characterization
NFs were characterized for particle size and zeta potential at different temperatures and in various brines. The NFs were prepared in DIW, LSW and SSW. Particle-size measurements at different temperatures and the zeta potential measurements at 25 °C are presented in Figure 2. Figure 2a shows the average hydrodynamic diameter of the NP, which was diluted with DIW, LSW and SSW to obtain 1 g/L NP concentration. NFs prepared in DIW and LSW showed almost similar particle size (the average size for the three temperatures, 25, 50 and 80 °C was about 38.4 ± 0.6 nm). In SSW, NPs displayed higher particle size of around 57 nm (25 and 50 °C) and about 88 nm at 80 °C. For higher salinity (SSW), the average size at all temperatures was about 67 ± 0.3 nm, which is approximately 43% higher than the average particle size for all tested temperatures with DIW and LSW. One possible reason for the difference in the measured zeta potential may be the compression of the double layer at higher salinity. The measured surface zeta potential at 25 °C for the NFs prepared in SSW was about −6.4 mV compared with −30.73 and −12.13 mV for DIW and LSW, respectively. Griffith, et al. [48] stated a similar observation for DP9711 NFs. They observed that increasing the brine salinity did not immediately increase particle size but that, after a certain point in time, a sudden rise in particle size was seen. To address particle size and stability, DLS measurements were repeated after three months from the preparation time. These tests showed that all measurements were close to the initial measured values (within 5 nm). In addition, the NFs remained visually clear with no sign of sedimentation.
3.2. Isothermal Static Adsorption
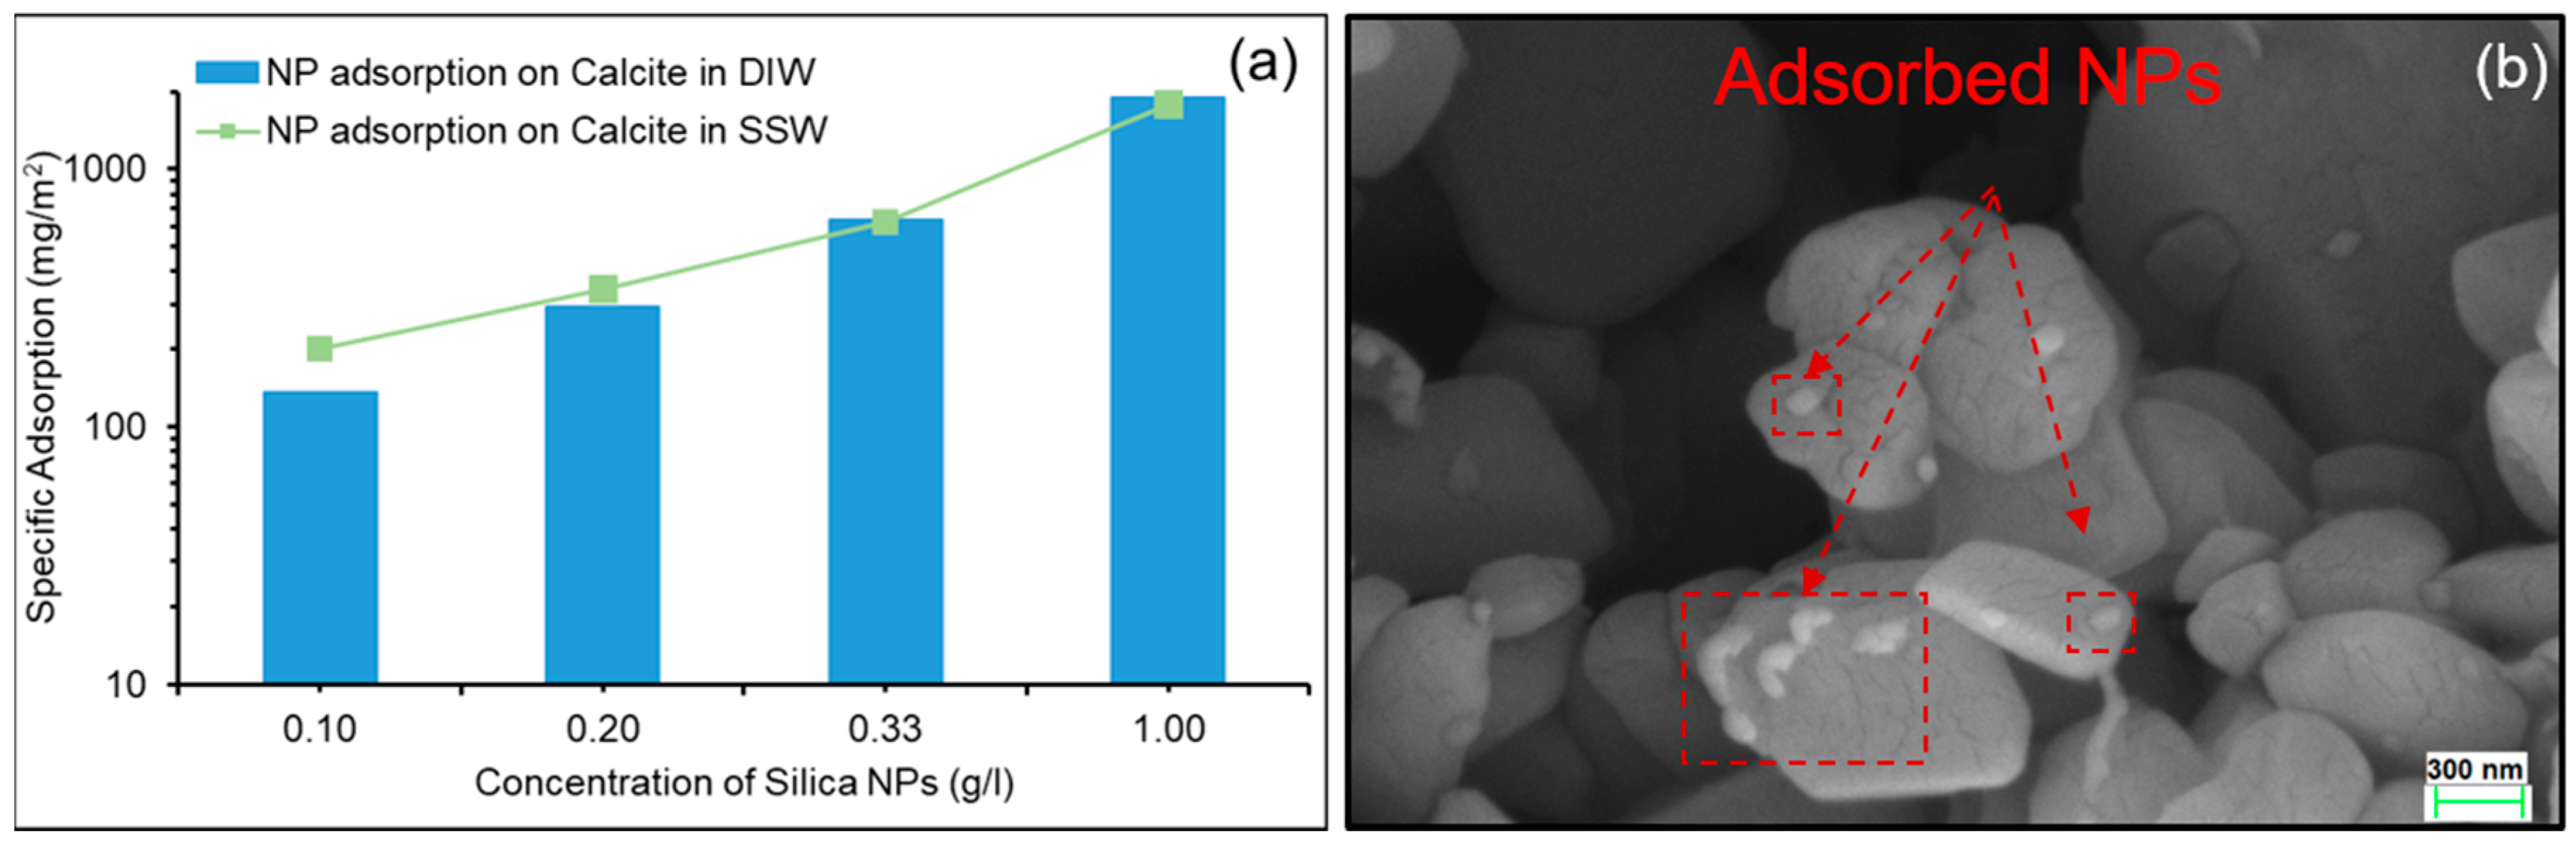
Static adsorption tests of NPs on a calcite surface were conducted with DIW and SSW. Figure 3a shows that the adsorption of the NPs on the calcite surface increases with the NP concentration. Figure 3a also shows that at a lower concentration of NPs prepared in SSW, adsorption is higher than in DIW (≈40%). At higher NP concentrations, however, adsorption in SSW and DIW was almost the same. Monafred, et al. [34] have reported an increase in adsorption of unmodified silica NPs on a calcite surface with increasing salinity (0–0.2 M) of single salt (NaCl) brine at low NP concentrations (0.4 and 0.6 g/L).
Zeta potential of the NPs becomes less negative in the presence of SSW ions (Figure 2) owing to the compression of the double layer. This would lower the electrostatic repulsion and enhance the adsorption. Figure 3b shows an SEM image of a chalk core which was vacuum-treated with 1 g/L NF prepared in DIW. The image was taken along the injection plane. In DIW, the average size of NPs is about 38 nm (at 25 °C). However, some of the NPs may have been agglomerated during handling. In general, NPs are shown to be spread on the chalk surface in a similar way to the observations made by Monafred, et al. [34]. No pore throat blockage was observed from SEM imaging. The SEM images were done on spots along horizontally cut core. However, they are small fractions of the whole core.
3.3. Dynamic Adsorption
This section deals with the dynamic adsorption of NPs in chalk and its effect on fluid/rock interactions. Three salinities: DIW, LSW and SSW were used in the dynamic tests as outlined in Section 2.3. The adsorption/transport behavior of the used Silica NPs (DP9711) in sandstones has been addressed previously by some researchers [17,45,49]. They generally reported low adsorption of NPs on sandstone minerals. To best our knowledge, the adsorption behavior of Silica NPs in chalk and its effect on fluid rock interactions has not been addressed previously. The first test (SK1), was done with a core saturated with DIW. After several PVs pre-flush with DIW, a 1.5 PV slug containing LiCl tracer (0.1 M) and NPs (1 g/L) was injected into the core, followed by post-flush with DIW. The effluent fluid was analyzed for the concentrations of NP, Ca and Li (tracer). The results are presented in Figure 4. As shown, a difference of about 1 PV between the peak concentration of the tracer and the peak concentration of NPs. It was also observed that the tracer peak concentration declined faster than that for the NPs. The delay of NP decline may indicate interaction between the NP and core surface. After about 11 PV of injection (from the start), the NP concentration showed a linear increase, while the Li declined to a level close to zero concentration. The increased of NPs’ concentration after 11 PV, may indicate the NPs’ desorption.
Now the question is, why did the NP concentration decline below 0.01 g/L before the start of the desorption process (at ≈11 PV)? The adsorption/desorption process may be related to the pH of post flowing fluid in contact with calcite surface and adsorbed NPs. The effluent pH profile for core SK1 is shown in Figure 4b. It is shown that the pH after nanofluid slug increased steadily for approximately 1 PV, and then steeply increased to a pH of about 10, before it started to decline to reach a pH of about 8.6. The highest pH coincided with the peak concentration of NP in the effluent and the desorption of NP from 11 PV (Figure 4a) coincided with the steady increase of the pH from about 8 to about 9. Equation (1) may explain the associated increase of pH with calcite dissolution.
Therefore, as calcite dissolves, the pH increases. Increase of the pH increases the dissolution of NPs (SiO2) according to the following equations:
Equation (2) shows the dissolution of SiO2. Stumm and Morgan [50] stated that SiO2 solubility increases at neutral to slightly alkaline pH ranges according to the above equation, producing silicic acid, which is a weak acid. Silicic acid further dissociates and reduces the pH (Equation (3)). The progression of this equation may have reduced the effluent pH, as shown in Figure 4b. The reduction of the pH to 8, may have resulted in more adsorption of NP on the calcite surface, hence reduced the produced NPs in the effluent (Figure 4a). As the pH started to increase, desorption of NPs increased.
The increase of the pH from about 8 till about 9 at the termination point of the experiment (PV ≈ 18) may be caused by calcite dissolution by Equation (1). These observations may be summarized as: maximum NP concentration in the effluent occurred at the highest pH (≈10) of this experiment. As the pH declined, less concentration of NPs were detected in the effluent until NPs reached minimum at 11 PV (pH ≈ 8), after which, NP started to rise again and to reach 0.03 g/L (at the time of the experimental termination). This counts for about 50% higher than the peak concentration of 0.02 g/L. The dissolution of calcite can be inferred from the effluent calcium concentration profiles. Since the injected fluid did not contain any calcium, the effluent calcium observed may be attributed to the calcite dissolution by Equation (1). A second test (SK2) was done without NPs to provide a baseline for comparing the calcite dissolution in SK1. The pH of the slug without NPs in SK2 was adjusted to be at the same pH level as that of nanofluid in SK1. The calcium concertation in the effluent from test SK1 (with NP) and SK2 (without NP) is shown in Figure 4c. Calcite dissolution could be detrimental to chalk matrix integrity, causing severe subsidence and this is a major concern for the operators of chalk reservoirs. It is interesting to observe that calcium concentration during tests of SK1 and SK2, Figure 4c, there is no significant difference between the Ca in the two cases during DIW pre-flush. However, after the slug injection, the difference in the trend of Ca for the two experiments started to increase. At 10–12 PV in the case of test fluid with NP the calcium concentration was about 80% less than that for the fluid without NP.
The general mechanism may, then, be deduced as follow: the dissolution of calcite increases the pH, which in turn reduces NP adsorption on the calcite surface. Monfared, Ghazanfari, Jamialahmadi and Helalizadeh [34] have made similar observation where increasing the pH from around 7.5 to 10 reduced the adsorption of silica NPs on the calcite surface by about 33.33%. As mentioned earlier, effluent calcium was reduced by about 80% for brine with NPs. As the pH increases, the layer closer to the calcite surface becomes less positive, so that NP adsorption decreases. As observed, more NPs were produced when the pH reached about 10, with peak concentration at pH ≈ 10. SiO2 dissolves in the alkaline range of the pH (Equation (2)). Dissociation of silicic acid (Equation (3)) increases the negative ions and thereby reduces the adsorption process. In addition, the dissociation of (weak) silicic acid slightly increases the acidity of the solution, which may again increase the adsorption of NPs. The greater the NPs’ adsorption, the faster the pH decline, as observed in Figure 4a. As the desorption process proceeded, the pH steadily increased until it reached about 9, which was the point where the experiment was terminated. It is estimated that the adsorbed on the chalk about 0.46 mg per gram of chalk. This was obtained from the integrated area under the curve (Figure 4a) and the injected NPs. This process was investigated further in saline environments by injecting SSW as base fluid in SK3 and LSW as base fluid in SK4. In SK3 test, both the pre-flush and post-flush was performed with SSW. The nanofluid slug with tracer was also prepared in SSW. The results for the test SK3 are shown in Figure 5.
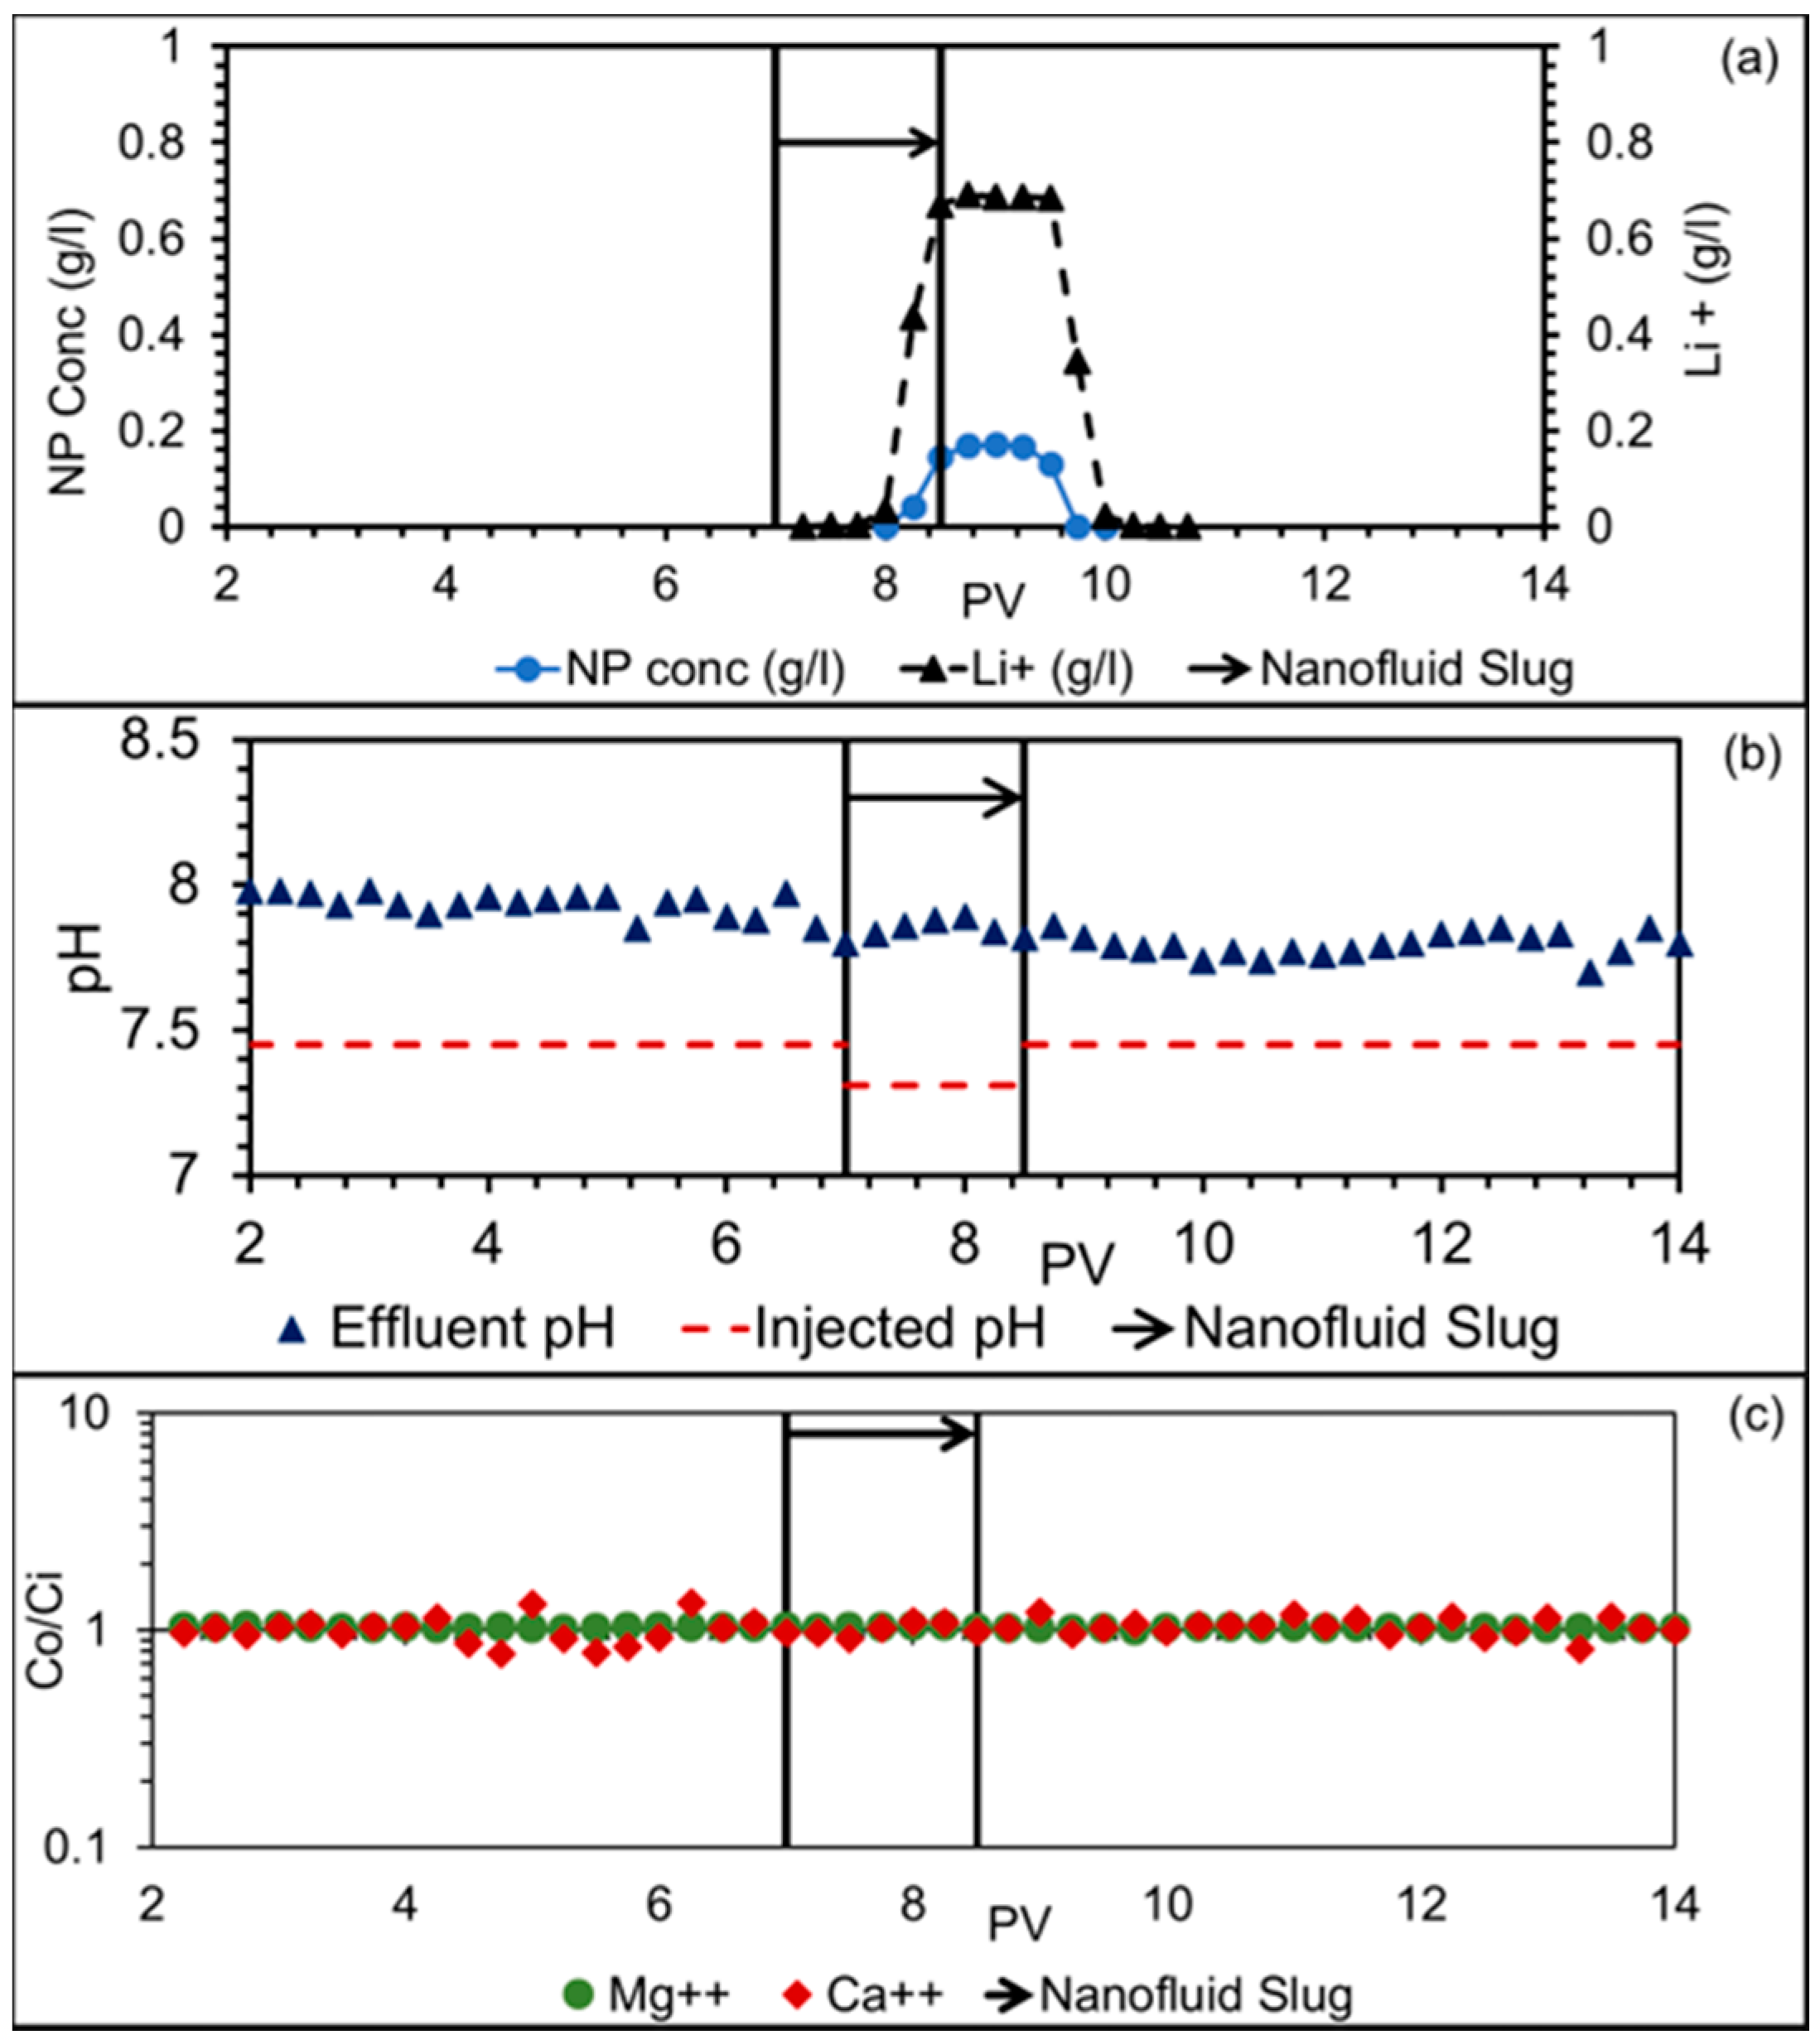
It can be seen in Figure 5a that unlike in test SK1, the NP concentration profile for test SK3 follows the tracer profile closely. In addition, the NP production stops about 0.25 PV before the tracer. That is unlike SK1, no NP was detected in the effluent after the unreacted tracer has passed through the chalk core. This together with high adsorption of the NPs observed in SSW during static adsorption experiments may indicate strong irreversible adsorption of the NPs on the chalk surface. Integrating the area under the curve in Figure 5a and comparing it to the known amount of NPs injected into the core showed that about 86% of NPs were adsorbed on the chalk surface. Further, the effluent pH and ion concentration profiles for test SK3 in SSW are shown in Figure 5b,c respectively. At elevated salinity conditions in SK3, the chalk surface and the contacting fluid is at equilibrium [43] and therefore ionic activity due to fluid/rock interaction was expected to be low. For ease of comparison, the effluent concentration (Co) was normalized with respect to the injected concentration (Ci). It can be seen that pH remains almost constant throughout test SK3 and the ion (Ca2++ and Mg2++) concentration in the effluents remain close to injected concentration. This forms the baseline for comparing the behavior at low salinity condition in the next test SK4. In test SK4, both the pre-flush and post flush was performed with LSW. The nanofluid slug with tracer was also prepared in LSW. The results for test SK4 are shown in Figure 6.
It can be seen in Figure 6a that with LSW, the NP breakthrough is delayed by 0.25 PV as compared to the unreacted tracer. In addition, the NP production continues after the tracer production stops. This is similar to test SK1 (ion free) and may indicate desorption of the NPs. It was estimated that 67.2% of the NPs were adsorbed in the core in SK4 as compared to 86.2% in SK3. At low salinity conditions in SK4, the NP concentration profile is similar to DIW. This together with the high irreversible adsorption observed with SSW indicates that salinity strongly influences the adsorption behavior of the NPs on the chalk surface. The effluent pH profile for test SK4 shown in Figure 4c shows a sharp rise in pH with NP production and the pH peak coincides with peak NP production. Thereafter the desorption of NPs during the decline phase can be attributed to the dissolution of the NPs which produces a weak silicic acid as per Equations (2) and (3). This supports the NP adsorption/desorption mechanism proposed previously. However, the linear rise of NPs production in the effluents as observed with DIW (Figure 4a) was not observed with LSW in SK4. This may be due the heavy dissolution of chalk due to DIW in SK1 which significantly raised the pH to 10. The effluent Ca2+ and Mg2+ profiles shown in Figure 6c. The high levels of Ca2+ in the pre flush stage suggest high calcite dissolution. However, after the adsorption of NPs on the chalk surface, the Ca2+ falls by about 30%. In addition, the Mg2+ levels fall below the injected concentration during the post flush. This may be due to the incorporation of magnesium into the calcite structure. This is discussed in detail in the later section.
From the results so far from static and dynamic adsorption of NPs on chalk surface (in the absence of oil phase) indicated that NP adsorption in chalk could significantly reduce calcite dissolution induced by low salinity injection. However, for the application of NPs to petroleum reservoirs, it is essential to study the effect of NPs on chalk surface that is oil wet and the effect of NPs in the presence of oil phase. This is addressed in the following section.
3.4. NPs Interaction with Chalk Mineral in Presence of Hydrocarbon
Nanofluid are prepared in brines and some studies have investigated the combined role of salinity and NPs on the wettability change process [51] and NP adsorption on mineral surfaces [52]. Hendraningrat and Torsæter [51] stated that nanofluid flooding is sensitive to water salinity especially in the presence of divalent ion (Ca2+ and Mg2+). The effect of injection brine salinity on the recovery process has been well documented in the literature [36,39,53,54,55,56]. As discussed in the previous section, the adsorption of NPs on the mineral surface alters the rock surface hence fluid/rock interactions. The experiments were divided into two stages with brine alone and NPs dispersed in the selected brine. The injection was performed at lower flowrates that are closer to real field cases and to give the injected fluid sufficient residence time in the core for the interaction. Hamouda and Maevskiy [43] and Hamouda and Gupta [41] previously studied the effect of low salinity composition on primary and secondary recovery in SK chalk by systematically diluting the SSW. They found that LSW at a 1:10 SSW dilution was the optimum for the investigated brines for EOR. Therefore, LSW 1:10 dilution of SSW is used here.
In the SK5 case, both primary and secondary stage the injection of the fluid was SSW. For the secondary stage, however, silica NPs (DP 1 g/L) was mixed with SSW. In SK6, primary stage was performed with LSW followed by injection of NF (DP 1 g/L) prepared in LSW. The third scenario was for SK7, where primary stage SSW was used, followed by NF prepared in LSW (DP 1 g/L). Those three scenarios represent the various possible combinations.
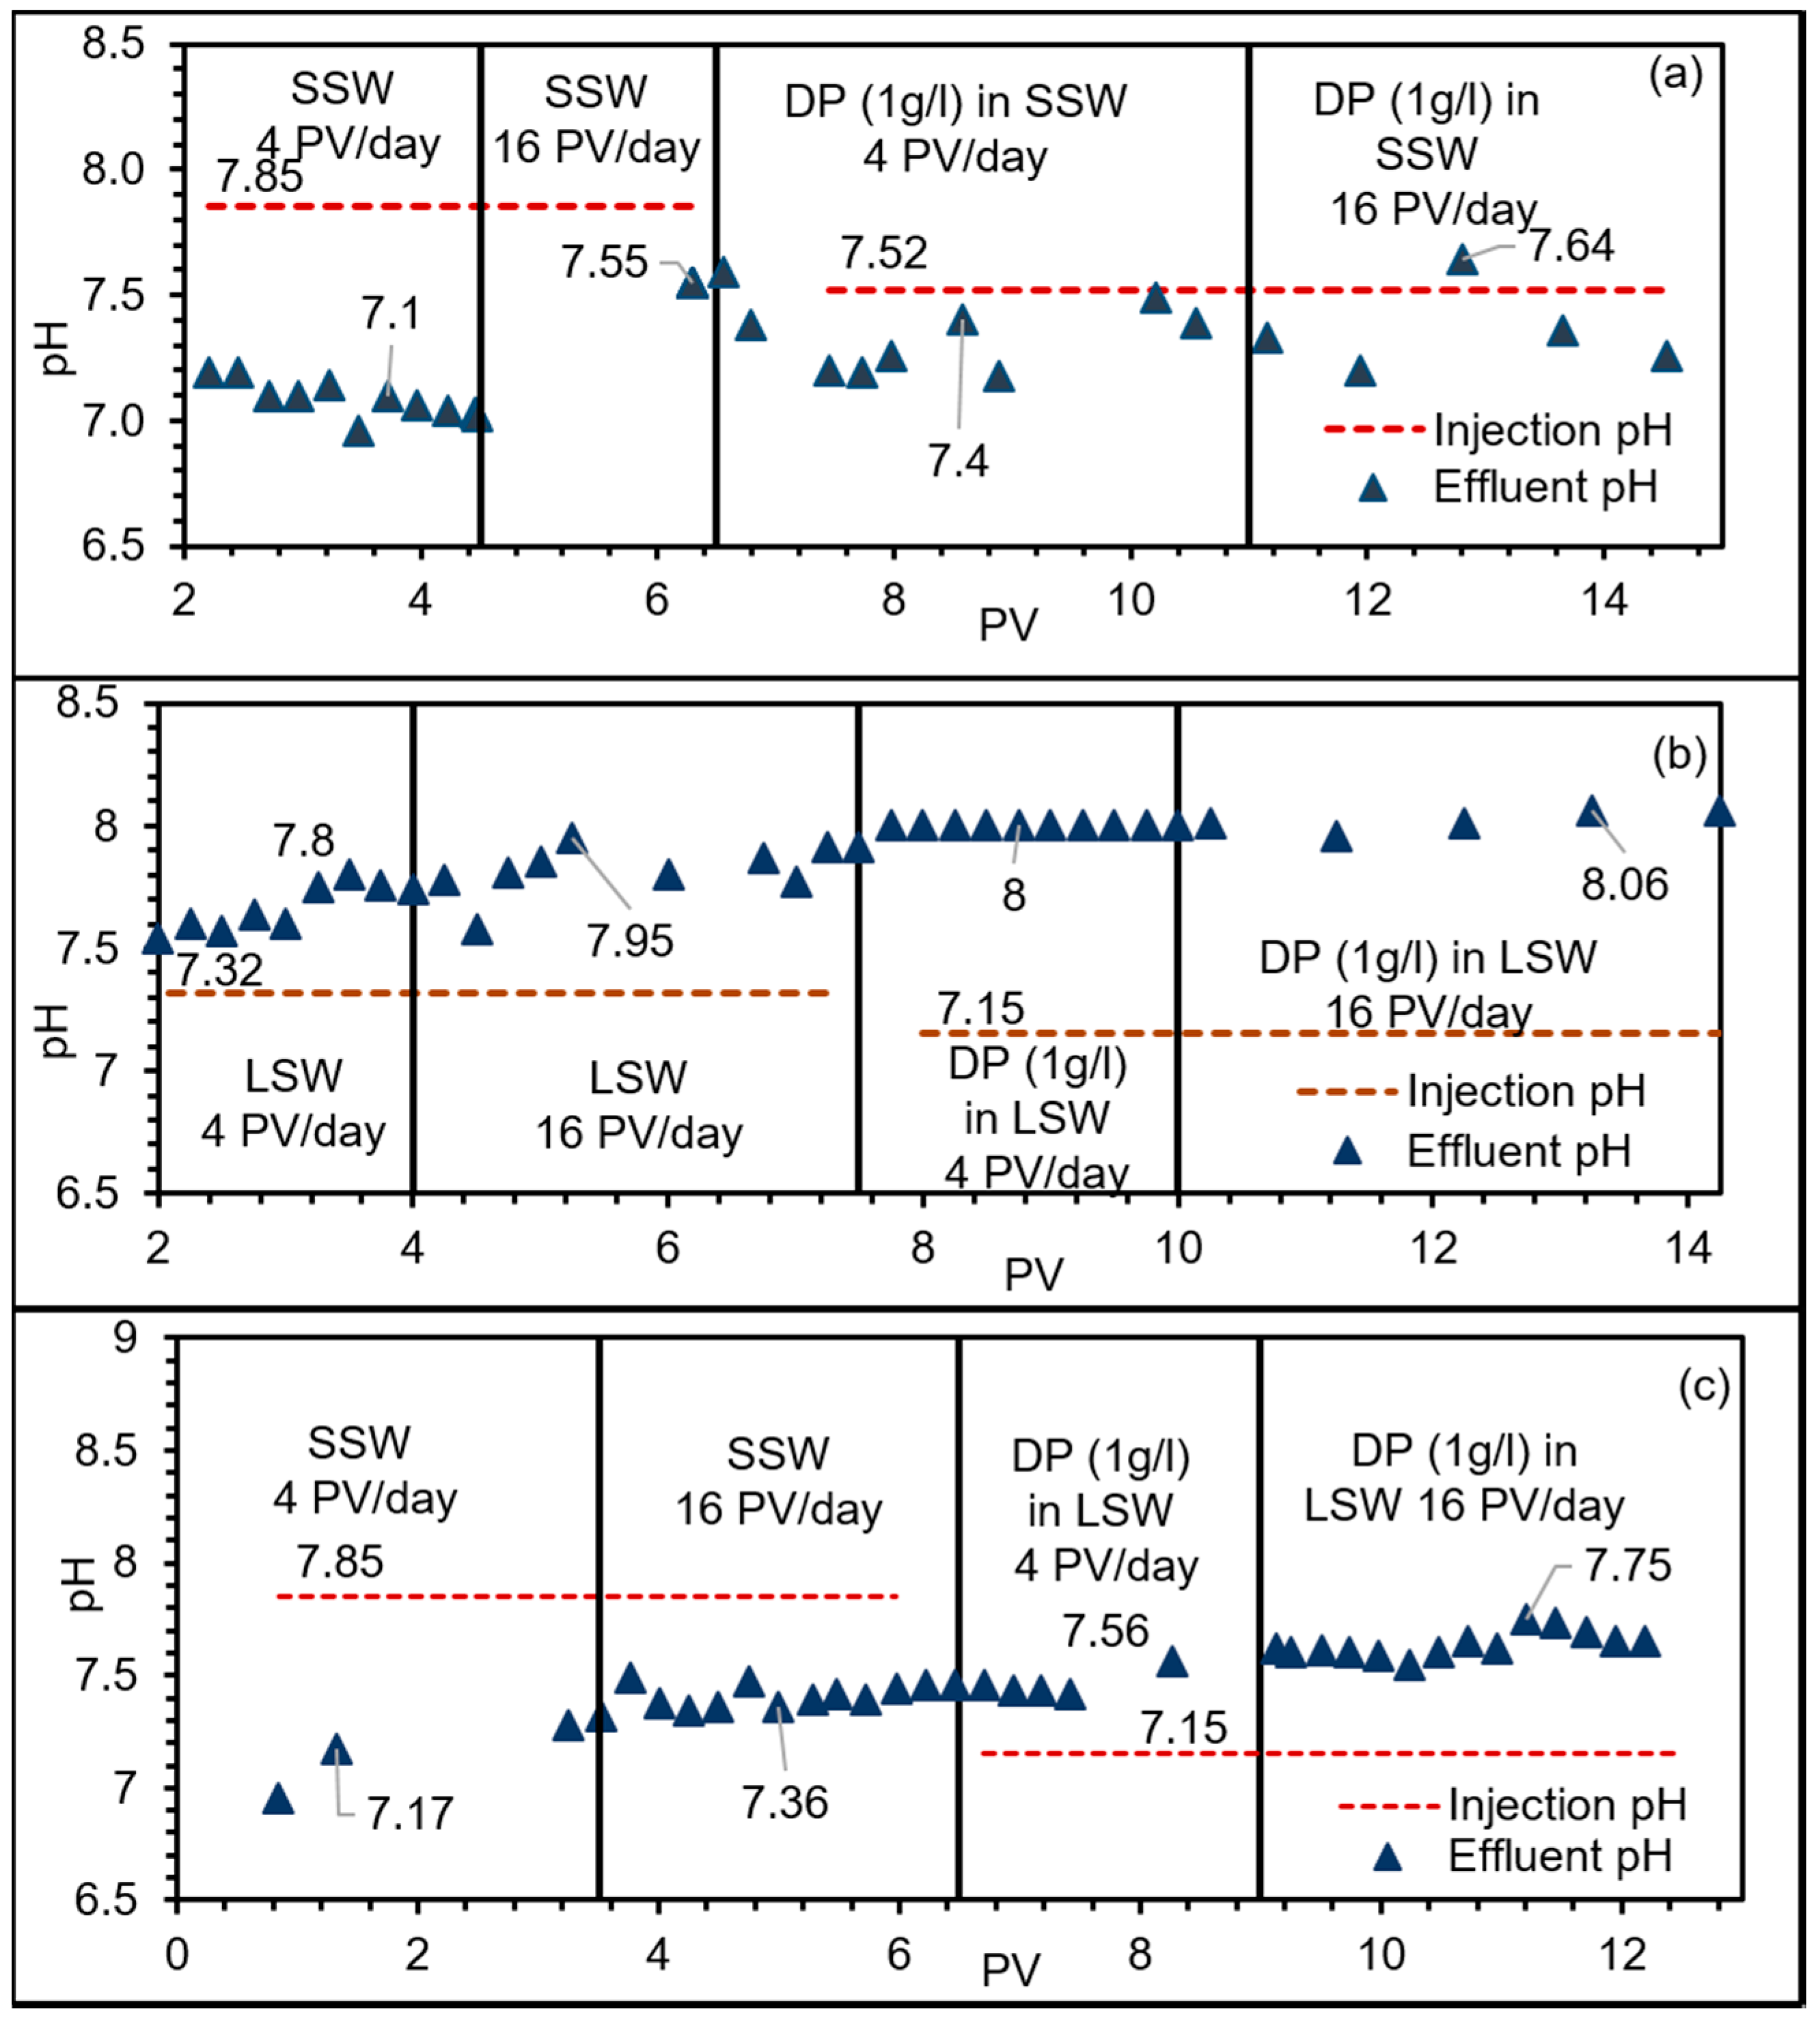
The effluent pH profiles were recorded for the SK5, SK6 and SK7 and are shown in Figure 7. For SK5 (all SSW), the effluent pH during primary and secondary stages were lower than the pH of the injected SSW. This observation is similar to that previously made by Hamouda and Maevskiy [43]. In the case of SK6 (LSW and LSW with NPs) however, an interesting behavior was observed. The effluent pH was higher than the injection pH and continued rising until it stabilized at about 7.8. Increasing the flow rate to 16 PV/day led to a slight increase in pH to around 7.95, after which it stabilized at around 7.91. The increase in pH may be explained by calcite dissolution, in accordance with the Equation (1).
The pH in the case of SK7 (SSW and LSW with NPs) shows that the pH remained below the injected pH in primary stage. However, the pH increased slightly to about 7.56 when the injection was switched to LSW with NF. When the NF injection rate was increased to 16 PV/day, the pH of SK6 and SK7 stabilized at about 8.06 and 7.75, respectively. As expected, the pH was higher for SK6 case than in the case of SK7.
The concentrations of Ca2+ and Mg2+ in the effluents of SK5-7 are plotted in Figure 8. For ease of comparison, effluent concentration (Co) was normalized with respect to the injected concentration (Ci). Figure 8a shows that the Ca2+ effluent in SK5 was lower than the injected concentration during primary stage and even more so during secondary stage. This may indicate slight calcite dissolution with high injection salinity (SSW). This observation was also supported by the low pH recorded for this SK5 in Figure 7a. The Mg2+ concentration in effluent was close to the injected concentration. Where the SK6 (all LSW) is concerned, however, the Ca2+ ion concentration during primary stage by LSW was consistently higher, indicating calcite dissolution similar to the observation made during dynamic adsorption experiments in SK4. This observation is supported by the high pH recorded during this stage in Figure 7b. Along with the excess Ca2+, there was a deficiency of Mg2+ in the effluent. It is well established that calcite has a tendency to accommodate Mg2+ in its structure [50]. The exchange between Ca2+ and Mg2+ may lead to the formation of complex calcium/magnesium minerals with different ratios. The following reaction is for a 1:1 ratio (dolomite):
Dolomitization has been previously observed by Petrovich and Hamouda [57] in the chalk formations of the Ekofisk field. During primary stage by LSW, the ratio of the effluent ion concentration to the injected concentration reached 6.267 and 0.686 for Ca2+ and Mg2+ respectively at 16 PV/day. When SK6 was switched to NF prepared in LSW, the ratio of Ca2+ to injected concentrations fell to 4.26 at the injection rate of 4 PV/day. Increasing the rate to 16 PV/day raised the Ca2+ concentration slightly to 4.63, which is still below the Ca2+ concentration during primary stage by LSW. This reduction in Ca2+ during NF injection (almost 30%) coincided with a comparative increase in levels of Mg2+ to 0.86 at 4 PV/day and 0.85 at 16 PV/day. These observations may indicate a reduction in calcite dissolution and the formation of calcium/magnesium minerals. The increased amount of Mg2+ was not significant enough to indicate reduced magnesium/calcium exchange. It is therefore possible that the reduction in Ca2+ was caused by reduced calcite dissolution during NF injection. Increasing the rate to 16 PV/day, the Ca2+ concentration stabilized at around 4.6. This also represents a 25% reduction of Ca2+ production compared with the 4 PV/day flow rate during primary stage. With primary stage in the SK7 case, the effluent ion concentration profiles were close to the injected concentration. When the SK7 was switched to NF prepared in LSW, the Ca2+ and Mg2+ ions were initially high. Two main possibilities exist for the increase of Ca2+ and Mg2+: (1) production of trapped SSW from the first stage and/or (2) dissolution of possible calcium sulfate formed during the first stage. The latter may sound more realistic because of a rapid reduction in Ca2+ and Mg2+ concentrations. Thereafter, the Ca2+ concentration was around 1.5 at 4 PV/day. The Ca2+ concentration during this stage is almost three times lower than at the same stage in SK6. When increasing the injection rate to 16 PV/day, the Ca2+ concentration fluctuates between 2.9 and 1.16. This concentration at 4 PV/day is almost three times lower than during the same stage in SK6. The differential pressure drop (dP) data recorded for SK5-7 is shown in Figure 9.
At 4 PV/day with SSW injection in SK5, the pressure drop stabilized at about 1.79 bar. When the injection rate was increased to 16 PV/day, the dP increased and stabilized at around 3.70 bar. After the injection fluid was switched to NF prepared in SSW, the pressure rose steadily from 0.68 to 2.17 bar. van Oort, et al. [58] stated a general rule of thumb that, if the particle size of the suspended solids exceeds one-third of the pore diameter, the particles will cause plugging behavior. The average pore size of the SK chalk used in this study is around 200 nm [59]. The size of the NPs in SSW was shown earlier to be 88.1 nm at 80 °C. It is possible that some of the smaller pore throats are blocked by the NPs. For SK6 however, the recorded dP for NF (in LSW) was 0.439 bar, which is almost three times lower than the dP recorded for LSW injection in the first stage. The measured particle size of the NPs in LSW is about 38 nm, which is significantly lower than the average pore throat of the chalk used. The recorded dP at 16 PV/day was slightly higher for the NF compared with LSW alone. However, the difference (≈0.04 bar) is within the uncertainty range of the measured dP (±0.1 bar). The resistance to flow was therefore lower at the low flow rate. A similar observation was made with SK7 where, at the lower flow rate (4 PV/day), the dP during NF injection was less than half that from SSW injection. However, the pressure drop at the higher flow rate was slightly (≈0.5 bar) higher during NF injection, with a decreasing trend. The decreasing pressure trend observed in SK7 during 16 PV/day injection of nanofluid was not observed for the same stages in flood SK5 and 6 wherein the salinity of the fluid was constant throughout the experiment, with only addition of NPs. However, in SK7, the fluid salinity is switched from SSW to LSW (with NP). Two mechanisms take place: (1) adsorption of NP on the chalk surface, hence reduced calcite dissolution and (2) disturbance of fluid rock equilibrium due to low salinity. As the injection rate is increased to 16 PV/day, the swept region with LSW + NPs increased, hence reduced pressure. This is evident in Figure 8c wherein at 16 PV/day, a decreasing trend in Ca2+ production was observed. The decrease in Ca2+ may be explained based on reduced dissolution of calcite and dilution factor due to increased sweep. In addition to the main objective, an incremental oil obtained from nanofluid injection in SK5-7 as shown in Figure 10. As mentioned earlier, the recovery here is not optimized to account properly for EOR, but as a matter of observation compared to our previous studies with LSW alone.
The incremental recovery was greater in the case of SK6 (0.824%) than with SK5 (0.15%). The highest incremental recovery was observed when the fluid was switched to NF prepared in LSW (1.05% for SK7 experiment).
In summary, the results from this work suggests a possible synergistic effect between low salinity flooding and silica nanoparticles wherein adding a relatively small amount of silica nanoparticles to the injected water can improve the flood performance and reduce the risk of disturbing the integrity of the chalk. Seawater has been injected as a primary recovery EOR method in most of North Sea oil fields. LSW injection for enhanced oil recovery could disturb the chalk integrity due to calcite dissolution. This is a major concern for chalk reservoir operators. As outcome of this work by incorporating silica NPs in the injected water encourages applying LSW. The current work is done with model oil in order to investigate the potential for field application. However, as demonstrated here it is dependent on fluid composition i.e., we recommend test related to each individual field fluid.
4. Conclusions
This work addresses static and dynamic adsorption of silica NPs on chalks and their fluid/rock interactions during low salinity flowing tests. Based on the results from this study the following conclusions can be stated:
- Silica NPs showed an adsorption affinity to calcite surface. Salinity was shown to enhance the adsorption by about 40%.
- Dynamic adsorption of the NPs in the chalk core showed high irreversible adsorption at elevated salinity (SSW) and desorption of NPs was observed in low salinity and ion free condition.
- Adsorption/desorption mechanisms for the NPs have been proposed. Further, it can be concluded that NPs adsorption during these experiments led to significant reduction of calcite dissolution both in DIW and LSW.
- In spite of the NPs affinity to adsorb on the chalk surface, no pore throat blockage was observed from SEM imaging. The SEM images were done on spots along horizontally cut core. However, they are small fractions of the whole core. Further the differential pressure drop across the chalk core during nanofluid injection also indicated reduced resistance to flow wherein lower pressure drop was recorded, compared to with injection of LSW alone.
- The nanofluid at 1 g/L prepared in LSW reduced the produced calcium ion concentration by about 30% as compared to the case of LSW alone. This indicates that silica NF hinders calcite dissolution i.e., has less effect on chalk matrix integrity which is one of the major concern in chalk reservoir, if low salinity for EOR is to be employed.
- The combination of silica NPs with low salinity EOR technique reduces the risk of matrix integrity loss and the subsidence degree of the water flooded chalk.
Author Contributions
A.A.H. and R.A. designed the study. The experiments were performed by A.A. and R.A. The analysis was done by all three authors. The manuscript was written by A.A.H. and R.A.
Funding
This research received no external funding.
Acknowledgments
The authors would like to thank the University of Stavanger (UiS), Norway, for funding this work. The authors thank Mona W. Minde (UiS) for help with SEM imaging, Lutz Eichacker (UiS) for providing access to DLS equipment. The authors would like to thank Inger Johanne M.-K. Olsen (UiS) for acquiring chemicals used in this study. In addition, the authors would like to thank Kim Andre Vorland and Krzysztof I. Nowicki (both UiS) for helping with the flooding setup. Finally, the authors would like to thank NYACOL® Nano Technologies Inc for supplying the nanofluid used in this study.
Conflicts of Interest
The authors declare no conflict of interest. The funding sponsors had no role in the design of the study; in the collection, analyses, or interpretation of data; in the writing of the manuscript, and in the decision to publish the results.
References
- Ayatollahi, S.; Zerafat, M.M. Nanotechnology-Assisted Eor Techniques: New Solutions to Old Challenges. In Proceedings of the SPE International Oilfield Nanotechnology Conference and Exhibition, Noordwijk, The Netherlands, 12–14 June 2012; Society of Petroleum Engineers: Richardson, TX, USA, 2012. [Google Scholar]
- Zhang, H.; Nikolov, A.; Wasan, D. Enhanced oil recovery (eor) using nanoparticle dispersions: Underlying mechanism and imbibition experiments. Energy Fuels 2014, 28, 3002–3009. [Google Scholar] [CrossRef]
- Saboorian-Jooybari, H.; Dejam, M.; Chen, Z. Heavy oil polymer flooding from laboratory core floods to pilot tests and field applications: Half-century studies. J. Pet. Sci. Eng. 2016, 142, 85–100. [Google Scholar] [CrossRef]
- Chávez-Miyauchi, T.S.E.; Firoozabadi, A.; Fuller, G.G. Nonmonotonic elasticity of the crude oil–brine interface in relation to improved oil recovery. Langmuir 2016, 32, 2192–2198. [Google Scholar] [CrossRef] [PubMed]
- Suleimanov, B.; Ismailov, F.; Veliyev, E. Nanofluid for enhanced oil recovery. J. Pet. Sci. Eng. 2011, 78, 431–437. [Google Scholar] [CrossRef]
- Fletcher, A.; Davis, J. How eor can be transformed by nanotechnology. In Proceedings of the SPE Improved Oil Recovery Symposium, Tulsa, OK, USA, 24–28 April 2010; Society of Petroleum Engineers: Richardson, TX, USA, 2010. [Google Scholar]
- Hendraningrat, L.; Li, S.; Torsæter, O. A coreflood investigation of nanofluid enhanced oil recovery. J. Pet. Sci. Eng. 2013, 111, 128–138. [Google Scholar] [CrossRef]
- Maghzi, A.; Mohammadi, S.; Ghazanfari, M.H.; Kharrat, R.; Masihi, M. Monitoring wettability alteration by silica nanoparticles during water flooding to heavy oils in five-spot systems: A pore-level investigation. Exp. Therm. Fluid Sci. 2012, 40, 168–176. [Google Scholar] [CrossRef]
- Li, S.; Torsæter, O. Experimental investigation of the influence of nanoparticles adsorption and transport on wettability alteration for oil wet berea sandstone. In Proceedings of the SPE Middle East Oil & Gas Show and Conference, Manama, Bahrain, 8–11 March 2015; Society of Petroleum Engineers: Richardson, TX, USA, 2015. [Google Scholar]
- Behzadi, A.; Mohammadi, A. Environmentally responsive surface-modified silica nanoparticles for enhanced oil recovery. J. Nanopart. Res. 2016, 18, 1–19. [Google Scholar] [CrossRef]
- Hendraningrat, L.; Torsæter, O. A stabilizer that enhances the oil recovery process using silica-based nanofluids. Transp. Porous Media 2015, 108, 679–696. [Google Scholar] [CrossRef]
- Ogolo, N.; Olafuyi, O.; Onyekonwu, M. Enhanced oil recovery using nanoparticles. In Proceedings of the SPE Saudi Arabia Section Technical Symposium and Exhibition, Al-Khobar, Saudi Arabia, 8–11 April 2012; Society of Petroleum Engineers: Richardson, TX, USA, 2012. [Google Scholar]
- Shahrabadi, A.; Bagherzadeh, H.; Roostaie, A.; Golghanddashti, H. Experimental investigation of hlp nanofluid potential to enhance oil recovery: A mechanistic approach. In Proceedings of the SPE International Oilfield Nanotechnology Conference and Exhibition, Noordwijk, The Netherlands, 12–14 June 2012; Society of Petroleum Engineers: Richardson, TX, USA, 2012. [Google Scholar]
- Ortega, D.J.S.; Kim, H.B.; James, L.A.; Johansen, T.E.; Zhang, Y. The effectiveness of silicon dioxide sio 2 nanoparticle as an enhanced oil recovery agent in ben nevis formation, hebron field, offshore eastern canada. In Proceedings of the Abu Dhabi International Petroleum Exhibition & Conference, Abu Dhabi, UAE, 7–10 November 2016; Society of Petroleum Engineers: Richardson, TX, USA, 2016. [Google Scholar]
- Haroun, M.R.; Alhassan, S.; Ansari, A.A.; Al Kindy, N.A.M.; Abou Sayed, N.; Kareem, A.; Ali, B.; Sarma, H.K. Smart nano-eor process for abu dhabi carbonate reservoirs. In Proceedings of the Abu Dhabi International Petroleum Conference and Exhibition, Abu Dhabi, UAE, 11–14 November 2012; Society of Petroleum Engineers: Richardson, TX, USA, 2012. [Google Scholar]
- Agista, M.; Guo, K.; Yu, Z. A state-of-the-art review of nanoparticles application in petroleum with a focus on enhanced oil recovery. Appl. Sci. 2018, 8, 871. [Google Scholar] [CrossRef]
- Zhang, T.; Murphy, M.J.; Yu, H.; Bagaria, H.G.; Yoon, K.Y.; Nielson, B.M.; Bielawski, C.W.; Johnston, K.P.; Huh, C.; Bryant, S.L. Investigation of nanoparticle adsorption during transport in porous media. SPE J. 2015, 20, 667–677. [Google Scholar] [CrossRef]
- Zhang, T.; Murphy, M.; Yu, H.; Huh, C.; Bryant, S.L. Mechanistic model for nanoparticle retention in porous media. Transp. Porous Media 2016, 115, 387–406. [Google Scholar] [CrossRef]
- Li, S.; Torsæter, O. The impact of nanoparticles adsorption and transport on wettability alteration of water wet berea sandstone. In Proceedings of the SPE/IATMI Asia Pacific Oil & Gas Conference and Exhibition, Nusa Dua, Bali, Indonesia, 20–22 October 2015; Society of Petroleum Engineers: Richardson, TX, USA, 2015. [Google Scholar]
- Al-Anssari, S.; Wang, S.; Barifcani, A.; Lebedev, M.; Iglauer, S. Effect of temperature and sio 2 nanoparticle size on wettability alteration of oil-wet calcite. Fuel 2017, 206, 34–42. [Google Scholar] [CrossRef]
- Roustaei, A.; Bagherzadeh, H. Experimental investigation of sio2 nanoparticles on enhanced oil recovery of carbonate reservoirs. J. Pet. Explor. Prod. Technol. 2015, 5, 27–33. [Google Scholar] [CrossRef]
- Abhishek, R.; Kumar, G.S.; Sapru, R. Wettability alteration in carbonate reservoirs using nanofluids. Pet. Sci. Technol. 2015, 33, 794–801. [Google Scholar] [CrossRef]
- Abhishek, R.; Bagalkot, N.; Kumar, G.S. Effect of transverse forces on velocity of nanoparticles through a single fracture in a fractured petroleum reservoir. Int. J. Oil Gas Coal Technol. 2016, 12, 379–395. [Google Scholar] [CrossRef]
- Nwidee, L.N.; Al-Anssari, S.; Barifcani, A.; Sarmadivaleh, M.; Lebedev, M.; Iglauer, S. Nanoparticles influence on wetting behaviour of fractured limestone formation. J. Pet. Sci. Eng. 2017, 149, 782–788. [Google Scholar] [CrossRef]
- Nazari Moghaddam, R.; Bahramian, A.; Fakhroueian, Z.; Karimi, A.; Arya, S. Comparative study of using nanoparticles for enhanced oil recovery: Wettability alteration of carbonate rocks. Energy Fuels 2015, 29, 2111–2119. [Google Scholar] [CrossRef]
- Al-Anssari, S.; Barifcani, A.; Wang, S.; Iglauer, S. Wettability alteration of oil-wet carbonate by silica nanofluid. J. Colloid Interface Sci. 2016, 461, 435–442. [Google Scholar] [CrossRef] [PubMed]
- Li, S.; Hendraningrat, L.; Torsaeter, O. Improved oil recovery by hydrophilic silica nanoparticles suspension: 2 phase flow experimental studies. In Proceedings of the IPTC 2013: International Petroleum Technology Conference, Beijing, China, 26 March 2013. [Google Scholar]
- Sharma, T.; Iglauer, S.; Sangwai, J.S. Silica nanofluids in an oilfield polymer polyacrylamide: Interfacial properties, wettability alteration, and applications for chemical enhanced oil recovery. Ind. Eng. Chem. Res. 2016, 55, 12387–12397. [Google Scholar] [CrossRef]
- Al-Anssari, S.; Wang, S.; Barifcani, A.; Iglauer, S. Oil-water interfacial tensions of silica nanoparticle-surfactant formulations. Tenside Surfactants Deterg. 2017, 54, 334–341. [Google Scholar] [CrossRef]
- Xu, K.; Zhu, P.; Colon, T.; Huh, C.; Balhoff, M. A microfluidic investigation of the synergistic effect of nanoparticles and surfactants in macro-emulsion-based enhanced oil recovery. SPE J. 2017, 22, 459–469. [Google Scholar] [CrossRef]
- Binks, B.P.; Whitby, C.P. Nanoparticle silica-stabilised oil-in-water emulsions: Improving emulsion stability. Coll. Surf. A Physicochem. Eng. Asp. 2005, 253, 105–115. [Google Scholar] [CrossRef]
- Sharma, T.; Kumar, G.S.; Chon, B.H.; Sangwai, J.S. Thermal stability of oil-in-water pickering emulsion in the presence of nanoparticle, surfactant, and polymer. J. Ind. Eng. Chem. 2015, 22, 324–334. [Google Scholar] [CrossRef]
- Sharma, T.; Kumar, G.S.; Sangwai, J.S. Comparative effectiveness of production performance of pickering emulsion stabilized by nanoparticle–surfactant–polymerover surfactant–polymer (sp) flooding for enhanced oil recoveryfor brownfield reservoir. J. Pet. Sci. Eng. 2015, 129, 221–232. [Google Scholar] [CrossRef]
- Monfared, A.D.; Ghazanfari, M.H.; Jamialahmadi, M.; Helalizadeh, A. Adsorption of silica nanoparticles onto calcite: Equilibrium, kinetic, thermodynamic and dlvo analysis. Chem. Eng. J. 2015, 281, 334–344. [Google Scholar] [CrossRef]
- Hamouda, A.A.; Rezaei Gomari, K.A. Influence of temperature on wettability alteration of carbonate reservoirs. In Proceedings of the SPE/DOE Symposium on Improved Oil Recovery, Tulsa, OK, USA, 22–26 April 2006; Society of Petroleum Engineers: Richardson, TX, USA, 2006. [Google Scholar]
- Hamouda, A.; Valderhaug, O.; Munaev, R.; Stangeland, H. Possible mechanisms for oil recovery from chalk and sandstone rocks by low salinity water (lsw). In Proceedings of the SPE Improved Oil Recovery Symposium, Tulsa, OK, USA, 12–16 April 2014; Society of Petroleum Engineers: Richardson, TX, USA, 2014. [Google Scholar]
- Zahid, A.; Shapiro, A.A.; Skauge, A. Experimental studies of low salinity water flooding carbonate: A new promising approach. In Proceedings of the SPE EOR Conference at Oil and Gas West Asia, Muscat, Oman, 16–18 April 2012; Society of Petroleum Engineers: Richardson, TX, USA, 2012. [Google Scholar]
- Mahani, H.; Keya, A.L.; Berg, S.; Bartels, W.-B.; Nasralla, R.; Rossen, W.R. Insights into the mechanism of wettability alteration by low-salinity flooding (lsf) in carbonates. Energy Fuels 2015, 29, 1352–1367. [Google Scholar] [CrossRef]
- Al-Nofli, K.; Pourafshary, P.; Mosavat, N.; Shafiei, A. Effect of initial wettability on performance of smart water flooding in carbonate reservoirs—An experimental investigation with ior implications. Energies 2018, 11, 1394. [Google Scholar] [CrossRef]
- Wang, X.; Alvarado, V. Kaolinite and silica dispersions in low-salinity environments: Impact on a water-in-crude oil emulsion stability. Energies 2011, 4, 1763. [Google Scholar] [CrossRef]
- Hamouda, A.A.; Gupta, S. Enhancing oil recovery from chalk reservoirs by a low-salinity water flooding mechanism and fluid/rock interactions. Energies 2017, 10, 576. [Google Scholar] [CrossRef]
- Rezaei Gomari, S.; Joseph, N. Study of the effect of clay particles on low salinity water injection in sandstone reservoirs. Energies 2017, 10, 322. [Google Scholar] [CrossRef]
- Hamouda, A.A.; Maevskiy, E. Oil recovery mechanism (s) by low salinity brines and their interaction with chalk. Energy Fuels 2014, 28, 6860–6868. [Google Scholar] [CrossRef]
- Abhishek, R.; Hamouda, A.A. Effect of various silica nanofluids: Reduction of fines migrations and surface modification of berea sandstone. Appl. Sci. 2017, 7, 1216. [Google Scholar] [CrossRef]
- Singh, R.; Mohanty, K.K. Synergy between nanoparticles and surfactants in stabilizing foams for oil recovery. Energy Fuels 2015, 29, 467–479. [Google Scholar] [CrossRef]
- Frykman, P. Spatial variability in petrophysical properties in upper maastrichtian chalk outcrops at stevns klint, denmark. Mar. Pet. Geol. 2001, 18, 1041–1062. [Google Scholar] [CrossRef]
- Tabrizy, V.A.; Denoyel, R.; Hamouda, A. Characterization of wettability alteration of calcite, quartz and kaolinite: Surface energy analysis. Coll. Surf. A Physicochem. Eng. Asp. 2011, 384, 98–108. [Google Scholar] [CrossRef]
- Griffith, N.; Ahmad, Y.; Daigle, H.; Huh, C. Nanoparticle-stabilized natural gas liquid-in-water emulsions for residual oil recovery. In Proceedings of the SPE Improved Oil Recovery Conference, Tulsa, OK, USA, 11–13 April 2016; Society of Petroleum Engineers: Richardson, TX, USA, 2016. [Google Scholar]
- Murphy, M.J. Experimental Analysis of Electrostatic and Hydrodynamic Forces Affecting Nanoparticle Retention in Porous Media. Ph.D. Thesis, The University of Texas at Austin Department of Petroleum and Geosystems Engineering, Austin, TX, USA, 2012. [Google Scholar]
- Stumm, W.; Morgan, J.J. Aquatic chemistry. In An Introduction Emphasizing Chemical Equilibria in Natural Waters; Wiley-Interscience: New York, NY, USA, 1970. [Google Scholar]
- Hendraningrat, L.; Torsæter, O. A study of water chemistry extends the benefits of using silica-based nanoparticles on enhanced oil recovery. Appl. Nanosci. 2016, 6, 83–95. [Google Scholar] [CrossRef]
- Dehghan Monfared, A.; Ghazanfari, M.H.; Jamialahmadi, M.; Helalizadeh, A. Potential application of silica nanoparticles for wettability alteration of oil–wet calcite: A mechanistic study. Energy Fuels 2016, 30, 3947–3961. [Google Scholar] [CrossRef]
- Austad, T.; Shariatpanahi, S.; Strand, S.; Black, C.; Webb, K. Conditions for a low-salinity enhanced oil recovery (eor) effect in carbonate oil reservoirs. Energy Fuels 2011, 26, 569–575. [Google Scholar] [CrossRef]
- Chukwudeme, E.; Hamouda, A. Oil recovery from polar components (asphaltene and sa) treated chalk rocks by low salinity water and water containing so42− and mg2+ at different temperatures. Coll. Surf. A Physicochem. Eng. Asp. 2009, 336, 174–182. [Google Scholar] [CrossRef]
- Yi, Z.; Sarma, H.K. Improving waterflood recovery efficiency in carbonate reservoirs through salinity variations and ionic exchanges: A promising low-cost “smart-waterflood” approach. In Proceedings of the Abu Dhabi International Petroleum Conference and Exhibition, Abu Dhabi, UAE, 11–14 November 2012; Society of Petroleum Engineers: Abu Dhabi, UAE, 2012. [Google Scholar]
- Tang, G.; Morrow, N.R. Salinity, temperature, oil composition, and oil recovery by waterflooding. SPE Reserv. Eng. 1997, 12, 269–276. [Google Scholar] [CrossRef]
- Petrovich, R.; Hamouda, A. Dolomitization of ekofisk oil field reservoir chalk by injected seawater. In Proceedings of the Ninth International Symposium on Water–Rock Interactions, Taupo, New Zealand, 30 March–3 April 1998. [Google Scholar]
- Van Oort, E.; Van Velzen, J.; Leerlooijer, K. Impairment by suspended solids invasion: Testing and prediction. SPE Prod. Facil. 1993, 8, 178–184. [Google Scholar] [CrossRef]
- Jolma, I.; Strand, D.; Stavland, A.; Fjelde, I.; Hatzignatiou, D. When size matters-polymer injectivity in chalk matrix. In Proceedings of the IOR 2017-19th European Symposium on Improved Oil Recovery, Stavanger, Norway, 24–27 April 2017. [Google Scholar]
Figure 1.
Schematic of the core flooding setup.

Figure 2.
(a) Average particle size of the NPs dispersed in deionized water (DIW), low salinity water (LSW) and synthetic seawater (SSW) measured at varying temperatures. (b) Zeta potential measurements (25 °C) of the NPs in DIW, LSW and SSW.
Figure 2.
(a) Average particle size of the NPs dispersed in deionized water (DIW), low salinity water (LSW) and synthetic seawater (SSW) measured at varying temperatures. (b) Zeta potential measurements (25 °C) of the NPs in DIW, LSW and SSW.

Figure 3.
(a) Adsorption of silica NPs on Calcite surface. (b) SEM image of NPs adsorbed on chalk core with DP 9711 nanofluid at 1 g/L concentration prepared in DIW.
Figure 3.
(a) Adsorption of silica NPs on Calcite surface. (b) SEM image of NPs adsorbed on chalk core with DP 9711 nanofluid at 1 g/L concentration prepared in DIW.

Figure 4.
(a) NP and tracer concentration profile for SK1. (b) Effluent pH profile for SK1 (c) Effluent Ca concentration for SK1 (with NPs) and SK2 (without NPs).
Figure 4.
(a) NP and tracer concentration profile for SK1. (b) Effluent pH profile for SK1 (c) Effluent Ca concentration for SK1 (with NPs) and SK2 (without NPs).

Figure 5.
(a) NP and tracer concentration profile, (b) effluent pH profile and (c) effluent Ca2+ and Mg2+ concentration for SK3 in SSW.
Figure 5.
(a) NP and tracer concentration profile, (b) effluent pH profile and (c) effluent Ca2+ and Mg2+ concentration for SK3 in SSW.

Figure 6.
(a) NP and tracer concentration profile, (b) effluent pH profile and (c) effluent Ca2+ and Mg2+ concentration for SK4 in LSW.
Figure 6.
(a) NP and tracer concentration profile, (b) effluent pH profile and (c) effluent Ca2+ and Mg2+ concentration for SK4 in LSW.

Figure 7.
Effluent pH profiles for SK5-SSW (a), SK6-LSW (b) and SK7-mixed (c).

Figure 8.
Effluent Ca2+ and Mg2+ concentrations for SK5-SSW (a), SK6-LSW (b) and SK7-mixed (c).

Figure 9.
Differential pressure drop (dP) profile for SK5-SSW (a), SK6-LSW (b) and SK7-mixed (c).

Figure 10.
Tentative observation of incremental recovery from SK5-SSW, SK6-LSW and SK7-mixed.


Table 1.
Synthetic oil properties.
| Temperature °C | Viscosity (cP) | Density (g/mL) |
|---|---|---|
| 20 | 0.92 | 0.73 |
| 50 | 0.5802 | 0.7683 |
| 70 | 0.4812 | 0.7525 |
Table 2.
Ion concentration in the brines.
| Ion | SSW (mol/L) | LSW (mol/L) |
|---|---|---|
| HCO3− | 0.002 | 0.0002 |
| Cl– | 0.525 | 0.0525 |
| SO42– | 0.0240 | 0.0024 |
| Mg2+ | 0.045 | 0.0045 |
| Ca2+ | 0.013 | 0.0013 |
| Na+ | 0.450 | 0.045 |
| K+ | 0.010 | 0.0010 |
Table 3.
List of experiments to test dynamic adsorption of nanoparticles (NPs) in chalk.
| Core Id | Porosity (%) | Permeability (mD) | Length (cm) | Dia (cm) | Pre/Post Flush Fluid | Slug Composition |
|---|---|---|---|---|---|---|
| SK1 | 48.10 | 3.9 | 5.31 | 3.78 | DIW | 1 (g/L) DP in DIW with 0.1M LiCl tracer |
| SK2 | 49.00 | 3.9 | 7.80 | 3.78 | DIW | 90 μL 0.1M HCl + 0.1M LiCl in DIW |
| SK3 | 51.71 | 3.9 | 3.9 | 3.78 | SSW | 1 g/L DP in SSW + 0.1M LiCl |
| SK4 | 47.38 | 3.9 | 3.35 | 3.78 | LSW | 1 g/L DP in LSW + 0.1M LiCl |
Table 4.
List of nanofluid experiments with hydrocarbons.
| Core Id | Porosity (%) | Permeability (mD) | Length (cm) | Dia (cm) | Swi | Primary Fluid | Secondary Fluid (Nanofluid) |
|---|---|---|---|---|---|---|---|
| SK5 | 50.7 | 3.9 | 8.83 | 3.785 | 0.13 | SSW | DP (1 g/L) in SSW |
| SK6 | 50 | 3.9 | 5.96 | 3.785 | 0.28 | LSW | DP (1 g/L) in LSW |
| SK7 | 50.24 | 3.9 | 4.658 | 3.785 | 0.275 | SSW | DP (1 g/L) in LSW |
© 2018 by the authors. Licensee MDPI, Basel, Switzerland. This article is an open access article distributed under the terms and conditions of the Creative Commons Attribution (CC BY) license (http://creativecommons.org/licenses/by/4.0/).
Share and Cite
MDPI and ACS Style
Abhishek, R.; Hamouda, A.A.; Ayoub, A. Effect of Silica Nanoparticles on Fluid/Rock Interactions during Low Salinity Water Flooding of Chalk Reservoirs. Appl. Sci. 2018, 8, 1093. https://doi.org/10.3390/app8071093
AMA Style
Abhishek R, Hamouda AA, Ayoub A. Effect of Silica Nanoparticles on Fluid/Rock Interactions during Low Salinity Water Flooding of Chalk Reservoirs. Applied Sciences. 2018; 8(7):1093. https://doi.org/10.3390/app8071093
Chicago/Turabian StyleAbhishek, Rockey, Aly A. Hamouda, and Amr Ayoub. 2018. "Effect of Silica Nanoparticles on Fluid/Rock Interactions during Low Salinity Water Flooding of Chalk Reservoirs" Applied Sciences 8, no. 7: 1093. https://doi.org/10.3390/app8071093
Note that from the first issue of 2016, this journal uses article numbers instead of page numbers. See further details here.