Experience Matters: The Effects of Hypothetical versus Experiential Delays and Magnitudes on Impulsive Choice in Delay Discounting Tasks

 ,
,
Abstract
:1. Introduction
2. Materials and Methods
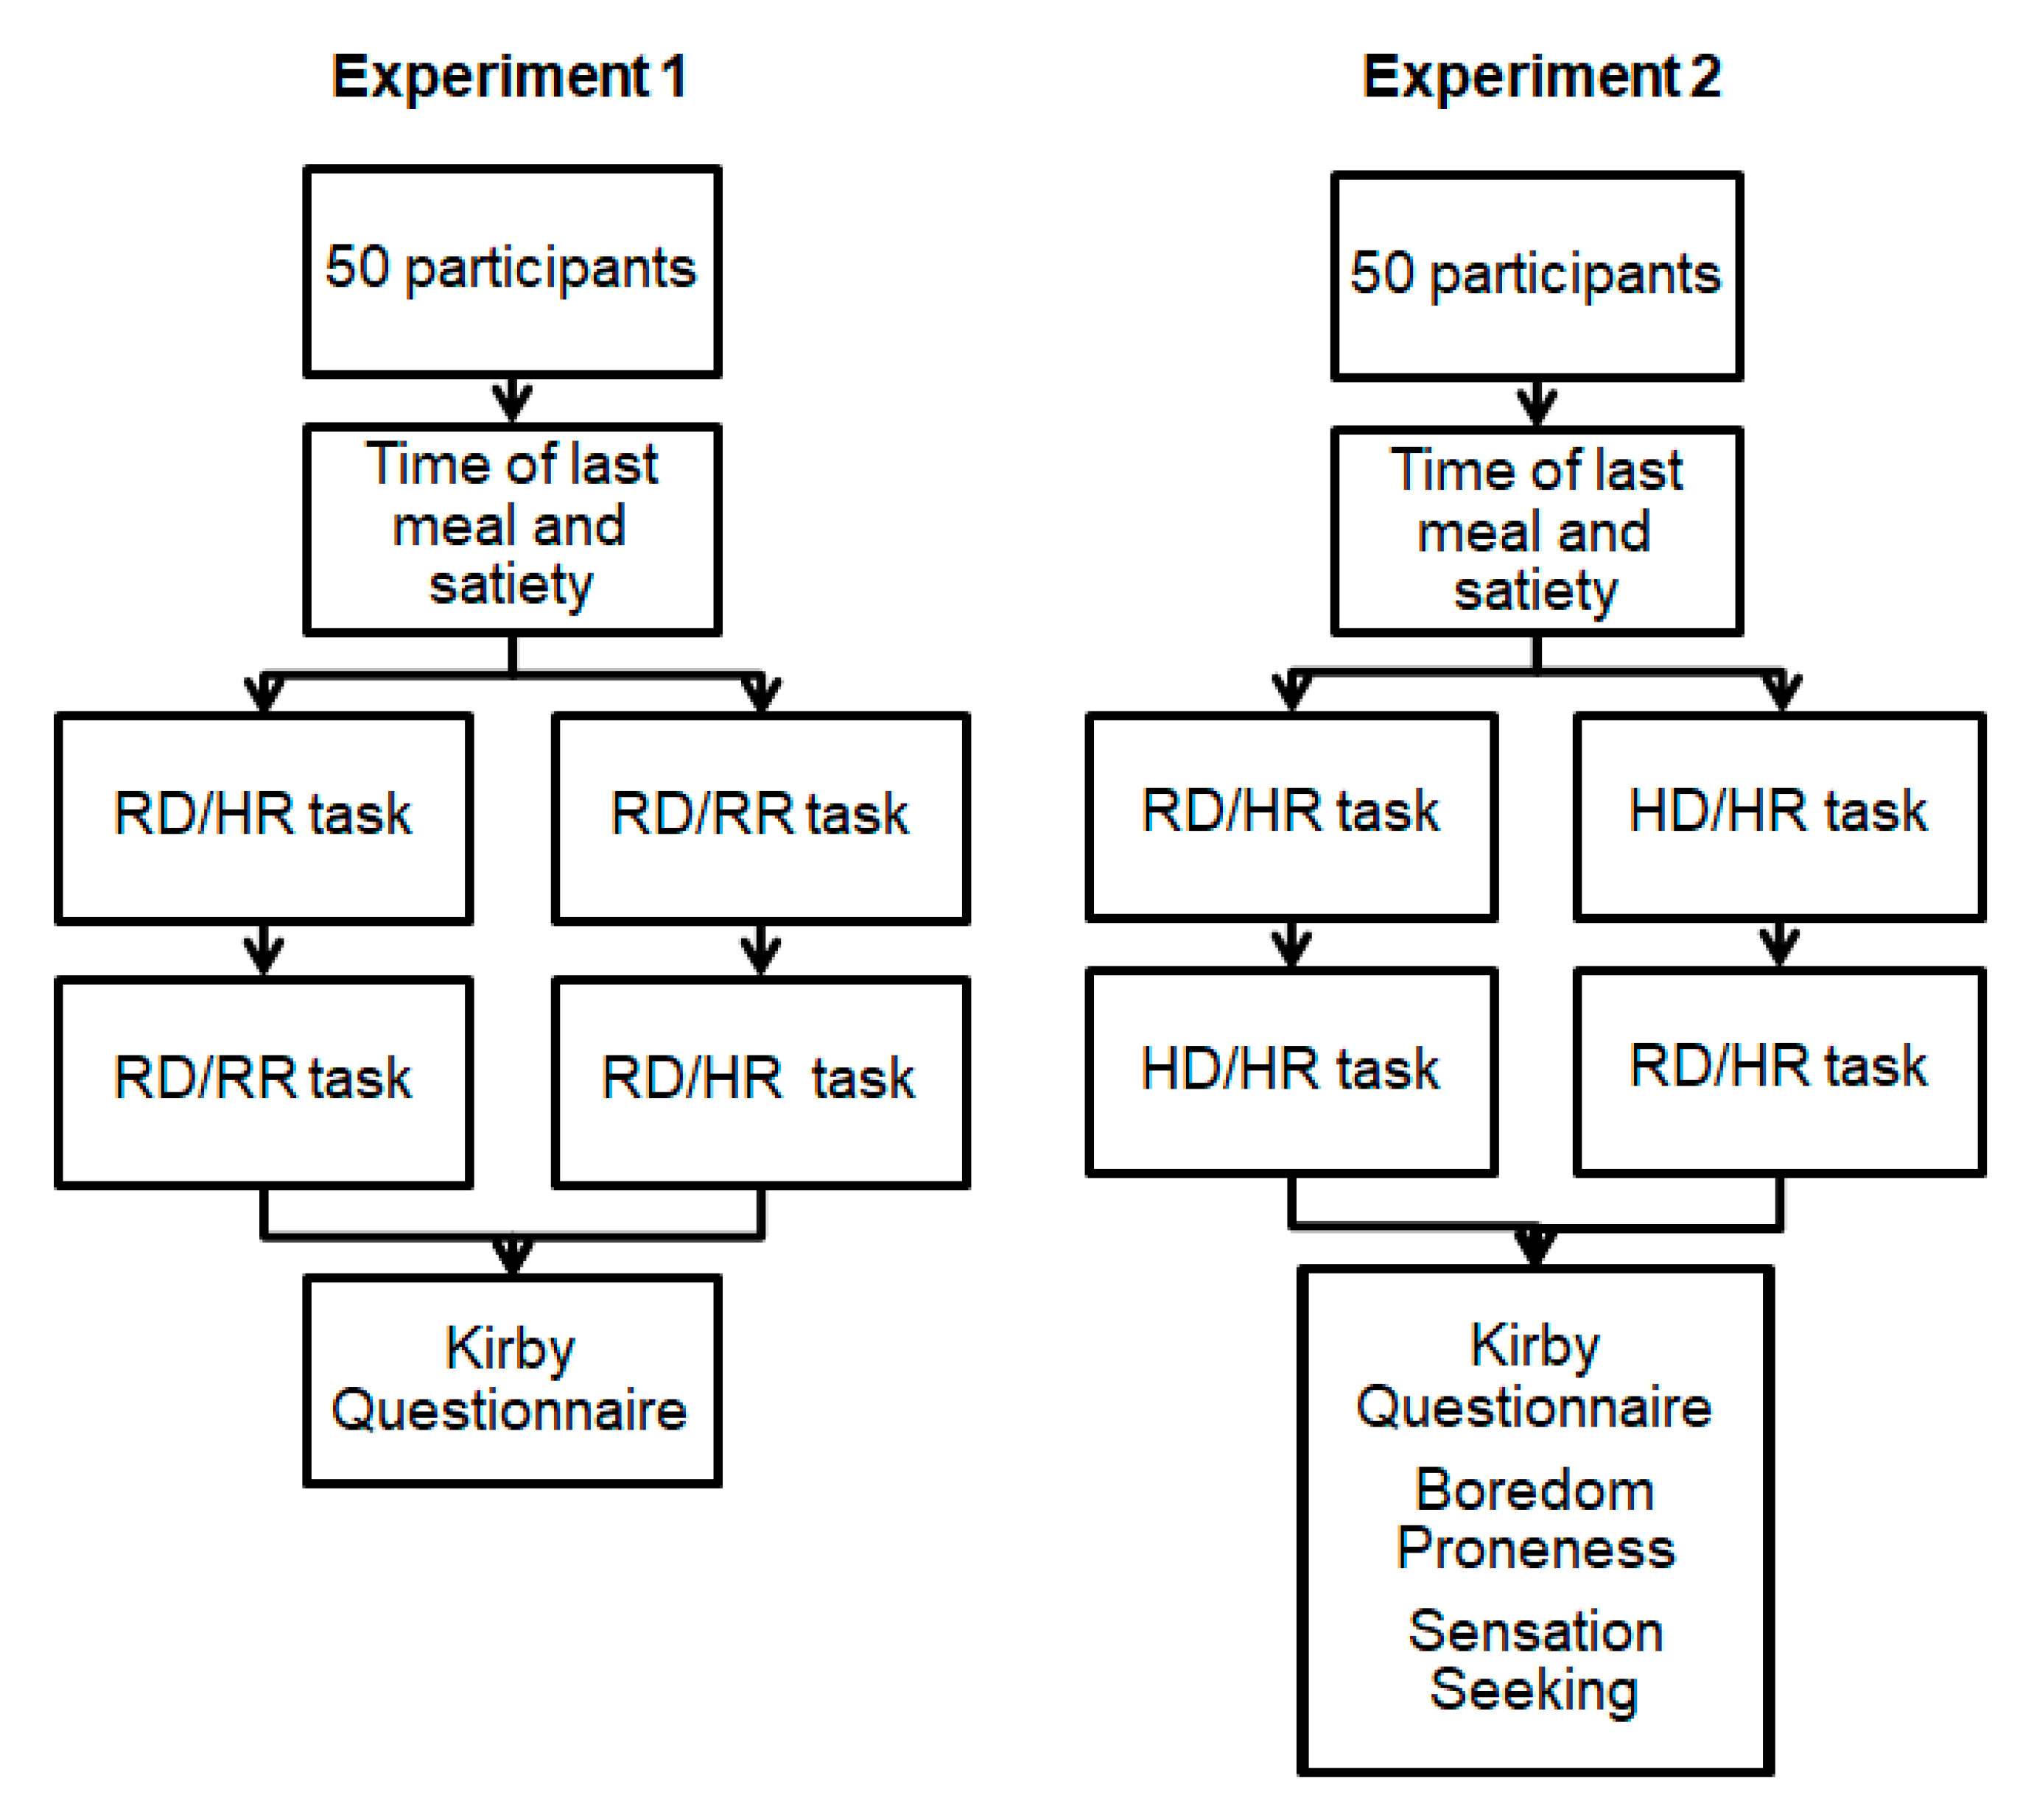
2.1. Subjects
2.2. Procedures
2.3. Novel Impulsive Choice Tasks
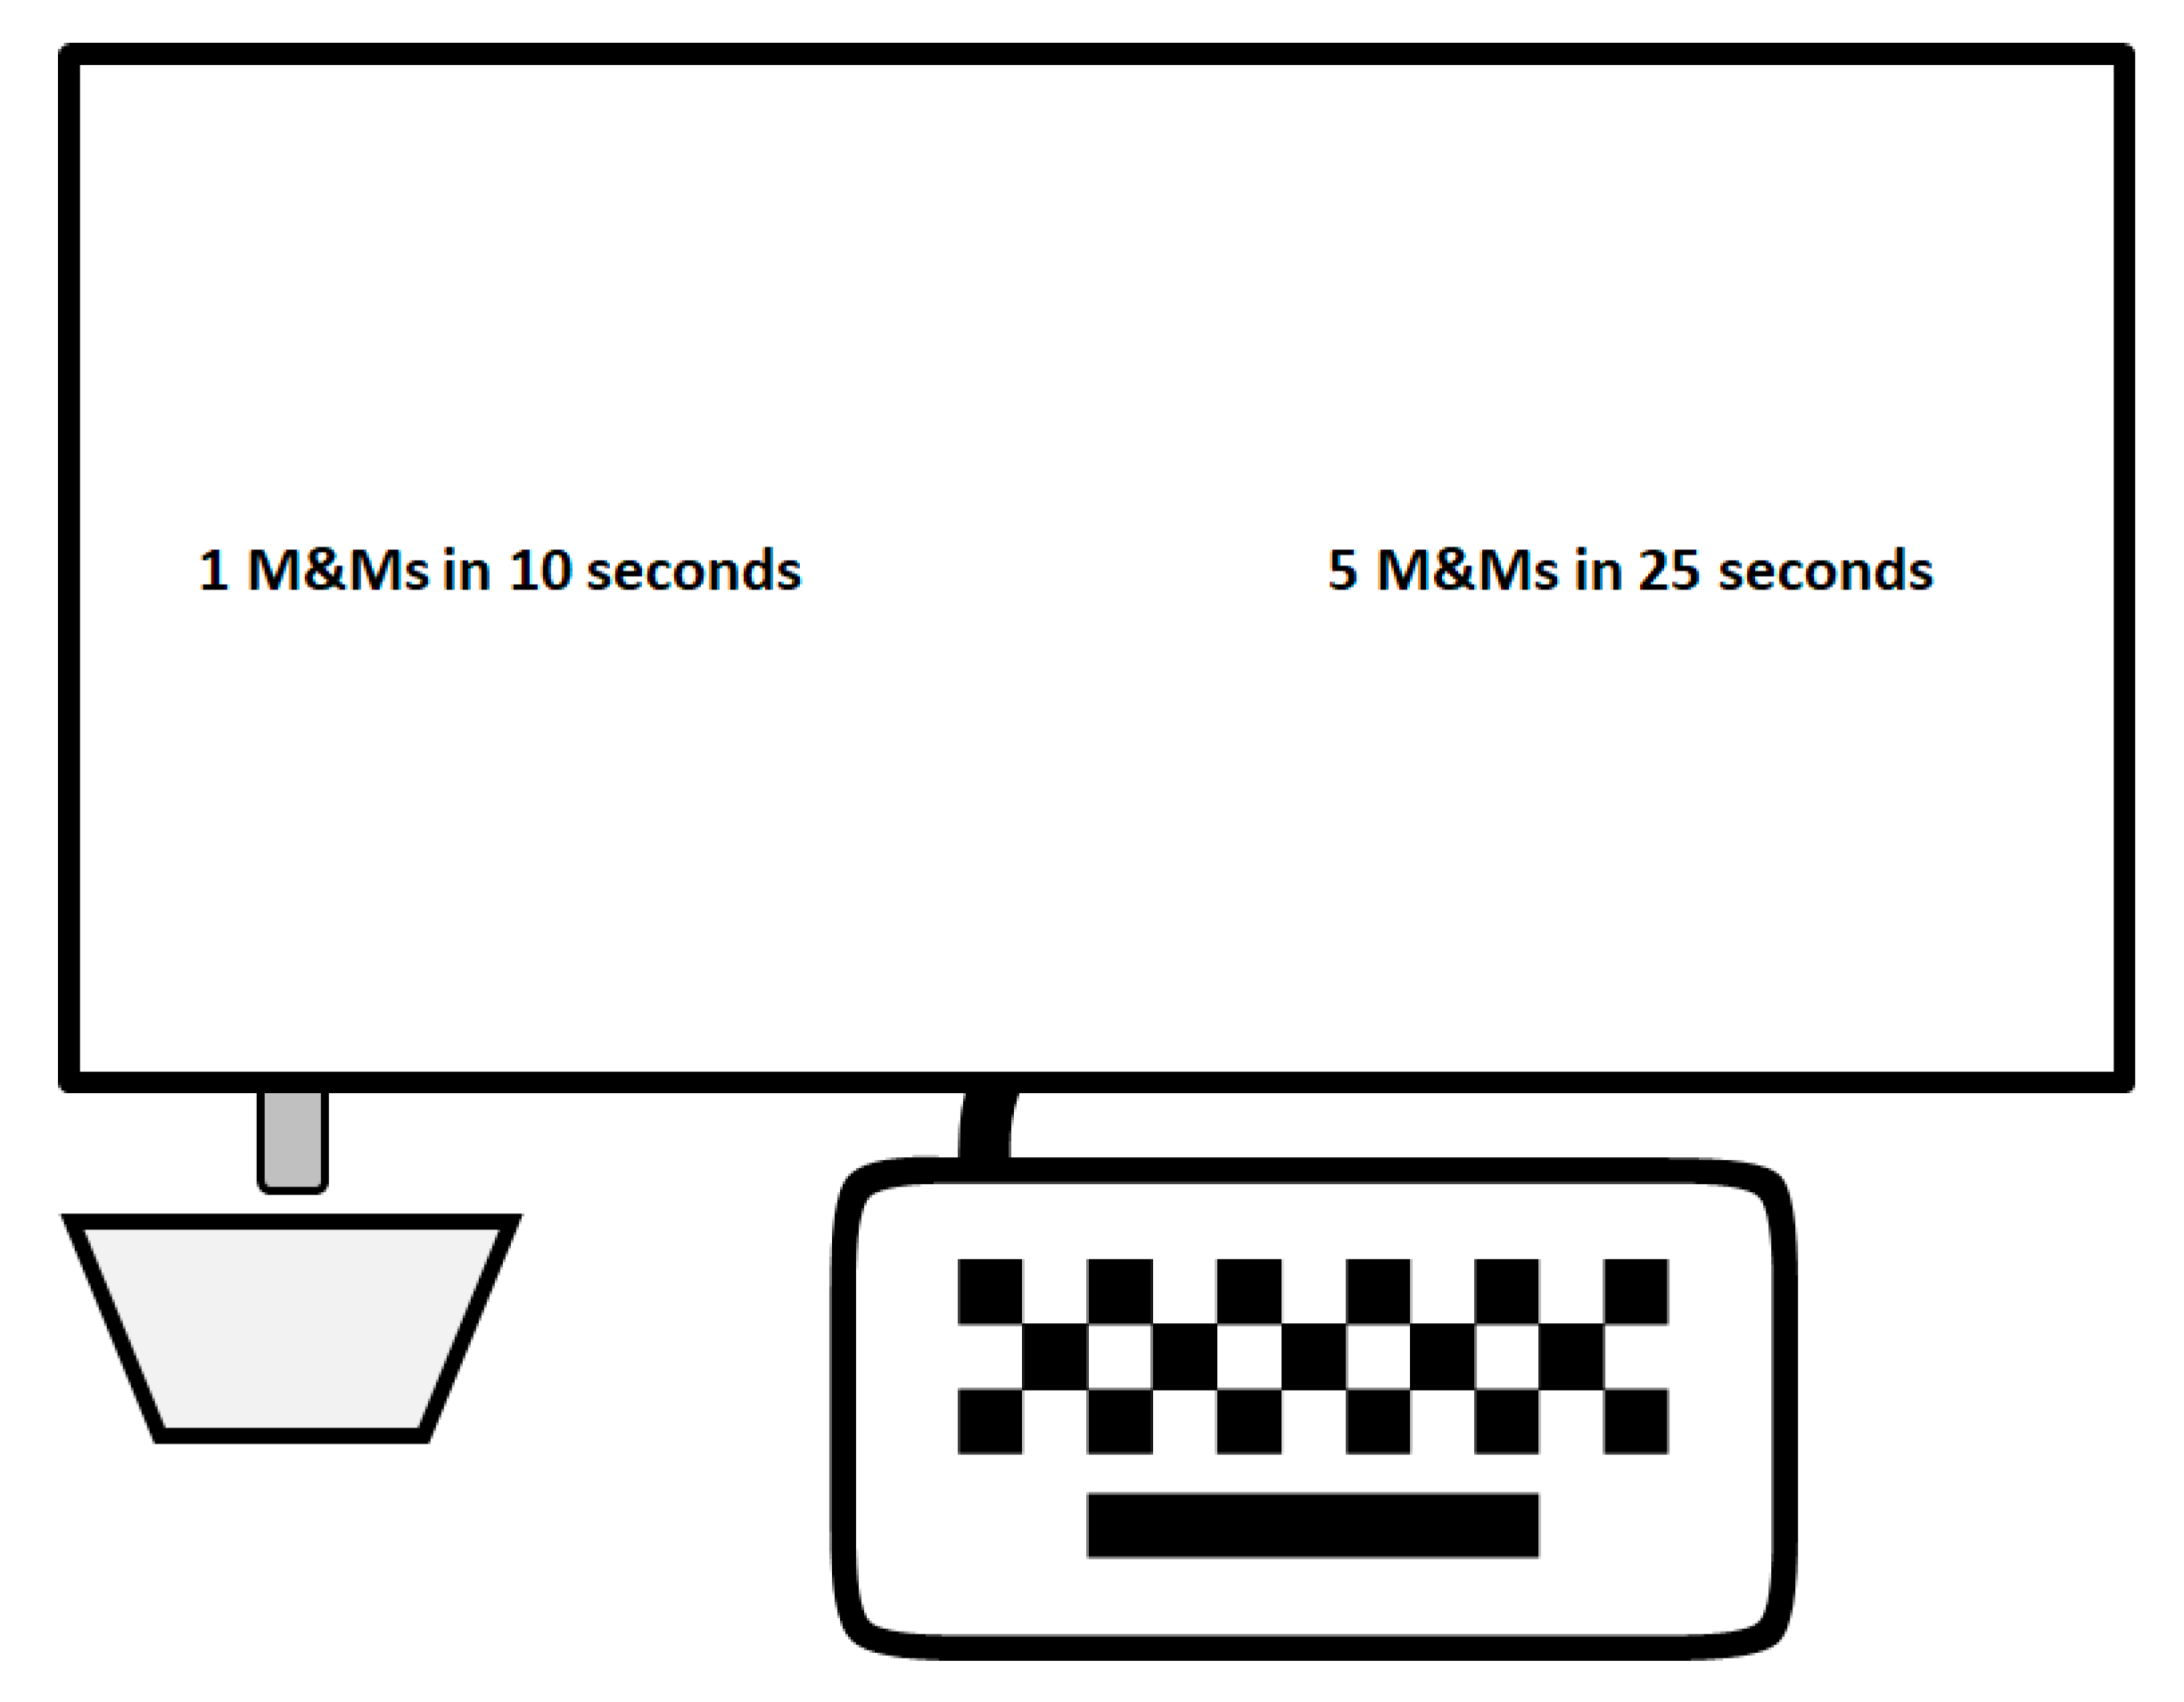
2.3.1. Task Overview
2.3.2. Instructions
2.3.3. Apparatus
2.4. Questionnaires
2.4.1. Kirby Questionnaire
2.4.2. Boredom Proneness Scale (BPS)
2.4.3. Sensation Seeking Scale (SSS)
2.5. Data Analysis
2.5.1. Impulsive Choice Tasks
2.5.2. Cross-Task Correlations
3. Results
3.1. Novel Impulsive Choice Task Comparisons
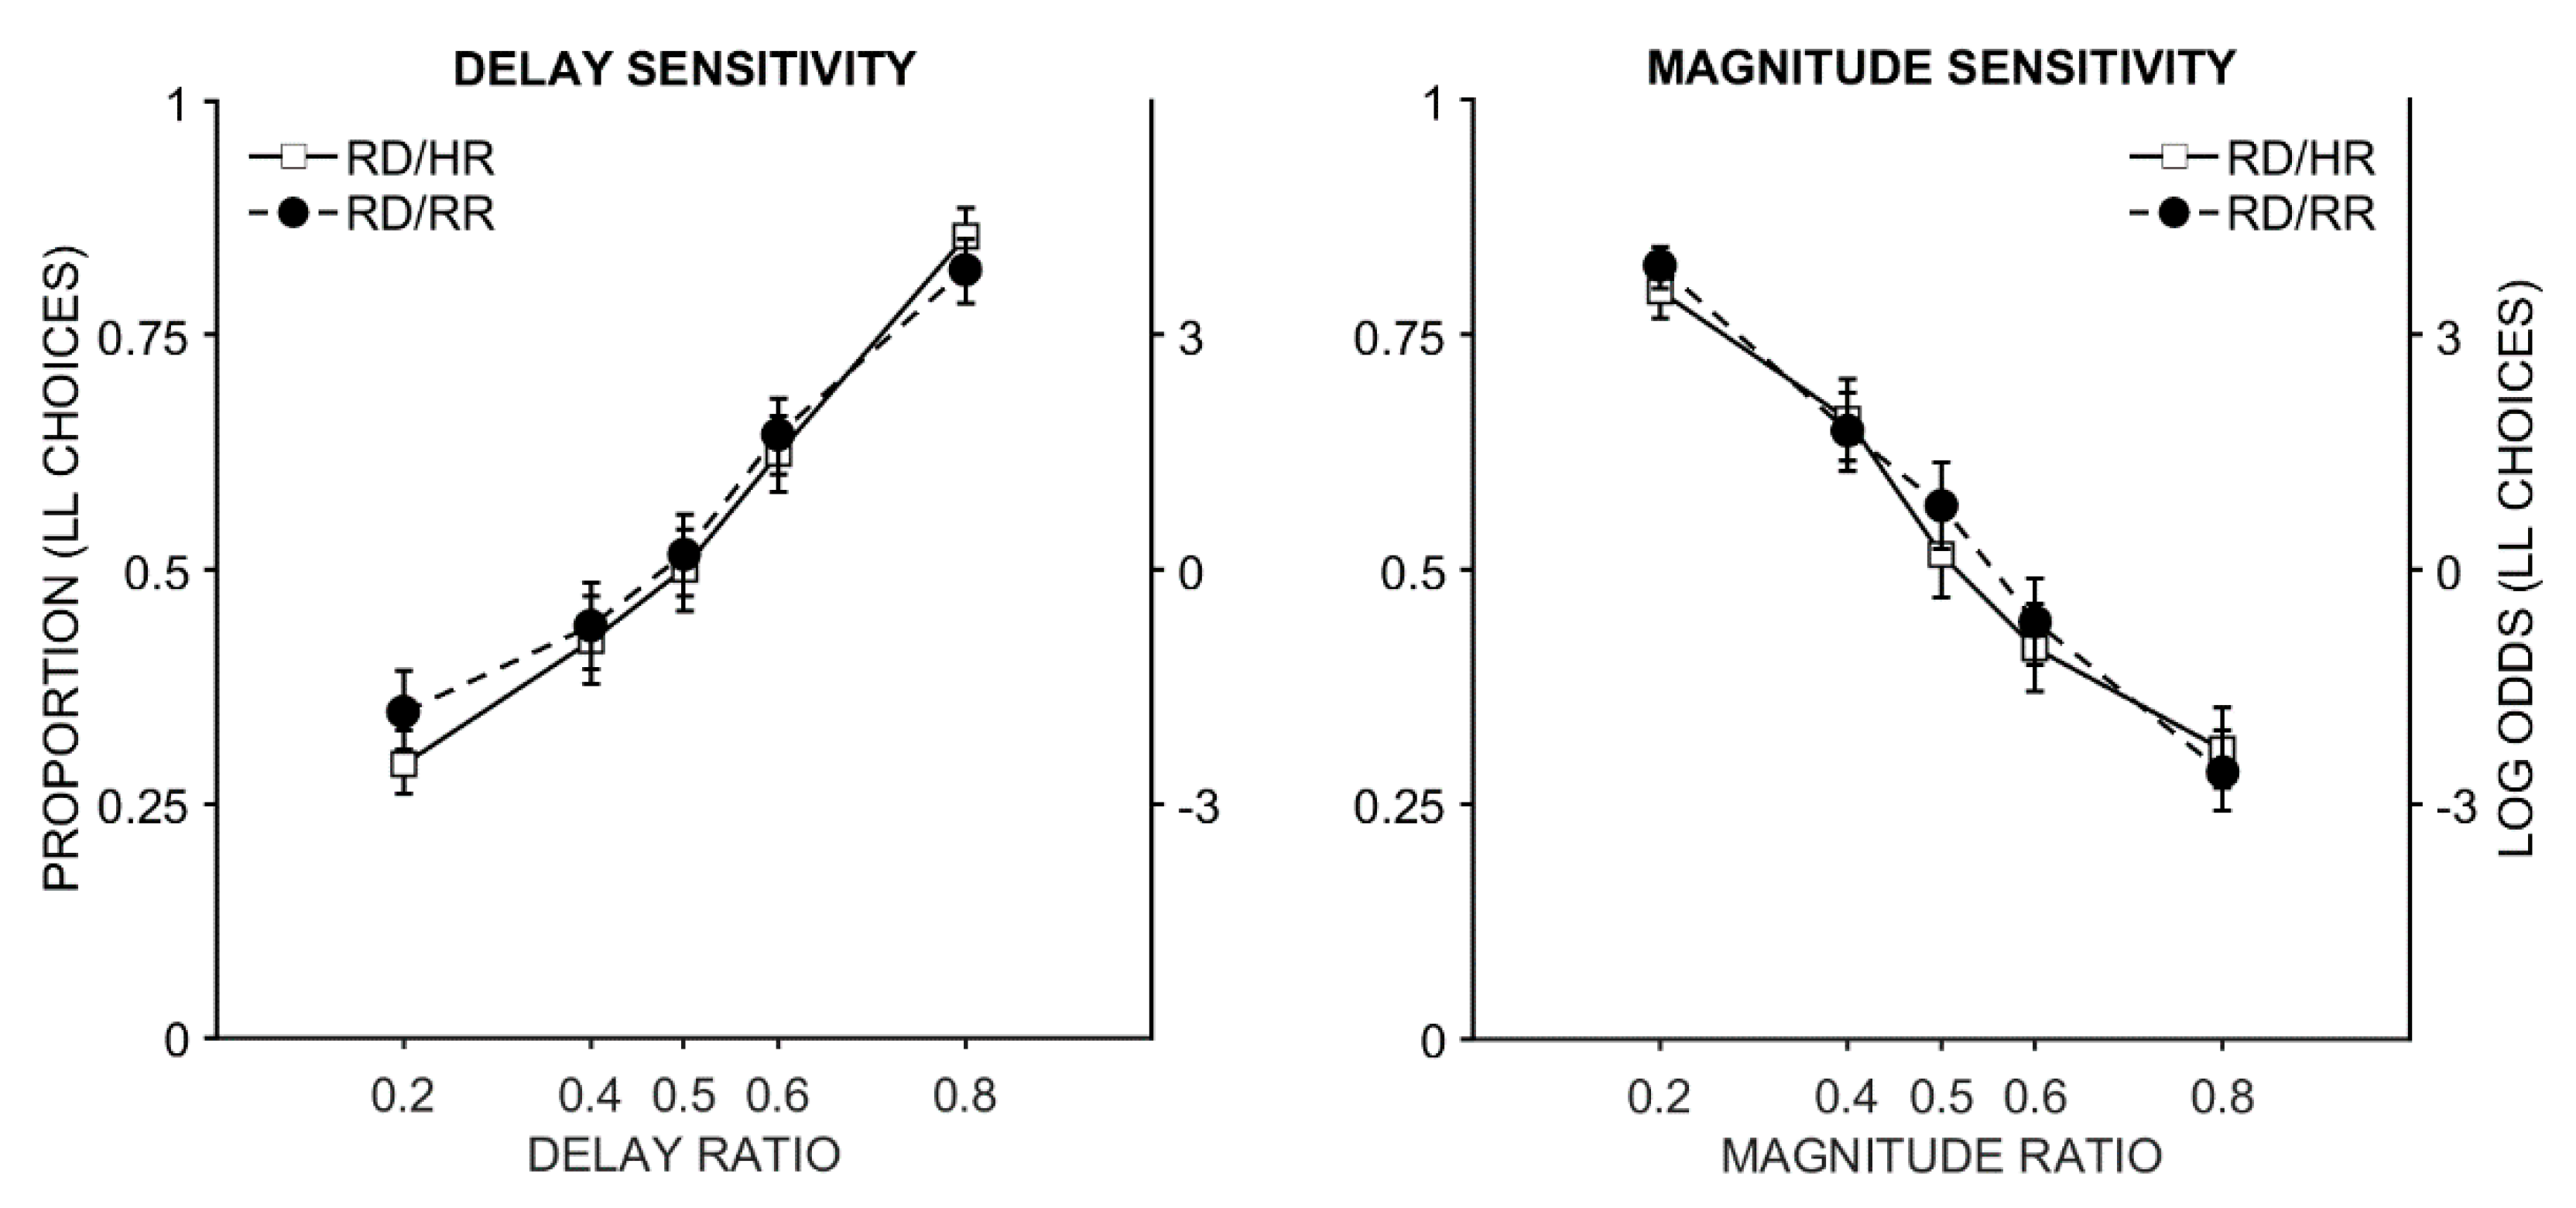
3.1.1. Experiment 1
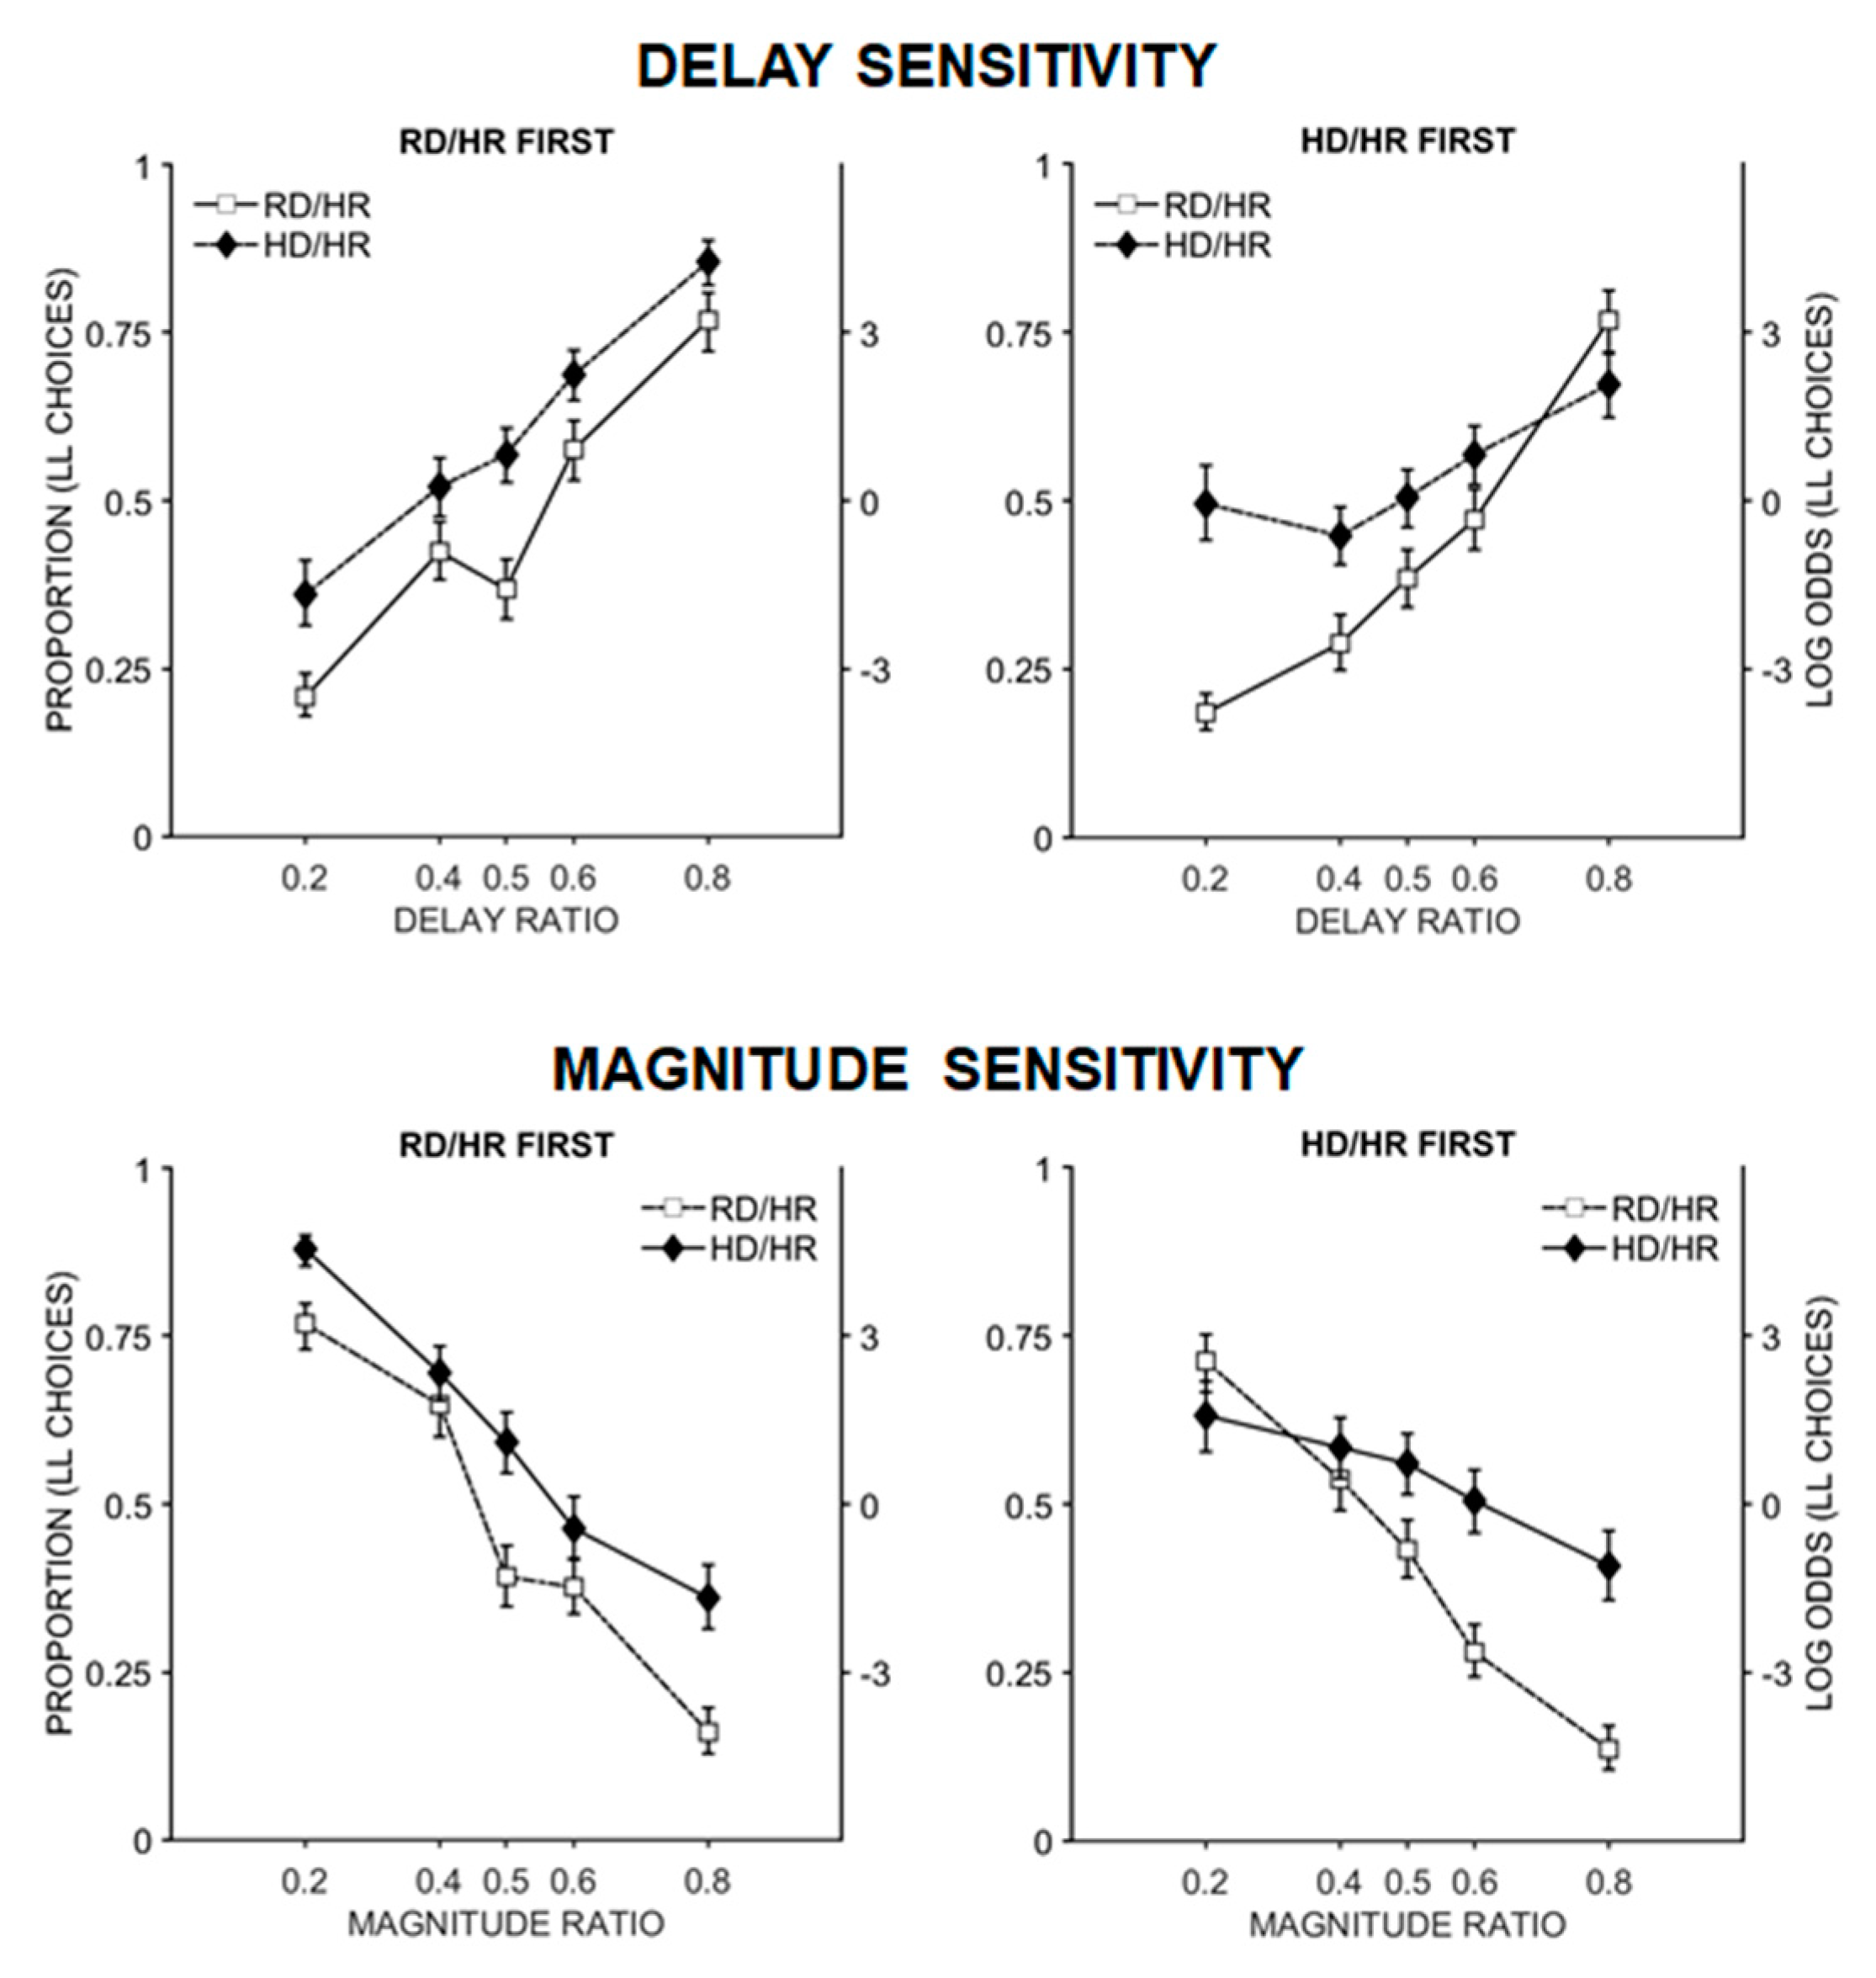
3.1.2. Experiment 2
3.2. Cross-Task Correlations
4. Discussion
5. Conclusions
Author Contributions
Funding
Acknowledgments
Conflicts of Interest
Appendix A

| Item | SS Amount | LL Amount | SS Delay | LL Delay | Delay Ratio | Mag Ratio |
|---|---|---|---|---|---|---|
| 1 | 1 | 5 | 5 | 25 | 0.2 | 0.2 |
| 2 | 2 | 4 | 5 | 25 | 0.2 | 0.5 |
| 3 | 4 | 5 | 5 | 25 | 0.2 | 0.8 |
| 4 | 2 | 5 | 10 | 25 | 0.4 | 0.4 |
| 5 | 3 | 5 | 10 | 25 | 0.4 | 0.6 |
| 6 | 1 | 5 | 15 | 30 | 0.5 | 0.2 |
| 7 | 2 | 4 | 15 | 30 | 0.5 | 0.5 |
| 8 | 4 | 5 | 15 | 30 | 0.5 | 0.8 |
| 9 | 2 | 5 | 15 | 25 | 0.6 | 0.4 |
| 10 | 3 | 5 | 15 | 25 | 0.6 | 0.6 |
| 11 | 1 | 5 | 20 | 25 | 0.8 | 0.2 |
| 12 | 2 | 4 | 20 | 25 | 0.8 | 0.5 |
| 13 | 4 | 5 | 20 | 25 | 0.8 | 0.8 |
| 14 | 2 | 5 | 5 | 25 | 0.2 | 0.4 |
| 15 | 3 | 5 | 5 | 25 | 0.2 | 0.6 |
| 16 | 1 | 5 | 10 | 25 | 0.4 | 0.2 |
| 17 | 2 | 4 | 10 | 25 | 0.4 | 0.5 |
| 18 | 4 | 5 | 10 | 25 | 0.4 | 0.8 |
| 19 | 2 | 5 | 15 | 30 | 0.5 | 0.4 |
| 20 | 3 | 5 | 15 | 30 | 0.5 | 0.6 |
| 21 | 1 | 5 | 15 | 25 | 0.6 | 0.2 |
| 22 | 2 | 4 | 15 | 25 | 0.6 | 0.5 |
| 23 | 4 | 5 | 15 | 25 | 0.6 | 0.8 |
| 24 | 2 | 5 | 20 | 25 | 0.8 | 0.4 |
| 25 | 3 | 5 | 20 | 25 | 0.8 | 0.6 |
References
- Ainslie, G.W. Impulse control in pigeons. J. Exp. Anal. Behav. 1974, 21, 485–489. [Google Scholar] [CrossRef] [PubMed] [Green Version]
- MacKillop, J.; Amlung, M.T.; Few, L.R.; Ray, L.A.; Sweet, L.H.; Munafò, M. Delayed reward discounting and addictive behavior: A meta-analysis. Psychopharmacology 2011, 216, 305–321. [Google Scholar] [CrossRef] [PubMed] [Green Version]
- Alessi, S.M.; Petry, N.M. Pathological gambling severity is associated with impulsivity in a delay discounting procedure. Behav. Process. 2003, 64, 345–354. [Google Scholar] [CrossRef]
- Amlung, M.; Petker, T.; Jackson, J.; Balodis, I.; MacKillop, J. Steep discounting of delayed monetary and food rewards in obesity: A meta-analysis. Psychol. Med. 2016, 46, 2423–2434. [Google Scholar] [CrossRef] [PubMed] [Green Version]
- Scheres, A.; Sumiya, M.; Thoeny, A.L. Studying the relation between temporal reward discounting tasks used in populations with ADHD: A factor analysis. Int. J. Methods Psychiatr. Res. 2010, 19, 167–176. [Google Scholar] [CrossRef] [PubMed]
- Wilson, V.B.; Mitchell, S.H.; Musser, E.D.; Schmitt, C.F.; Nigg, J.T. Delay discounting of reward in ADHD: Application in young children. J. Child Psychol. Psychiatry 2011, 52, 256–264. [Google Scholar] [CrossRef] [PubMed] [Green Version]
- Bickel, W.K.; Athamneh, L.N.; Basso, J.C.; Mellis, A.M.; DeHart, W.B.; Craft, W.H.; Pope, D. Excessive discounting of delayed reinforcers as a trans-disease process. Curr. Opin. Psychol. 2019, 30, 59–64. [Google Scholar] [CrossRef]
- Bickel, W.K.; Jarmolowicz, D.P.; Mueller, E.T.; Koffarnus, M.N.; Gatchalian, K.M. Excessive discounting of delayed reinforcers as a trans-disease process contributing to addiction and other disease-related vulnerabilities: Emerging evidence. Pharmacol. Ther. 2012, 134, 287–297. [Google Scholar] [CrossRef] [Green Version]
- Schlam, T.R.; Wilson, N.L.; Shoda, Y.; Mischel, W.; Ayduk, O. Preschoolers’ delay of gratification predicts their body mass 30 years later. J. Pediatrics 2013, 162, 90–93. [Google Scholar] [CrossRef] [Green Version]
- Rachlin, H.; Raineri, A.; Cross, D. Subjective probability and delay. J. Exp. Anal. Behav. 1991, 55, 233–244. [Google Scholar] [CrossRef] [Green Version]
- Mischel, W.; Ebbesen, E.B. Attention in delay of gratification. J. Personal. Soc. Psychol. 1970, 16, 329. [Google Scholar] [CrossRef] [Green Version]
- Odum, A.L. Delay discounting: I’m ak, you’re ak. J. Exp. Anal. Behav. 2011, 96, 427–439. [Google Scholar] [CrossRef] [PubMed] [Green Version]
- Mazur, J.E. An adjusting procedure for studying delayed reinforcement, in Quantitative analyses of behavior. In The Effect of Delay and of Intervening Events on Reinforcer Value; Commons, M.L., Mazur, J.E., Nevin, J.A., Eds.; Erlbaum: Hillsdale, NJ, USA, 1987; Volume 5, pp. 55–73. [Google Scholar]
- Bickel, W.K.; Mueller, E.T. Towards the study of trans-disease processes: A novel approach with special reference to the study of co-morbidity. J. Dual Diagn. 2009, 5, 131–138. [Google Scholar] [CrossRef] [PubMed]
- Madden, G.J.; Begotka, A.M.; Raiff, B.R.; Kastern, L.L. Delay discounting of real and hypothetical rewards. Exp. Clin. Psychopharmacol. 2003, 11, 139. [Google Scholar] [CrossRef] [PubMed]
- Robertson, S.H.; Rasmussen, E.B. Comparison of potentially real versus hypothetical food outcomes in delay and probability discounting tasks. Behav. Process. 2018, 149, 8–15. [Google Scholar] [CrossRef] [PubMed]
- Lawyer, S.R.; Schoepflin, F.; Green, R.; Jenks, C. Discounting of hypothetical and potentially real outcomes in nicotine-dependent and nondependent samples. Exp. Clin. Psychopharmacol. 2011, 19, 263–274. [Google Scholar] [CrossRef] [PubMed] [Green Version]
- Green, R.M.; Lawyer, S.R. Steeper delay and probability discounting of potentially real versus hypothetical cigarettes (but not money) among smokers. Behav. Process. 2014, 108, 50–56. [Google Scholar] [CrossRef] [PubMed]
- Barlow, P.; Reeves, A.; McKee, M.; Galea, G.; Stuckler, D. Unhealthy diets, obesity and time discounting: A systematic literature review and network analysis. Obesity Rev. 2016, 17, 810–819. [Google Scholar] [CrossRef] [Green Version]
- Rasmussen, E.B.; Lawyer, S.R.; Reilly, W. Percent body fat is related to delay and probability discounting for food in humans. Behav. Process. 2010, 83, 23–30. [Google Scholar] [CrossRef]
- Schiff, S.; Amodio, P.; Testa, G.; Nardi, M.; Montagnese, S.; Caregaro, L.; di Pellegrino, G.; Sellitto, M. Impulsivity toward food reward is related to BMI: Evidence from intertemporal choice in obese and normal-weight individuals. Brain Cogn. 2015, 110, 112–119. [Google Scholar] [CrossRef]
- Shiels, K.; Hawk, L.W.; Reynolds, B.; Mazzullo, R.J.; Rhodes, J.D.; Pelham, W.E.; Waxmonsky, J.G.; Gangloff, B.P. Effects of methylphenidate on discounting of delayed rewards in Attention Deficit/Hyperactivity Disorder. Exp. Clin. Psychopharmacol. 2009, 17, 291–301. [Google Scholar] [CrossRef] [PubMed]
- Reynolds, B.; Schiffbauer, R. Measuring state changes in human delay discounting: An experiential discounting task. Behav. Process. 2004, 67, 343–356. [Google Scholar] [CrossRef]
- Smits, R.R.; Stein, J.S.; Johnson, P.S.; Odum, A.L.; Madden, G.J. Test–retest reliability and construct validity of the Experiential Discounting Task. Exp. Clin. Psychopharmacol. 2013, 21, 155–163. [Google Scholar] [CrossRef] [PubMed] [Green Version]
- Kirby, K.N.; Petry, N.M.; Bickel, W.K. Heroin addicts have higher discount rates for delayed rewards than non-drug-using controls. J. Exp. Psychol. Gen. 1999, 128, 78–87. [Google Scholar] [CrossRef] [PubMed]
- Holt, S.H.A.; Brand Miller, J.C.; Petocz, P.; Farmakalidis, E. A satiety index of common foods. Eur. J. Clin. Nutr. 1995, 49, 675–690. [Google Scholar] [PubMed]
- Wang, X.T.; Dvorak, R.D. Sweet future: Fluctuating blood glucose levels affect future discounting. Psychol. Sci. 2010, 21, 183–188. [Google Scholar] [CrossRef] [PubMed] [Green Version]
- Kirby, K.N. One-year temporal stability of delay-discount rates. Psychon. Bull. Rev. 2009, 16, 457–462. [Google Scholar] [CrossRef] [PubMed] [Green Version]
- Farmer, R.; Sundberg, N.D. Boredom proneness: The development and correlates of a new scale. J. Personal. Assess. 1986, 50, 4–17. [Google Scholar] [CrossRef]
- Zuckerman, M.; Eysenck, S.; Eysenck, H. Sensation seeking in England and America: Corss-cultural, age, and sex comparisons. J. Consult. Clin. Psychol. 1978, 46, 139–149. [Google Scholar] [CrossRef]
- Wileyto, E.P.; Audrain-McGovern, J.; Epstein, L.H.; Lerman, C. Using logistic regression to estimate delay-discounting functions. Behav. Res. Methods Instrum. Comput. 2004, 36, 41–51. [Google Scholar] [CrossRef] [Green Version]
- Young, M.E. Discounting: A practical guide to multilevel analysis of choice data. J. Exp. Anal. Behav. 2018, 109, 293–312. [Google Scholar] [CrossRef] [PubMed]
- Burnham, K.P.; Anderson, D.R. Model Selection and Multimodel Inference: A Practical Information-Theoretic Approach, 2nd ed.; Springer: Secaucus, NJ, USA, 2002. [Google Scholar]
- Holm, S. A simple sequentially rejective multiple test procedure. Scand. J. Stat. 1979, 6, 65–70. [Google Scholar]
- Steele, C.C.; Pirkle, J.R.; Davis, I.R.; Kirkpatrick, K. Dietary effects on the determinants of food choice: Impulsive choice, discrimination, incentive motivation, preference, and liking in male rats. Appetite 2019, 136, 160–172. [Google Scholar] [CrossRef] [PubMed]
- Steele, C.C.; Pirkle, J.R.A.; Kirkpatrick, K. Diet-induced impulsivity: Effects of a high-fat and a high-sugar diet on impulsive choice in rats. PLoS ONE 2017, 12, e0180510. [Google Scholar] [CrossRef] [Green Version]
- Young, M.E. Discounting: A practical guide to multilevel analysis of indifference data. J. Exp. Anal. Behav. 2017, 108, 97–112. [Google Scholar] [CrossRef]
- Peters, J.; Miedl, S.F.; Büchel, C. Formal Comparison of Dual-Parameter Temporal Discounting Models in Controls and Pathological Gamblers. PLoS ONE 2012, 7, e47225. [Google Scholar] [CrossRef] [Green Version]
- Price, M.; Higgs, S.; Maw, J.; Lee, M. A dual-process approach to exploring the role of delay discounting in obesity. Physiol. Behav. 2016, 162, 46–51. [Google Scholar] [CrossRef] [Green Version]
- Reynolds, B.; Richards, J.B.; de Wit, H. Acute-alcohol effects on the Experiential Discounting Task (EDT) and a question-based measure of delay discounting. Pharmacol. Biochem. Behav. 2006, 83, 194–202. [Google Scholar] [CrossRef]
- Yi, R.; Stuppy-Sullivan, A.; Pickover, A.; Landes, R.D. Impact of construal level manipulations on delay discounting. PLoS ONE 2017, 12, e0177240. [Google Scholar] [CrossRef] [Green Version]
- Eagleman, D.M. Human time perception and its illusions. Curr. Opin. Neurobiol. 2008, 18, 131–136. [Google Scholar] [CrossRef] [Green Version]
- Amasino, D.R.; Sullivan, N.J.; Kranton, R.E.; Huettel, S. Amount and time exert independent influences on intertemporal choice. Nat. Hum. Behav. 2019, 3, 383–392. [Google Scholar] [CrossRef] [PubMed] [Green Version]
- Appelhans, B.M.; French, S.A.; Olinger, T.; Bogucki, M.; Janssen, I.; Avery-Mamer, E.F.; Powell, L.M. Leveraging delay discounting for health: Can time delays influence food choice? Appetite 2018, 126, 16–25. [Google Scholar] [CrossRef] [PubMed]


| Experiment 1 | Experiment 2 | |
|---|---|---|
| Participants | 50 | 50 |
| Sex (M|F) | 24|26 | 18|32 |
| Age (min–max) | 23.3 (18–34) | 20.5 (18–33) |
| Estimate (b) | SE | z | p | |
|---|---|---|---|---|
| Delay Ratio | 3.82 | 0.55 | 6.97 | <0.001 |
| Magnitude Ratio | −4.37 | 0.43 | −10.23 | <0.001 |
| Delay Ratio × Task | 0.38 | 0.24 | 1.62 | 0.11 |
| Magnitude Ratio × Task | −0.06 | 0.12 | −0.46 | 0.65 |
| Estimate (b) | SE | z | p | |
|---|---|---|---|---|
| Delay Ratio | 2.39 | 0.47 | 5.08 | <0.001 |
| Magnitude Ratio | −3.49 | 0.47 | −7.41 | <0.001 |
| Delay Ratio × Task | 2.06 | 0.23 | 8.83 | <0.001 |
| Delay Ratio × Order | 0.65 | 0.45 | 1.45 | 0.15 |
| Magnitude Ratio × Task | −0.48 | 0.11 | −4.23 | <0.001 |
| Magnitude Ratio × Order | −0.94 | 0.46 | −2.06 | 0.04 |
| Delay Ratio × Task × Order | −0.49 | 0.12 | −4.19 | <0.001 |
| Magnitude Ratio × Task × Order | 0.57 | 0.11 | 4.98 | <0.001 |
| Order | Task | Delay Sensitivity | Magnitude Sensitivity | Logistic k |
|---|---|---|---|---|
| RD/HR | RD/HR | 4.61 | −4.35 | 1.06 |
| HD/HR | 3.53 | −4.52 | 0.78 | |
| HD/HR | RD/HR | 4.28 | −3.61 | 1.19 |
| HD/HR | 1.24 | −1.49 | 0.83 |
| 1 | 2 | 3 | 4 | |
|---|---|---|---|---|
| 1 Delay Sensitivity | 1.00 | |||
| 2 Magnitude Sensitivity | −0.65 ** | 1.00 | ||
| 3 Logistic k | 0.27 | 0.41 * | 1.00 | |
| 4 Kirby k | −0.14 | 0.17 | 0.14 | 1.00 |
| 1 | 2 | 3 | 4 | 5 | 6 | |
|---|---|---|---|---|---|---|
| 1 Delay Sensitivity | 1.00 | |||||
| 2 Magnitude Sensitivity | −0.92 ** | 1.00 | ||||
| 3 Logistic k | 0.02 | 0.23 | 1.00 | |||
| 4 Kirby k | 0.16 | −0.26 | −0.22 | 1.00 | ||
| 5 Boredom Proneness | −0.13 | 0.23 | 0.27 | −0.07 | 1.00 | |
| 6 Sensation Seeking | 0.35 | −0.37 | −0.002 | 0.26 | 0.23 | 1.00 |
© 2019 by the authors. Licensee MDPI, Basel, Switzerland. This article is an open access article distributed under the terms and conditions of the Creative Commons Attribution (CC BY) license (http://creativecommons.org/licenses/by/4.0/).
Share and Cite
Steele, C.C.; Gwinner, M.; Smith, T.; Young, M.E.; Kirkpatrick, K. Experience Matters: The Effects of Hypothetical versus Experiential Delays and Magnitudes on Impulsive Choice in Delay Discounting Tasks. Brain Sci. 2019, 9, 379. https://doi.org/10.3390/brainsci9120379
Steele CC, Gwinner M, Smith T, Young ME, Kirkpatrick K. Experience Matters: The Effects of Hypothetical versus Experiential Delays and Magnitudes on Impulsive Choice in Delay Discounting Tasks. Brain Sciences. 2019; 9(12):379. https://doi.org/10.3390/brainsci9120379
Chicago/Turabian StyleSteele, Catherine C., MacKenzie Gwinner, Travis Smith, Michael E. Young, and Kimberly Kirkpatrick. 2019. "Experience Matters: The Effects of Hypothetical versus Experiential Delays and Magnitudes on Impulsive Choice in Delay Discounting Tasks" Brain Sciences 9, no. 12: 379. https://doi.org/10.3390/brainsci9120379