Article

Cooperative Fermentation Using Multiple Microorganisms and Enzymes Potentially Enhances the Nutritional Value of Spent Mushroom Substrate

Key Laboratory for Feed Biotechnology of the Ministry of Agriculture and Rural Affairs, Institute of Feed Research, Chinese Academy of Agriculture Sciences, Beijing 100081, China
*
Author to whom correspondence should be addressed.
These authors contributed equally to this work.
Agriculture 2024, 14(4), 629; https://doi.org/10.3390/agriculture14040629
Submission received: 27 February 2024 / Revised: 15 April 2024 / Accepted: 16 April 2024 / Published: 19 April 2024
(This article belongs to the Section Agricultural Technology)

Abstract

:
Large amounts of spent mushroom substrate (SMS) are produced globally, but their utilization efficiency is low, which leads to negative environmental impacts, such as water, soil, and air pollution. SMS contains nutrients, such as cell proteins, with a potential application in animal feed. However, the lignocellulose in SMS restricts animal digestion and absorption, thus hindering its application in animal nutrition. We investigated the potential of cellulase, xylanase, β-galactosidase, and a variety of microorganisms to optimize the conditions for reducing sugars’ (RS) production and the degradation rate of neutral detergent fibers. The results showed that the optimum proportion of multiple enzymes for glucose production of up to 210.89 mg/g were 10% cellulase, 10% xylanase, and 2% β -galactosidase, at 50 °C and 60% moisture for a 20 h hydrolysis duration. To enhance the optimal enzymolysis combination, co-fermentation experiments with multiple microorganisms and enzymes showed that inoculation with 10% Bacillus subtilis, 2% Pediococcus acidilactici, and 2% Saccharomyces cerevisiae, in combination with 10% cellulase, 10% xylanase, 2% β-galactosidase, and 1% urea, at 36.8°C and 59% moisture for 70 h hydrolysis, could lead to a 23.69% degradation rate of the neutral detergent fiber. This process significantly increased the degradation rate of the neutral detergent fiber and the nutrient content of Pleurotus eryngii compared to the initial fermentation conditions. Overall, our study generated optimal co-fermentation conditions for bacteria and enzymes and provides a practical reference for biological feed synthesis using P. eryngii spent mushroom substrate.

1. Introduction

Edible mushrooms are gradually becoming part of the human daily diet due to their nutritional and prebiotic properties. It is estimated that the global production of edible mushrooms will reach 20.84 million tons by 2026 [1,2]. China as a major producer and consumer of edible mushrooms, with its edible mushroom market reaching over USD 13 billion, accounting for about 35% of the global market share in 2018 [3]. As the expansion of the edible mushroom industry expands, a large amount of spent mushroom substrate (SMS), its culture medium residue, is produced. The SMS from edible mushrooms is mainly composed of lignocellulosic biomass materials, which can be decomposed by residual fungal mycelium, organic matter, and enzymes [4]. The biological efficiency of the culture medium in edible mushroom production ranges only from 17 to 25%, leading to a 3–5 kg SMS production for every 1 kg of mushroom harvested [5,6].
During mushroom production, large quantities of the SMS produced are mainly disposed through open burning, landfilling, or composting mixed with animal manure. As a result, its value cannot be effectively achieved due to its environmental problems, such as water, soil, and air pollution [7,8,9]. To address this challenge, studies have explored various strategies to effectively manage SMS, including its application as a biofertilizer [10,11], biological bogs [12], soil amendments [13], substrates for commercial enzyme fermentation [14,15], and in biofuel production [16,17]. In addition, the main components of SMS, wheat straw, and corn cob contain a large amount of lignocellulosic matrix. During edible fungi cultivation, active enzymes are generated to degrade lignocellulose in the matrix, which leads to a significant increase in the nutrients, such as cell protein [18], as well as a high fiber content in the matrix. Studies into the potential use of SMS as animal feed, considering these properties, revealed that its inclusion in diets did not adversely affect animal body weight or feed conversion [19,20]. In contrast, SMS could enhance the feed conversion and fat breakdown in broilers [21,22] and improve their immune regulatory function [20], improve the flavor and acceptability of goose meat [23], and reduce the rumen protozoa populations as well as intestinal methane emissions [24]. The above reports showed that pure SMS for livestock and poultry nutrition was not only harmless but could also offer novel benefits. The high cellulose content in SMS even after fungal degradation, limits its digestibility and absorption in animals. Therefore, sustainable biological processing of SMS to optimize its nutritional value presents promising applications in animal production. In recent years, solid-state fermentation has been broadly applied in the fermented feed industry, due to its significant capacity to enhance nutrient utilization rates and reduce anti-nutritional factors [25,26,27]. Bacterial enzyme co-fermentation is a technology that cooperatively utilizes a variety of bacteria and enzymes in the fermentation process, and the method not only makes up for the limitations of the low enzyme activity, single species, or insufficient enzyme quantity but also mitigates the adverse effects of the dominant undesirable bacteria in the main ecological niche. This process can yield various probiotic metabolites and enables substantial production with improved application value.
To our knowledge, there is little information available on the co-fermentation of P. eryngii SMS (PESMS) using bacteria and enzyme activities to improve its nutritional value [28]. Thus, this study aimed to use enzymes and bacteria to co-ferment PESMS to induce the production of more reducing sugar (RS) nutrients and to reduce neutral detergent fiber (NDF) content. In addition, the study generated optimal co-fermentation conditions of bacteria and enzymes, which could provide a practical reference for PESMS-based biological feed application.

2. Materials and Methods

2.1. Sample Preparation

The PESMS used in the study was provided by Hubei Shenyun Agricultural Group Co., Ltd. (Shiyan, China). The PESMS, derived from a single mushroom, was oven dried at 60 °C for 3 days, crushed and sieved through a 40-mesh sieve (≤0.425 mm) using a grinder, and, after drying for later use, was stored at 4 °C. The crude fiber content was determined to be 26.42%, with the NDF and acid detergent fiber levels accounting for 51.73% and 28.75% of the total content, respectively.
All enzyme powders used in the experiment were obtained from Beijing Challenge Biotechnology Co., LTD. (Beijing, China). The activity of cellulase, xylanase, and β-galactosidase was measured at 20,000, 40,000, and 4000 U/g, respectively.
Three bacterial species, including Bacillus subtilis, Pediococcus acidilactici, and Saccharomyces cerevisiae, maintained as preserved cultures in our laboratory, were mixed at 1:1 with 50% glycerin then stored at −80 °C.

2.2. Single Cellulase, Xylanase, and β-Galactosidase Enzyme Assay

We selected some enzymes that are efficient at degrading cellulose and producing reducing sugars. To optimize the culture conditions for the production of RS in the selected consortia, three influencing factors, including the amount added, the enzymatic hydrolysis time, and the material–water ratio of cellulase, xylanase, and β-galactosidase, were sequentially tested by single factor experiments. The optimal value of an individual factor obtained in an experiment was used in the subsequent experiments with the general culture conditions of 50 °C and pH = 7.0. The RS content in PESMS was determined by the colorimetric method using 3,5-dinitrosalicylic acid (DNS) [29].
I: For enzymatic hydrolysis, 50 g PESMS and 50 mL of distilled water were added to a bottle to achieve a 1:1 ratio of material to water. The cellulase loadings were 2, 4, 6, 8, and 10% PESMS (w/w), the xylanase loadings were 2, 4, 6, 8, and 10% PESMS (w/w), and the β-galactosidase loadings were 0.5, 1, 1.5, 2, and 3% PESMS (w/w). Enzymatic hydrolysis occurred at a constant incubator temperature of 50 °C. Following the hydrolysis process, the enzyme was inactivated at 120 °C for 20 min in an oven and subsequently dried at 65 °C for 24 h. The RS content was measured to determine the optimal addition ratios of cellulase, xylanase, and β-galactosidase.
II: The optimal amounts obtained in experiment I were selected for the subsequent experiments. The ratio of material to water was maintained at 1:1. The culture durations were set at 8, 12, 16, 20, and 24 h for cellulase, at 2, 4, 6, 8, and 10 h for xylanase, and at 4, 8, 12, 16, and 20 h for β-galactosidase.
III: Using the optimal enzyme addition and culture time protocol ascertained from steps I and II, enzymatic hydrolysis experiments were carried out at substrate-to-water ratios of 1:0.6, 1:0.8, and 1:1.2.

2.3. Multi-Enzyme Assays

The comprehensive enzymolysis effect was calculated using an L9(34) orthogonal design approach. A three-level addition of cellulase, xylanase, and β-galactosidase was established based on the outcomes of the single-factor tests for each enzyme amount added. The impact of each enzyme on the experimental results was ranked according to the enzymatic effect observed. All test levels were performed in triplicate, and the results were averaged. The NDF content was determined using the Van Soest method [30], and its content and the mass fraction in the samples were calculated using the formula: N D F % = M 2 M 1 × C × 100 ÷ M 0 , where M1 is the initial weight of the filter bag in g; M0 is the sample weight in g; M2 is the total weight (g) of the sample and filter bag after washing; C is the blank filter bag correction factor (weight after drying/initial weight).

2.4. Box–Behnken Design Test

The Plackett–Burman design (PBD) test implemented in the Design Expert 12 software was utilized to select the input factors and to construct a multi-factor Box–Behnken design (BBD) experiment with three factors and three levels, comprising of 15 co-optimization experiments involving bacteria and enzymes. The t-value was then applied to analyze and obtain the results [31]. The statistical significance of the second-order model equation was determined by the F-value, while the proportion of the variance of the model interpretation was evaluated by the multiple determination coefficient R2. The Design Expert 12 software was used for response surface and point prediction to determine the optimal value of each factor. All experimental designs were randomized, and each experiment was repeated and then averaged.

3. Results

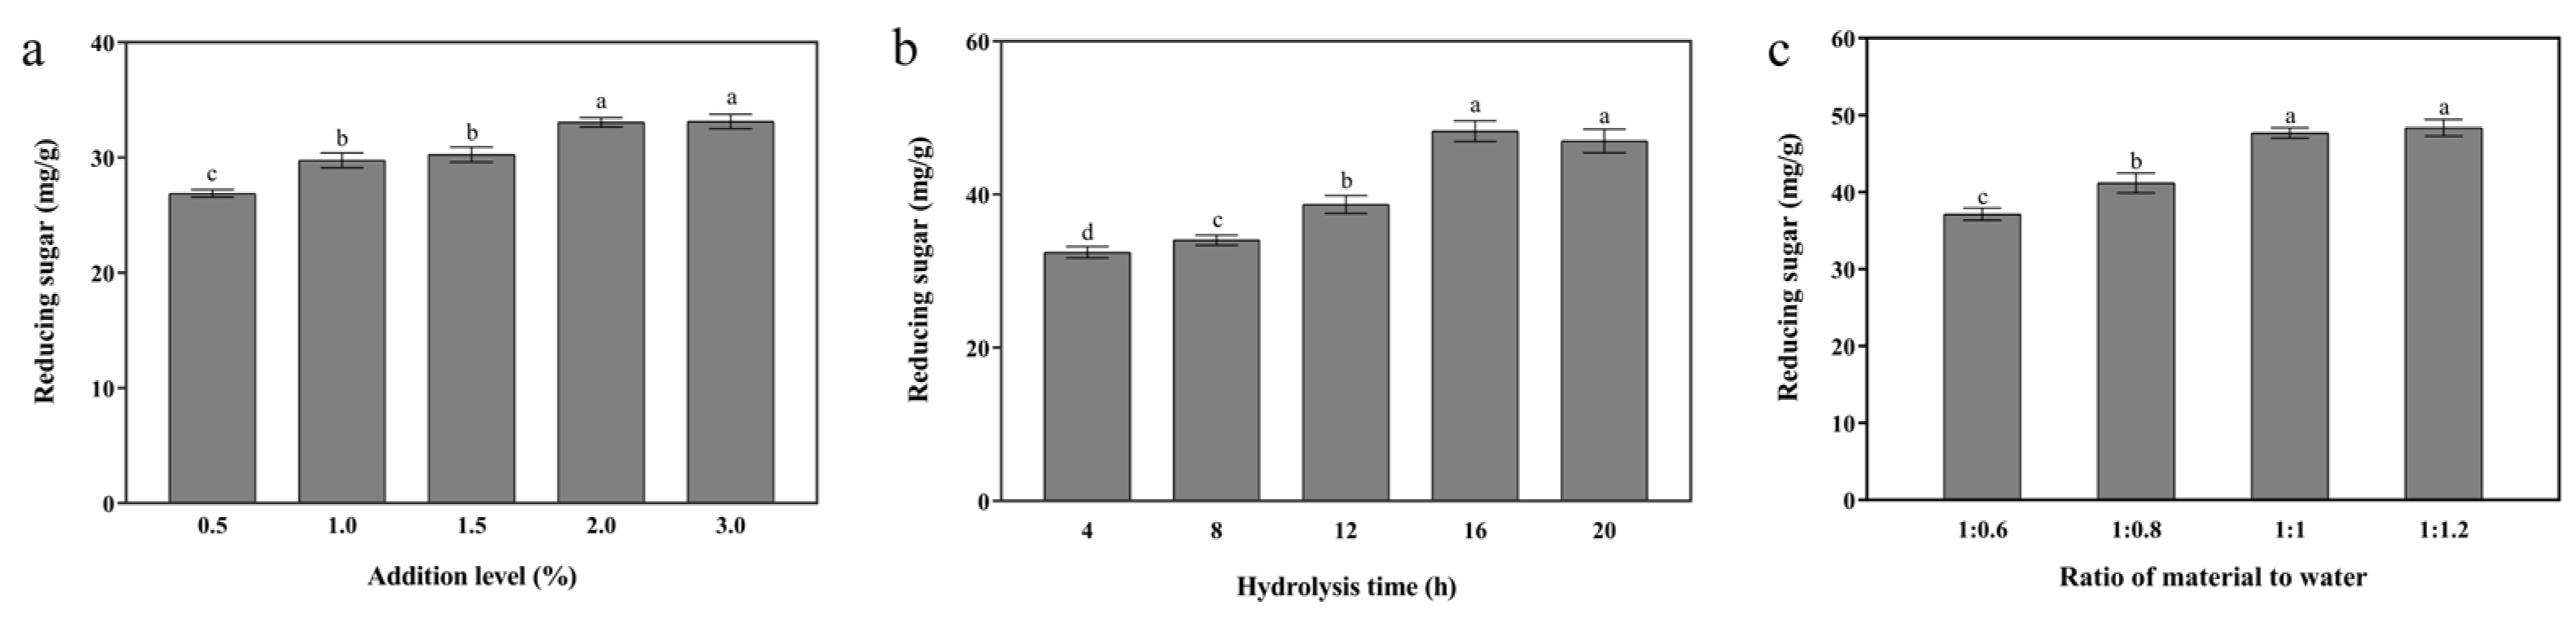
3.1. Single-Enzymatic Hydrolysis of Cellulase, Xylanase, and β-Galactosidase

3.1.1. Cellulase

Figure 1 shows the effects of the different supplemental levels, different hydrolysis times, and the ratio of material to water on the RS content of PESMS hydrolyzed by cellulase at the enzymatic hydrolysis conditions of 20 h and 50 °C and a 1:1 ratio of material to water. The addition of cellulase significantly increased the RS content (p < 0.05), with cellulase addition at 10% exhibiting the highest content of RS content of 104.81 mg/g. At 10% addition and a 1:1 ratio of material to water, the RS content showed an initial rise, which later decreased with the time extension. Notably, the highest RS content (p < 0.05) was detected at the 20 h culture duration, while the peak RS level was achieved with a 1:1 material-to-water ratio. There was no difference in RS contents between the 1:1 and 1:1.2 experimental groups (p > 0.05).

3.1.2. Xylanase

The impact of varying single factors, such as the xylanase addition levels, the hydrolysis time, and the ratio of material to water on the RS content at 50 °C and pH = 7.0 condition is shown in Figure 2. The addition of xylanase increased the RS content in PESMS (p < 0.05), with the highest increase observed at 10% supplementation. The RS content showed an initial increase with the increase in the hydrolysis time followed by a decrease at later stages. The RS content at the 8 h and 10 h enzymatic hydrolysis periods was higher than at the 2 h, 4 h, and 6 h periods (p < 0.05). Moreover, the increase in the ratio of material to water increased the RS content, with higher RS contents in the 1:1 and 1:1.2 material-to-water ratio groups than in the 1:0.6 and 1:0.8 groups (p < 0.05), while no statistically significant RS content was observed between the 1:1 and 1:1.2 groups (p > 0.05).

3.1.3. β-Galactosidase

Under the conditions of 50 °C and pH = 7.0, Figure 3 shows the impact of varying the single β-galactosidase addition levels, the hydrolysis time, and the ratio of material to water on the RS accumulation. The addition of β-galactosidase increased the RS content in PESMS (p < 0.05). Increased RS accumulation in PESMS was detected with 1.0% and 2.0% β-galactosidase addition (p < 0.05). The initial RS accumulation increased with the enzymatic hydrolysis time and later decreased, with the peak content being achieved at 16 h. Higher RS content was detected in the 1:1 and 1:1.2 material-to-water ratio groups than in the 1:0.6 and 1:0.8 groups (p < 0.05) but with no statistically significant difference levels between the 1:1 and 1:1.2 groups (p > 0.05).

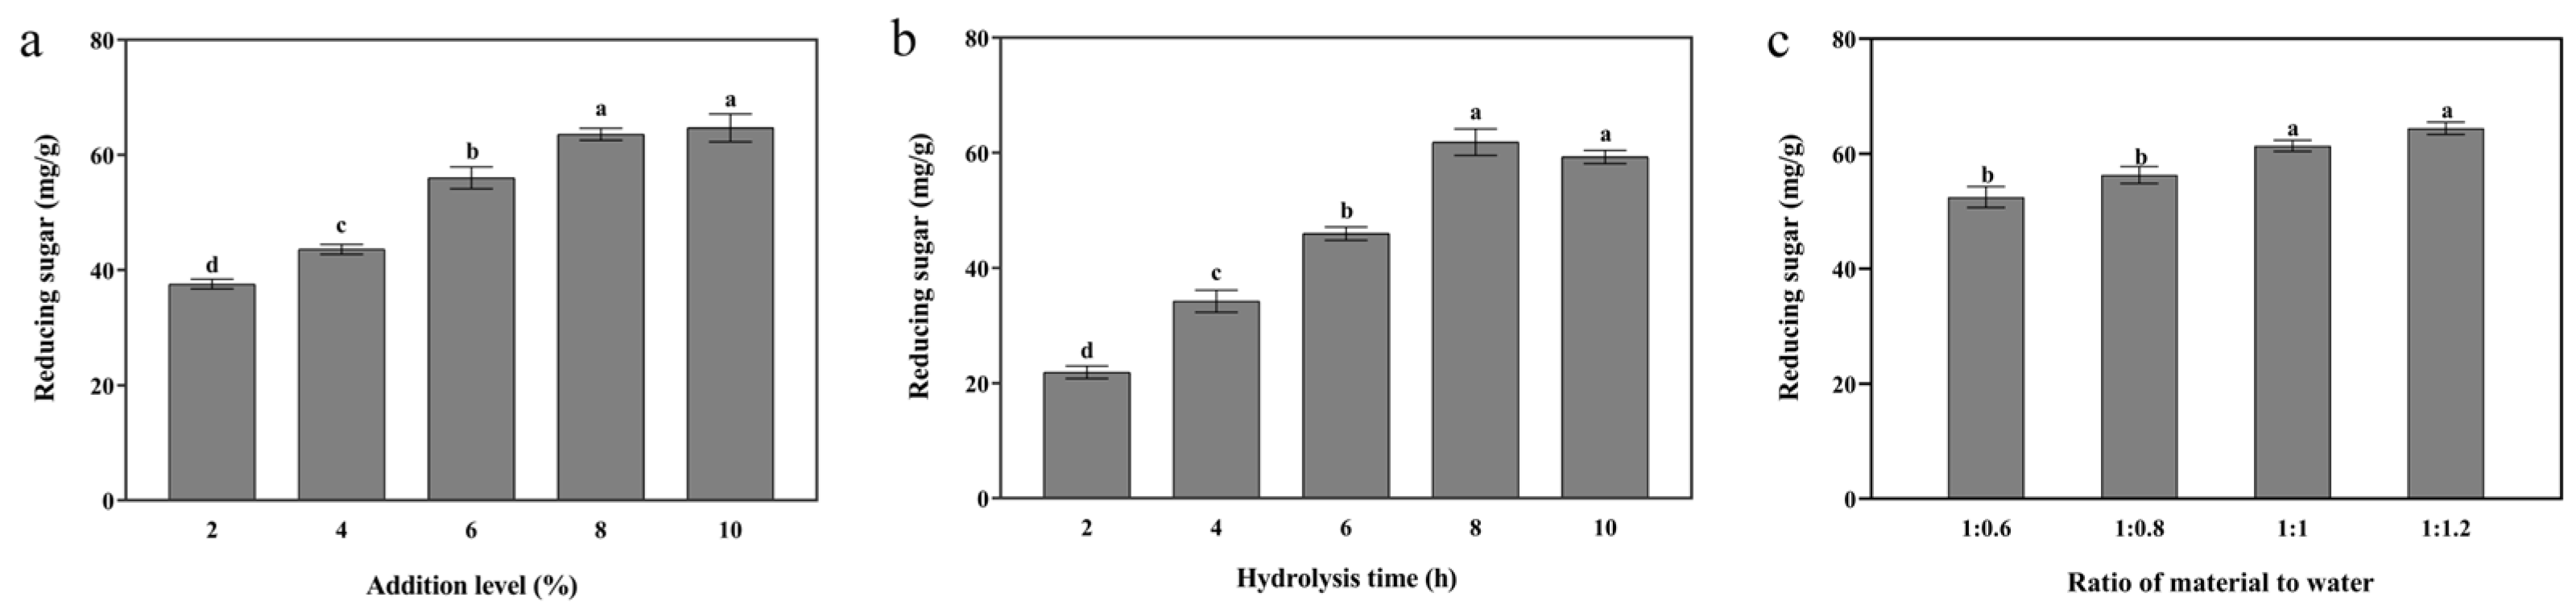
3.2. Multiple Ratios of Complex Enzymes

The L9(34) orthogonal test was used to investigate the optimal supplemental amount of cellulase, xylanase, and β-galactosidase (Table 1), as well as the effect of multiple enzymatic hydrolysis (Table 2). The results showed that the influence of each enzyme on the enzymatic hydrolysis effect followed the order of cellulase, xylanase, and β-galactosidase, with the latter exhibiting the least effect on enzymatic hydrolysis. Based on the range analysis results of the orthogonal experimental design, the selected combination for the complex enzymatic system for the subsequent fermentation tests was 10% cellulase, 10% xylanase, and 2% β-galactosidase.

3.3. Plackett–Burman Design (PBD) Screening Test

To rapidly and efficiently screen for the most important factors for bacterial enzyme synergistic fermentation, six factors, including the supplementation levels of B. subtilis (F1), P. acidilactici (F2), S. cerevisiae (F3), time (F4), temperature (F5), and water content (F6) were tested. As illustrated in Table 3, each factor was assigned a high level (+1) and a low level (−1). Table 4 shows the PBD test carried out on the bacterial enzyme collaborative fermentation of PESMS test, with the response value as the NDF degradation rate. The PBD screening test model revealed a significant regression (p = 0.022 < 0.05). The results showed that the NDF degradation rate was influenced to varying degrees by the time (p < 0.05), temperature (p < 0.05), water content (p = 0.065), B. subtilis inoculation levels (p > 0.05), S. cerevisiae inoculation levels (p > 0.05), and P. acidilactici inoculation amounts (p > 0.05) (Table 5). Consequently, three factors of fermentation time, temperature, and PESMS water content were selected to optimize the subsequent BBD test process. The inoculation levels of B. subtilis, P. acidilactici, and S. cerevisiae were set at 10%, 2%, and 2%, respectively.

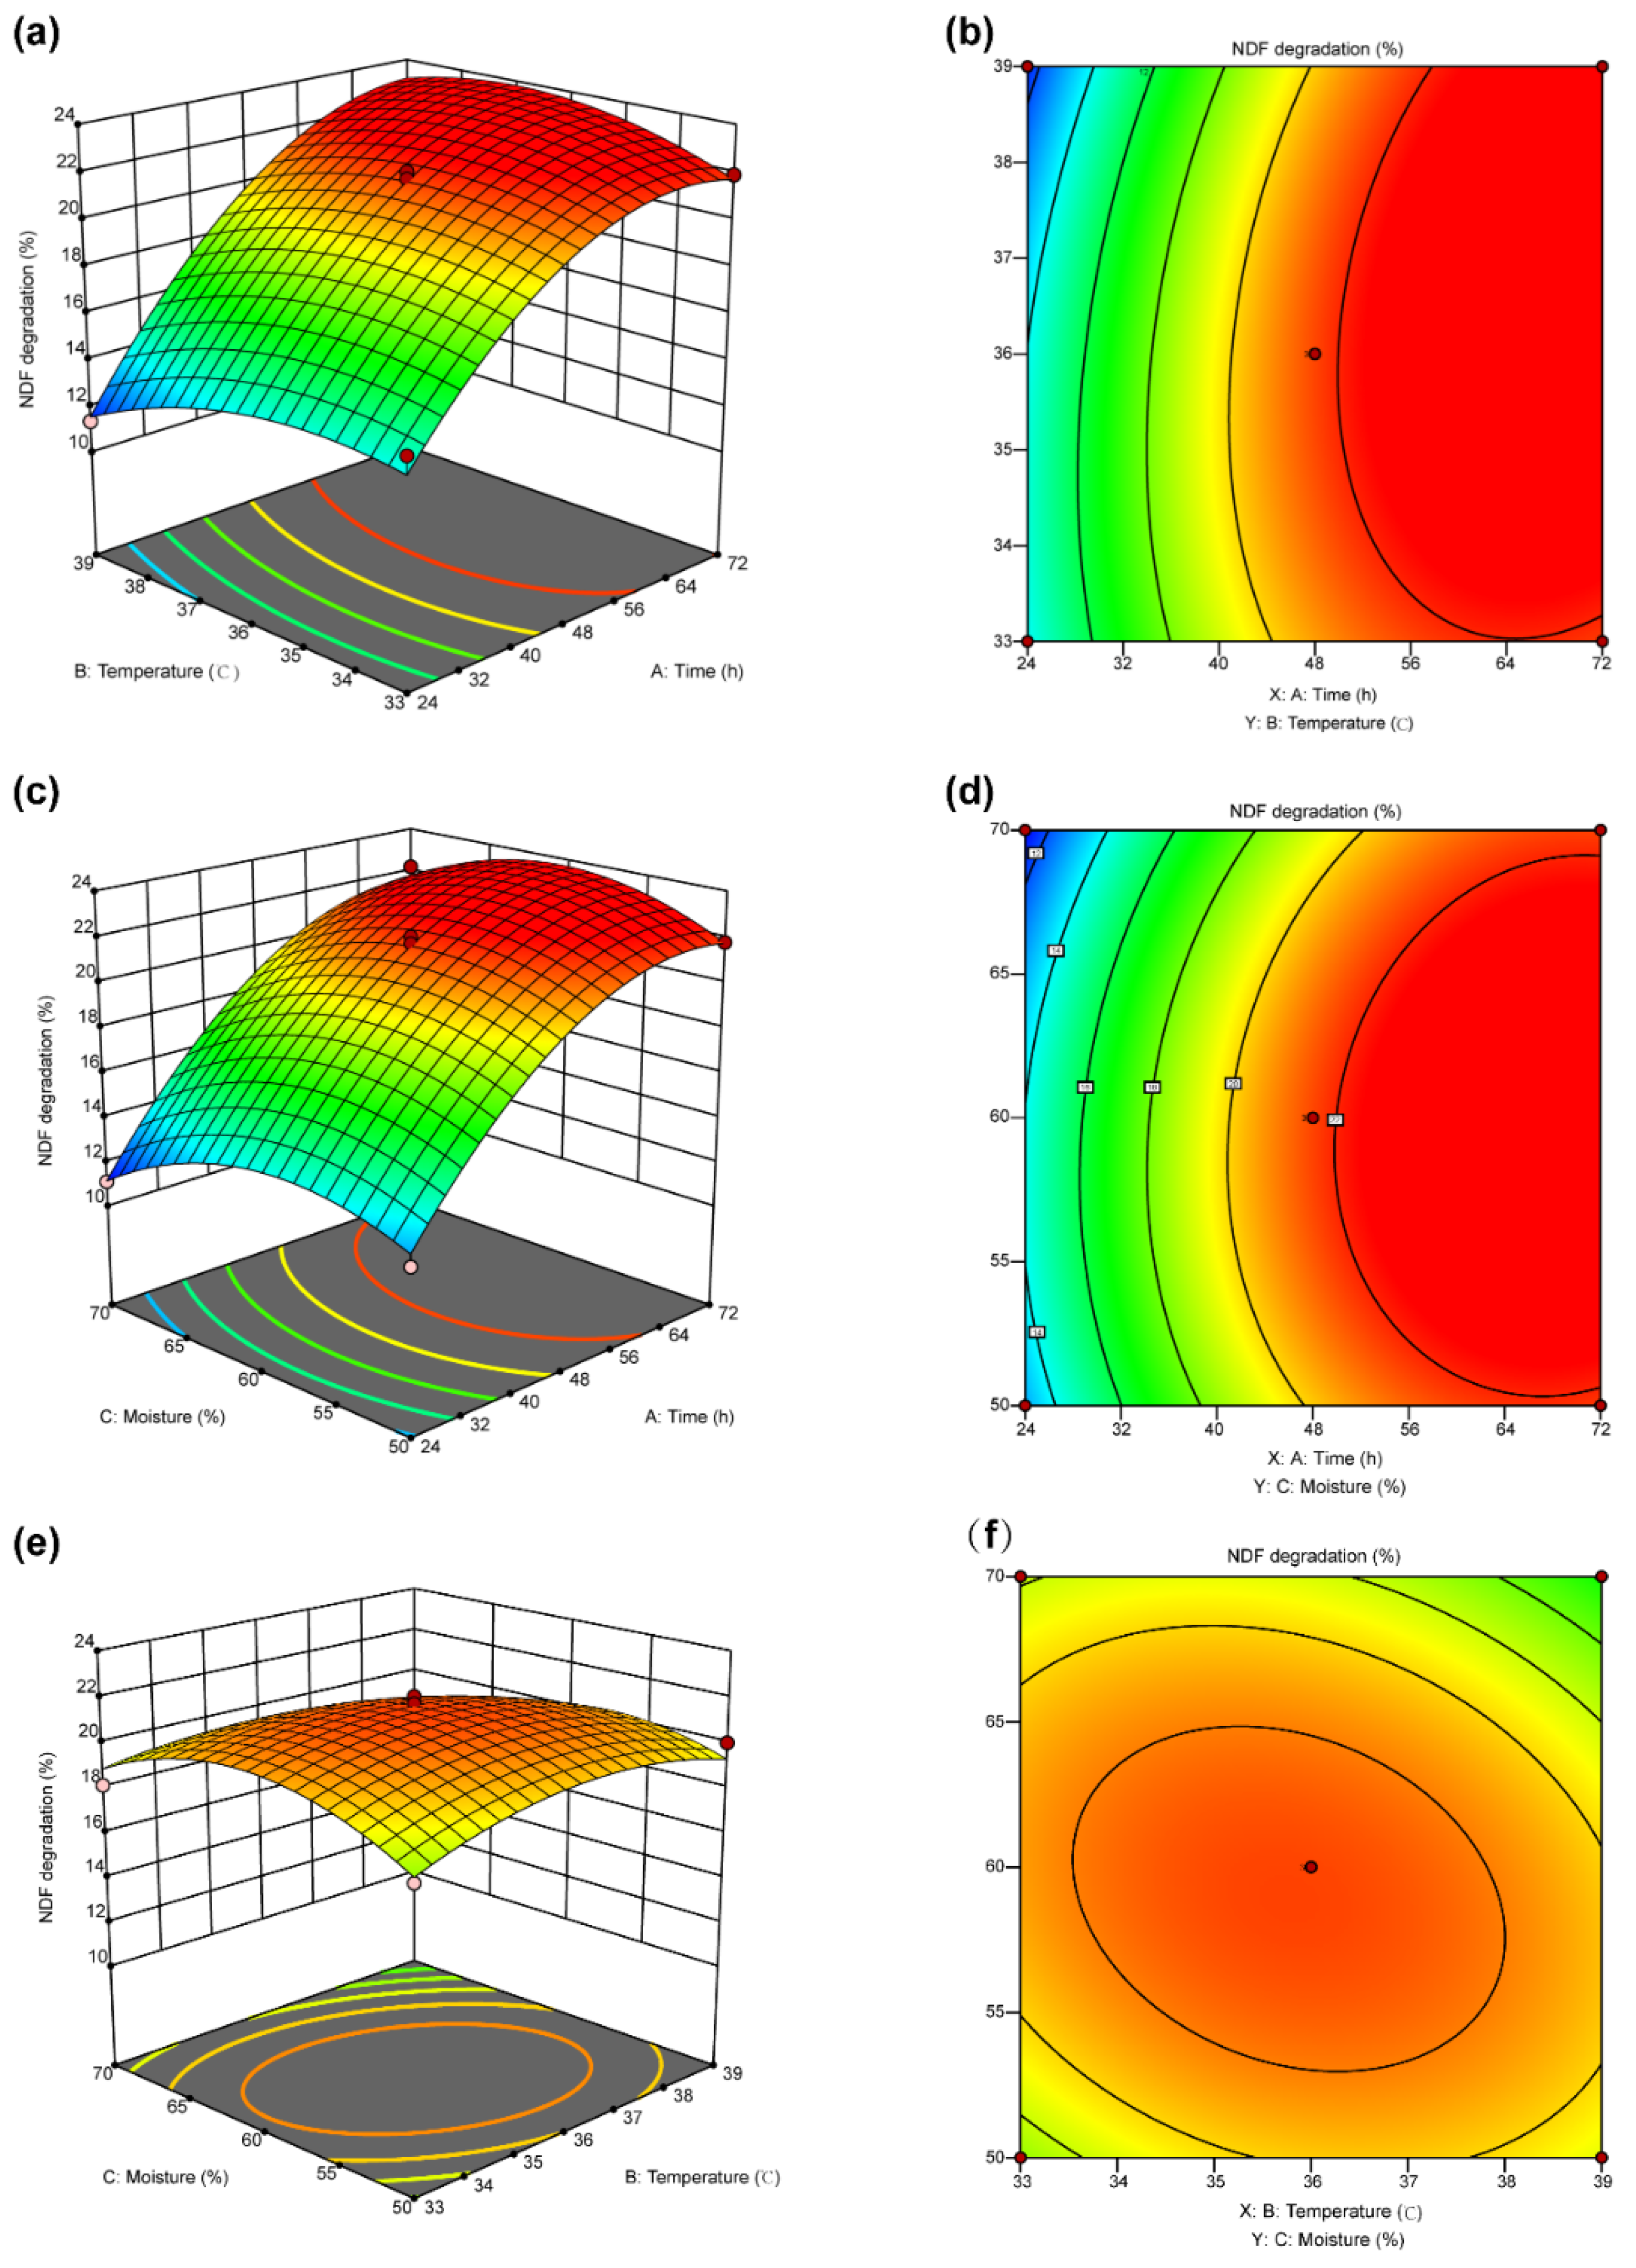
3.4. Response Surface Optimization

To understand the interaction between the three factors, RSM was used to further optimize the NDF degradation rate, with time, temperature, and moisture as the independent variables. Based on the Box–Behnken experimental design, a three-level response surface design was adopted for the three factors as shown in Table 6, and the results are presented in Table 7. Analysis of variance for the quadratic model is displayed in Table 8. The model revealed an F-value of 39.86 and a significant p value of less than 0.05. In addition, several terms of this model, such as A, A2, B2, and C2, were significant. The lack of fit at an F-value of 4.13 was not significant relative to the pure error, suggesting the model predictions were reliable. The predicted output of the model was considered to be significant with an R2 of 0.9863. The quadratic regression model for the NDF degradation of fermentation from PESMS by the enzyme and bacteria obtained from BBD in terms of actual factors was presented as
N D F   d e g r a d a t i o n   r a t e = 21.63 + 4.82 A 0.27 B 0.4869 C + 0.9788 A B + 0.4350 A C 0.7163 B C 2.76 A 2 1.26 B 2 1.98 C 2
The absolute value of each factor coefficient in the equation reflects its influence on the NDF degradation rate of PESMS fermented by bacteria and enzymes. The NDF degradation rate was influenced by the time, temperature, and water content. The first term A, the second term A2, B2, and C2 of the equation all reached a significant level (p < 0.05), indicating their significant influence on the degradation rate of NDF.

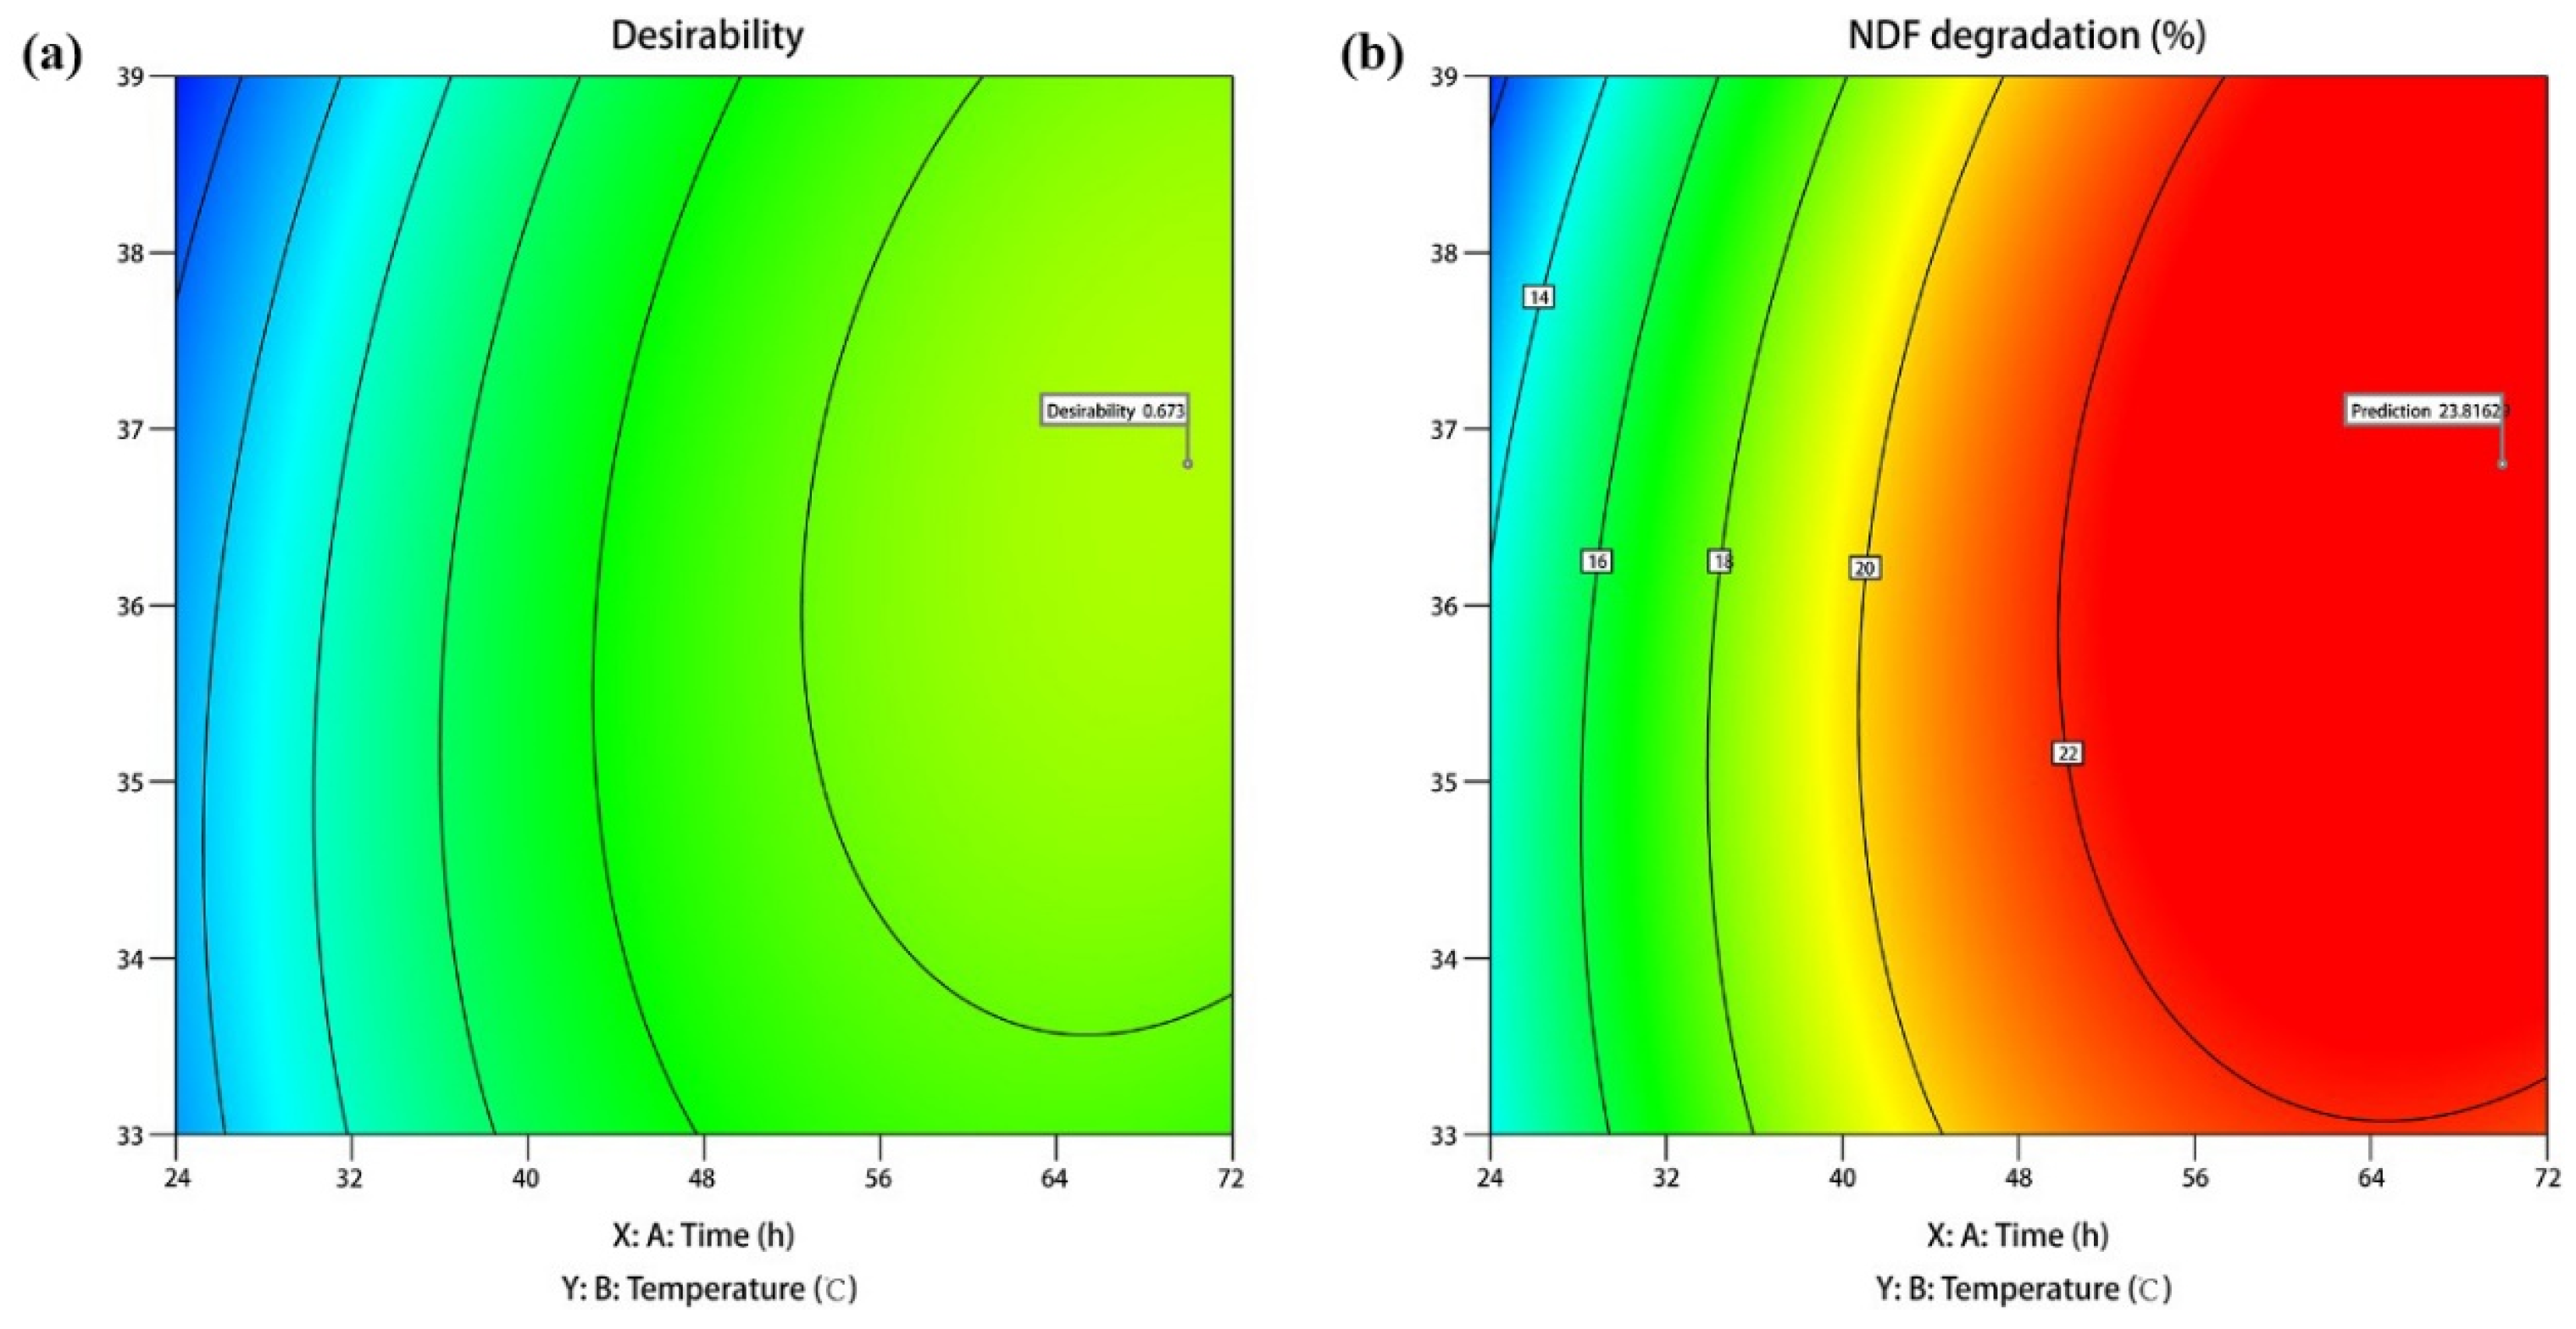
3.5. Optimization and Verification

The effects of the changes in the fermentation time, temperature, and water content on the degradation rate of NDF were analyzed through the response surface plots (Figure 4). The behavior of the NDF degradation rate with respect to the changes in fermentation time and temperature, at specific hold values are shown in Figure 4a,b. These results clearly showed that an increase in the fermentation time and a decrease in the temperature could positively impact the NDF degradation rate up to a certain threshold. Beyond this point, further increases in the fermentation time did not cause additional NDF degradation. Similarly, the NDF degradation rate increased with a prolonged fermentation time and reached a plateau, beyond which no further NDF depletion occurred. However, a moderate level of water content was found to be more conducive for NDF degradation (Figure 4c,d). The degradation rate of NDF was higher when the fermentation time was constant, and both the material moisture and ambient temperature were maintained at moderate levels (Figure 4e,f). These surface plots summarize the estimated optimal levels for each variable. The optimal values of the fermentation time, temperature, and moisture content were determined to be 69.973 h, 36.802 °C, and 59.22%, respectively, resulting in an optimal NDF degradation percentage of 23.816%, and with a desirability score of 0.673, which indicated a high reliability of the prediction results (Figure 5). The optimal fermentation process parameters were manually adjusted to a duration of 70 h, a temperature of 36.8 °C, and a water content of 59%, and the validation test was conducted across three parallel setups. The measured NDF degradation rate was 23.69%, and the relative error compared to the theoretical value was 0.53%, demonstrating the high accuracy of this model. Notably, the NDF degradation rate increased by 30.02% compared to the rate before optimization.

4. Discussion

PESMS are primarily agricultural byproducts that are rich in lignocellulose, such as corn cobs, bran, rice straw, and wood chips. The lignocellulosic materials are characterized by their complex physical and chemical structures, with cellulose, hemicellulose, and lignin tightly interlinked through various chemical bonds, which presents challenges for their direct utilization [32,33,34]. The complete hydrolysis of cellulose within these materials results in the production of glucose. The cellulose and hemicellulose content in PESMS comprise up to 50% of its total mass [35,36], making PESMS a rich source of polysaccharides. Consequently, the application of cellulase and hemicellulose in the decomposition of PESMS into RS has been identified as both feasible and effective [37].
It has been reported that incorporating xylanase into the enzymatic system could enhance the glucose and xylose yields from sugarcane bagasse, with increases of 31.08% and 30.14%, respectively [38]. Furthermore, the glucose yield from a compound enzyme system surpasses that of a single enzyme system [39]. This study showed that with the increase in the amount of exogenous enzyme, the content of RS released by enzymatic hydrolysis of PESMS initially increased and then remained stable. Liao [40] reported that increasing the amount of cellulase could significantly increase the glucose yield of propionic acid-hydrolyzed corn cob. This indicates that given adequate substrate, there is an optimal range for enzyme addition. Efficient cellulose hydrolysis requires a minimum surface area from a single enzyme. The hydrolysis efficiency decreases once the total enzyme concentration surpasses the saturation point [41]. Moreover, competitive inhibition enables the released glucose to act as an inhibitor, thereby reducing the enzyme activity. Native strains of SMS also dynamically consume RS, thus affecting the yields [42,43]. In addition, water content is a critical factor in the success of solid enzymatic hydrolysis. In this study, the observation of the material moisture in terms of its impact on the SMS reducing sugars yield with the enzyme solution found that with the increase in the humidity, the RS content in substrate leveled-off after the initial rising trend. This occurred because in the process of solid enzyme solution, water molecules were not only directly involved in the enzymatic hydrolysis reaction but also as a medium to promote easier enzyme protein adsorption on the surface of the material.
Garcia De Figueiredo [44,45] previously demonstrated that the protein recovery rate from compound enzyme treatment could reach 28%, which was between 17% and 86% higher than in the non-enzyme treatment groups. A blend of complex enzymes, including fibrinogen, endoglucanase, and β-galactosidase showed higher performance in converting cellulose into glucose and could yield up to 15.5 mg/mL of glucose, which was 2.1-fold higher than that achieved with crude enzyme preparations [31]. The cooperation and synergistic association between complex enzymes are crucial for the effective and complete degradation of cellulose substrates, leading to enhanced hydrolysis efficiency. This is because numerous different enzymes bind at different sites and achieve maximum synergy at concentrations below the total enzyme concentration required for the saturation of available binding sites on the substrate [45,46]. Our results demonstrated that the RS content in PESMS varied with the proportion of enzyme blends used. However, the effectiveness of multiple enzymes was not significantly greater than that of a single enzyme. This could be because of the high winding structure of lignocellulosic, which led to the low accessibility of cellulose hydrolyzed by a single enzyme. Protein molecules struggle to attach destructively to the surface of cellulose and hemicellulose or penetrate their interior, thus failing to exhibit high synergistic efficiency of compound enzymes. Nonetheless, the synergistic effect of each enzyme is strongest when it is present at an unsaturated concentration, so that only the dose effect is shown.
The complex and firm lignocellulosic structure of SMS poses challenges for its direct bacterial utilization. Exogenous lignocellulosic enzyme was added to improve its nutritional value in combination with probiotic fermentation. Moisture content is a critical factor in the success of solid-state fermentation. Above-optimal moisture levels can cause substrate aggregation or particle adhesion to the reactor walls, increasing the susceptibility to bacterial contamination. Conversely, insufficient water content diminishes the solubility of lignin and the swelling capacity of substrates, leading to elevated water tension that hampers microbial growth and enzyme production [47]. Zhu [48] used response surface methodology to analyze the effect of cellulase and Lactobacillus co-fermentation on lactic acid yield from corn cob, and their findings revealed that cellulase addition could significantly enhance the lactic acid yield compared to Lactobacillus alone. Under the appropriate temperature and water content conditions, the enzyme will better adhere to the surface of the base material and gradually hydrolyze to the interior [49]. Excessive temperature and moisture can restrict the growth and production of probiotics. Therefore, moderate conditions are essential for achieving optimal fermentation outcomes. This study showed that the NDF degradation rate increased by 30.02% compared with that prior to optimization. Further analysis confirmed that the NDF degradation in PESMS could be optimized under conditions of 70 h, 36.8 °C, and 59% water content.

5. Conclusions

In summary, this study optimized the conditions for the synergistic fermentation involving multiple microorganisms and enzymes, thereby enhancing the nutritional value of PESMS. The optimal addition ratios for cellulase, xylanase, and β-galactosidase were found to be 10%, 10%, and 2%, respectively, with a hydrolysis temperature of 50 °C, hydrolysis duration of 20 h, and a moisture content of 60%. The overall glucose yield using this optimized treatment was 210.89 mg/g. The fermentation factors were optimized by BBD. The ideal fermentation conditions were determined to be as follows: 10% B. subtilis, 2% lactic acid bacteria, 2% S. cerevisiae, 10% cellulase, 10% xylanase, 2% β-galactosidase, and 1% urea, with a fermentation period of 70 h, temperature of 36.8 °C, and moisture content of 59%. Under these optimized conditions, the degradation rate of NDF increased to 23.69%, representing a 30.02% enhancement level compared to pre-optimization yield. This study presented a biological strategy for improving the nutritional value of the spent mushroom substrate of P. eryngii.

Author Contributions

Conceptualization, A.Z. (Anrong Zhang) and A.Z. (Aijuan Zheng); data curation, W.H.; formal analysis, A.Z. (Anrong Zhang) and W.H.; funding acquisition, P.Y. and G.L.; investigation, A.Z. (Anrong Zhang); methodology, Y.H., Z.C., K.M. and G.L.; project administration, Y.H. and A.Z. (Aijuan Zheng); resources, P.Y. and G.L.; writing—original draft, A.Z. (Anrong Zhang) and W.H.; writing—review and editing, W.H. and A.Z. (Aijuan Zheng). All authors have read and agreed to the published version of the manuscript.

Funding

This work was supported by National Key Research and Development Program of China (No. 2023YFD1301602) and the Hebei Province Key Research and Development Program of China (22326624D).

Institutional Review Board Statement

Not applicable.

Data Availability Statement

The datasets used and analyzed during the current study are available from the corresponding author on reasonable request.

Conflicts of Interest

The authors declare that they have no competing interests.

References

  1. Atallah, E.; Zeaiter, J.; Ahmad, M.N.; Leahy, J.J.; Kwapinski, W. Hydrothermal carbonization of spent mushroom compost waste compared against torrefaction and pyrolysis. Fuel Process. Technol. 2021, 216, 106795. [Google Scholar] [CrossRef]
  2. Valverde, M.E.; Hernández-Pérez, T.; Paredes-López, O. Edible mushrooms: Improving human health and promoting quality life. Int. J. Microbiol. 2015, 2015, 376387. [Google Scholar] [CrossRef] [PubMed]
  3. Mahari, W.A.W.; Peng, W.; Nam, W.L.; Yang, H.; Lee, X.Y.; Lee, Y.K.; Liew, R.K.; Ma, N.L.; Mohammad, A.; Sonne, C.; et al. A review on valorization of oyster mushroom and waste generated in the mushroom cultivation industry. J. Hazard. Mater. 2020, 400, 123156. [Google Scholar] [CrossRef] [PubMed]
  4. Najafi, B.; Ardabili, S.F.; Shamshirband, S.; Chau, K.-W. Spent mushroom compost (SMC) as a source for biogas production in Iran. Eng. Appl. Comput. Fluid Mech. 2019, 13, 967–982. [Google Scholar] [CrossRef]
  5. Gao, X.; Tang, X.; Zhao, K.; Balan, V.; Zhu, Q. Biogas Production from Anaerobic Co-Digestion of Spent Mushroom Substrate with Different Livestock Manure. Energies 2021, 14, 570. [Google Scholar] [CrossRef]
  6. Li, T.-H.; Che, P.-F.; Zhang, C.-R.; Zhang, B.; Ali, A.; Zang, L.-S. Recycling of spent mushroom substrate: Utilization as feed material for the larvae of the yellow mealworm Tenebrio molitor (Coleoptera: Tenebrionidae). PLoS ONE 2020, 15, e0237259. [Google Scholar] [CrossRef] [PubMed]
  7. Gong, X.; Li, S.; Carson, M.A.; Chang, S.X.; Wu, Q.; Wang, L.; An, Z.; Sun, X. Spent mushroom substrate and cattle manure amendments enhance the transformation of garden waste into vermicomposts using the earthworm Eisenia fetida. J. Environ. Manag. 2019, 248, 109263. [Google Scholar] [CrossRef] [PubMed]
  8. Jiang, H.; Zhang, M.; Chen, J.; Li, S.; Shao, Y.; Yang, J.; Li, J. Characteristics of bio-oil produced by the pyrolysis of mixed oil shale semi-coke and spent mushroom substrate. Fuel 2017, 200, 218–224. [Google Scholar] [CrossRef]
  9. Lam, S.S.; Lee, X.Y.; Nam, W.L.; Phang, X.Y.; Liew, R.K.; NY Yek, P.; Ho, Y.L.; Ma, N.L.; Rosli, M.H. Microwave vacuum pyrolysis conversion of waste mushroom substrate into biochar for use as growth medium in mushroom cultivation. J. Chem. Technol. Biotechnol. 2019, 94, 1406–1415. [Google Scholar] [CrossRef]
  10. Liu, D.; Ding, W.; Yuan, J.; Xiang, J.; Lin, Y. Substrate and/or substrate-driven changes in the abundance of methanogenic archaea cause seasonal variation of methane production potential in species-specific freshwater wetlands. Appl. Microbiol. Biotechnol. 2014, 98, 4711–4721. [Google Scholar] [CrossRef]
  11. Waqas, M.; Nizami, A.; Aburiazaiza, A.; Barakat, M.; Ismail, I.; Rashid, M. Optimization of food waste compost with the use of biochar. J. Environ. Manag. 2018, 216, 70–81. [Google Scholar] [CrossRef] [PubMed]
  12. Huang, J.; Liu, J.; Chang, K.; Buyukada, M.; Evrendilek, F. (Co-)pyrolytic performances and by-products of textile dyeing sludge and spent mushroom substrate. J. Clean. Prod. 2020, 261, 121195. [Google Scholar] [CrossRef]
  13. Qiao, J.-J.; Zhang, Y.-F.; Sun, L.-F.; Liu, W.-W.; Zhu, H.-J.; Zhang, Z. Production of spent mushroom substrate hydrolysates useful for cultivation of Lactococcus lactis by dilute sulfuric acid, cellulase and xylanase treatment. Bioresour. Technol. 2011, 102, 8046–8051. [Google Scholar] [CrossRef]
  14. Economou, C.N.; Philippoussis, A.N.; Diamantopoulou, P.A. Spent mushroom substrate for a second cultivation cycle of Pleurotus mushrooms and dephenolization of agro-industrial wastewaters. FEMS Microbiol. Lett. 2020, 367, fnaa060. [Google Scholar] [CrossRef]
  15. Matute, R.G.; Figlas, D.; Mockel, G.; Curvetto, N. Degradation of Metsulfuron Methyl by Agaricus blazei Murrill Spent Compost Enzymes. Bioremediat. J. 2012, 16, 31–37. [Google Scholar] [CrossRef]
  16. Pérez-Chávez, A.M.; Mayer, L.; Albertó, E. Mushroom cultivation and biogas production: A sustainable reuse of organic resources. Energy Sustain. Dev. 2019, 50, 50–60. [Google Scholar] [CrossRef]
  17. Ribas, L.C.; de Mendonca, M.M.; Camelini, C.M.; Soares, C.H. Use of spent mushroom substrates from Agaricus subrufescens (syn. A. blazei, A. brasiliensis) and Lentinula edodes productions in the enrichment of a soil-based potting media for lettuce (Lactuca sativa) cultivation: Growth promotion and soil bioremediation. Bioresour. Technol. 2009, 100, 4750–4757. [Google Scholar] [PubMed]
  18. Ramirez-Bribiesca, J.E.; Soto-Sanchez, A.; Hernandez-Calva, L.M.; Salinas-Chavira, J.; Galaviz-Rodriguez, J.R.; Cruz-Monterrosa, R.G.; Vargas-Lopez, S. Influence of Pleurotus ostreatus spent corn straw on performance and carcass characteristics of feedlot Pelibuey lambs. Indian J. Anim. Sci. 2010, 80, 754–757. [Google Scholar]
  19. Baek, Y.C.; Kim, M.S.; Reddy, K.E.; Oh, Y.K.; Jung, Y.H.; Yeo, J.M.; Choi, H. Rumen fermentation and digestibility of spent mushroom (Pleurotus ostreatus) substrate inoculated with Lactobacillus brevis for Hanwoo steers. Rev. Colomb. De Cienc. Pecu. 2017, 30, 267–277. [Google Scholar] [CrossRef]
  20. Mahfuz, S.; He, T.; Liu, S.; Wu, D.; Long, S.; Piao, X. Dietary Inclusion of Mushroom (Flammulina velutipes) Stem Waste on Growth Performance, Antibody Response, Immune Status, and Serum Cholesterol in Broiler Chickens. Animals 2019, 9, 692. [Google Scholar] [CrossRef]
  21. Chuang, W.Y.; Liu, C.L.; Tsai, C.F.; Lin, W.C.; Chang, S.C.; Der Shih, H.; Shy, Y.M.; Lee, T.-T. Evaluation of Waste Mushroom Compost as a Feed Supplement and Its Effects on the Fat Metabolism and Antioxidant Capacity of Broilers. Animals 2020, 10, 445. [Google Scholar] [CrossRef]
  22. Lee, T.-T.; Ciou, J.-Y.; Chiang, C.-J.; Chao, Y.-P.; Yu, B. Effect of Pleurotus eryngii Stalk Residue on the Oxidative Status and Meat Quality of Broiler Chickens. J. Agric. Food Chem. 2012, 60, 11157–11163. [Google Scholar] [CrossRef]
  23. Chang, S.-C.; Lin, M.-J.; Chao, Y.-P.; Chiang, C.-J.; Jea, Y.-S.; Lee, T.-T. Effects of spent mushroom compost meal on growth performance and meat characteristics of grower geese. Rev. Bras. Zootec. 2016, 45, 281–287. [Google Scholar] [CrossRef]
  24. Rangubhet, K.T.; Mangwe, M.C.; Mlambo, V.; Fan, Y.K.; Chiang, H.I. Enteric methane emissions and protozoa populations in Holstein steers fed spent mushroom (Flammulina velutipes) substrate silage-based diets. Anim. Feed Sci. Technol. 2017, 234, 78–87. [Google Scholar] [CrossRef]
  25. Dai, C.; Ma, H.; He, R.; Huang, L.; Zhu, S.; Ding, Q.; Luo, L. Improvement of nutritional value and bioactivity of soybean meal by solid-state fermentation with Bacillus subtilis. LWT 2017, 86, 1–7. [Google Scholar] [CrossRef]
  26. Shi, H.; Yang, E.; Li, Y.; Chen, X.; Zhang, J. Effect of Solid-State Fermentation on Nutritional Quality of Leaf Flour of the Drumstick Tree (Moringa oleifera Lam.). Front. Bioeng. Biotechnol. 2021, 9, 626628. [Google Scholar] [CrossRef] [PubMed]
  27. Wang, J.; Cao, F.; Su, E.; Zhao, L.; Qin, W. Improvement of Animal Feed Additives of Ginkgo Leaves through Solid-state Fermentation using Aspergillus niger. Int. J. Biol. Sci. 2018, 14, 736–747. [Google Scholar] [CrossRef]
  28. Wu, S.; Lan, Y.; Wu, Z.; Peng, Y.; Chen, S.; Huang, Z.; Xu, L.; Gelbič, I.; Guan, X.; Zhang, L.; et al. Pretreatment of spent mushroom substrate for enhancing the conversion of fermentable sugar. Bioresour. Technol. 2013, 148, 596–600. [Google Scholar] [CrossRef]
  29. Si, M.; Yan, X.; Liu, M.; Shi, M.; Wang, Z.; Wang, S.; Zhang, J.; Gao, C.; Chai, L.; Shi, Y. In situ lignin bioconversion promotes complete carbohydrate conversion of rice straw by Cupriavidus basilensis B-8. ACS Sustain. Chem. Eng. 2018, 6, 7969–7978. [Google Scholar] [CrossRef]
  30. Van Soest, P.J.; Robertson, J.B.; Lewis, B.A. Methods for dietary fiber, neutral detergent fiber, and nonstarch polysaccharides in relation to animal nutrition. J. Dairy Sci. 1991, 74, 3583–3597. [Google Scholar] [CrossRef]
  31. Zhou, J.; Wang, Y.H.; Chu, J.; Luo, L.Z.; Zhuang, Y.P.; Zhang, S.L. Optimization of cellulase mixture for efficient hydrolysis of steam-exploded corn stover by statistically designed experiments. Bioresour. Technol. 2009, 100, 819–825. [Google Scholar] [CrossRef] [PubMed]
  32. Soltanian, S.; Aghbashlo, M.; Almasi, F.; Hosseinzadeh-Bandbafha, H.; Nizami, A.-S.; Ok, Y.S.; Lam, S.S.; Tabatabaei, M. A critical review of the effects of pretreatment methods on the exergetic aspects of lignocellulosic biofuels. Energy Convers. Manag. 2020, 212, 112792. [Google Scholar] [CrossRef]
  33. Brandon, A.G.; Scheller, H.V. Engineering of Bioenergy Crops: Dominant Genetic Approaches to Improve Polysaccharide Properties and Composition in Biomass. Front. Plant Sci. 2020, 11, 282. [Google Scholar] [CrossRef] [PubMed]
  34. Xu, Y.; Awasthi, M.K.; Li, P.; Meng, X.; Wang, Z. Comparative analysis of prediction models for methane potential based on spent edible fungus substrate. Bioresour. Technol. 2020, 317, 124052. [Google Scholar] [CrossRef] [PubMed]
  35. Luo, X.; Yuan, X.; Wang, S.; Sun, F.; Hou, Z.; Hu, Q.; Zhai, L.; Cui, Z.; Zou, Y. Methane production and characteristics of the microbial community in the co-digestion of spent mushroom substrate with dairy manure. Bioresour. Technol. 2018, 250, 611–620. [Google Scholar] [CrossRef] [PubMed]
  36. Xiao, Z.; Lin, M.; Fan, J.; Chen, Y.; Zhao, C.; Liu, B. Anaerobic digestion of spent mushroom substrate under thermophilic conditions: Performance and microbial community analysis. Appl. Microbiol. Biotechnol. 2018, 102, 499–507. [Google Scholar] [CrossRef] [PubMed]
  37. Kumar, R.; Mago, G.; Balan, V.; Wyman, C.E. Physical and chemical characterizations of corn stover and poplar solids resulting from leading pretreatment technologies. Bioresour. Technol. 2009, 100, 3948–3962. [Google Scholar] [CrossRef] [PubMed]
  38. Shibata, N.; Suetsugu, M.; Kakeshita, H.; Igarashi, K.; Hagihara, H.; Takimura, Y. A novel GH10 xylanase from Penicillium sp. accelerates saccharification of alkaline-pretreated bagasse by an enzyme from recombinant Trichoderma reesei expressing Aspergillus β-glucosidase. Biotechnol. Biofuels 2017, 10, 278. [Google Scholar] [CrossRef]
  39. Zhang, J.; Tuomainen, P.; Siika-Aho, M.; Viikari, L. Comparison of the synergistic action of two thermostable xylanases from GH families 10 and 11 with thermostable cellulases in lignocellulose hydrolysis. Bioresour. Technol. 2011, 102, 9090–9095. [Google Scholar] [CrossRef]
  40. Liao, H.; Xu, Y.; Zhang, J. Efficient production of xylooligosaccharides and fermentable sugars from corncob by propionic acid and enzymatic hydrolysis. Bioresour. Technol. 2021, 342, 125680. [Google Scholar] [CrossRef]
  41. Zhou, Y.; Kajiyama, S.; Itoh, K.; Tanino, T.; Fukuda, N.; Tanaka, T.; Kondo, A.; Fukui, K. Development of an enzyme activity screening system for beta-glucosidase-displaying yeasts using calcium alginate micro-beads and flow sorting. Appl. Microbiol. Biotechnol. 2009, 84, 375–382. [Google Scholar] [CrossRef]
  42. Preeti, V.E.; Sandhya, S.V.; Kuttiraja, M.; Sindhu, R.; Vani, S.; Kumar, S.R.; Pandey, A.; Binod, P. An evaluation of chemical pretreatment methods for improving enzymatic saccharification of chili postharvest residue. Appl. Biochem. Biotechnol. 2012, 167, 1489–1500. [Google Scholar] [CrossRef] [PubMed]
  43. Vergara-Barberán, M.; Lerma-García, M.; Herrero-Martínez, J.; Simó-Alfonso, E. Use of an enzyme-assisted method to improve protein extraction from olive leaves. Food Chem. 2015, 169, 28–33. [Google Scholar] [CrossRef] [PubMed]
  44. de Figueiredo, V.R.G.; Yamashita, F.; Vanzela, A.L.L.; Ida, E.I.; Kurozawa, L.E. Action of multi-enzyme complex on protein extraction to obtain a protein concentrate from okara. J. Food Sci. Technol. 2018, 55, 1508–1517. [Google Scholar] [CrossRef]
  45. Berlin, A.; Maximenko, V.; Gilkes, N.; Saddler, J. Optimization of enzyme complexes for lignocellulose hydrolysis. Biotechnol. Bioeng. 2007, 97, 287–296. [Google Scholar] [CrossRef]
  46. Woodward, J.; Hayes, M.K.; Lee, N.E. Hydrolysis of cellulose by saturating and non-saturating concentrations of cellulase-implications for synergism. Bio-Technology 1988, 6, 301–304. [Google Scholar] [CrossRef]
  47. Asha, P.C.; Prema, P. Production of cellulase-free endoxylanase from novel alkalophilic thermotolerent Bacillus pumilus by solid-state fermentation and its application in wastepaper recycling. Bioresour. Technol. 2007, 98, 485–490. [Google Scholar] [CrossRef] [PubMed]
  48. Zhu, Y.; Lee, Y.Y.; Elander, R.T. Conversion of aqueous ammonia-treated corn stover to lactic acid by simultaneous saccharification and cofermentation. Appl. Biochem. Biotech. 2007, 137, 721–738. [Google Scholar]
  49. Al Loman, A.; Ju, L. Towards complete hydrolysis of soy flour carbohydrates by enzyme mixtures for protein enrichment: A modeling approach. Enzym. Microb. Technol. 2016, 86, 25–33. [Google Scholar] [CrossRef]
Figure 1. Effects of different addition levels at 0%, 2%, 4%, 6%, 8%, and 10% (a), hydrolysis times at 8 h, 12 h, 16 h, 20 h, and 24 h (b), respectively, and the ratios of material to water at 1:0.6, 1:0.8, 1:1, and 1:1.2 (c), respectively, on the reducing sugars content of PESMS hydrolyzed by cellulase. Different lower-case letters represent significant differences at p < 0.05.
Agriculture 14 00629 g001
Figure 2. Effects of different xylanase supplemental levels at 2%, 4%, 6%, 8%, and 10% (a), xylanase hydrolysis times at 2 h, 4 h, 6 h, 8 h, and 10 h (b), and ratios of material to water at 1:0.6, 1:0.8, 1:1, and 1:1.2 (c) on the reducing sugars content of PESMS hydrolyzed by xylanase. Different lower-case letters represent significant differences at p < 0.05.
Agriculture 14 00629 g002
Figure 3. Effects of different β-galactosidase addition levels at 0.5%, 1.0%, 1.5%, 2.0%, and 3.0% (a), hydrolysis times at 4 h, 8 h, 12 h, 16 h, and 20 h (b), and the ratios of material to water at 1:0.6, 1:0.8, 1:1, and 1:1.2 (c) on the reducing sugars content of PESMS hydrolyzed by β-galactosidase. Different lower-case letters represent significant differences at p < 0.05.
Agriculture 14 00629 g003
Figure 4. The 3D response surface plots showing relative effect of two fermentation parameters on degradation rate of NDF. (a,b): The response surface diagram of the effect of time and temperature on the degradation rate of NDF. (c,d): The response surface diagram of the effect of time and moisture on the degradation rate of NDF. (e,f): The response surface diagram of the effect of temperature and moisture on the degradation rate of NDF.
Agriculture 14 00629 g004
Figure 5. Theoretical and model predicted response values for the optimal process. (a): When the NDF degradation rate is targeted to reach its maximum within the default range of 11.11–30.00%, and the expected value is set at 1.00, the feasibility of the solution predicted by this model is 0.673. (b): The predicted conditions for the cooperative fermentation of Pleurotus eryngii are as follows: hydrolysis duration 69.973 h, temperature 36.802 °C, moisture content 59.292%, and an NDF degradation rate of 23.816%.
Agriculture 14 00629 g005
Table 1. L9(34) orthogonal test factors and levels.
LevelFactors
Cellulase/%Xylanase/%β-Galactosidase/%
−1661
0882
+110103
Table 2. Results and range analysis of L9 (34) orthogonal experiment design.
NumberFactorsResults
CellulaseXylanaseβ-GalactosidaseRS, mg/gNDF Degradation Rate, %Enzymatic Hydrolysis Effect
1−1−1−1185.3611.1249.45
2−100196.6515.6455.46
3−1+1+1198.7916.6056.68
40−10202.1415.3256.42
500+1206.9717.5059.18
60+1−1201.0716.7257.28
7+1−1+1207.3713.5156.16
8+10−1202.8116.5157.50
9+1+10210.1918.0560.32
k153.8754.0154.74
k257.6357.3857.40
k357.9958.0957.34
Range4.134.082.66
Best level+1+10
Sequencecellulase > xylanase > β-galactosidase
Table 3. The level of each factor in PBD.
LevelBacillus subtilis Inoculum/%
F1
Pediococcus acidilactici Inoculum/%
F2
Saccharomyces cerevisiae Inoculum/%
F3
Time/h
F4
Temperature/°C
F5
Moisture/%
F6
−1222483050
+1101010963660
F1: addition amount of Bacillus subtilis; F2: addition amount of Pediococcus acidilactici; F3: Addition amount of Saccharomyces cerevisiae; F4: fermentation time; F5: reaction temperature: F6: water content of substrate.
Table 4. PBD test and its response value.
Experimental NumberF1F2F3F4F5F6NDF Degradation Rate/%
1−1+1+1−1+1−119.78
2+1−1+1−1−1−115.79
3+1+1−1+1−1−19.35
4+1−1−1−1+1+121.33
5−1−1+1+1+1−119.37
6+1+1−1+1+1−115.87
7−1−1−1−1−1−118.22
8+1+1+1−1+1+122.87
9−1+1−1−1−1+119.71
10−1+1+1+1−1+116.35
11+1−1+1+1−1+114.27
12−1−1−1+1+1+117.64
F1: addition amount of Bacillus subtilis; F2: addition amount of Pediococcus acidilactici; F3: addition amount of Saccharomyces cerevisiae; F4: fermentation time; F5: reaction temperature: F6: water content of substrate. NDF degradation rate: neutral detergent fiber degradation rate.
Table 5. The results of the analysis of variance of the PBD test.
SourcesDegree of FreedomSum of SquaresMean SquareF-Valuep Value
Model6127.1621.19337.460.022
Linear6127.1621.19337.460.022
F1111.19411.1943.940.104
F210.6030.6030.210.664
F313.3183.3181.170.329
F4151.4651.460218.120.008
F5144.73744.737415.760.011
F6115.84715.8475.580.065
Error514.1972.8394
Total11141.357
F1: addition amount of Bacillus subtilis; F2: addition amount of Pediococcus acidilactici; F3: addition amount of Saccharomyces cerevisiae; F4: fermentation time; F5: reaction temperature: F6: water content of substrate.
Table 6. Response surface test factors at three different levels.
LevelTime/hTemperature/°CMoisture/%
ABC
−1243350
0483660
+1723970
A: time; B: temperature; C: moisture. These are the three factors in the response surface test, as the independent variables.
Table 7. Results of the Box–Behnken design for the response surface test.
Experimental NumberTime/h
A
Temperature/°C
B
Moisture/%
C
NDF Degradation Rate/%
Response
10−1+118.17
2−10+111.11
300021.10
4−1−1014.78
5+10−121.79
6−1+1011.34
70+1−120.03
8+1+1022.39
9−10−112.46
10+1−1021.91
1100022.04
12+10+122.18
130−1−118.20
1400021.74
150+1+117.13
A: time; B: temperature; C: moisture. These are the three factors in the response surface test, as the independent variables. NDF degradation rate: neutral detergent fiber degradation rate.
Table 8. Analysis of variance for the quadratic model.
SourceSum of SquaresDegrees of FreedomMean SquareF-Valuep Value
Model238.16926.4639.860.0004**
A: Time186.101186.10280.29<0.0001**
B: Temperature0.5810.580.880.3917
C: Moisture1.9011.902.860.1518
AB3.8313.835.770.0614
AC0.7610.761.140.3345
BC2.0512.053.090.1391
A228.12128.1242.350.0013**
B25.8915.898.880.0308*
C214.51114.5121.850.0055**
Residual3.3250.66
Lack of Fit2.8630.954.130.2009
Pure Error0.4620.23
Cor Total241.4814
The “**” represents an extremely significant difference (p < 0.01); the “*” represents a significant difference (p < 0.05).
Disclaimer/Publisher’s Note: The statements, opinions and data contained in all publications are solely those of the individual author(s) and contributor(s) and not of MDPI and/or the editor(s). MDPI and/or the editor(s) disclaim responsibility for any injury to people or property resulting from any ideas, methods, instructions or products referred to in the content.

