Article

Sh-DeepLabv3+: An Improved Semantic Segmentation Lightweight Network for Corn Straw Cover Form Plot Classification

1
College of Information and Technology & Smart Agriculture Research Institute, Jilin Agricultural University, Changchun 130118, China
2
College of Engineering and Technology, Jilin Agricultural University, Changchun 130118, China
3
Changchun Agricultural Machinery Research Institute, Changchun 130052, China
*
Author to whom correspondence should be addressed.
Agriculture 2024, 14(4), 628; https://doi.org/10.3390/agriculture14040628
Submission received: 13 February 2024 / Revised: 14 April 2024 / Accepted: 16 April 2024 / Published: 18 April 2024
(This article belongs to the Special Issue Smart Mechanization and Automation in Agriculture)

Abstract

:
Straw return is one of the main methods for protecting black soil. Efficient and accurate straw return detection is important for the sustainability of conservation tillage. In this study, a rapid straw return detection method is proposed for large areas. An optimized Sh-DeepLabv3+ model based on the aforementioned detection method and the characteristics of straw return in Jilin Province was then used to classify plots into different straw return cover types. The model used Mobilenetv2 as the backbone network to reduce the number of model parameters, and the channel-wise feature pyramid module based on channel attention (CA-CFP) and a low-level feature fusion module (LLFF) were used to enhance the segmentation of the plot details. In addition, a composite loss function was used to solve the problem of class imbalance in the dataset. The results show that the extraction accuracy is optimal when a 2048 × 2048-pixel scale image is used as the model input. The total parameters of the improved model are 3.79 M, and the mean intersection over union (MIoU) is 96.22%, which is better than other comparative models. After conducting a calculation of the form–grade mapping relationship, the error value of the area prediction was found to be less than 8%. The results show that the proposed rapid straw return detection method based on Sh-DeepLabv3+ can provide greater support for straw return detection.

1. Introduction

The black soil area of Northeast China is an important producer of cereals such as corn and rice. However, soil acidification and soil erosion of varying degrees have been caused by irrational fertilization and the long-term removal of straw from fields [1,2]. This not only affects China’s food security but also poses a serious threat to the environment [3]. Therefore, the conservation and sustainable utilization of black soil resources is a major challenge worldwide. Straw return conservation tillage is a modern tillage technology system that utilizes crop straw return, as well as no-till or less-till sowing, as its main method [4]. It is the simplest and most effective technical measure to increase soil carbon sinks, improve soil structure, fertilize the land, and reduce wind erosion [5]. To encourage farmers in straw return and expedite the adoption of conservation tillage in the black soil of Northeast China, the four northeastern provinces have introduced a subsidy policy for straw return. Therefore, accurate and efficient straw return detection is an important part of straw return subsidy work, and it is also of great significance in guiding the implementation of conservation tillage and realizing sustainable agriculture.
The Ministry of Agriculture and Rural Affairs issued the Technical Guidelines for the 2021 Northeast Blackland Conservation Tillage Action Plan to standardize conservation tillage technology. In addition, they formulated a detailed description of complete and partial straw cover, which can be divided into whole straw cover, root stubble cover, residue stubble cover, and crushed cover according to the cover forms used [6,7]. According to the cover rate, these methods can be divided into complete cover and partial cover approaches. Crop straw or stubble covering more than 70% (inclusive) of the ground surface is recognized as a complete cover approach. Crop straw or stubble covering more than 30% (inclusive) of the ground surface is recognized as partial straw cover [8]. The core of straw return subsidy work is to calculate the areas of complete, partial, and non-straw return plots according to the above instructions. The traditional method for the vast area of the Northeast is performed via visual inspection and rope pulling, but this has the disadvantages of poor efficiency and the use of subjective factors [9].
With the development of computer science and technology, information-based detection methods have gradually emerged. Liu et al. [10], Daughtry et al. [11], and Memon et al. [12] used the remote sensing satellite Sentinel-1 and the multi-spectral satellites LANDSAT-8 and WORLDVIEW-3 to evaluate crop residual cover. However, satellite remote sensing has the disadvantages of being susceptible to weather, having long revisit periods, and having low spatial–temporal resolution, which makes it difficult to obtain higher resolutions. In studies based on agricultural RGB images, traditional machine vision detection methods [13,14,15,16] and deep learning methods [17,18] have been applied for the purposes of detecting the extent of straw return to the field. However, although this method can accurately calculate the straw cover rate by dividing the surface straw and determining the straw return grade of the plots, this method has been mainly adapted to the straw crush form. Moreover, there are certain limitations in the detection of complex straw return forms, and large-scale calculations have also shown that it slows down the detection process to a certain extent. Yu et al. [19] detected winter wheat straw based on UVA images; their method determines the full straw return grade by incorporating ground survey information and visually interpreting information such as plot texture and color in the UVA images. This method avoids extensive straw coverage rate detection and can further accelerate the straw return process. In the same way, we can judge the straw return status of the plots according to the corn straw return cover types in the UVA images, which can realize rapid detection from the source. However, one of the drawbacks of this method is that it requires personnel with specialized knowledge to participate in the determination, which represents a great waste of manpower and time. Therefore, it is imperative to seek an information-based detection method that is founded on the classification and segmentation of plots by straw cover type.
Currently, traditional machine learning-based methods perform well in segmenting regular plots [20,21,22,23,24]; however, for more complex farmland shapes, deep learning solutions usually outperform traditional machine learning methods. Aung et al. [25] used a spatio-temporal U-Net approach for segmenting farmland regions, and the pre-trained models achieved a 0.81 Dice score and 0.83 accuracy. Feng et al. [26] used an improved U-Net for the classification and extraction of crop plots. A U-Net incorporating spatial–coordinated attention achieved better results on a multi-crop dataset, with an accuracy of 92.20%. Huang et al. [27] used an improved OCRNet to detect zucchini intercropped with sunflowers in unmanned aerial vehicle (UVA) visible-light images, and the improved model possessed significant advantages in crop classification and intercrop recognition.
At present, the identification and segmentation of agricultural remote sensing images from high-resolution UAVs have been widely studied and applied. However, these kinds of images contain a large spatial range and more pixel information, which requires more computing resources to process and analyze the data; thus, these features are not conducive to the efficient operation of the model. Therefore, it is necessary to lighten the model and reduce its consumption of computing resources, memory, and storage space. In addition, since different sizes of straw returns have size diversity and morphological complexity in images, the model should be able to effectively extract multi-scale features from the different forms of corn straw return plots, which enables the model to capture various levels of features, from texture details to the overall structure, and to improve segmentation accuracy. Finally, shallow features are enriched with spatial details and local texture information, which are crucial for capturing small-scale structures and achieving accurate edge localization. We used an optimized Sh-DeepLabv3+ model (Shallow-DeepLabv3+, Sh-DeepLabv3+) for classification based on straw cover form plots to ensure the performance of the model in terms of multi-scale feature extraction and shallow feature capture. A fast method for straw return detection based on the combination of a deep learning Sh-DeepLabv3+ model and the threshold segmentation DE-AS-MOGWO method can realize efficient and intelligent straw return detection.

2. Materials and Methods

In this paper, Jilin Province was taken as the study area, and the relationship between corn straw return cover forms and straw return status was explored through field research and expert appraisal. In addition, a mapping relationship between the straw return forms and straw return grades was proposed. Nine types of straw return form images obtained in the field study are shown in Figure 1.
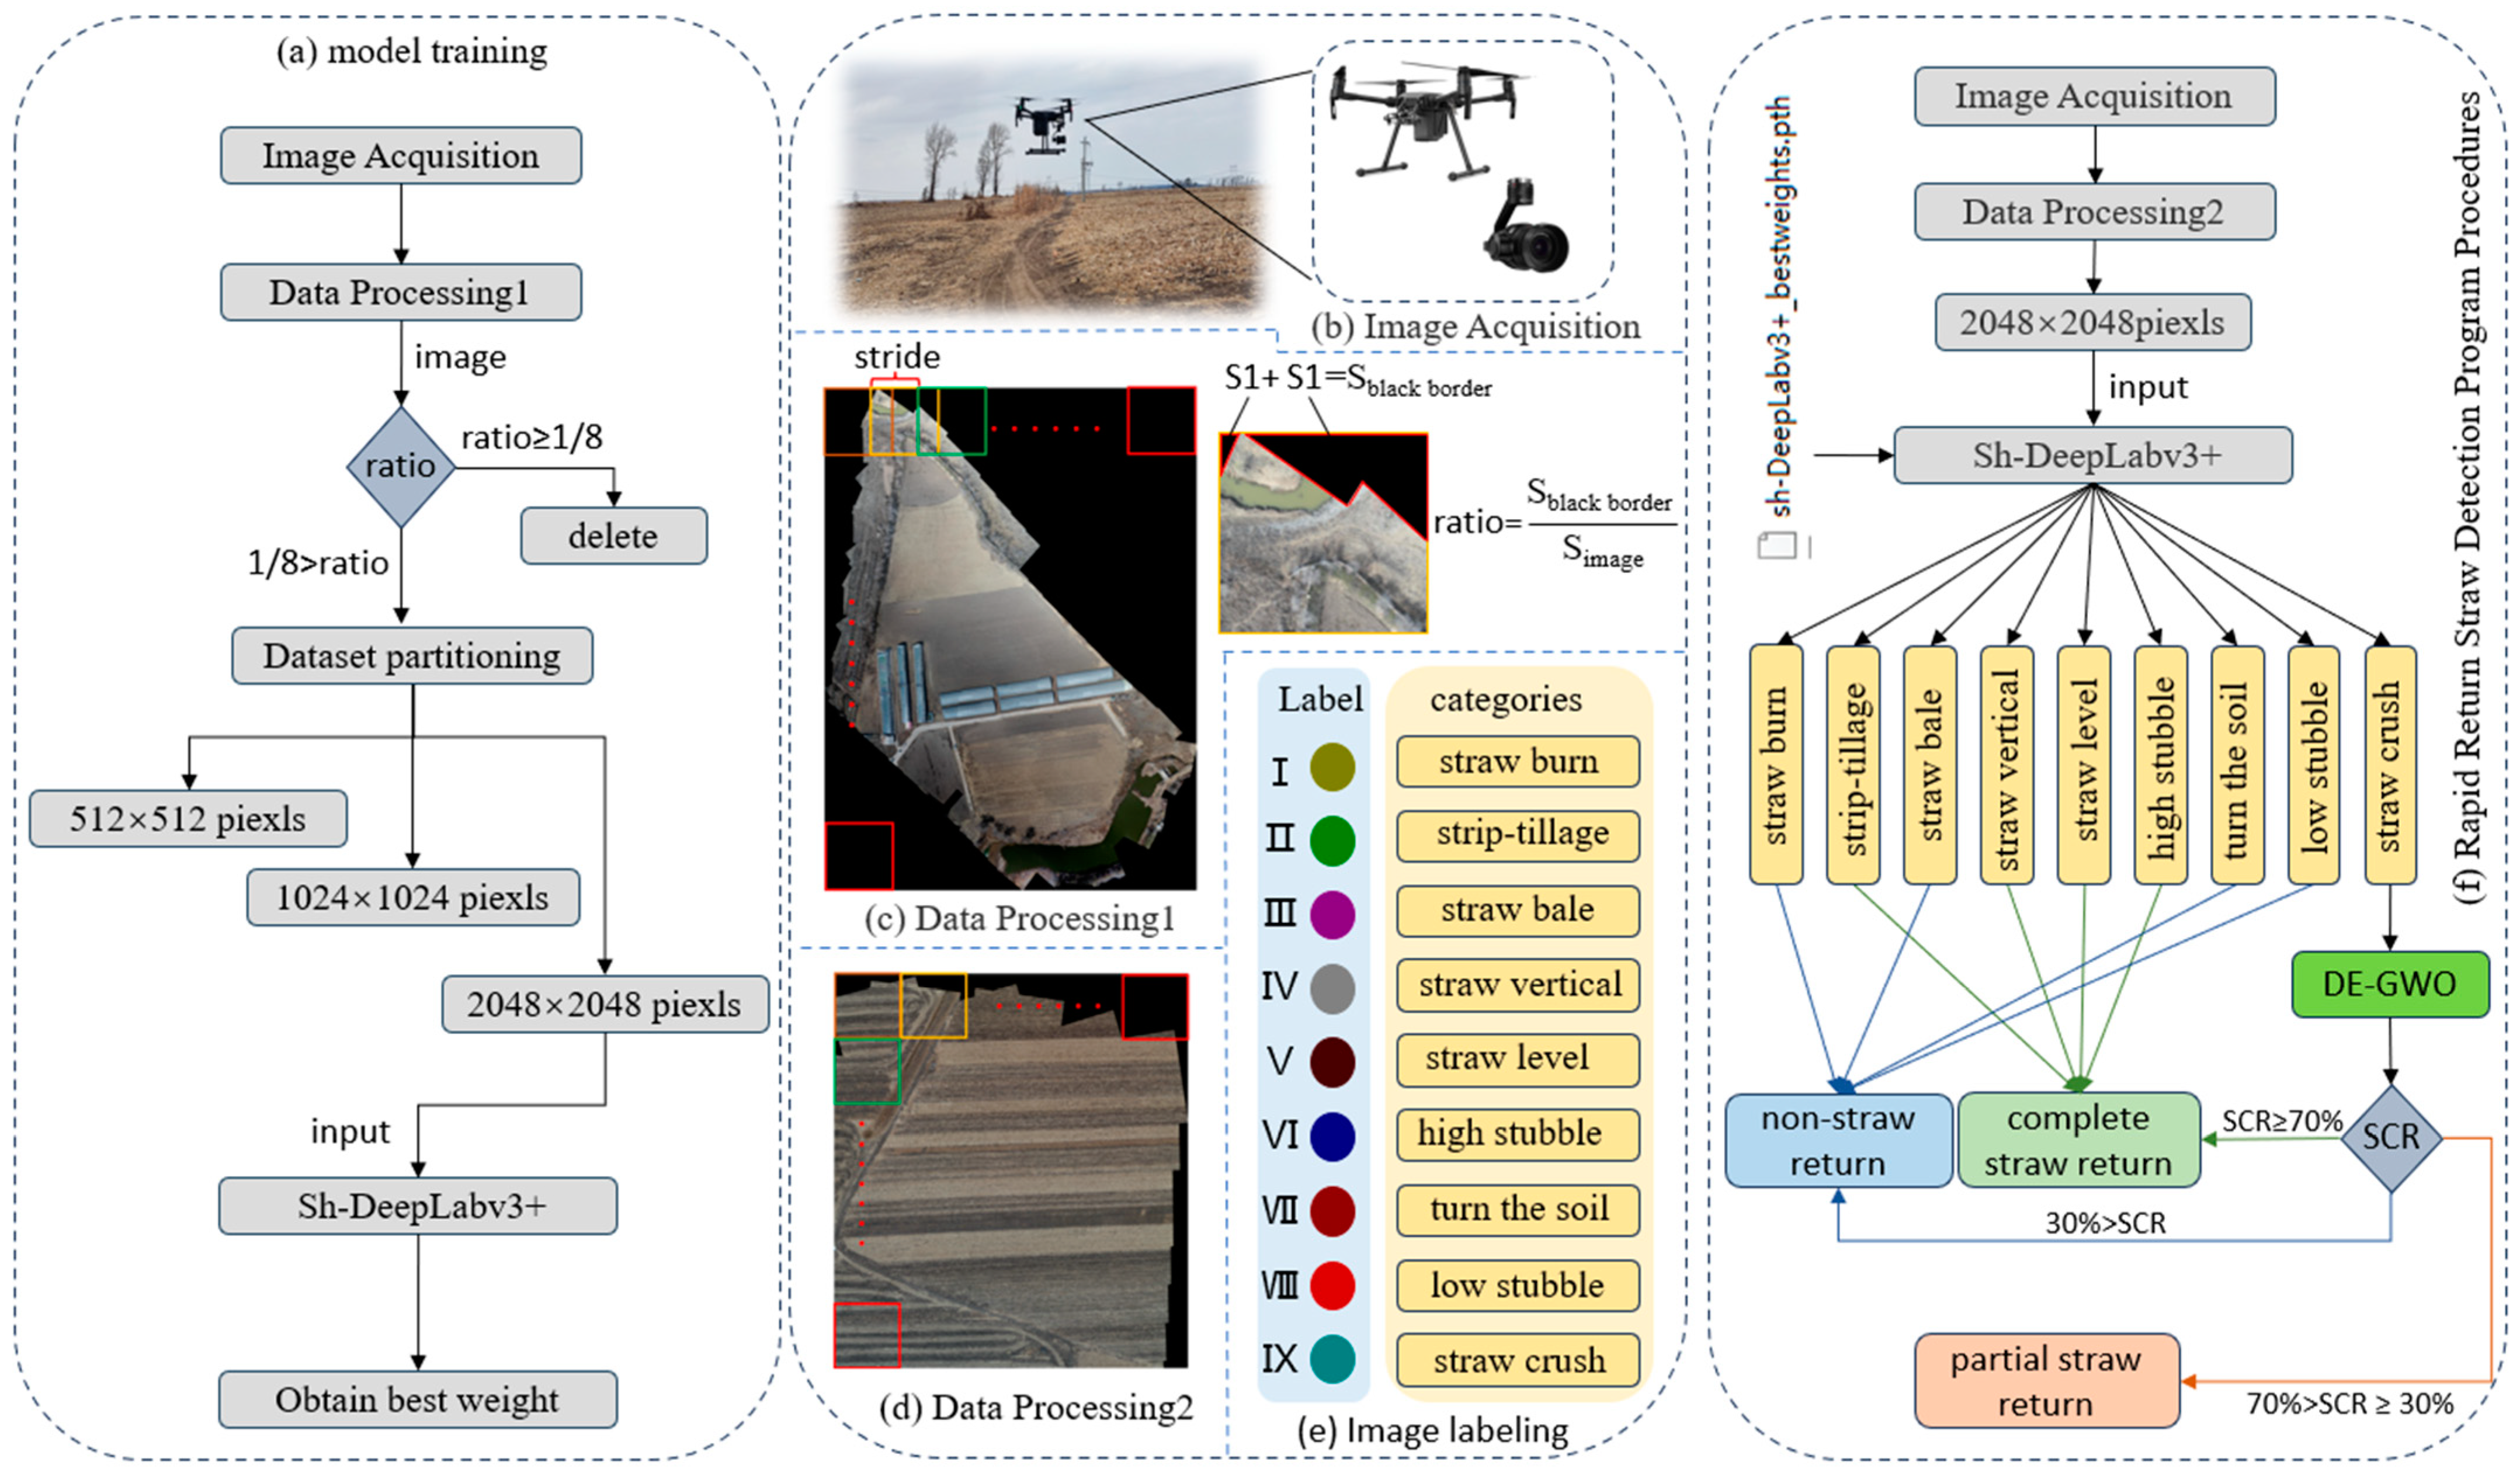
A fast straw return detection method was proposed by combining the two defining criteria of the straw coverage form and straw coverage rate (SCR): Firstly, the Sh-DeepLabv3+ model was used to classify and segment the fields with different straw coverage forms in the farmland. According to the mapping relationship, the plots were assigned as belonging to the total straw return grade when straw vertical, straw level, and high stubble forms were detected. When straw burn, straw bale, turn soil, and low stubble forms were detected, the plots were understood as belonging to the non-straw return grade. When detected as straw crush, we extracted the corresponding plots in the original map according to the predicted image. Secondly, we calculated the SCR for each straw crush form plot with the threshold segmentation algorithm DE-AS-MOGWO [15]. We classified the plots as follows: the plot was of a total straw return grade when the SCR was found to be greater than or equal to 70%; the plot was of a partial straw return grade when the SCR was greater than or equal to 30% and less than 70%; and the plot was of a non-straw return grade when the SCR was less than 30%. Finally, the number of pixels corresponding to the three straw return grades was counted. The corresponding areas of the three straw return grades were calculated according to the ground sampling distance (GSD). This method eliminates the need to calculate large-scale SCRs, and it also speeds up the straw return detection process. The flowchart of the rapid straw return detection method is shown in Figure 2f.

2.1. Data Acquisition

The images used for model training in this paper were collected from four farmlands in Changchun, Yushu, Dewei, and Jilin Province (125.3893342° E, 43.8168784° N; 125.5002287° E, 43.8670143° N; 125.6564316° E, 44.5830458° N; and 126.2287119° E, 45.0979541° N, respectively), and they were acquired via a DJI Matrice 200 V2 UVA equipped with a Zenmuse X5S gimbal camera to take aerial photographs at a distance of 50 or 60 m from the ground (Figure 2b). Acquisition took place between 8:00 am and 4:00 pm when the weather was sunny or cloudy. During aerial photography, the lens was aimed vertically downward with an 80% overlap on both the side and heading directions, and the raw images were stored in JPG format with a resolution of 5280 × 2970 pixels.

2.2. Dataset Production

We implemented photometric and color standardization at the image preprocessing stage to reduce the differences between the images when subjected to different lighting conditions, which involved white balance adjustments and exposure compensation of the images to ensure image consistency. Stitching multiple images into one large image and then segmenting them was performed to reduce the large sizes of the UVA aerial images. This method can effectively reduce the image size required for inputting neural networks, decrease memory consumption, and increase training efficiency. In this study, we used Microsoft Image Composite Editor software (v 2.0.3.0) for image stitching. The stitched Images I~IV are shown in Figure 1.
Nine types of straw cover forms in four of the stitched image plots were manually labeled with the labeling tool LableMe [28]. In addition, the labeled images were single-channel with a depth of 8 bits, in which Label Color I represents other features, Label Color II represents the straw burn form, Label Color III represents the strip tillage form, Label Color IV represents the straw bale form, Label Color V represents the straw vertical form, Label Color VI represents the straw level form, Label Color VII represents the high stubble form, Label Color VIII represents the turn soil form, Label Color IX represents the low stubble form, and Label Color X represents the straw crush form (Figure 2e).
The stitched and labeled images were cropped at the scales of 512 × 512 pixels, 1024 × 1024 pixels, and 2048 × 2048 pixels, with cropping steps of 250 pixels, 500 pixels, and 700 pixels, respectively. After deleting the images that had black borders occupying more than 1/8 of the images (Figure 2c), the remaining images were then filtered and randomly selected. There was a total of 16,070 images in the final dataset at each scale. The three datasets were divided into training, validation, and test sets in the ratio of 7:2:1, and they were produced as Pascal VOC 2007 format datasets.

2.3. Using the Sh-Deeplabv3+ Model in the Identification and Segmentation of Plots with Different Straw Cover Forms

2.3.1. The Network Architecture

The DeepLab series is a pixel-level-based semantic segmentation model that was proposed by Chen et al. [29,30,31,32]. Since the initial DeepLabv1, the aforementioned model has seen its ability to capture valid information continuously improved by the introduction of atrous convolution and pyramid pooling modules. DeepLabv3+ was chosen as the base network architecture for this study due to its excellent segmentation accuracy. However, due to the large number of DeepLabv3+ parameters, it is currently unable to meet the lightweight application requirements of straw return detection. In addition, important features such as the texture and color of plots with different straw cover forms need to be extracted from the shallow layer of the network. Moreover, DeepLabv3+ has a weak ability to extract shallow feature information, and although the fusion of multi-scale information was performed through the Atrous Spatial Pyramid Pooling (ASPP) module, the shallow feature extraction still has certain limitations compared to the deep feature one. Therefore, making the model lightweight while strengthening the feature extraction capability is still a challenge for the straw return detection task.
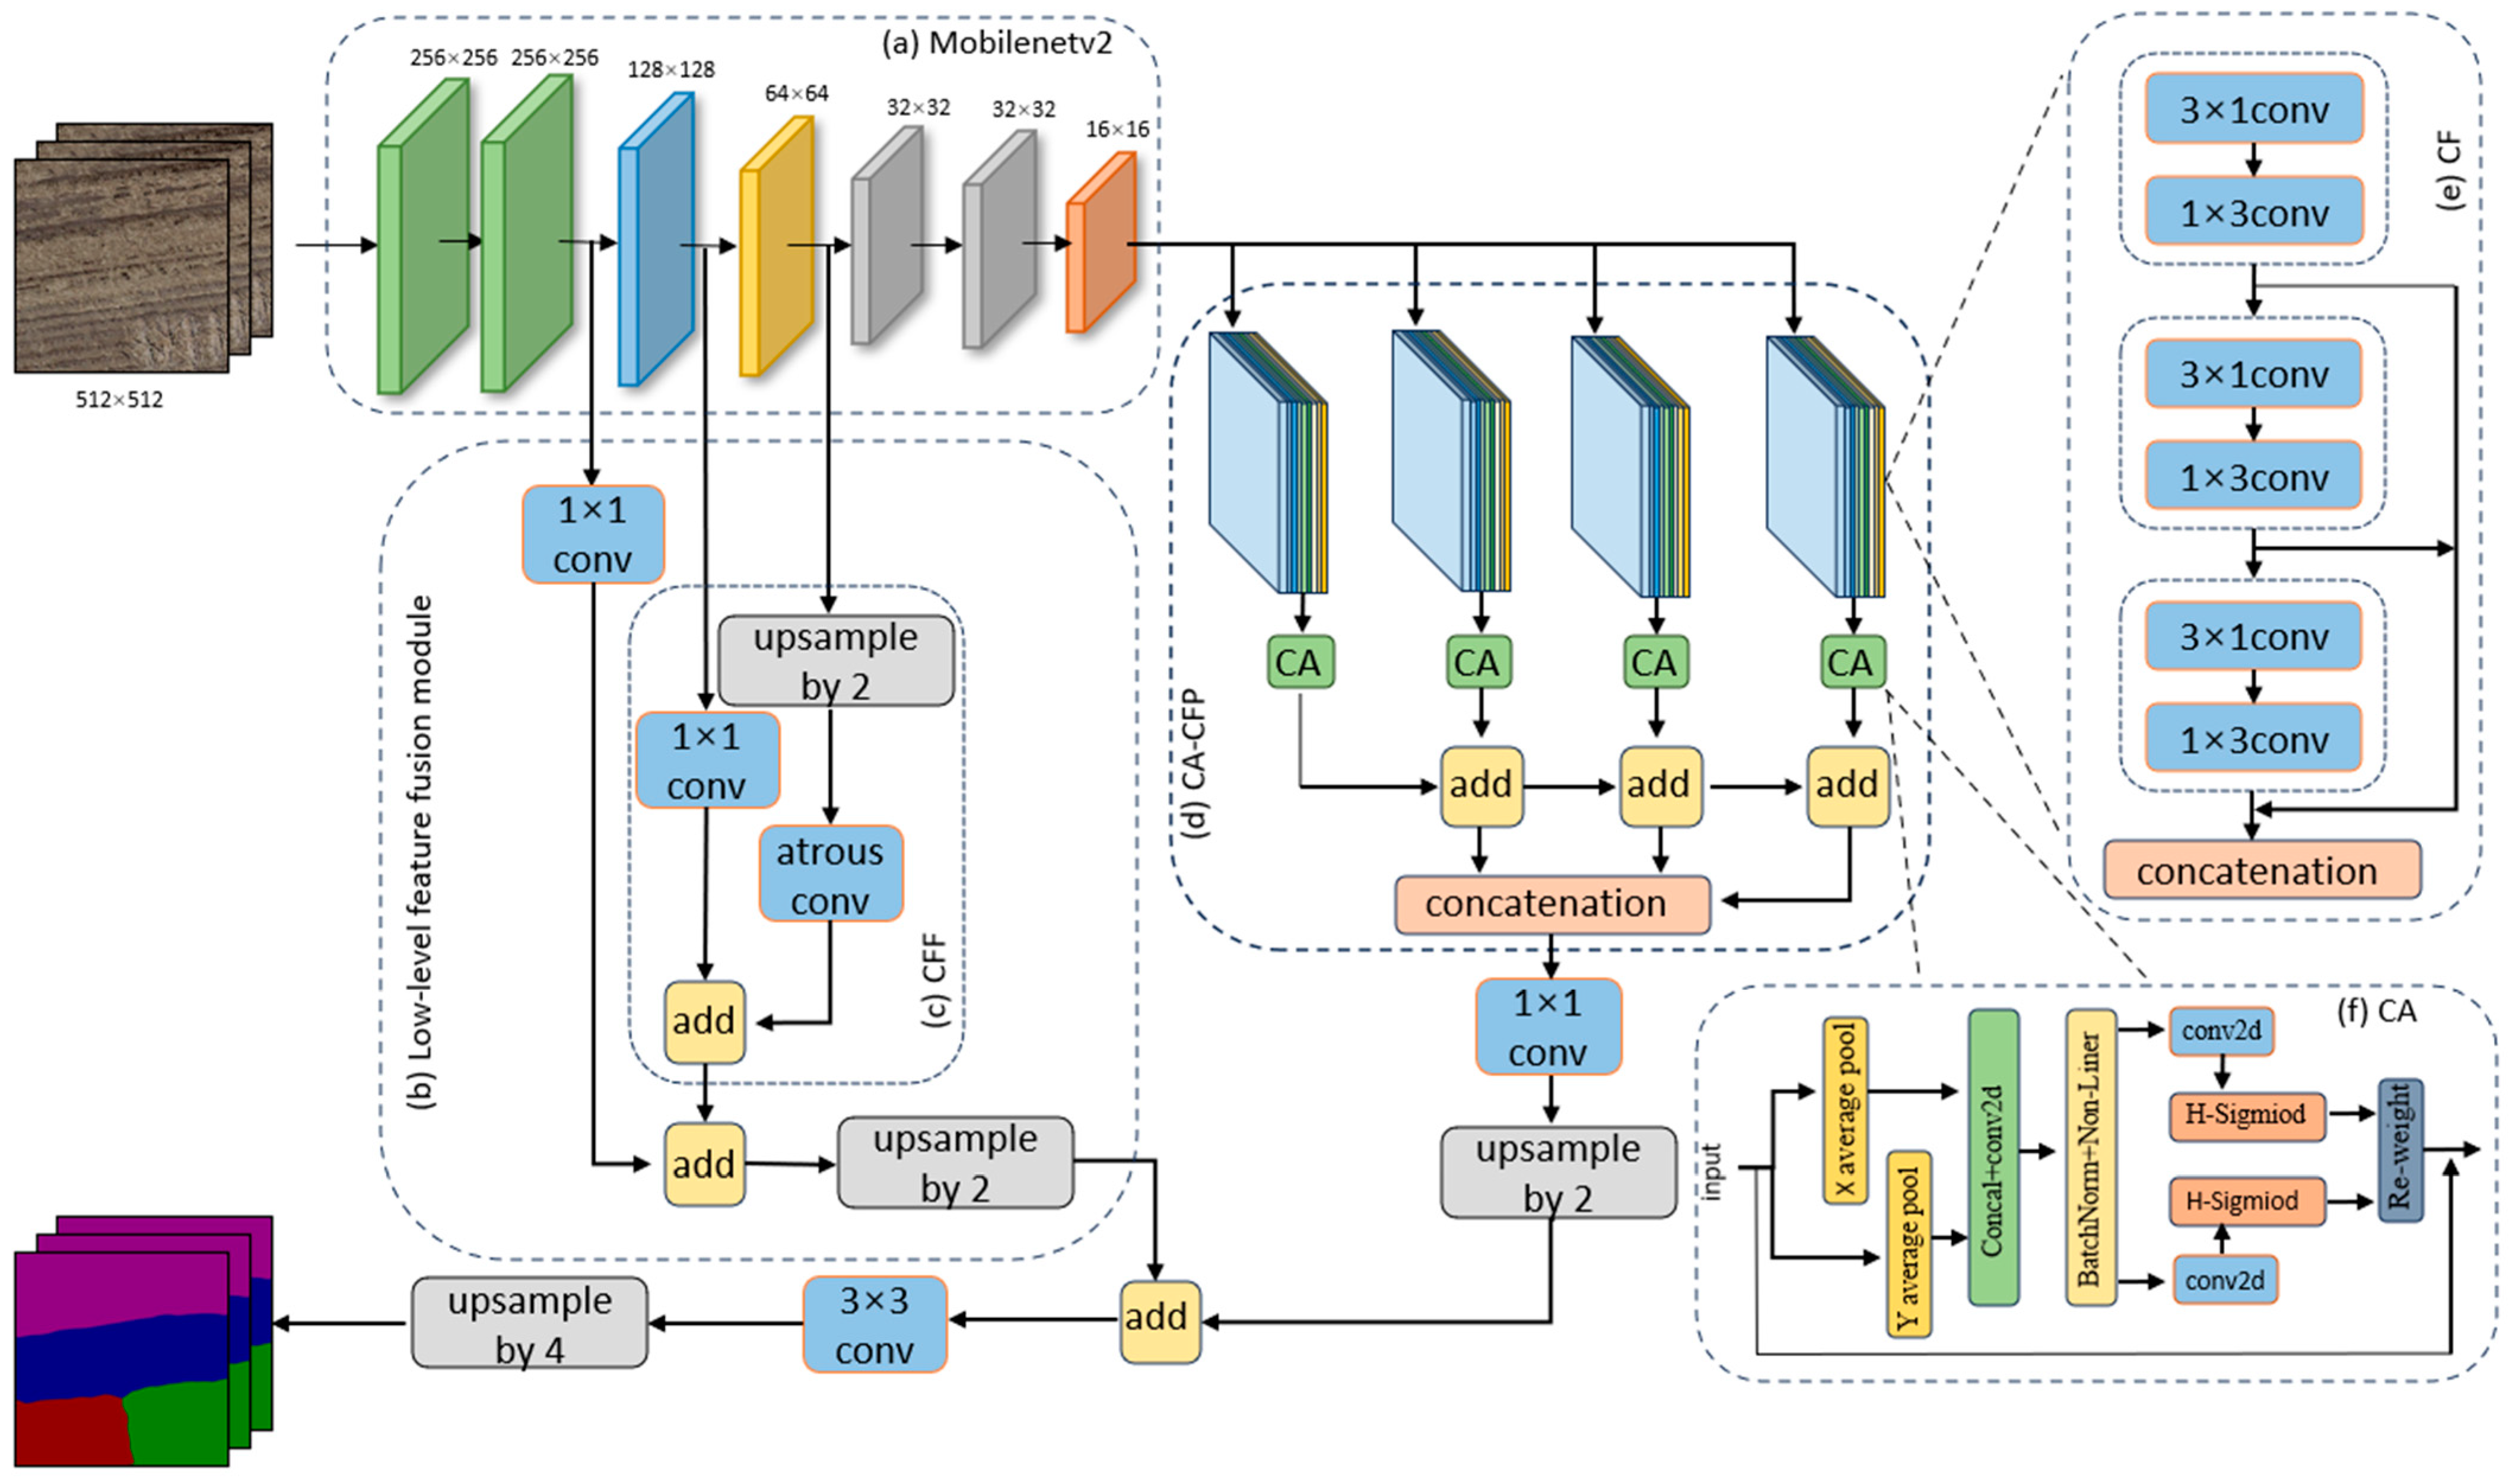
In this study, we named the optimized DeepLabv3+ model Sh-Deeplabv3+ (Figure 3). We introduced the lightweight network MobileNetv2 [33] in the backbone feature network, which reduced the model inference time and effectively improved the expressive power of feature extraction, to improve the model recognition accuracy while reducing the model parameters. We also replaced the ASPP module with CA-CFP, which can extract the contextual information of straw return images of various scales sizes and can make the models focus on the semantics of different straw cover forms. The LLFF module fuses the shallow information extracted in the front part of the backbone network to further reduce the loss of bottom-dimensional features. In addition, a composite loss function was utilized to address the error due to the imbalance in the sample size of the dataset.

2.3.2. CFP Module Based on the CA Attention Mechanism (CA-CFP Module)

The original ASPP structure in the DeepLabv3+ model expands the sensory field by connecting the feature maps that are formed via atrous convolutions with different dilation rates such that the feature maps contain information at multiple scales. However, in the straw return detection task, the model is better trained for large-scale data due to the discontinuity of the plots in each input image; as such, it is usually necessary for the image to have a large resolution to keep the training image content intact. Therefore, ASPP requires a large dilation ratio to adapt to large-scale high-resolution images. Additionally, as the expansion rate increases, the expansion convolution becomes increasingly ineffective, thereby leading to a gradual loss in its modeling ability. To address this situation, we used the introduction of CA-CFP (Figure 3d).
The CFP [34] contains 4 channels, and each channel consists of an asymmetric convolutional FP module which uses the idea of factorization. (Figure 3e). Additionally, the 3 asymmetric convolutional blocks in the FP have dimensions of M/16, M/16, and M/8. Jointly forming the 4 FP channels into a parallel structure with an expansion rate of {r1 = 1, r2 = 2, r3 = 4, r4 = 8} can reduce the channel parameters by allowing the module to learn features from a range of sizes in the receptive fields. Finally, the hierarchical feature fusion method was used to total up all the channel outputs in order to mitigate the mesh artifacts generated during the feature fusion, as well as to compensate for the lack of feature information generated via atrous convolution. Therefore, the CFP module does not require an excessive expansion ratio; instead, the efficient extraction of features of different straw cover forms and multi-scale feature aggregation can be achieved by multi-level convolution and a channel feature pyramid structure. This, in turn, effectively avoids the ineffective modeling that occurs when using expansion convolution in the ASPP module without affecting the performance.
As the spatial distribution of the straw return plots in the farmland was relatively regular, and as different categories of straw return forms have strong normality (such as the strip tillage form category), the width of the strip was set according to the parameters of the strip tillage machinery and the local common row spacing. In addition, the intervals between them were relatively regular. Moreover, the straw crush form plots usually used mechanical equipment for straw cover, the straw cover was uniform and regular, and the form and distribution of the straw were also relatively uniform. To capture these obvious and important characteristics, the overall network attention should be focused on capturing the correlation and differences between the straw cover forms. In this paper, the CA attention mechanism [35] (Figure 3f) was added after the CF module to ensure that the model focuses on the key features that characterize different straw cover forms. This helps to reduce the interference of other background information, such as roads and weeds, to the model, thus improving the accuracy and reliability of the model’s identification.

2.3.3. Low-Level Feature Fusion Module

The DeepLabv3+ decoder mainly improves the segmentation accuracy by fusing shallow and deep features [36]. Shallow features refer to the features that are extracted from the first few layers of the backbone network, which mainly contain important features such as color, edge texture, and other information. However, the shallow features are only extracted with 1 × 1 conv, and the main factor affecting the performance is when the semantic information extraction ability is weak and there is more noise in the features [37]. In the task of identifying different straw return forms in different plots, the main measurements for distinguishing different straw return forms are found in the low-level features such as texture and color, which are formed by the straw or soil on the ground. In the original network, the low-level features are processed by 1 × 1 conv, which is an approach that fuses and splices the shallow features with the deep features at 1/2 the size of the original map. However, such an approach can likely lead to losing the low-level feature information [38]. In this study, we used the LLFF module (Figure 3b) to fuse the different scales of the underlying feature maps in the MobileNetv2 backbone network in order to improve the ability of the model to characterize the information.
Firstly, the original 1/8-size feature map and 1/16-size feature map that were extracted from the backbone network were used as inputs to the CFF module (Figure 3c). Bilinear upsampling was performed on the 1/16th branch, and then a 3 × 3 atrous convolution with a dilation rate of 2 was passed to make the size and receptive field consistent with the 1/8-size branch. Next, the number of channels in the two branches was unified. Then, the fusion features were obtained by totaling up the features of the two branches. To further fuse the shallow features, we aggregated the original 1/2-size feature map and the fused features again to obtain the new fused features. Finally, the new fused features and the final features obtained in the coding layer were superimposed, and the superimposed features were then upsampled 4 times bilinearly in order to gradually recover the original image semantic information.

2.3.4. Loss Function

Cross entropy loss (CE loss) [39] is a common loss function for image segmentation tasks. It is used to evaluate the difference between the predicted value and the true value of each pixel point. Its calculation formula is as follows:
C E   l o s s = 1 N i = 1 N j = 1 M y i j log p i j
where N represents the number of pixels; M represents the number of categories; y i j represents the sign function, which takes a value of 1 if the true category of sample i is equal to j and a value of 0 otherwise; and p i j represents the predicted probability that pixel i belongs to category j. However, as strip tillage is the main black soil conservation tillage technique used in Jilin Province, the number of pixels in the strip tillage forms category in the straw return dataset was found to be far more than the number of pixels in the straw vertical forms category, etc. Such an imbalance in the categories will lead to creating a bias in the model toward the strip tillage form category. Therefore, we introduced dice loss [40], which is used to evaluate the similarity between the predicted segmentation image and the real segmentation image as an auxiliary loss function, to solve this problem. Dice loss is more robust to the unevenness of the category data in the straw return dataset than CE loss, and it can also effectively alleviate the impact of large differences in the number of pixels in each category. The formula for this is as follows:
D i c e   l o s s = 1 2 i = 0 p t i y i + ε i = 1 p t i 2 + i = 0 p y i 2 + ε
where t i represents the predicted value of the model for sample i, y i represents the real label corresponding to sample i, and ε is the moderating factor. Based on the above considerations, we used the composite loss function L l o s s , which is composed of CE loss and Dice loss, to train the model. This composite function is computed as follows:
L l o s s = C E   l o s s + D i c e   l o s s

2.4. Experient Platform and Parameter Settings

The computing equipment used in this study was as follows: an AMD EPYC 7532 32-Core Processor (i.e., the central processor of the mainframe), an NVIDIA GeForce RTX 3090 with a 24 GB video memory graphics card, and the Ubuntu 18.04 operating system. We also used Python version 3.8 and Torch version 1.7.0 software. In addition, over the course of several trials, we chose stochastic gradient descent as the optimizer, with a momentum parameter of 0.9 and an initial learning rate of 7 × 10⁻³. The minimum learning rate of the model was 0.01 times that of the maximum learning rate, the learning rate descending mode was cos, and the weight decay coefficient was set to 1 × 10⁻⁴. The image resolution of the input network was set to 512 × 512 pixels, the model was trained for 100 epochs, and the batch size was set to 8. In addition, the number of threads was set to 16 in order to run the program efficiently.

2.5. Evaluation Indices

In this study, total parameters and FLOPs [41] were selected as the evaluation metrics for evaluating the model’s complexity. Mean intersection over union (MIoU) [41], mean average precision (mAP) [42], and precision [43] were used as the metrics for evaluating the segmentation accuracy. The formulas for the aforementioned metrics were calculated as follows:
M I o U = 1 c C = 1 c T P T P + F P + F N
A P = T P + T N T P + T N + F P + F N
m A P = 1 c C = 1 c A P
P r e c i s i o n = 1 c C = 1 c T P T P + F P
where TP, FP, FN, and TN are the number of pixels for which the model correctly predicted the straw cover form, the number of pixels for which the model incorrectly predicted the samples of other straw cover forms as the correct straw cover form, the number of pixels for which the model incorrectly predicted the samples of the correct straw cover form as the other straw cover forms, and the number of pixels for which the model correctly predicted samples of other straw cover forms, respectively. In addition, c is the total number of categories.

3. Results

3.1. Comparison of Segmentation Accuracy under Different Scale Datasets

As shown in Table 1, we used the DeepLabv3+, UNet [44], and Segformer [45] models to explore the results in order to investigate the effect of the three scale sizes in the straw return dataset on the model’s accuracy.
According to the experimental results shown in Table 1, the segmentation accuracy of the datasets with different scales via the three semantic segmentation models was quite different. The prediction accuracy of the 512 × 512-pixel dataset was low in the DeepLapv3+, UNet, and Segformer models, and the prediction accuracy of the 2048 × 2048-pixel dataset was found to be the highest. In the Segformer model, the MIou, mPA, and precision for the 2048 × 2048-pixel dataset were 9.46, 7.08, and 1.33 higher than those for the 1024 × 1024-pixel dataset and 11.68, 5.08, and 1.53 higher than those for the 512 × 512-pixel dataset (which were also significantly higher than those in the DeepLabV3+ and UNet models), respectively. This shows that Segformer is more sensitive to the dataset scale and that DeepLabV3+ and UNet are relatively stable. In the straw return dataset at both the 512 × 512-pixel and 1024 × 1024-pixel scales, the prediction accuracy of UNet was found to be generally higher than that of the DeepLabv3+ model. However, with the exponential growth of the dataset size rising up to 2048 × 2048 pixels, we could see that the MIoU and mPA of the DeepLabv3+ model surpassed the MIoU and mPA of the UNet model. Thus, the DeepLabv3+ model showed better potential as it is more adaptable to large-scale straw return images. Additionally, we could see that, with the exponential growth in the dataset scale, the prediction accuracy of the model also increased. The reason for this phenomenon is that the model unifies the size of the input images and resizes all the input images to 512 × 512 pixels. The image only loses a small part of the feature information after resizing with respect to the low-altitude remote sensing image characteristics of the straw return; having said that, the image retains more of the straw cover form feature information, which increases the receptive field of the image. When training the model, we speculated that the images that were too large would lose too much of the feature information, and the model training time would be longer. According to the selected model and hardware performance of the experimental computer setup, we chose the dataset with a 2048 × 2048-pixel scale as the input of the model in the subsequent experiments.

3.2. Comparative Experiments on Different Backbone Networks

Xception [46], MobileNetv2 [33], MobileNetv3-small, and MobileNetv3-large [47] were selected as the backbone networks of DeepLabv3+ to investigate the effect of different backbone networks on the model, the experimental results of which are shown in Table 2. As can be seen from Table 2, when MobileNetv2 was used as the backbone network, the MIoU, mAP, and precision of the model on the straw return dataset were 93.37%, 97.96%, and 95.20%, respectively. Each evaluation metric was less than one percentage point lower than when Xception was the backbone network; furthermore, the MIoU, mAP, and precision metrics were found to be much higher than when MobileNetv3 was used as the backbone network. When Xception was used as the backbone network, its total params were 9.4 times higher than when MobileNetv2 was used as the backbone network. This was due to the fact that several of the lightweight models were designed to reduce the computational parameters with the help of replacing ordinary convolution with deep separable convolution; however, Xception does not make adjustments on the residual structure, which leads to a fragmented computational process that can achieve better results at the cost of more parameters. MobileNetv3 uses the neural network architecture search technique to construct a network structure, which thus makes the model structure more rationalized and means it can deliver a better performance; having said this, its accuracy still needs to be improved. MobileNetv2 uses a linear bottleneck and inverse residual structure, which effectively balances the total params and accuracy. Therefore, MobileNetv2 was used as the backbone feature extraction network for DeepLabv3+, which ensured that the model was lightweight and had high feature extraction capability.

3.3. Ablation Experiments

In order to verify the contribution of introducing CA-CFP, the LLFF model, and Lloss, MobileNetv2 was used as the backbone feature extraction network in the basic model. The ablation experiments were carried out based on this model, and the experimental results are shown in Table 3. After the introduction of the CFP module, the MIoU, mAP, and precision of the model were improved by 1.04%, 0.21%, and 0.89%. After the introduction of the CA attention mechanism in CFP, it could be seen that the model with the CA-CFP module improved in all metrics over those with the CFP module, which proved that the incorporation of the CA attention mechanism generates a set of weight parameters and makes the model more effective at catching the interested straw cover form features. When the LLFF module was introduced, it improved the base model by 1.16%, 0.08%, and 1.28% in terms of MIoU, mAP, and precision, respectively. This further helped with integrating the information of the low-level features and further enhanced the information characterization ability of the final fused features. The composite loss function Lloss balanced the effect of the difference in the number of pixels in each category, such that the MIoU, mAP, and precision of the model were improved by 0.97%, 0.06%, and 0.96%, respectively. In addition, the composite loss function was able to more accurately measure the performance of the model and optimize the training process. In summary, in this paper, we propose that the introduction of CA-CFP, the LLFF model, and Lloss into the model helps to improve the accuracy, and it can also aid in the model better recognizing and segmenting the plots that have different straw cover forms.

3.4. Comparison of the Different Semantic Segmentation Models

To verify the effectiveness of the model proposed in this paper with respect to corn straw return cover form plot identification and segmentation, FCN, Lraspp, UNet, Segformer, DeepLabv3, and DeepLabv3+ were selected to be compared with the improved DeepLabv3+(Sh-DeepLabv3+) model. The experimental results are shown in Table 4, and a comparison of the accuracy of the different models is shown in Figure 3a. The memory usage of the improved Sh-DeepLabv3+ model was 15.6 MB. Although the model memory usage of Lraspp and Segformer was 2.72 MB and 1.42 MB less, respectively, compared with Sh-DeepLabv3+, the accuracy was also much lower than that of the improved Sh-DeepLabv3+ model. Compared with FCN, Lraspp, UNet, DeepLabV3, and DeepLabV3+, the memory of the Sh-DeepLabv3+ model was reduced by 8.06, 10.74, 5.97, and 13.38 times, respectively. The total params and FLOPs were lower than those of FCN, Lraspp, UNet, Deeplabv3, and Deeplabv3+, and the improved model could also meet the requirements of the lightweight models. In terms of segmentation accuracy, our model achieved the best results with respect to the evaluation metrics (MioU: 96.22%, mAP: 98.52%, and precision: 97.91%). It can be seen from Figure 4b that the model delivered an excellent performance in the classification of all kinds of straw return forms. The MIoU, mAP, and precision were, at least, 1.96%, 0.38%, and 2.28% higher, respectively, compared to the other network models. The accuracy of DeepLabv3+ was the second highest, and the lowest accuracy of the three evaluation indexes was for Segformer (i.e., its MIoU was 54.08% and the precision was only 60.46%, which was 38.31% lower compared to the improved Sh-DeepLabv3+ model).
Five test set images were selected to help compare the prediction effect of the seven different models, the results of which are shown in Figure 5. It can be seen that the FCN model delivered rough edge processing when segmenting the plots that had different straw cover forms, as can be seen in Image II, Image IV, and Image V. In addition, certain categories such as low stubble and grass (background) were misclassified as other categories, and the recognition effect of roads was also poor in Image I. Lraspp delivered a large recognition error on Image V, and it did not extract the semantic feature information of low stubble form plots well, thereby resulting in an incomplete segmentation of such plots. This was due to the use of a lightweight RedinNet structure and atrous convolution pyramid pooling. Although these functions can make the model better and faster when deployed in a production environment, its lightweight build can also lead to a certain degree of information loss as it cannot accurately extract the plot category information as well as the small target features. The UNet model was relatively accurate for the classification of the large regions of the image, but the segmentation boundary was still heavily jagged and some of the regions were even processed with the islanding phenomenon. This was due to the symmetric encoder–decoder structure of the UNet model, which leads to a weak extraction ability with respect to contextual information; moreover, there were also certain difficulties that were encountered in the segmentation of complex scenes. The hierarchical transformer structure was used in the Segformer model for the purpose of extracting multi-scale structural features. However, as it operates at the block level, it does not have sufficient ability to perceive the details of the image. Therefore, the segmentation of the edge details was not strong enough, which led to the straw level form being recognized as the straw bale form in Image III. DeepLabv3+, in the recognition and segmentation of the image, was found to be better than DeepLabv3 as the decoder module introduced in DeepLabv3+ via the anti-convolution and jump connection was able to gradually restore the original resolution features. However, DeepLabv3+ still produced wrong segmentations, as can be seen in the strip tillage form plot that was partially identified as the low stubble form category in Image V. Therefore, the model still has a great deal of room for optimization with respect to the extraction of low-level features. According to the extraction results, the Sh-DeepLabv3+ model can maintain the boundary information between plots well with different coverage forms when compared with the other six models. In addition, the whole segmented image is presented more smoothly with fewer islands, and it is less prone to mis-segmentation due to being highly robust.

3.5. Application Experiments

We applied the rapid straw return detection method to verify the accuracy and speed of the improved Sh-DeepLabv3+ model in the field experiments. The UVA aerial images of the four regions, located in Donggang Village, Dewei City (125.6507532° E, 44.5846345° N) and Dagang Village, Yushu City (126.2232495° E, 45.0978996° N), that were selected for this experiment were captured in November 2023. The images used for the experiment were captured in the same way as the training images; however, the regions used for the training stage were different than the regions used for the experiment. The selection of the shooting area of this image was different from the training area of the model, so we can further explore the generalization and detection effect of the model through this experiment.
First, the aerial images were preprocessed. After stitching and labeling the image, the segmentation of the image was conducted in steps of 2048 in accordance with a 2048 × 2048 pixel size (Figure 2d). The inputs for Sh-DeepLabv3+, DeepLabv3+, and UNet were used in the predictions of what straw cover forms were present in the plots. The prediction results and prediction process diagram are shown in Table 5 and Figure 6, respectively. It can be seen that the prediction accuracy of the model proposed in this paper was 1.11% and 0.89% higher than that of the other two models, and the running time was short.
The confusion matrices for the four regions are shown in Figure 7. From Figure 7, it can be seen that the elements on the diagonal line in the confusion matrix plot are brighter than those in other positions, which indicates that the improved model had a higher accuracy in its segmentation of the straw return forms. The predictions of the different straw cover forms in the four regions, as well as the statistics of the number of labeled pixel points and the SCR calculation results of the extracted plots of the straw shredded forms, are shown in Table 6 and Table 7.
The number of pixels was calculated based on the form of straw coverage and the SCR results of the area in order to determine whether the straw return forms were complete return, partial return, or non-return, and the predicted area was calculated based on the corresponding ground sample distance (GSD) (cm/pixel). The aerial height of this experiment was 50 m, where one pixel represents a 1.1 cm distance on the ground. The calculation results are shown in Table 8.
The results of the calculation of the areas with a complete return of straw, partial return of straw, and a non-return of straw for the four areas are shown in Table 8. According to Table 8, it can be concluded that the error rate of the proposed model was less than 8%; as such, it can be concluded that the rapid straw return detection method based on the Sh-DeepLabv3+ model has a high accuracy and good adaptability in a wide range of straw return detection operations.

4. Discussion

4.1. Image Acquisition in Straw Return Detection

The use of agricultural equipment carrying a camera synchronized operations for visible-light image acquisition of straw return; the collected images’ content consists entirely of straw and soil, and the detection accuracy is high, reflecting the strong anti-interference aspect of this detection method [48,49]. However, this method is limited, the detection efficiency is relatively low, and the detection area is limited. UVA aerial image acquisition is flexible and fast [50]. In contrast, UVAs are more suitable for large area straw return detection image acquisition.

4.2. Straw Return Detection Methods

For the image segmentation method based on straw coverage calculation in UVA visible image processing, the detection is mainly crushed and the form is single, so it is more suitable for image acquisition in targeted areas. Liu et al. [51] calculated the straw coverage rate by labeling the interfering objects in the UVA images so as to avoid the influence of interfering objects on the calculation results, and further avoid the error of large-scale straw returning detection. However, this method only marks four kinds of interferences that are not soil and straw when there will be more in the field images; thus, only recognizing four kinds of interferences in the images represents a limitation in the straw return detection. The rapid straw return detection method in this paper categorizes field plots according to the form of straw cover, and judges the straw return grade, so exempts some plots from the subsequent accurate detection to improve the detection efficiency.

4.3. Advantages of the Algorithm in This Paper

Ma et al. [17] optimized the UNet model to improve the recognition ability of fine straw by using a multi-branch asymmetrically dilated convective block to extract multi-scale image features, and using a fast up-convective block in the decoding stage to avoid the invalid calculation of straw feature maps during upsampling. However, the model structure is complex, so it cannot predict efficiently. Yang et al. [52] proposed an image processing algorithm by combining straw image distortion correction and Otsu algorithm threshold segmentation, and verified the detection effect of the straw coverage rate through experiments, and the field detection error was less than 5%. However, the detection type is relatively single, and cannot adapt to the complex situations in the field.
In this paper, the optimized Sh-Deeplapv3+ model was used to classify plots according to the form of straw cover. Compared with the traditional Deeplapv3+ model, we optimized the pyramid structure and shallow feature extraction module. The experimental results verified the effectiveness of these optimization models.

4.4. Deficiency and Prospect

The method proposed in this study achieved high accuracy in straw return detection, but it still has certain limitations. The optimized Sh-DeepLabv3+ model can segment the farmland plots well by learning the semantic information features of the straw cover, but segmentation holes will still inevitably appear during the segmentation process, which will affect the segmentation results. Furthermore, the morphological post-processing methods we utilize in the model fill, corrode, and inflate the holes such that the segmentation results will become a connected domain, which is convenient for the later straw crushed form plot extraction.
From the classification accuracy of the methods compared in this paper, the semantic segmentation method can learn the differences in textural features between different straw cover forms and can achieve satisfactory classification results. The semantic segmentation method does not require a large number of experiments to determine the appropriate parameters, nor does it require manual design of classification features. Compared with original semantic segmentation methods such as UNet, DeepLabV3+, and FCN, the model synthesizes the characteristics of UVA straw return remote sensing images, enhances the extraction of shallow and multi-scale features, and performs better in processing image details and segmenting edges [52]. Therefore, we believe that the proposed method can be applied to the field of straw return detection for other crops (e.g., rice, wheat), and it also can be applied to classification research in other fields.

5. Conclusions

In this paper, a rapid straw return detection method is proposed and the optimized Sh-DeepLabv3+ model is used to classify and segment plots with different forms of straw cover. By analyzing the experimental results, the following conclusions can be drawn:
(1)
After three kinds of pixel scale datasets were experimented with, the 2048 × 2048-pixel scale dataset was found to be more adaptable to the straw return detection task.
(2)
The optimized Sh-Deeplabv3+ model’s MIoU, mAP, and precision scores were 96.22%, 98.52%, and 97.91%, respectively, and the experimental results were found to be better than those of the comparison models. The total parameter use was 3.79 M, which was about 14.44 times that of the original model and met the requirement of a lightweight model. The Sh-DeepLabv3+ model could extract the semantic information of different straw mulching forms well, and it could also essentially correctly segment the different types of covering forms with smooth segmentation boundaries and only a few islands.
(3)
In the application experiments, the average accuracy of the model was higher than that of the comparison models, and the time taken was also shorter; the error rate of calculating the area of straw return grades was no more than 8%. Therefore, the rapid detection method based on the Sh-DeepLabv3+ straw return detection model proposed in this paper can improve detection efficiency and meet actual detection needs.

Author Contributions

Conceptualization, Y.W. and X.G.; methodology, X.G.; software, X.G.; validation, Y.S., Y.L. and L.W.; formal analysis, X.G.; investigation, X.G.; resources, Y.W.; data curation, M.L.; writing—original draft preparation, X.G.; writing—review and editing, Y.L.; visualization, Y.S.; supervision, Y.S. All authors have read and agreed to the published version of the manuscript.

Funding

This research was funded by Research on regionalized surface straw cover information detection methods in complex contexts for conservation tillage, the National Natural Science Foundation of China, Product number: 42001256; the Jilin Science and Technology Development Program Project, Product number: 20220402023GH; and the Jilin Science and Technology Development Program Project, Product number: 20230202039NC.

Institutional Review Board Statement

Not applicable.

Data Availability Statement

The datasets in this study are available from the corresponding author on reasonable request.

Conflicts of Interest

The authors declare no conflicts of interest.

References

  1. Li, M.; Zhao, J.; Yang, X. Building a new machine learning-based model to estimate county-level climatic yield variation for maize in Northeast China. Comput. Electron. Agric. 2021, 191, 106557. [Google Scholar]
  2. Zheng, F.; Wu, X.; Zhang, M.; Liu, X.; Song, X.; Lu, J.; Wang, B.; Groenigen, K.; Li, S. Linking soil microbial community traits and organic carbon accumulation rate under long-term conservation tillage practices. Soil Tillage Res. 2022, 220, 105360. [Google Scholar]
  3. Wang, W.; Deng, X.; Yue, H. Black soil conservation will boost China’s grain supply and reduce agricultural greenhouse gas emissions in the future. Environ. Impact Assess. Rev. 2024, 106, 107482. [Google Scholar]
  4. Iroegbu, C.S.; Dada, O.; Orji, J.E. Challenges of soil fertility management under changing climatic conditions: A review. GSJ 2019, 7. [Google Scholar]
  5. Liu, C.; Lu, M.; Cui, J.; Li, B.; Fang, C. Effects of straw carbon input on carbon dynamics in agricultural soils: A meta-analysis. Glob. Chang. Biol. 2014, 20, 1366–1381. [Google Scholar]
  6. Zhang, J.; Sun, B.; Zhu, J.; Wang, J.; Pan, X.; Gao, T. Black soil protection and utilization based on harmonization of mountain-river-forest-farmland-lake-grassland-sandy land ecosystems and strategic construction of ecological barrier. Bull. Chin. Acad. Sci. 2021, 36, 1155–1164. [Google Scholar]
  7. Fan, Z.; Yang, Q.; Li, Z.; Huang, G.; Zhu, S.; Li, M.; Tang, Y. Application and Prospect of Straw Mulching. Sichuan Agric. Sci. Technol. 2023, 5, 12–14. [Google Scholar]
  8. Sun, J. Research on Straw Covered Image Segmentation Method Based on Gray Wolf Optimization Algorithm M.S. Master’s Thesis, Jilin Agricultural University, Changchun, China, 2021. [Google Scholar]
  9. Wollenhaupt, N.C.; Pingry, J. Estimating Residue Using the Line Transect Method; University of Wisconsin–Extension: Madison, WI, USA, 1991. [Google Scholar]
  10. Liu, Z.; Liu, Z.; Wan, W.; Huang, J.; Wang, J.; Zheng, M. Estimation of maize residue cover on the basis of SAR and optical remote sensing image. Natl. Remote Sens. Bull. 2021, 25, 1308–1323. [Google Scholar]
  11. Daughtry, C.S.T.; Graham, M.W.; Stern, A.J.; Quemada, M.; Hively, W.D.; Russ, A.L. Landsat-8 and Worldview-3 Data for Assessing Crop Residue Cover. In Proceedings of the IGARSS 2018-2018 IEEE International Geoscience and Remote Sensing Symposium, Valencia, Spain, 22–27 July 2018; pp. 3844–3847. [Google Scholar]
  12. Memon, M.S.; Jun, Z.; Sun, C.; Jiang, C.; Xu, W.; Hu, Q.; Yang, H.; Ji, C. Assessment of wheat straw cover and yield performance in a rice-wheat cropping system by using Landsat satellite data. Sustainability 2019, 11, 5369. [Google Scholar] [CrossRef]
  13. Shao, Y.; Guan, X.; Xuan, G.; Li, X.; Gu, F.; Ma, J.; Wu, F.; Hu, Z. Detection Method of Straw Mulching Unevenness with RGB-D Sensors. AgriEngineering 2022, 5, 12–19. [Google Scholar] [CrossRef]
  14. Liu, Y.; Wang, Y.; Yu, H.; Qin, M.; Sun, J. Detection of straw coverage rate based on multi-threshold image segmentation algorithm. Nongye Jixie Xuebao/Trans. Chin. Soc. Agric. Mach. 2018, 49, 27–55. [Google Scholar]
  15. Liu, Y.; Sun, J.; Zhang, S.; Yu, H.; Wang, Y. Detection of straw coverage based on multi-threshold and multi-target UAV image segmentation optimization algorithm. Trans. CSAE 2020, 36, 134–143. [Google Scholar]
  16. Ma, J.; Wu, F.; Xie, H.; Gu, F.; Yang, H.; Hu, Z. Uniformity Detection for Straws Based on Overlapping Region Analysis. Agriculture 2022, 12, 80. [Google Scholar] [CrossRef]
  17. Ma, Q.; Wan, C.; Wei, J.; Wang, W.; Wu, C. Calculation Method of Straw Coverage Based on U-Net Network and Feature Pyramid Network. Nongye Jixie Xuebao/Trans. Chin. Soc. Agric. Mach. 2023, 54, 224–234. [Google Scholar]
  18. Zhou, D.; Li, M.; Li, Y.; Qi, J.; Liu, K.; Cong, X.; Tian, X. Detection of ground straw coverage under conservation tillage based on deep learning. Comput. Electron. Agric. 2020, 172, 105369. [Google Scholar]
  19. Yu, K.; Qiu, L.; Wang, J.; Sun, L.; Wang, Z. Winter wheat straw return monitoring by UAVs observations at different resolutions. Int. J. Remote Sens. 2017, 38, 2260–2272. [Google Scholar]
  20. Da Costa, J.P.; Michelet, F.; Germain, C.; Lavialle, O.; Grenier, G. Delineation of vine parcels by segmentation of high resolution remote sensed images. Precis. Agric. 2007, 8, 95–110. [Google Scholar]
  21. Fonseca-Luengo, D.; García-Pedrero, A.; Lillo-Saavedra, M.; Costumero, R.; Menasalvas, E.; Gonzalo-Martin, C. Optimal scale in a hierarchical segmentation method for satellite images. In Proceedings of the Rough Sets and Intelligent Systems Paradigms: Second International Conference, RSEISP 2014, Madrid, Spain, 9–13 July 2014; Springer International Publishing: Berlin/Heidelberg, Germany, 2014; pp. 351–358. [Google Scholar]
  22. Mueller, M.; Segl, K.; Kaufmann, H. Edge-and region-based segmentation technique for the extraction of large, man-made objects in high-resolution satellite imagery. Pattern Recognit. 2004, 37, 1619–1628. [Google Scholar]
  23. Garcia-Pedrero, A.; Gonzalo-Martin, C.; Lillo-Saavedra, M. A machine learning approach for agricultural parcel delineation through agglomerative segmentation. Int. J. Remote Sens. 2017, 38, 1809–1819. [Google Scholar]
  24. Tetteh, G.O.; Gocht, A.; Conrad, C. Optimal parameters for delineating agricultural parcels from satellite images based on supervised Bayesian optimization. Comput. Electron. Agric. 2020, 178, 105696. [Google Scholar]
  25. Aung, H.L.; Uzkent, B.; Burke, M.; Lobell, D. Farm parcel delineation using spatio-temporal convolutional networks. In Proceedings of the IEEE/CVF Conference on Computer Vision and Pattern Recognition Workshops, Seattle, WA, USA, 14–19 June 2020; pp. 76–77. [Google Scholar]
  26. Feng, X.; Zhang, X.; Wang, J. Multi crop classification extraction based on improved spatial-coordinate attention UNet. Trans. CSAE 2023, 39, 132–141. [Google Scholar]
  27. Huang, S.; Han, W.; Chen, H.; Li, G.; Tang, J. Recognizing zucchinis intercropped with sunflowers in UAV visible images using an improved method based on OCRNet. Remote Sens. 2021, 13, 2706. [Google Scholar] [CrossRef]
  28. Image Polygonal Annotation with Python (Polygon, Rectangle, Circle, Line, Point and Image-Level Flag Annotation). Available online: https://github.com/wkentaro/labelme (accessed on 9 May 2018).
  29. Chen, L.C.; Papandreou, G.; Kokkinos, I.; Murphy, K.; Yuille, A.L. Semantic Image Segmentation with Deep Convolutional Nets and Fully Connected CRFs. In Proceedings of the International Conference on Learning Representations, San Diego, CA, USA, 7–9 May 2015. [Google Scholar]
  30. Chen, L.C.; Papandreou, G.; Kokkinos, I.; Murphy, K.; Yuille, A.L. Deeplab: Semantic image segmentation with deep convolutional nets, atrous convolution, and fully connected crfs. IEEE Trans. Pattern Anal. Mach. Intell. 2017, 40, 834–848. [Google Scholar] [PubMed]
  31. Chen, L.C.; Papandreou, G.; Schroff, F.; Adam, H.; Google Inc. Rethinking atrous convolution for semantic image segmentation. arXiv 2017, arXiv:1706.05587. [Google Scholar]
  32. Chen, L.C.; Zhu, Y.; Papandreou, G.; Schroff, F.; Adam, H. Encoder-decoder with atrous separable convolution for semantic image segmentation. In Proceedings of the European Conference on Computer Vision (ECCV), Munich, Germany, 8–14 September 2018; pp. 801–818. [Google Scholar]
  33. Sandler, M.; Howard, A.; Zhu, M.; Zhmoginov, A.; Chen, L.C.; Google Inc. Mobilenetv2: Inverted residuals and linear bottlenecks. In Proceedings of the IEEE Conference on Computer Vision and Pattern Recognition, Salt Lake City, UT, USA, 18–23 June 2018; pp. 4510–4520. [Google Scholar]
  34. Lou, A.; Loew, M. CFPnet: Channel-wise feature pyramid for real-time semantic segmentation. In Proceedings of the 2021 IEEE International Conference on Image Processing (ICIP), Anchorage, AK, USA, 19–22 September 2021; pp. 1894–1898. [Google Scholar]
  35. Hou, Q.; Zhou, D.; Feng, J. Coordinate attention for efficient mobile network design. In Proceedings of the IEEE/CVF Conference on Computer Vision and Pattern Recognition, New Orleans, LA, USA, 18–24 June 2021; pp. 13713–13722. [Google Scholar]
  36. Peng, H.; Xue, C.; Shao, Y.; Chen, K.; Xiong, J.; Xie, Z.; Zhang, L. Semantic segmentation of litchi branches using DeepLabV3+ model. IEEE Access 2020, 8, 164546–164555. [Google Scholar]
  37. Han, L.; Zhao, Y.; Lv, H.; Zhang, Y.; Liu, H.; Bi, G. Remote sensing image denoising based on deep and shallow feature fusion and attention mechanism. Remote Sens. 2022, 14, 1243. [Google Scholar] [CrossRef]
  38. Zhang, B.; Li, W.; Hui, Y.; Liu, J.; Guan, Y. MFENet: Multi-level feature enhancement network for real-time semantic segmentation. Neurocomputing 2020, 393, 54–65. [Google Scholar]
  39. Gu, Y.; Cao, R.; Zhao, L.; Lu, B.; Su, B. Real time semantic segmentation network of wire harness terminals based on multiple receptive fieldattention. Opt. Precis. Eng. 2023, 2, 277–287. [Google Scholar]
  40. Li, X.; Sun, X.; Meng, Y.; Liang, J.; Wu, F.; Li, J. Dice Loss for Data-imbalanced NLP Tasks. In Proceedings of the 58th Annual Meeting of the Association for Computational Linguistics, Online, 5–10 July 2020; pp. 465–476. [Google Scholar]
  41. Yang, Z.; Yu, H.; Fu, Q.; Sun, W.; Jia, W.; Sun, M.; Mao, Z.H. NDNet: Narrow while deep network for real-time semantic segmentation. IEEE Trans. Intell. Transp. Syst. 2020, 22, 5508–5519. [Google Scholar]
  42. Chen, Y.; Li, X.; Jia, M.; Li, J.; Hu, T.; Luo, J. Instance Segmentation and Number Counting of Grape Berry Images Based on Deep Learning. Appl. Sci. 2023, 13, 6751. [Google Scholar] [CrossRef]
  43. Buckland, M.; Gey, F. The relationship between recall and precision. J. Am. Soc. Inf. Sci. 1994, 45, 12–19. [Google Scholar]
  44. Ronneberger, O.; Fischer, P.; Brox, T. U-net: Convolutional networks for biomedical image segmentation. In Proceedings of the Medical Image Computing and Computer-Assisted Intervention–MICCAI 2015: 18th International Conference, Munich, Germany, 5–9 October 2015; Part III 18. Springer International Publishing: Berlin/Heidelberg, Germany, 2015; pp. 234–241. [Google Scholar]
  45. Xie, E.; Wang, W.; Yu, Z.; Anandkumar, A.; Alvarez, J.M.; Luo, P. SegFormer: Simple and efficient design for semantic segmentation with transformers. Adv. Neural Inf. Process. Syst. 2021, 34, 12077–12090. [Google Scholar]
  46. Chollet, F. Xception: Deep learning with depthwise separable convolutions. In Proceedings of the IEEE Conference on Computer Vision and Pattern Recognition, Honolulu, HI, USA, 21–26 July 2017; pp. 1251–1258. [Google Scholar]
  47. Howard, A.; Sandler, M.; Chu, G.; Chen, L.; Chen, B.; Tan, M. Searching for mobilenetv3. In Proceedings of the IEEE/CVF International Conference on Computer Vision, Seoul, Republic of Korea, 27–28 October 2019; pp. 1314–1324. [Google Scholar]
  48. An, X.; Dai, J.; Lu, Z.; Yin, Y.; Meng, Z. Research on straw coverage rate detection algorithm based on color space distance optimization. J. Agric. Mach. 2023, 54 (Suppl. S2), 229–234. [Google Scholar]
  49. Li, J.; Lu, P.; Yuan, Y.; Li, Y.; Wei, L.; Qin, Q. Fast Fourier transform combined with SVM algorithm to identify surface corn straw coverage rate. J. Agric. Eng. 2019, 35, 194–201. [Google Scholar]
  50. Zhang, J.; Xu, S.; Zhao, Y.; Sun, J.; Xu, S.; Zhang, X. Aerial orthoimage generation for UAV remote sensing. Inf. Fusion 2023, 89, 91–120. [Google Scholar]
  51. Liu, Y.; Zhou, X.; Wang, Y.; Yu, H.; Geng, C.; He, M. Improved U-Net modeling for straw cover detection in conservation tillage fields. Opt. Precis. Eng. 2022, 30, 1101–1112. [Google Scholar]
  52. Yang, G.; Zhang, H.; Fang, T.; Zhang, C. Straw Recognition and Coverage Rate Detection Technology Based on Improved AdaBoost Algorithm. J. Agric. Mach. 2021, 7, 177–183. [Google Scholar]
Figure 1. Field research images.
Agriculture 14 00628 g001
Figure 2. Model training and image detection process.
Agriculture 14 00628 g002
Figure 3. Diagram of the Sh-DeepLabv3+ network model’s structure.
Agriculture 14 00628 g003
Figure 4. (a) Comparison of the different models’ accuracy. (b) Accuracy of the various straw cover forms on the test set.
Agriculture 14 00628 g004
Figure 5. Comparison of the recognition and segmentation effects of the different models.
Agriculture 14 00628 g005aAgriculture 14 00628 g005b
Figure 6. Region 1 prediction process diagram. (a) Stitched image; (b) straw cover form prediction image; (c) straw crush form plot extraction; (d) multi-threshold segmentation result; and (i,ii) multi-threshold segmentation detail map.
Agriculture 14 00628 g006
Figure 7. Sh-DeepLabv3+-based confusion matrix for the four regions.
Agriculture 14 00628 g007
Table 1. Comparison of the segmentation accuracy under different scale datasets.
Network ModelResolution Ratio/PixelsMIoU/%mAP/%Precision/%
DeepLabV3+512 × 51287.3997.0589.88
1024 × 102489.7097.4692.72
2048 × 204894.2698.0195.63
Unet512 × 51288.5395.3292.57
1024 × 102490.5696.2393.74
2048 × 204894.2298.1495.33
Segformer512 × 51242.4053.3858.07
1024 × 102444.6255.3858.27
2048 × 204854.0860.4659.60
Table 2. Comparative experiments on the different backbone networks.
Network ModelBackboneMIoU/%mAP/%Precision/%Total Params/M
Deeplabv3+Xception94.2698.0195.6354.71
MobileNetv293.3797.9695.205.82
MobileNetv3-small92.9597.4795.203.21
MobileNetv3-large92.9297.5195.125.63
Table 3. The ablation experiments conducted with the Sh-DeepLabv3+ model.
Network ModelCFPCA-CFPLlossLLFFMIoU/%mAP/%Precision/%Total Params/M
Deeplabv3+
(Mobilenetv2)
93.3797.9695.205.82
94.4198.1796.093.59
95.2398.3796.743.60
94.3498.0296.165.82
94.5398.0496.485.87
96.2298.5297.913.79
Table 4. Detection results of the different semantic segmentation models.
Network ModelMIoU/%mAP/%Precision/%Total Params/MFLOP/GParams Size/MB
FCN84.9387.2486.5132.95138.88125.70
Lraspp78.7380.9879.683.222.0812.88
Unet94.2298.1495.3343.93184.37167.59
Segformer54.0860.4659.603.7213.6014.18
DeepLabv380.5583.7681.6239.64164.1393.19
DeepLabv3+94.2698.0195.6354.71166.91208.70
Sh-DeepLabv3+96.2298.5297.913.7960.9615.6
Table 5. The predictions of the straw mulch forms in the four regions by the different models.
ModelAccuracyMean Accuracy/%Mean Time/s
Region 1Region 2Region 3Region 4
Sh-deepLabv3+95.3297.1896.0695.4596.0027.85
DeepLabv3+94.6396.1294.7494.0494.8931.75
UNet94.7196.2595.3294.1795.1132.5
Table 6. The prediction and labeling pixel point count results.
Straw Cover FormRegion
1234
Predicted|True (Pixel)Predicted|True (Pixel)Predicted|True (Pixel)Predicted|True (Pixel)
straw vertical643|0447|0184|0130,697|132,523
straw level379|07549|0430|0295,929|304,503
straw crush1,922,864|1,986,809557,637|579,862437,997|448,7693,382,231|3,396,545
high stubble2194|03678|07895|066,289|70,275
strip tillage3,601,647|3,636,5362,197,523|2,200,104788|08853|0
low stubble487,980|484,262658,754|647,9819575|01077|0
straw bale131,550|141,037779|09096|0369,387|372,160
turn the soil7926|01986|0330,044|344,5571,822,843|1,906,007
straw burn166|0979|0642,357|656,6248608|0
Table 7. Calculation of the pixel points and SCR for each straw shredded cover form plot in the four regions.
RegionStraw Crush Form Plot
123456
Pixel Points|SCR (Pixel/%)Pixel Points|SCR (Pixel/%)Pixel Points|SCR (Pixel/%)Pixel Points|SCR (Pixel/%)Pixel Points|SCR (Pixel/%)Pixel Points|SCR (Pixel/%)
166,940|13.56185,728|63.89136,445|79.64141,180|75.78218,691|77.341,173,880|68.48
2173,052|76.64179,236|30.84205,349|67.83---
3211,658|78.54226,339|77.62----
4251,572|79.74471,980|82.66853,306|81.781,805,373|48.64--
Table 8. Calculation of the area of complete return, partial return, and non-return straw cover in the four regions.
RegionStraw Return Grade
Complete ReturnPartial ReturnNon-Return
Predicted Area|Labeled Area (m2)Predicted Area|Labeled Area (m2)Predicted Area|Labeled Area (m2)
1496.24|500.28164.51|175.3784.04|82.84
2288.25|286.1846.53|43.3380.16|78.41
354.12|51.880|0119.92|121.14
4251.51|242.21218.45|230.25266.43|275.66
Disclaimer/Publisher’s Note: The statements, opinions and data contained in all publications are solely those of the individual author(s) and contributor(s) and not of MDPI and/or the editor(s). MDPI and/or the editor(s) disclaim responsibility for any injury to people or property resulting from any ideas, methods, instructions or products referred to in the content.

