

Assessing the Sustainability of Urban Agriculture in Shanghai’s Nine Agriculture Districts: A Decadal Analysis (2010–2020)

Department of Agricultural and Resource Economics, Graduate School of Agricultural Life Sciences, The University of Tokyo, Tokyo 113-8657, Japan
*
Author to whom correspondence should be addressed.
Agriculture 2024, 14(4), 631; https://doi.org/10.3390/agriculture14040631
Submission received: 16 March 2024
/
Revised: 15 April 2024
/
Accepted: 17 April 2024
/
Published: 19 April 2024
(This article belongs to the Special Issue Sustainable Agriculture and Food Supply: Scientific, Economic and Policy Aspects)
Abstract
:This research conducts an analysis of the sustainability of urban agriculture in Shanghai over the period 2010 to 2020, employing the Triple Bottom Line (TBL) concept as a framework to evaluate sustainability across economic, environmental, and social dimensions through the formulation and application of a comprehensive indicator system. Utilizing the Delphi method alongside the Analytic Hierarchy Process (AHP) for determining indicators and their respective weights, this study adopts a methodologically rigorous approach to analysis. The findings reveal an overall enhancement in agricultural sustainability, albeit accompanied by a decline in economic sustainability. Notably, environmental sustainability emerged as a paramount concern, underscoring the essentiality of incorporating environmental indicators within urban agricultural initiatives. The paper addresses significant challenges such as elevated land prices, demographic shifts, and the imperative for more stringent environmental regulations. It advocates for a multidimensional strategy integrating advanced agricultural technologies and cross-sectoral partnerships to bolster sustainability. Furthermore, the study accentuates the necessity of achieving equilibrium among economic feasibility, environmental stewardship, and social equity to pursue sustainable urban agriculture in Shanghai. Additionally, it highlights the critical role of strategic agricultural policy formulation in fostering sectoral resilience and ensuring enduring sustainability.
1. Introduction
Urban agriculture is defined as the practice of farming activities conducted within urban environments and their immediate surrounding areas. It is a multifaceted enterprise within urban ecosystems that is shaped by municipal governance and fulfills socioeconomic and ecological roles. Urban agriculture provides sustenance and bolsters social bonds while playing a crucial role in urban sustainability; however, it faces challenges from rapid urbanization and competing land uses [1,2,3,4,5,6].
The sustainable development framework, as articulated by Lester Brown and defined by the World Commission on Environment and Development, emphasizes meeting present needs without compromising future capacities while balancing economic viability, environmental health, and social equity [7,8]. In Shanghai, a rapidly urbanizing megacity, the sustainability of urban agriculture is jeopardized by increased production costs, environmental degradation, and policy challenges; these factors were particularly obvious during the COVID-19 pandemic [9,10,11].
Previous research indicates that regional sustainability indicators can effectively measure the current state of agricultural sustainable development [12]. In this study, the aim was to evaluate the sustainability of Shanghai’s urban agriculture by using a Triple Bottom Line (TBL) approach and crafting a tailored indicator system via the Delphi method and the Analytic Hierarchy Process (AHP). The impacts of urbanization and land use policies on agricultural sustainability across nine districts are investigated, revealing unique regional challenges and facilitating informed discussions with agricultural policymakers based on a decade of data (2010–2020) [13,14,15,16,17,18].
2. Background
2.1. Agriculture Sustainability
Sustainable agriculture, as defined by De Olde et al. [8], is an agricultural methodology that is economically feasible, ecologically robust, and socially equitable. This concept of sustainability in the agricultural context is characterized by resilience and persistence. Resilience refers to the system’s capacity to resist disruptions and stressors, whereas persistence denotes the system’s ability to maintain its functions over long periods. Furthermore, sustainable agriculture fulfills three fundamental functions: the production of goods and services, effective landscape management, and positive contributions to the rural milieu. Collectively, these elements not only underpin the sustainability of agricultural systems but also address a vast array of outcomes across economic, social, and environmental dimensions [19].
2.2. Urban Agriculture
Urban agriculture constitutes a critical and evolving component of the socioeconomic and ecological infrastructures of urban landscapes [4,5,6]. Influenced by municipal policies and urban planning, urban agriculture promotes socioeconomic progress in urban areas. It serves four fundamental roles: subsistence, economic, recreational, and community development. Thus, urban agriculture extends beyond mere crop production within urban confines to being deeply interwoven with urban economies, societies, ecologies, and physical infrastructures. The multifaceted nature of urban agriculture underpins the sustainable evolution of urban centers [3].
However, since the twentieth century, rapid urbanization has had a profound impact on the development of urban agriculture. Characterized by the uncoordinated development of urban spatial areas, clear conflicts in land use, and the large-scale encroachment and enclosure of farmland, urban expansion is continually reducing the area of cultivable land [1]. The intensification of urban and industrial activities has further increased anthropogenic pressure on urban agricultural ecosystems and has significantly affected the sustainability of urban agriculture [2]. This phenomenon underscores the increasingly serious disharmony among urbanization, industrial processes, agricultural resources, and ecological environmental conditions [20]. As urbanization advances, the production costs of agriculture in metropolitan areas continuously increase, with both labor and land prices rising steadily. Correspondingly, urban and peri-urban lands are no longer prioritized for agricultural production but are instead supplanted by other land uses, predominantly those with higher market value, such as housing, transportation areas, and recreational activities. This process is ongoing and is expected to persist across numerous cities and their suburbs globally, resulting in a decline in the number of farmers able to sustain operations within urban contexts [5].
2.3. Agriculture Sustainability Assessment Framework
With the accelerated progression of globalization and urbanization, the sustainability of agriculture has become a significant challenge on a global scale. Agriculture is not only the foundation of food production but also a critical domain for the maintenance of ecological balance and the promotion of societal development. Within this milieu, the advancement of tools that assess agricultural sustainability has received broad attention [21].
Agricultural sustainability indicator systems constructed in past studies [8,22,23] have led to the development of principles for assessing the sustainable development of urban agriculture. These principles underscore a comprehensive and adaptable approach for gauging the multifaceted aspects of sustainability within the context of regional agriculture. They can be articulated as follows.
- (1)
- System Principle: The indicators must cover all aspects of regional agricultural development comprehensively and objectively without overlapping, linking evaluation goals with indicators.
- (2)
- Dynamic Principle: The indicators should be dynamic, reflecting trends and spatial distribution in regional agriculture, focusing on the potential for future sustainable development.
- (3)
- Scientific principle: The indicator system should be scientifically based, with clear meanings, standard measurement, and statistical methods.
- (4)
- Operability principle: Indicator selection should balance simplicity and complexity, consider quantification, data collection ease, and reliability using existing agricultural data and norms.
- (5)
- Regional principle: The indicators should account for regional differences in agricultural development.
These principles provide guidelines for developing an effective and responsive indicator system for the sustainable development of urban agriculture and ensure that assessments are holistic, forward-looking, scientifically grounded, practical, and regionally attuned.
Previous studies [8,22,23] have shown that agriculture constitutes a complex system composed of multiple elements. To describe the various components within such a complex system, such as the coordination of environmental, economic, and social aspects in an agricultural sustainability system, an organized series of indicators or an indicator system is needed. The construction of such a system involves defining evaluation objectives and subjects, selecting a framework for the system, choosing indicators, calculating indicators, and formulating final evaluation conclusions (Figure 1).
The system framework aims to define the measurement subjects and evaluation indicators, and indicator selection is achieved through theoretical model analysis, expert consultation, farm surveys, and other methods. In this study, indicators were selected based on a literature review and Delphi method questionnaires. Through the final round of Delphi method questionnaires, the data for each indicator in the evaluation indicator system were standardized, weights were assigned, the indicators were aggregated, and century data were incorporated to obtain the sustainability evaluation results for urban agriculture in Shanghai. The evaluation results were then analyzed and discussed, providing countermeasures and suggestions for future sustainable agricultural development.
3. Methods
3.1. Research Area
Shanghai is located in the eastern part of China, between 120°52′ and 122°12′ east longitude and 30°40′ and 31°53′ north latitude, at the estuary of the Yangtze River. The climate in Shanghai is a subtropical monsoon climate, with four distinct seasons, an average annual temperature of 15 °C, and an average annual precipitation of 1083 mm. As part of the Yangtze River Delta Plain, the terrain is flat and fertile, which is very suitable for agricultural cultivation. These natural conditions have laid a solid foundation for agricultural development in Shanghai. Moreover, as a modern metropolis, Shanghai, which has a permanent population of twenty-four million people, has the largest consumer market in China; furthermore, the rapid urbanization of Shanghai over the past two decades is evident, making it a quintessential example of urban agriculture development. The contradictions between urban agriculture and urbanization occurring globally are largely reflected in the development of urban agriculture in Shanghai [11].
Since agricultural statistics in Shanghai cover only nine districts and no relevant agricultural data are collected within the downtown areas (where there is no officially recognized agricultural land), the scope of this study is limited to these nine agriculture districts (Minhang District, Baoshan District, Jiading District, Pudong New District, Jinshan District, Songjiang District, Qingpu District, Fengxian District, Chongming District) of Shanghai (Figure 2).
3.2. Delphi Method
The Delphi method can identify relevant agricultural sustainability indicators based on previous agricultural sustainability assessment frameworks. In this study, the Delphi method was implemented to assess three rounds of questionnaires (Figure 3): the purpose of the first round was to find sustainability indicators and expand the number of indicators; that of the second round was to select significant and meaningful sustainability indicators; and that of the third round was to determine the weights of each indicator. Three rounds of Delphi method questionnaires were administered from April 2022 to December 2022.
To enrich and refine the selection of sustainability indicators derived from the literature, expert input tailored to the specificities of the local milieu should be incorporated. The comprehensive nature of agricultural sustainability assessments mandates the involvement of experts across diverse disciplines, all of whom possess intimate knowledge of the regional context. Consequently, the criteria for expert selection were meticulously defined to include individuals with a significant background in agricultural research or practice, proven experience within the Shanghai area, and active engagement in research related to environmental, economic, or social sciences. These experts should include individuals affiliated with government bodies or agricultural operations. These stringent criteria were used to meticulously curate a panel of 12 experts who participated in the questionnaire process, thus ensuring a robust, multidisciplinary approach to constructing a regional-level evaluation system for agricultural sustainability.
In preparation for the initial round of the questionnaire, an extensive review of eighty-four pertinent studies was conducted to identify suitable indicators of agricultural sustainability (Table 1). The literature revealed a diverse array of indicators, many of which were either originally proposed by the authors or were enhancements of existing research findings. The indicator systems identified were categorized at two primary levels: regional and farm. Efforts were made to meticulously extract and enumerate all the distinct indicators mentioned across these studies to compile a comprehensive set that encapsulated the multifaceted dimensions of agricultural sustainability as reflected in current academic discourse. This rigorous approach ensured that the questionnaire was grounded in a broad and nuanced understanding of the sustainability indicators most relevant to both regional and farm-specific contexts.
Among all the indicators collected, per capita income emerged as the most frequently mentioned individual indicator (n = 48). Additionally, environmental sustainability had the highest occurrence (n = 290) of any category. This finding underscores the significant emphasis placed on economic measures of well-being and environmental considerations within the discourse on agricultural sustainability and reflects a broad consensus on the critical roles of these factors in assessing the sustainability of agricultural practices at both the regional and farm levels (Figure 4).
The initial round of questionnaires distilled a comprehensive list of 62 sustainability indicators derived from previous lecture reviews to assess their relevance in the context of agricultural sustainability. Experts participating in the survey were prompted to evaluate the significance of each identified indicator by using a seven-point scale, where “1” denoted minimal importance and “7” indicated maximal importance. To reflect the dynamic and iterative nature of this process, the experts proposed an additional 14 new indicators based on their insights and expertise (Table 2). These newly suggested indicators were subsequently incorporated into the second round of the questionnaire to enhance the breadth and depth of the sustainability assessment framework and ensure that it more accurately reflected current understandings and priorities within the field of agricultural sustainability.
Following the outcomes of the initial questionnaire round, a strategic revision was undertaken to refine the set of sustainability indicators. This process entailed the removal of indicators deemed less relevant by the experts and the incorporation of the newly proposed indicators, thus creating an enriched assessment framework. The redesigned second round of questionnaires was subsequently administered to reflect these adjustments. This iterative process was crucial for honing in on the most pertinent and comprehensive indicators of agricultural sustainability and ensuring that the evaluation system remained aligned with expert consensus and contemporary challenges within the field.
Upon receiving the results from the second round of questionnaires, the indicators identified as important by the experts were meticulously verified against the available data (Table 3). In the table, "+" and "-" are used to represent the nature of indicators and their positive and negative impacts on agricultural sustainability, respectively. This critical step ensured the practical applicability of the selected sustainability indicators by assessing their feasibility based on the accessibility and reliability of the required data. Such a verification process is essential for establishing a robust and actionable framework for evaluating agricultural sustainability, one that is not only grounded in expert consensus but also viable for implementation within the context of existing data sources and collection capabilities. We completed a third round of questionnaires based on these principles.
3.3. AHP Method
To determine the weights of each sustainability indicator, we designed a third round of questionnaires based on the AHP method. The AHP is a multicriteria decision-making tool introduced by Saaty in 1987 that allows individuals to reasonably weigh attributes and assess the various options presented to them. Although most applications of AHP have concentrated on individual or small-scale implementations, the AHP has been increasingly adopted in survey designs involving many decision-makers and significant response variability. The Saaty [111] scale consists of nine items (with 17 options for each pairwise comparison). Decision makers are asked to indicate the degree to which attribute/feature A is preferred over B (or vice versa) and the extent of this preference on a nine-point scale. Respondents are asked to make pairwise comparisons across a series of attributes and indicate their priorities for each attribute.
After completing the third round of questionnaires, we proceeded to calculate the weights for each primary and secondary indicator based on the feedback obtained from the experts’ responses. This process was accomplished through matrix calculations, a methodological approach that allows for the systematic quantification of the relative importance of each indicator. By employing this technique, we effectively translated the qualitative assessments of experts into quantifiable weights, which facilitated a structured and hierarchical evaluation of sustainability indicators.
Given that the relative importance of factor i to factor j is denoted as , the relative importance of factor j to factor i is represented by . We determine the weights of the indicators via the arithmetic mean method, as articulated in Equation (1). Subsequently, we conduct a consistency check of the results of the third round of the questionnaire via Equation (2). In this context, C′I′ denotes the consistency index, while ‘’ signifies the largest eigenvalue of the judgment matrix. Thereafter, we verify the consistency ratio of the results by utilizing Equation (3). C′R′ represents the calculated consistency ratio, and R′I′ stands for the random index, which is ascertained by referencing an appropriate table (Table 4). If C′R′ is less than 0.1, the weighting result is acceptable. All calculations were performed using Expert Choice 11.5.
3.4. Data Sources
The sources of data include the statistical yearbooks of various districts for previous years (2010–2021), the Shanghai Rural and Agricultural Statistical Yearbook, local records, county-level carbon dioxide emissions data from the CEADs, and the MODIS database.
The data selected for this study were collected between 2009 and 2020 to calculate the agricultural sustainability of each district in Shanghai between 2010 and 2020.
4. Results
4.1. Indicator Results from the Construction of a Sustainable Indicator System for Urban Agriculture in Shanghai
The results from the third round of questionnaires were analyzed using Expert Choice 11.5, and they passed the consistency test. Table 5 shows the weights of the primary and secondary indicators within the final evaluation system for sustainable urban agriculture in Shanghai. Among the primary indicators, environmental sustainability was assigned the highest weight (0.3691), followed by economic sustainability (0.3156) and social sustainability (0.3151). This finding indicates that experts consider environmental sustainability to be extremely important to the sustainable urban agriculture development process in Shanghai. In terms of secondary indicators, meat output (0.2156), the number of people working in agriculture, forestry, animal husbandry, and fishery (0.1928), and the irrigation rate (0.1526) emerged as the indicators with the highest weights. This distribution of weights underscores the significance attributed to these specific aspects of sustainability and reflects a comprehensive perspective on what factors are most critical to fostering a sustainable urban agricultural system.
4.2. Results of the Total Sustainability of Urban Agriculture in Shanghai
Once the Shanghai agricultural sustainability evaluation indicator system was established, the framework was used to assess the sustainability of agriculture across various districts in Shanghai. This process involved collecting relevant data for each district according to the defined primary and secondary indicators and their respective weights. The application of this system allowed for a detailed and quantified analysis of agricultural sustainability that highlighted differences and identified areas of strength and potential improvement across the districts. By utilizing this comprehensive evaluation system, stakeholders can gain insightful, data-driven perspectives on the status and progress of agricultural sustainability efforts in Shanghai. This process facilitates informed decision-making and targeted interventions that enhance sustainability across the region’s agricultural sector.
The data derived from Figure 5, Figure 6, Figure 7 and Figure 8 present a comprehensive overview of the agricultural sustainability trends in Shanghai from 2010 to 2020 and highlight distinct aspects of sustainability:
Figure 5 shows the increase in total agricultural sustainability in Shanghai during this period. This increase suggests that the cumulative effects of initiatives and policies targeting the improvement in agricultural practices have positively impacted the overall sustainability framework and have incorporated environmental, economic, and social dimensions. In contrast, Figure 6 indicates a decline in agricultural economic sustainability over the same timeframe. This decline could be attributed to various factors, such as increased input costs, market competition, or policies that may not fully support the economic aspects of agricultural sustainability, which impact the financial viability of farming operations. Figure 7 highlights an improvement in environmental sustainability within Shanghai’s agricultural sector. This improvement is likely due to enhanced environmental management practices, such as more efficient use of resources, adoption of eco-friendly farming techniques, and efforts to reduce pollution and soil degradation. According to Figure 8, the social sustainability of agriculture in Shanghai has increased. This occurrence could reflect advancements in social aspects, such as labor conditions, community engagement in sustainable agriculture practices, and food security.
These observations underscore the multifaceted nature of sustainability in agriculture, revealing that while significant progress has been made in environmental and social sustainability, economic sustainability has experienced a downturn. The increase in total sustainability indicates that positive changes in environmental and social dimensions can contribute to the broader sustainability of agriculture, yet the decline in economic sustainability emphasizes the need for balanced approaches that also ensure economic health and viability for the agricultural sector.
Figure 9 provides a visual representation of the changes in economic, environmental, and social sustainability within Shanghai’s agricultural sector from 2010 to 2020. This figure shows that environmental sustainability consistently ranks the highest, followed by economic and social sustainability. Notably, after 2017, social sustainability surpasses economic sustainability, indicating a shift in the dynamics of agricultural sustainability in Shanghai.
Figure 10 illustrates the distribution of agricultural sustainability across various agricultural districts in Shanghai from 2010 to 2020. In this figure, each point represents the sustainability of a district in a given year, mapped across three dimensions: economic, environmental, and social sustainability. The nine different colors are used to represent the nine distinct districts. The majority of points are clustered toward the middle and lower left portions of the ternary plot, indicating that most agricultural districts exhibited relatively weak social and economic sustainability performance but moderate environmental sustainability performance during this period.
This distribution pattern suggests that, across the board, efforts to enhance environmental sustainability might have received more focus or achieved greater success than initiatives aimed at improving economic and social sustainability. Clustering toward lower economic and social sustainability indicates potential challenges in these areas, such as economic viability, labor practices, community engagement, and social welfare within the agricultural sector.
The moderate environmental performance across most districts suggests progress in this area, but the weaker economic and social sustainability underscores the importance of addressing these aspects more effectively in future sustainability efforts.
4.3. Results of Agricultural Sustainability in Shanghai’s Agricultural Districts
Figure 11 provides an overview of the average agricultural sustainability across Shanghai’s agricultural districts from 2010 to 2020 and presents insights into the comparative performance of these districts across the different dimensions of sustainability:
Chongming District emerges as a paradigm of comprehensive agricultural sustainability, showcasing a balanced approach to economic, environmental, and social sustainability facets. Conversely, Baoshan District displays minimal overall sustainability, signaling areas necessitating specific enhancements. Fengxian District is distinguished for its superior economic sustainability, which is indicative of efficacious agricultural management and practices. In contrast, the Minhang District experiences the lowest economic sustainability, highlighting potential fiscal and efficiency challenges. Environmental Sustainability: Minhang District leads in environmental sustainability, reflecting effective pollution control, resource management, and conservation efforts. Conversely, Jinshan District exhibits the lowest, suggesting a need for improved environmental strategies. Social Sustainability is also dominated by Chongming District, with Baoshan District lagging in this aspect.
Figure 12 illustrates the changes in agricultural sustainability across the economic, environmental, and social dimensions within the nine agricultural districts from 2010 to 2020. This comparison allows for an analysis of trends, improvements, and areas that have remained challenging over time and provides a dynamic view of how agricultural sustainability has evolved in Shanghai’s different districts. This detailed breakdown by district and sustainability dimension can help inform targeted policy and practice interventions aimed at enhancing the overall sustainability of agriculture in Shanghai.
5. Discussion
5.1. Discussion of the Factors Influencing the Sustainability of Urban Agriculture in Shanghai’s Agricultural Districts
To enhance agricultural sustainability in Shanghai’s districts, a thorough investigation into the factors influencing sustainability is essential. This approach involves both qualitative and quantitative analyses to comprehensively understand the multifaceted nature of sustainability in agriculture. The main factors influencing the sustainability of urban agriculture include environmental and policy factors.
In terms of environmental factors, the resource and environmental background constrain the sustainable development of urban agriculture [112]. The likelihood of adopting sustainable agricultural practices is affected most by environmental characteristics [113]. These include the availability and quality of natural resources, including water resources, soil quality, biodiversity, and the impacts of climate change on agricultural production. Environmental factors profoundly affect the sustainability of agriculture, as they directly pertain to the foundational elements of agricultural production. Environmental degradation, such as land degradation [114], water scarcity [115], and the loss of ecosystem services [116], adversely impacts agricultural production capacity.
On the other hand, designing and implementing policies that incentivize agricultural management practices that stimulate both agricultural productivity growth and environmental sustainability are important and can have both economic and environmental impacts on agricultural sustainability [117]. Agricultural systems are situated within political environments that tremendously influence how they operate. For agricultural systems to be sustainable, an understanding of how they are influenced by political factors is critical [118]. Policies and regulations, including land use policies, agricultural subsidy policies, environmental protection policies, and policies supporting agricultural technology and innovation, significantly influence the sustainability of urban agriculture [119]. Policies facilitate or hinder the sustainability of urban agriculture via their formulation and implementation.
To elucidate the influence of environmental and policy factors on the sustainability of agriculture across different districts, we conducted interviews with officials from branches of the Shanghai Municipal Commission of Agriculture and Rural Affairs in nine agriculture districts from October to November 2023. Each discussion was conducted on a one-on-one basis, with durations of approximately one hour. The primary focus of these interviews revolved around the local agricultural development environment and its current status, explorations of regional strengths and weaknesses, and discussions regarding the local agricultural policies that were implemented after 2010. These discussions were aimed at gathering in-depth insights into the regional specificities that influence agricultural sustainability, including how environmental conditions and policy frameworks have shaped agricultural practices, challenges, and advancements in these districts. This qualitative approach provided a nuanced understanding of the multifaceted nature of agricultural sustainability in the suburban districts of Shanghai and elucidated the critical role of localized environmental management and policy interventions in promoting sustainable agricultural development.
5.1.1. Minhang District
The agricultural economic sustainability in Minhang District is lower than the Shanghai average, largely due to its proximity to the city center, where land prices are significantly elevated. This proximity to the urban core generally leads to higher land prices, which in turn contributes to sustained increases in the costs associated with agricultural production. Due to its proximity to the city center, Minhang District has consistently had lower environmental sustainability, as determined primarily by factors such as air quality and forest cover rates. To improve the district’s environmental sustainability, Minhang began promoting the “enclosed water treatment” of aquaculture wastewater and agricultural wastewater within the district in 2015, which has helped restore environmental sustainability in the area [120]. Due to the proximity of Minhang District to the city center, the district has an advantage over other suburbs in Shanghai in terms of income, life expectancy, medical conditions, and education. Thus, Minhang District is more socially sustainable.
5.1.2. Baoshan District
Similar to Minhang District, most of Baoshan District is close to the city center, and thus, its agricultural production faces higher labor and land costs. This situation reduces the economic sustainability of agriculture in Baoshan District [121]. Baoshan District has always had a low level of environmental sustainability since it is home to Shanghai’s core industrial area. Since 2012, Baoshan District has mandated that all farms in the district meet annual pesticide and fertilizer reduction targets, which has led to an increase in Baoshan District’s environmental sustainability level [122,123]. As the theoretical center of Baoshan and the subcenter of the city, the Wusong area is separated from Songnan and other towns closest to the old downtown area by a large industrial area, as no pathway connects these areas [124]. Geographic barriers created by industrial zones and poor accessibility have made Baoshan less socially sustainable than it should be.
5.1.3. Jiading District
Jiading District promulgated the Jiading District Farming Layout Plan 2015–2040 in 2015 to regulate and close unregulated livestock farms in the district, which made it less economically sustainable in 2016. Jiading has lower environmental sustainability because the district’s characteristic grape-growing industry requires high levels of chemical fertilizers and pesticides; biopesticides and organic fertilizers are less effective. Due to the lack of uniform regulation, Jiading experienced an increase in pesticide use in both 2012 and 2014, which led to a decrease in environmental sustainability in both years [122,123]. The increase in social sustainability in Jiading since 2011 may be attributed to the opening of Shanghai Metro Line 11 in 2010. This line connects Jiading to the city center and greatly reduces the difficulties Jiading residents face in traveling. Convenient transportation not only enhances access to suburban medical and educational services but also slows the loss of the agricultural population [125].
5.1.4. Pudong New District
The reduced sustainability of the agricultural economy in Pudong is closely related to the Pudong development process. Particularly after the start of the above-ground construction of Disney Land in Chuansha, Pudong, in 2013, the production of agricultural products and the rural population around this traditional agricultural production area decreased annually while the cost of agricultural production increased daily. At the policy level, Pudong has typically placed significant emphasis on the prevention and control of agricultural pollution. Since 2012, the district has been promoting reductions in pesticides and chemical fertilizers, adjusting agricultural structures, increasing green planting, promoting organic fertilizers, and improving the utilization rate of pesticides. Since 2015, 75 monitoring points have been established in the district to investigate soil organic matter and heavy metal content, thus enabling the condition of the soil to be monitored. Pudong is one of the first regions in China to obtain a B&B business license, which has allowed it to leverage the influx of visitors brought by Shanghai Disney Land. B&B operating companies act as investment entities by renting houses from farmers’ homestays, signing 20-year house rental contracts, and bearing all renovation costs. At the same time, they employ many young farmers from the surrounding area as B&B service staff, solving a significant number of employment issues and increasing farmers’ income.
5.1.5. Jinshan District
Jinshan District, as a new national development zone for green agriculture, is in line with the national concept of sustainability. The entire district advocates for high-yield and high-efficiency agriculture, enabling it to build an environmentally friendly, resource-conserving type of agriculture that effectively enhances economic sustainability. In 2015, Jinshan District carried out comprehensive environmental remediation, retaining only large-scale breeding farms. With substantial financial support, the breeding industry quickly recovered. However, the African swine fever outbreak in 2018 once again impacted the district’s breeding industry [126]. As a new national development zone for green agriculture, Jinshan has been committed to establishing environmentally friendly agriculture, which has kept the district’s environmental sustainability relatively high. Following comprehensive environmental remediation in 2015, the environmental sustainability of Jinshan District was restored and enhanced. Constrained by its remote location, the agricultural population of Jinshan District continues to decline, resulting in lower social sustainability for the area [127]. To address this issue, the district government is vigorously promoting “unmanned farms”, and Jinshan District is home to the country’s first robotic intelligent farm.
5.1.6. Songjiang District
Due to the outbreak of African swine fever [128], the economic sustainability of Songjiang, where farming is the mainstay industry, was significantly reduced in 2018. The increase in environmental sustainability in Songjiang District after 2017 may be attributed to the district’s pioneering “land fertility insurance system”. Social sustainability in Songjiang is slightly lower than the Shanghai average, and the trend is similar to that of the Shanghai average. Despite Songjiang District’s attempts to improve the treatment of farmers by equating their retirement pay and insurance benefits with those of urban residents, Songjiang’s social sustainability remains low due to its high levels of aging.
5.1.7. Qingpu District
Due to the political task of “ensuring the red line of arable land” [129], agricultural economic sustainability in Qingpu District has typically been relatively low. Since 2016, the Qingpu District has been focusing on the distinctive traits associated with agricultural, industrial development, and enterprise growth. By leading with key enterprises and adopting an integrated production and sales model of “leading enterprises + cooperatives + specialized households”, the district has further strengthened the economic strength, development vitality, and driving capability of cooperatives. These measures have enhanced economic sustainability. Qingpu possesses the largest inland waters in Shanghai and has consistently adhered to the “enclosed water treatment” for agricultural wastewater, resulting in better overall water quality and greater environmental sustainability. Due to a lack of regulation, fertilizer use increased exponentially in 2016, which significantly undermined the environmental sustainability of the Qingpu District in those two years. Qingpu District has a low level of social sustainability due to its relatively remote location, rapid loss of agricultural population, and low per capita income.
5.1.8. Fengxian District
Due to lower land prices and a greater degree of agricultural scaling and intensification, the agricultural economic sustainability of Fengxian District was maintained at a relatively high level before 2018. The African swine fever outbreak in 2018 had a significant impact on the breeding industry in Fengxian [126]; for instance, large-scale pig farms under the GuangMing Company operated at a loss for an extended period, which affected the economic sustainability of Fengxian. Fengxian District has a high level of agricultural environmental sustainability. The district places great emphasis on the safe production of agricultural products, has signed a contract with the Agricultural Science Institute to establish an Agricultural Product Safety Quality Center, and has conducted regular spot checks on agricultural products within the district. Farms with pesticide residues exceeding the standards are subject to a “one-strike veto” policy. Due to the weaker financial strength of Fengxian District, the welfare benefits for farmers are lower than those for farmers in other districts in Shanghai, leading to lower social sustainability in the district’s agriculture.
5.1.9. Chongming
Due to the low cost of land circulation and strict restrictions on the commercial development of surrounding land, Chongming has low agricultural production costs and a high degree of scale, which gives Chongming agriculture greater economic sustainability. As the second modern agricultural demonstration zone nationally recognized by the Ministry of Agriculture and a key “ecological island” development focus area of Shanghai, Chongming has strict annual requirements designed to reduce chemical fertilizers and pesticides in agricultural products. Similarly, Chongming strictly limits land development on the island, eliminating all projects that affect the ecological environment, which grants Chongming agriculture a high level of environmental sustainability. After the completion and opening of the Yangtze River Cross-Sea Bridge in 2009, the travel time from Chongming to the center of Shanghai was greatly reduced. Residents no longer needed to rely on ferry services to commute to and from the Shanghai metropolitan area, which has led to a continuous increase in the social sustainability of Chongming thereafter.
5.2. Policy Recommendations for Improving the Sustainability of Urban Agriculture in Shanghai
The synthesis of interviews conducted with officials across nine agricultural districts in Shanghai revealed that the economic sustainability of agriculture within the region is principally hampered by stringent land use regulations and fiscal setbacks instigated by unforeseen pandemic events. The pronounced urbanization characteristic of Shanghai inherently escalates agricultural production costs. Furthermore, rigorous land use regulations impede the capacity of agricultural operators to implement diversification strategies within their farms [129]. Such diversification is pivotal for the sustainable development of agricultural enterprises, as it facilitates the exploitation of urban demand for agricultural commodities and ancillary services. Engagement in diversified activities, including direct marketing and agritourism, has emerged as a vital strategy for enhancing the economic resilience and sustainability of suburban farms [130].
The environmental sustainability issues facing Shanghai’s agriculture include decreasing soil organic matter content and inadequate regulation of pesticides and fertilizers. The decline in the quality of arable land is endangering the foundations of sustainable agricultural development in Shanghai. This is a common problem when highly productive land is used for urbanization and when the fertility of compensated land is low [9]. In addition, heavy metals and pesticide residues on agricultural land in Shanghai are serious. According to the results of the 2003 Shanghai Agricultural Land Environmental Quality Survey, 3.3% of the total number of soil samples failed, and 86.7% of the soil contained a small accumulation of heavy metals. In addition, Shanghai’s annual pesticide use in 2020 was 0.28 million tons, which is 1.3 times the national average per unit area [131].
The social sustainability challenges of agriculture in Shanghai are primarily concentrated on the aging population and the scarcity of young and middle-aged laborers in rural areas [132]. The widening income gap between rural and urban settings has significantly contributed to the rapid decline of the agricultural population [133]. This demographic shift has critical implications for maintaining a viable workforce in agriculture, thereby impacting the sector’s long-term sustainability and its capacity to meet the food and service demands of an urbanizing population.
To ensure the sustainability of Shanghai’s agriculture in terms of economic, environmental, and social aspects, relevant management departments should promote the development of smart and robotic agriculture while encouraging the integrated development of primary, secondary, and tertiary agricultural industries. Simplifying procedures for changes in agricultural construction land use, continuing to promote the soil fertility insurance system to foster cross-sectoral cooperation, and strictly monitoring agricultural product pesticide residues and the use of pesticides and fertilizers during agricultural production are essential measures. These strategies lay a solid foundation for the future sustainable development of urban agriculture in Shanghai.
6. Conclusions
The evaluation system for Shanghai’s urban agricultural sustainability reveals the weighted significance of various indicators and indicates that the most critical aspect is environmental sustainability, followed closely by economic and social sustainability. This prioritization underscores the consensus among experts on the paramount importance of environmental considerations in the sustainable development of urban agriculture in Shanghai. The distribution of indicator weights in this study emphasizes the crucial role these factors play in promoting a sustainable urban agricultural system and offers detailed insight into the components deemed essential for advancing sustainability within Shanghai’s urban agriculture framework.
The implementation of the Shanghai agricultural sustainability evaluation indicator system facilitated a comprehensive assessment of agricultural sustainability across the city’s districts, revealing nuanced insights into the sector’s performance. The analysis showed an overall increase in agricultural sustainability, indicating the positive influence of targeted initiatives and policies across environmental, economic, and social dimensions. Despite this overall improvement, economic sustainability experienced a decline. Conversely, environmental sustainability and social sustainability improved.
The assessment trend signifies a changing dynamic in Shanghai’s agricultural sustainability, emphasizing the increasing importance of social factors. The performance across different districts varied, with most showing moderate environmental sustainability but weaker social and economic sustainability. These findings provide critical insights for stakeholders by informing decision making and facilitating targeted interventions that can enhance the sustainability of Shanghai’s agricultural sector.
In examining the sustainability of agriculture in Shanghai, this research has illuminated the multifaceted challenges and opportunities present within the region’s agricultural sector. Central to these challenges and opportunities are the economic, environmental, and social dimensions of sustainability, each of which is influenced by distinct factors such as stringent land use policies, pandemic impacts, demographic shifts, and urban–rural income disparities. The economic sustainability of agriculture in Shanghai faces pressure from high land prices and restrictive land use policies, which limit the diversification and innovation potential of agricultural enterprises. Environmental sustainability efforts indicate the need for strict monitoring of pesticide residues and the judicious use of agricultural chemicals while pointing toward a growing emphasis on sustainable farming practices. Socially, the sustainability of agriculture is challenged by an aging rural population and the migration of young laborers to urban areas, both of which exacerbate labor shortages in agriculture.
To address these challenges, a multifaceted approach is recommended. This approach should emphasize the adoption of smart and robotic agricultural technologies, encourage the integration of agricultural sectors, simplify regulatory procedures for agricultural land use, and promote cross-sectoral cooperation through initiatives such as soil fertility insurance systems. Furthermore, ensuring strict compliance with environmental standards for pesticide and fertilizer use is crucial for safeguarding environmental sustainability.
In conclusion, the path to sustainable agriculture in Shanghai requires a balanced consideration of economic viability, environmental responsibility, and social equity. By adopting innovative technologies, fostering integrated agricultural development, and implementing supportive policies, Shanghai can lay a robust foundation for the sustainable development of its urban agriculture, which can contribute to the city’s overall sustainability objectives. This approach not only addresses the current challenges but also anticipates the future needs of the agricultural sector, ensuring its resilience and sustainability in the face of changing global and local dynamics.
Author Contributions
Conceptualization, J.N., A.K. and H.Y.; methodology, J.N.; software, J.N.; validation, A.K. and H.Y.; formal analysis, J.N.; investigation, J.N.; resources, J.N.; data curation, J.N.; writing—original draft preparation, J.N.; writing—review and editing, A.K. and H.Y.; visualization, J.N.; supervision, A.K. and H.Y.; project administration, J.N.; funding acquisition, J.N. All authors have read and agreed to the published version of the manuscript.
Funding
This work was supported in part by a scholarship from the China Scholarship Council (CSC) under Grant CSC No. 202108050184.
Institutional Review Board Statement
Not applicable.
Data Availability Statement
The participants of this study did not give written consent for their data to be shared publicly, so due to the sensitive nature of the research, supporting data are not available.
Conflicts of Interest
The authors declare no conflicts of interest.
References
- Ahani, S.; Dadashpoor, H. A review of domains, approaches, methods and indicators in peri-urbanization literature. Habitat. Int. 2021, 114, 102387. [Google Scholar] [CrossRef]
- Ahani, S.; Dadashpoor, H. Urban growth containment policies for the guidance and control of peri-urbanization: A review and proposed framework. Environ. Dev. Sustain. 2021, 23, 14215–14244. [Google Scholar] [CrossRef]
- Dona, C.G.W.; Mohan, G.; Fukushi, K. Promoting urban agriculture and its opportunities and challenges—A global review. Sustainability 2021, 13, 9609. [Google Scholar] [CrossRef]
- Hardman, M.; Chipungu, L.; Magidimisha, H.; Larkham, P.J.; Scott, A.J.; Armitage, R.P. Guerrilla gardening and green activism: Rethinking the informal urban growing movement. Landsc. Urban Plan. 2018, 170, 6–14. [Google Scholar] [CrossRef]
- Langemeyer, J.; Madrid-Lopez, C.; Beltran, A.M.; Mendez, G.V. Urban agriculture—A necessary pathway towards urban resilience and global sustainability? Landsc. Urban Plan. 2021, 210, 104055. [Google Scholar] [CrossRef]
- Robineau, O.; Dugué, P. A socio-geographical approach to the diversity of urban agriculture in a West African City. Landsc. Urban Plan. 2018, 170, 48–58. [Google Scholar] [CrossRef]
- Brown, L.R. World population growth, soil erosion, and food security. Science 1981, 214, 995–1002. [Google Scholar] [CrossRef] [PubMed]
- De Olde, E.M.; Oudshoorn, F.W.; Sørensen, C.A.G.; Bokkers, E.A.M.; De Boer, I.J.M. Assessing sustainability at farm-level: Lessons learned from a comparison of tools in practice. Ecol. Indic. 2016, 66, 391–404. [Google Scholar] [CrossRef]
- Cui, L.; Shi, J. Urbanization and its environmental effects in Shanghai, China. Urban Clim. 2012, 2, 1–15. [Google Scholar] [CrossRef]
- Gu, H.Y.; Wang, C.W. Impacts of the COVID-19 pandemic on vegetable production and countermeasures from an agricultural insurance perspective. J. Integr. Agric. 2020, 19, 2866–2876. [Google Scholar] [CrossRef]
- Shanghai Municipal Statistics Bureau. Shanghai Statistical Yearbook 2021; Shanghai Municipal Statistics Bureau: Shanghai, China, 2022.
- Binder, C.R.; Feola, G.; Steinberger, J.K. Considering the normative, systemic and procedural dimensions in indicator-based sustainability assessments in agriculture. Environ. Impact Assess. Rev. 2010, 30, 71–81. [Google Scholar] [CrossRef]
- Cohen, M. A systematic review of urban sustainability assessment literature. Sustainability 2017, 9, 2048. [Google Scholar] [CrossRef]
- Costanza, R.; Patten, B.C. Defining and predicting sustainability. Ecol. Econ. 1995, 15, 193–196. [Google Scholar] [CrossRef]
- Davidson, M. Social sustainability: Politics and democracy in a time of crisis. In Urban Social Sustainability: Theory, Policy and Practice; Shirazi, M., Keivani, R., Eds.; Routledge: London, UK, 2019; pp. 27–41. [Google Scholar]
- Hueting, R.; Reijnders, L. Sustainability is an objective concept. Ecol. Econ. 1998, 27, 139–148. [Google Scholar]
- Kaur, H.; Garg, P. Urban sustainability assessment tools: A review. J. Clean. Prod. 2019, 210, 146–158. [Google Scholar] [CrossRef]
- Schader, C.; Grenz, J.; Meier, M.S.; Stolze, M. Scope and precision of sustainability assessment approaches to food systems. Ecol. Soc. 2014, 19, 42. [Google Scholar] [CrossRef]
- Pretty, J. Agricultural sustainability: Concepts, principles and evidence. Philos. Trans. R. Soc. Lond. B Biol. Sci. 2008, 363, 447–465. [Google Scholar] [CrossRef] [PubMed]
- Zhu, Q.Q.; Zheng, X.Y.; Liu, Y.; Zhou, C.S. Classification of rural settlements and their spatial characteristics in Guangzhou. Econ. Geogr. 2017, 37, 206–214+223. [Google Scholar] [CrossRef]
- Janker, J.; Mann, S. Understanding the social dimension of sustainability in agriculture: A critical review of sustainability assessment tools. Environ. Dev. Sustain. 2020, 22, 1671–1691. [Google Scholar] [CrossRef]
- Gómez-Limón, J.A.; Sanchez-Fernandez, G. Empirical evaluation of agricultural sustainability using composite indicators. Ecol. Econ. 2010, 69, 1062–1075. [Google Scholar] [CrossRef]
- Shao, C.F.; Chen, S.H.; Gao, J.L.; He, Y.; Zhou, H.L. Design of China’s sustainable development evaluation indicator system based on SDGs. China Popul. Resour. Environ. 2021, 31, 1–12. [Google Scholar] [CrossRef]
- Chen, X.; Rong, F.; Li, S. Driving force–pressure–state–impact–response-based evaluation of rural human settlements’ resilience and their influencing factors: Evidence from Guangdong, China. Sustainability 2024, 16, 813. [Google Scholar] [CrossRef]
- Halla, P.; Merino-Saum, A. Conceptual frameworks in indicator-based assessments of urban sustainability—An analysis based on 67 initiatives. Sustain. Dev. 2022, 30, 1056–1071. [Google Scholar] [CrossRef]
- Jatav, S.S.; Naik, K. Measuring the agricultural sustainability of India: An application of pressure-state-response (PSR) model. Reg. Sustain. 2023, 4, 218–234. [Google Scholar] [CrossRef]
- Kumar, A.; Pant, S. Analytical hierarchy process for sustainable agriculture: An overview. MethodsX 2023, 10, 101954. [Google Scholar] [CrossRef]
- Aarts, H.F.M.; De Haan, M.H.A.; Schröder, J.J.; Holster, H.C.; De Boer, J.A.; Reijs, J.W.; Oenema, J.; Hilhorst, G.J.; Sebek, L.B.; Verhoeven, F.P.M.; et al. Quantifying the environmental performance of individual dairy farms-the annual nutrient cycling assessment (ANCA). In Grassland and Forages in High Output Dairy Farming Systems; Van Den Pol-Van Dasselaar, A., Aarts, H., DeVliegher, A., Elgersma, A., Reheul, D., Reijneveld, J., Verloop, J., Hopkins, A., Eds.; Wageningen Academic Publishers: Wageningen, The Netherlands, 2015; pp. 377–380. [Google Scholar]
- An, J.; Wang, L. Dynamic evaluation of the level of agricultural sustainable development in Shandong Province. Shandong Agric. Sci. 2016, 48, 161–165. [Google Scholar] [CrossRef]
- Bastian, O.; Corti, C.; Lebboroni, M. Determining environmental minimum requirements for functions provided by agro-ecosystems. Agron. Sustain. Dev. 2007, 27, 279–291. [Google Scholar] [CrossRef]
- Cao, Z.W.; Zhou, P.; Gao, Y.; Li, Q.; Liu, C.Y.; Xu, H. Research on the evaluation system of ecological sustainable development of urban agriculture. J. Shanghai Jiao Tong Univ. Agric. Sci. 2019, 37, 19–24. [Google Scholar] [CrossRef]
- Chen, G.S.; Zhao, X.J. Construction and evaluation of an agricultural sustainable development indicator system for the Dongting Lake region. J. Hunan Univ. Finance Econ. 2011, 27, 46–49. [Google Scholar]
- Chen, Q.; Zhang, L.; Li, J. Evaluation and analysis of sustainable development of agriculture in Tianjin based on the DPSIR model. Guangdong Agric. Sci. 2017, 44, 160–167. [Google Scholar] [CrossRef]
- Dang, J.J. Ecological-Economic-Social Coordinated Development Evaluation Research for Ecological Restoration in the Loess Hilly Region. Ph.D. Thesis, Northwest A&F University, Xianyang, China, 2014. [Google Scholar]
- Dantsis, T.; Douma, C.; Giourga, C.; Loumou, A.; Polychronaki, E.A. A methodological approach to assess and compare the sustainability level of agricultural plant production systems. Ecol. Indic. 2010, 10, 256–263. [Google Scholar] [CrossRef]
- Deng, C.X.; Xie, B.G.; Wu, Y.X.; Li, X.Q.; Fu, L.H. Quantitative comprehensive evaluation of sustainable urban agricultural development in Shanghai. J. Nat. Resour. 2010, 25, 1577–1588. [Google Scholar] [CrossRef]
- Ding, X.H. Research on the Impact of Urbanization on Urban Sustainable Development. Ph.D. Thesis, Northwest A&F University, Xianyang, China, 2011. [Google Scholar]
- Ding, W.G.; Liu, X.D.; Geng, Y.Y.; Chen, H.; He, L. Evaluation and coupling coordination analysis of agricultural sustainable development in Gansu Province. Chin. J. Agric. Resour. Reg. Plan. 2019, 40, 61–69. [Google Scholar]
- Hu, H.Z. Evaluation of Food Security in the Yangtze River Economic Belt based on Agricultural Sustainability. Master’s Thesis, Southwest University, El Paso, MA, USA, 2019. [Google Scholar]
- Li, T. Policy evaluation of sustainable development of the ecological environment in the Beijing-Tianjin-Hebei urban agglomeration based on the DPSIR-TOPSIS model. Ecol. Econ. 2022, 5, 107–113. [Google Scholar]
- Li, X.P.; Wang, J. Construction and evaluation of a sustainable development indicator system for suburban rural areas. Chin. J. Agric. Resour. Reg. Plan. 2017, 38, 129–134. [Google Scholar] [CrossRef]
- Li, X.H.; Zhu, Z.L.; Yang, L.P.; Zhang, Z. Evaluation of agricultural sustainable development level in Shandong Province based on the analytic hierarchy process. Shandong Agric. Sci. 2016, 48, 169–172. [Google Scholar] [CrossRef]
- Lin, W.X. Multi-Scale Evaluation and Regulation Strategies for Sustainable Development in Urban Areas. Ph.D. Thesis, Nanjing University, Nanjing, China, 2019. [Google Scholar] [CrossRef]
- Liu, H.L. Research on the Evaluation of Regional Agricultural Sustainable Development Integrated with Geographical Indications. Ph.D. Thesis, Gannan Normal University, Ganzhou, China, 2021. [Google Scholar] [CrossRef]
- Liu, H.Y.; Xing, L.; Yang, S.Q.; Wang, W.S.; Gao, Y. Research on the evaluation of agricultural sustainable development in different regions of Hainan Province. Chin. Agric. Sci. Bull. 2019, 19, 150–156. [Google Scholar]
- Liu, C.; Zhu, M.D.; Zhou, Y.S. Design of an evaluation index system for sustainable development of modern agriculture in China. J. Beijing Agric. Vocat. Coll. 2007, 21, 28–32. [Google Scholar] [CrossRef]
- Liu, J.; Dan, W.H.; Cheng, D.Y.; Wang, R. Evaluation of agricultural sustainable development and its subsystem coupling and coordination relationship in Yunnan Province. Ecol. Econ. 2020, 36, 107–115. [Google Scholar]
- Liu, Q.H.; Gao, Y.B.; Yuan, T.S.; Li, H.Y.; Lin, W. Application of C++ programs in the quantitative evaluation of agricultural sustainability. Anhui Agric. Sci. 2008, 36, 9332–9334. [Google Scholar] [CrossRef]
- Luo, Q.Y.; Tang, Q.; Liu, Y.; Gao, M.J.; Ma, L.Y. Construction and research of the evaluation index system for sustainable agricultural development in China. Chin. Agric. Sci. Bull. 2017, 27, 158–164. [Google Scholar]
- Mao, X.B.; Fu, L.L.; Mao, X.H.; Adil, A. Evaluation of the level of agricultural sustainable development in Zhejiang Province. J. Zhejiang Agric. Sci. 2019, 31, 1926–1934. [Google Scholar] [CrossRef]
- Miao, J.Q.; Zhao, M.; Huang, G.Q. Comprehensive evaluation and empirical analysis of agricultural sustainable development in southern hilly and mountainous areas. Chin. J. Agric. Resour. Reg. Plan. 2021, 8, 163–172. [Google Scholar] [CrossRef]
- Nemecek, T.; Huguenin-Elie, O.; Dubois, D.; Gaillard, G.; Schaller, B.; Chervet, A. Life cycle assessment of Swiss farming systems: II. Extensive and intensive production. Agric. Syst. 2011, 104, 233–245. [Google Scholar] [CrossRef]
- Nie, J.; Kiminami, A.; Yagi, H. Exploring the sustainability of urban leisure agriculture in Shanghai. Sustainability 2022, 14, 4813. [Google Scholar] [CrossRef]
- Peng, X.J.; Ji, Q.R.; Zhang, X.R. Evaluation and countermeasures research on agricultural sustainable development in Jiangxi. Jiangxi Soc. Sci. 2011, 9, 76–79. [Google Scholar]
- Shi, X.G. Research on the Evaluation of Sustainable Development Planning from the Perspective of Urban Comprehensive Development. Ph.D. Thesis, Chongqing University, Chongqing, China, 2019. [Google Scholar] [CrossRef]
- Simoncini, R. Developing an integrated approach to enhance the delivering of environmental goods and services by agro-ecosystems. Reg. Environ. Chang. 2009, 9, 153–167. [Google Scholar] [CrossRef]
- Speelman, E.N.; López-Ridaura, S.; Colomer, N.A.; Astier, M.; Masera, O.R. Ten years of sustainability evaluation using the MESMIS framework: Lessons learned from its application in 28 Latin American case studies. Int. J. Sustain. Dev. World Ecol. 2007, 14, 345–361. [Google Scholar] [CrossRef]
- Sun, N. Evaluation of Sustainable Development of Forestry in Shaanxi Province. Ph.D. Thesis, Northwest A&F University, Xianyang, China, 2012. [Google Scholar]
- Thiollet-Scholtus, M.; Bockstaller, C. Using indicators to assess the environmental impacts of wine growing activity: The INDIGO® method. Eur. J. Agron. 2015, 62, 13–25. [Google Scholar] [CrossRef]
- Valizadeh, N.; Hayati, D. Development and validation of an index to measure agricultural sustainability. J. Clean. Prod. 2021, 280, 123797. [Google Scholar] [CrossRef]
- Van Calker, K.J.; Berentsen, P.B.M.; Romero, C.; Giesen, G.W.J.; Huirne, R.B.M. Development and application of a multi-attribute sustainability function for Dutch dairy farming systems. Ecol. Econ. 2006, 57, 640–658. [Google Scholar] [CrossRef]
- Viglizzo, E.F.; Frank, F.; Bernardos, J.; Buschiazzo, D.E.; Cabo, S. A rapid method for assessing the environmental performance of commercial farms in the Pampas of Argentina. Environ. Monit. Assess. 2006, 117, 109–134. [Google Scholar] [CrossRef] [PubMed]
- Wackernagel, M.; Onisto, L.; Bello, P.; Linares, A.C.; Falfán, I.S.L.; Garcίa, J.M.; Guerrero, A.I.S.; Guerrero, M.G.S. National natural capital accounting with the ecological footprint concept. Ecol. Econ. 1999, 29, 375–390. [Google Scholar] [CrossRef]
- Wang, F. Construction and capacity evaluation of the agricultural sustainable development indicator system for Hainan Province based on the analytic hierarchy process. Xinjiang Agric. Reclam. Econ. 2011, 12, 9–13. [Google Scholar] [CrossRef]
- Wang, Y. Analysis and Evaluation of Typical Models of Circular Agriculture in the Central Region of Shaanxi Province. Ph.D. Thesis, Northwest A&F University, Xianyang, China, 2020. [Google Scholar] [CrossRef]
- Wang, Y.Z.; Gorobets, A. Revision of the human development index and alternative indicators of sustainable development. China Environ. Manag. 2012, 01, 59–65. [Google Scholar] [CrossRef]
- Wang, H.J.; Lan, Z.M. Construction, measurement, and evaluation of the sustainable urban development indicator system in China. Bus. Econ. Res. 2022, 07, 184–188. [Google Scholar]
- Wang, J.; Wang, H.L. Construction of agricultural sustainable development indicator system. Mod. Agric. Technol. 2021, 7, 347–350. [Google Scholar] [CrossRef]
- Wang, Q.; Yang, S.Q. Evaluation of agricultural sustainable development based on euclidean distance method: A case study of Tongren City, Guizhou Province. J. Guizhou Univ. Nat. Sci. Ed. 2019, 36, 113–117. [Google Scholar] [CrossRef]
- Wang, Y.; Zhao, Y.N.; Huang, Y. Study on the evaluation of agricultural sustainable development level in Guizhou Province based on entropy method. Res. Land Nat. Resour. 2022, 1, 52–54. [Google Scholar] [CrossRef]
- Wang, P.L.; Gao, F.; Huang, C.L.; Song, X.Y.; Wang, B.; Wei, Y.Q.; Niu, Y.B. Progress in the study of urban sustainable development evaluation indicator systems oriented towards SDGs. Remote Sens. Technol. Appl. 2018, 33, 784–792. [Google Scholar]
- Wang, S.F.; Liu, Y.M.; Yang, L.Y.; Liu, X.D. Evaluation study of sustainable development of agriculture in Gaotai Country under the background of climate change. Gansu Agric. 2020, 12, 53–56. [Google Scholar] [CrossRef]
- Wang, J.; Xie, S.Y.; Ren, W.; Dai, G.F. Comprehensive evaluation of the sustainability of ecological agriculture in the three Gorges area. J. Southwest Norm. Univ. Nat. Sci. Ed. 2011, 36, 86–91. [Google Scholar]
- Wu, Y.; Du, D. Evaluation of agricultural sustainable development capability in Jiangsu Province based on BP neural network. In Decision Science and Evaluation—Proceedings of the Eighth Academic Annual Conference of the Chinese Society for Systems Engineering Decision Science Committee; Chinese Systems Engineering Society: Beijing, China, 2009. [Google Scholar]
- Xu, L.F. Research on the Evaluation Index System for the Construction of Urban Ecological Civilization in China. Ph.D. Thesis, China University of Geosciences, Wuhan, China, 2014. [Google Scholar]
- Yang, R. Evaluation of Agricultural Climate Ecological Adaptability and Sustainable Development Research Based on GIS. Master’s Thesis, Shaanxi Normal University, Xi’an, China, 2010. [Google Scholar]
- Yao, P.W. Construction and evaluation of the indicator system for sustainable agricultural development in Anqiu City. J. Mt. Agric. Biol. 2007, 26, 156–160. [Google Scholar] [CrossRef]
- Yao, W.; Zhang, H.Y. Sustainable development indicator system and mathematical models—A case study of Angola. Business 2015, 22, 293. [Google Scholar]
- Yu, X. Empirical Research on the Capacity Assessment and Demonstration Effect of National Sustainable Development Experimental Zones. Ph.D. Thesis, Southwest Jiao Tong University, Chengdu, China, 2015. [Google Scholar]
- Zhang, Z.C. Research on the construction of urban sustainable development evaluation indicator system. Constr. Sci. Technol. 2022, 6, 15–17+26. [Google Scholar] [CrossRef]
- Zhang, Y.; Cao, Y. Research on the sustainable development evaluation indicator system for pastoral areas in China. J. Dalian Natl. Univ. 2012, 14, 333–337. [Google Scholar] [CrossRef]
- Zhang, G.F.; Gou, B.C. Comprehensive evaluation of sustainable development of agriculture in Fuxin based on PCA method. J. Liaoning Tech. Univ. Soc. Sci. Ed. 2012, 4, 349–351. [Google Scholar]
- Zhang, M.; Zhu, H.J. Research on the evaluation indicator system for sustainable agricultural production systems in Fujian Province. J. Fujian Norm. Univ. Nat. Sci. Ed. 2001, 17, 92–97. [Google Scholar] [CrossRef]
- Zhang, J.; Liu, Q.Z.; Shi, J.J.; Cao, D.D.; Zhou, C.H.; Xue, J.H.; Cui, X.D. Analysis and reference of international typical sustainable development indicator systems. China Environ. Manag. 2020, 12, 89–95. [Google Scholar] [CrossRef]
- Zhang, L.; Wang, L.; Ma, Y.Q.; Min, R. Construction of an evaluation indicator system for sustainable grain production in Hunan Province. Mod. Agric. Sci. Technol. 2021, 11, 238–241+246. [Google Scholar] [CrossRef]
- Zhao, Q.W. Evaluation Research on the Sustainable Development of Sightseeing Agriculture in the Mountainous Areas of Dongyuan Country, Guangdong Province. Master’s Thsis, South China University of Technology, Guangzhou, China, 2020. [Google Scholar] [CrossRef]
- Zhao, Y.N. Dynamic evaluation of sustainable urban agriculture development in Zhengzhou. Coop. Econ. Sci. 2016, 17, 46–48. [Google Scholar]
- Zhao, D.D.; Liu, C.M.; Bao, B.F.; Xu, B. Evaluation of agricultural sustainable development capability and subsystem coordination analysis—A case study of China’s main grain-producing areas. Econ. Geogr. 2018, 4, 157–163. [Google Scholar] [CrossRef]
- Zhou, X.H. Sustainable Agricultural Development in China: Goals, Problems, and Strategies. Ph.D. Thesis, Southwestern University of Finance and Economics, Chengdu, China, 2000. [Google Scholar]
- Zhu, X.M.; Ma, Z.S. Evaluation of agricultural sustainable development level based on entropy method: A case study of cities in Anhui Province. Anhui Agric. Sci. 2019, 10, 231–233+237. [Google Scholar] [CrossRef]
- Haas, G.; Wetterich, F.; Geier, U. Life cycle assessment framework in agriculture on the farm level. Int. J. Life Cycle Assess. 2000, 5, 345–348. [Google Scholar] [CrossRef]
- Hani, F.; Braga, F.S.; Stampfli, A.; Keller, T.; Fischer, M.; Porsche, H. RISE, a tool for holistic sustainability assessment at the farm level. Int. Food Agribus. Manag. Rev. 2003, 6, 78–90. [Google Scholar] [CrossRef]
- Hou, L.C.; Li, H.Q. Evaluation of agricultural sustainability of farmers based on multi-criteria decision-making methods. Guangdong Agric. Sci. 2017, 44, 121–128. [Google Scholar]
- Wang, L.S. Evaluation and Countermeasure Research on Sustainable Agricultural Development in Xiadian Town. Master’s Thesis, Ocean University of China, Qingdao, China, 2011. [Google Scholar] [CrossRef]
- Lewis, K.; Bardon, K. A computer-based informal environmental management system for agriculture. Environ. Model. Softw. 1998, 13, 123–137. [Google Scholar] [CrossRef]
- López-ridaura, S.; Van Keulen, H.; Van Ittersum, M.K.; Leffelaar, P.A. Multiscale methodological framework to derive criteria and indicators for sustainability evaluation of peasant natural resource management systems. Environ. Dev. Sustain. 2005, 7, 51–69. [Google Scholar] [CrossRef]
- Meul, M.; Passel, S.; Nevens, F.; Dessein, J.; Rogge, E.; Mulier, A.; Hauwermeiren, A. MOTIFS: A monitoring tool for integrated farm sustainability. Agron. Sustain. Dev. 2008, 28, 321–332. [Google Scholar] [CrossRef]
- Pacini, C.; Lazzerini, G.; Migliorini, P.; Vazzana, C. An indicator-based framework to evaluate sustainability of farming systems: Review of applications in Tuscany. Ital. J. Agron. 2009, 4, 23–40. [Google Scholar] [CrossRef]
- Pacini, G.C.; Lazzerini, G.; Vazzana, C. AESIS: A support tool for the evaluation of sustainability of agroecosystems. Example of applications to organic and integrated farming systems in Tuscany, Italy. Ital. J. Agron. 2011, 6, e3. [Google Scholar] [CrossRef]
- Rigby, D.; Woodhouse, P.; Young, T.; Burton, M. Constructing a farm level indicator of sustainable agricultural practice. Ecol. Econ. 2001, 39, 463–478. [Google Scholar] [CrossRef]
- Rodrigues, G.S.; Rodrigues, I.A.; Buschinelli, C.C.D.A.; De Barros, I. Integrated farm sustainability assessment for the environmental management of rural activities. Environ. Impact Assess. Rev. 2010, 30, 229–239. [Google Scholar] [CrossRef]
- Rong, S.H. Fuzzy comprehensive evaluation of sustainable development of ecological agriculture in Heigangkou Yellow river irrigation area. Mod. Agric. Sci. Technol. 2008, 23, 315–317. [Google Scholar] [CrossRef]
- Tzilivakis, J.; Lewis, K.A. The development and use of farm-level indicators in England. Sustain. Dev. 2004, 12, 107–120. [Google Scholar] [CrossRef]
- Wang, Z.W. Research on the sustainable development of farms in the yellow flood area of Henan. J. Manag. Cadre Coll. Minist. Agric. Rural Aff. 2021, 2, 51–58. [Google Scholar]
- Zahm, F.; Viaux, P.; Vilain, L.; Girardin, P.; Mouchet, C. Assessing farm sustainability with the IDEA method—From the concept of agriculture sustainability to case studies on farms. Sustain. Dev. 2008, 16, 271–281. [Google Scholar] [CrossRef]
- Benoît, C.; Norris, G.A.; Valdivia, S.; Ciroth, A.; Moberg, A.; Bos, U.; Prakash, S.; Ugaya, C.; Beck, T. The guidelines for social life cycle assessment of products: Just in time! Int. J. Life Cycle Assess. 2010, 15, 156–163. [Google Scholar] [CrossRef]
- López-Ridaura, S.; Masera, O.; Astier, M. Evaluating the sustainability of complex socio-environmental systems. The MESMIS framework. Ecol. Indic. 2002, 2, 135–148. [Google Scholar] [CrossRef]
- Pottiez, E.; Lescoat, P.; Bouvarel, I. AVIBIO: A method to assess the sustainability of the organic poultry industry. In Proceedings of the 10th European International Farming Systems Association (IFSA) Symposium, Aarhus, Denmark, 1–4 July 2012; pp. 1–7. [Google Scholar]
- Van Cauwenbergh, N.; Biala, K.; Bielders, C.; Brouckaert, V.; Franchois, L.; Cidad, V.G.; Hermy, M.; Mathijs, E.; Muys, B.; Reijnders, J.; et al. SAFE—A hierarchical framework for assessing the sustainability of agricultural systems. Agric. Ecosyst. Environ. 2007, 120, 229–242. [Google Scholar] [CrossRef]
- Zhuang, L. Research on Sustainable Development Issues of Forestry Enterprises in China. Ph.D. Thesis, Northeast Agricultural University, Harbin, China, 2013. [Google Scholar]
- Saaty, R.W. The analytic hierarchy process—What it is and how it is used. Math. Model. 1987, 9, 161–176. [Google Scholar] [CrossRef]
- Wang, D.; Lin, X.; Liu, X.; Sun, M. Dynamic divergence and improvement paths of sustainable development level of urban agriculture in Beijing counties. Geogr. Res. 2014, 33, 1706–1715. [Google Scholar] [CrossRef]
- D’Souza, G.; Cyphers, D.; Phipps, T. Factors affecting the adoption of sustainable agricultural practices. Agric. Resour. Econ. Rev. 1993, 22, 159–165. [Google Scholar] [CrossRef]
- Nkonya, E.; Mirzabaev, A.; Von Braun, J. Economics of Land Degradation and Improvement—A Global Assessment for Sustainable Development; Springer Nature: Cham, Switzerland, 2016. [Google Scholar]
- Ingrao, C.; Strippoli, R.; Lagioia, G.; Huisingh, D. Water scarcity in agriculture: An overview of causes, impacts and approaches for reducing the risks. Heliyon 2023, 9, e18507. [Google Scholar] [CrossRef]
- Huang, J.; Tichit, M.; Poulot, M.; Darly, S.; Li, S.; Petit, C.; Aubry, C. Comparative review of multifunctionality and ecosystem services in sustainable agriculture. J. Environ. Manag. 2015, 149, 138–147. [Google Scholar] [CrossRef]
- DeBoe, G. Impacts of Agricultural Policies on Productivity and Sustainability Performance in Agriculture: A Literature Review. OECD Food, Agriculture and Fisheries Papers, No. 141; OECD: Paris, France, 2020. [Google Scholar]
- Archer, D.W.; Dawson, J.; Kreuter, U.P.; Hendrickson, M.; Halloran, J.M. Social and political influences on agricultural systems. Renew. Agric. Food Syst. 2008, 23, 272–284. [Google Scholar] [CrossRef]
- Liu, Y.S.; Liu, Y.; Guo, L.Y. Impact of climatic change on agricultural production and response strategies in China. Chin. J. Eco-Agric. 2010, 18, 905–910. [Google Scholar] [CrossRef]
- Cui, F.Q. Development of water-enclosed economy and agricultural restructuring. Water Resour. World 2001, 09, 16–17. [Google Scholar]
- Lee, D.R. Agricultural sustainability and technology adoption: Issues and policies for developing countries. Am. J. Agric. Econ. 2005, 87, 1325–1334. [Google Scholar] [CrossRef]
- Lechenet, M.; Bretagnolle, V.; Bockstaller, C.; Boissinot, F.; Petit, M.S.; Petit, S.; Munier-Jolain, N.M. Reconciling pesticide reduction with economic and environmental sustainability in arable farming. PloS ONE 2014, 9, e97922. [Google Scholar] [CrossRef] [PubMed]
- Penuelas, J.; Coello, F.; Sardans, J. A better use of fertilizers is needed for global food security and environmental sustainability. Agric. Food Secur. 2023, 12, 5. [Google Scholar] [CrossRef]
- Wang, F. Thoughts on accelerating the revitalization and adjustment of Baoshan district’s stock of inefficient industrial land. Shanghai Land 2014, 3, 20–23. [Google Scholar]
- Khairallah, V. How Bridges and Pedestrian Subways Can Be More than Means for Transportation a Study on How to Raise Social Aspects in Planning Processes. Master’s Thesis, Chalmers University of Technology, Gothenburg, Sweden, 2019. [Google Scholar]
- Penrith, M.L.; Bastos, A.D.; Etter, E.M.C.; Beltrán-Alcrudo, D. Epidemiology of African swine fever in Africa today: Sylvatic cycle versus socio-economic imperatives. Transbound. Emerg. Dis. 2019, 66, 672–686. [Google Scholar] [CrossRef] [PubMed]
- Hemani, S.; Das, A.K.; Chowdhury, A. Influence of urban forms on social sustainability: A case of Guwahati, Assam. Urban Des. Int. 2017, 22, 168–194. [Google Scholar] [CrossRef]
- Liu, J.; Liu, B.; Shan, B.; Wei, S.; An, T.; Shen, G.; Chen, Z. Prevalence of African swine fever in China, 2018–2019. J. Med. Virol. 2020, 92, 1023–1034. [Google Scholar] [CrossRef]
- Jiang, H. Discussion on the rationality of the red line of arable land. J. Econ. Res. 2013, 25, 36–37. [Google Scholar] [CrossRef]
- Yoshida, S.; Yagi, H.; Kiminami, A. Diversification strategies and the sustainability of agricultural management: Focusing on the role of business management capacity in urban and suburban agricultural management. J. Agric. Manag. Res. 2019, 57, 7–19. [Google Scholar] [CrossRef]
- Shanghai Municipal Statistics Bureau. Shanghai Rural and Agricultural Statistical Yearbook 2020; Shanghai Municipal Statistics Bureau: Shanghai, China, 2021.
- Wang, A.H. The dilemma and way out of rural population aging in the new period--a re-examination based on the perspective of urbanization. Explor. Econ. Issues 2012, 12, 91–96. [Google Scholar] [CrossRef]
- Zhai, J. Urban population expansion and changes in local agriculture in modern Shanghai. Stud. Chin. Econ. Hist. 2022, 4, 124–134. [Google Scholar]
Figure 1.
Process framework for constructing the sustainability evaluation indicator system of Shanghai urban agriculture [8,22,23,24,25,26,27].

Figure 2.
Research area.

Figure 3.
Process framework for the Delphi method analysis.

Figure 4.
Twenty high-frequency indicators collected from the literature (n = times appears in the literature we collected).
Figure 4.
Twenty high-frequency indicators collected from the literature (n = times appears in the literature we collected).

Figure 5.
Overall agricultural sustainability in Shanghai between 2010 and 2020.

Figure 6.
Economic agricultural sustainability in Shanghai between 2010 and 2020.

Figure 7.
Environmental agricultural sustainability in Shanghai between 2010 and 2020.

Figure 8.
Social agricultural sustainability in Shanghai between 2010 and 2020.

Figure 9.
Changes in agricultural sustainability in Shanghai between 2010 and 2020.

Figure 10.
Distribution of agricultural sustainability in Shanghai districts between 2010 and 2020.

Figure 11.
The average agricultural sustainability status of Shanghai’s agricultural districts between 2010 and 2020.
Figure 11.
The average agricultural sustainability status of Shanghai’s agricultural districts between 2010 and 2020.

Figure 12.
Changes in agricultural sustainability between 2010 and 2020 in Shanghai’s agricultural districts.
Figure 12.
Changes in agricultural sustainability between 2010 and 2020 in Shanghai’s agricultural districts.


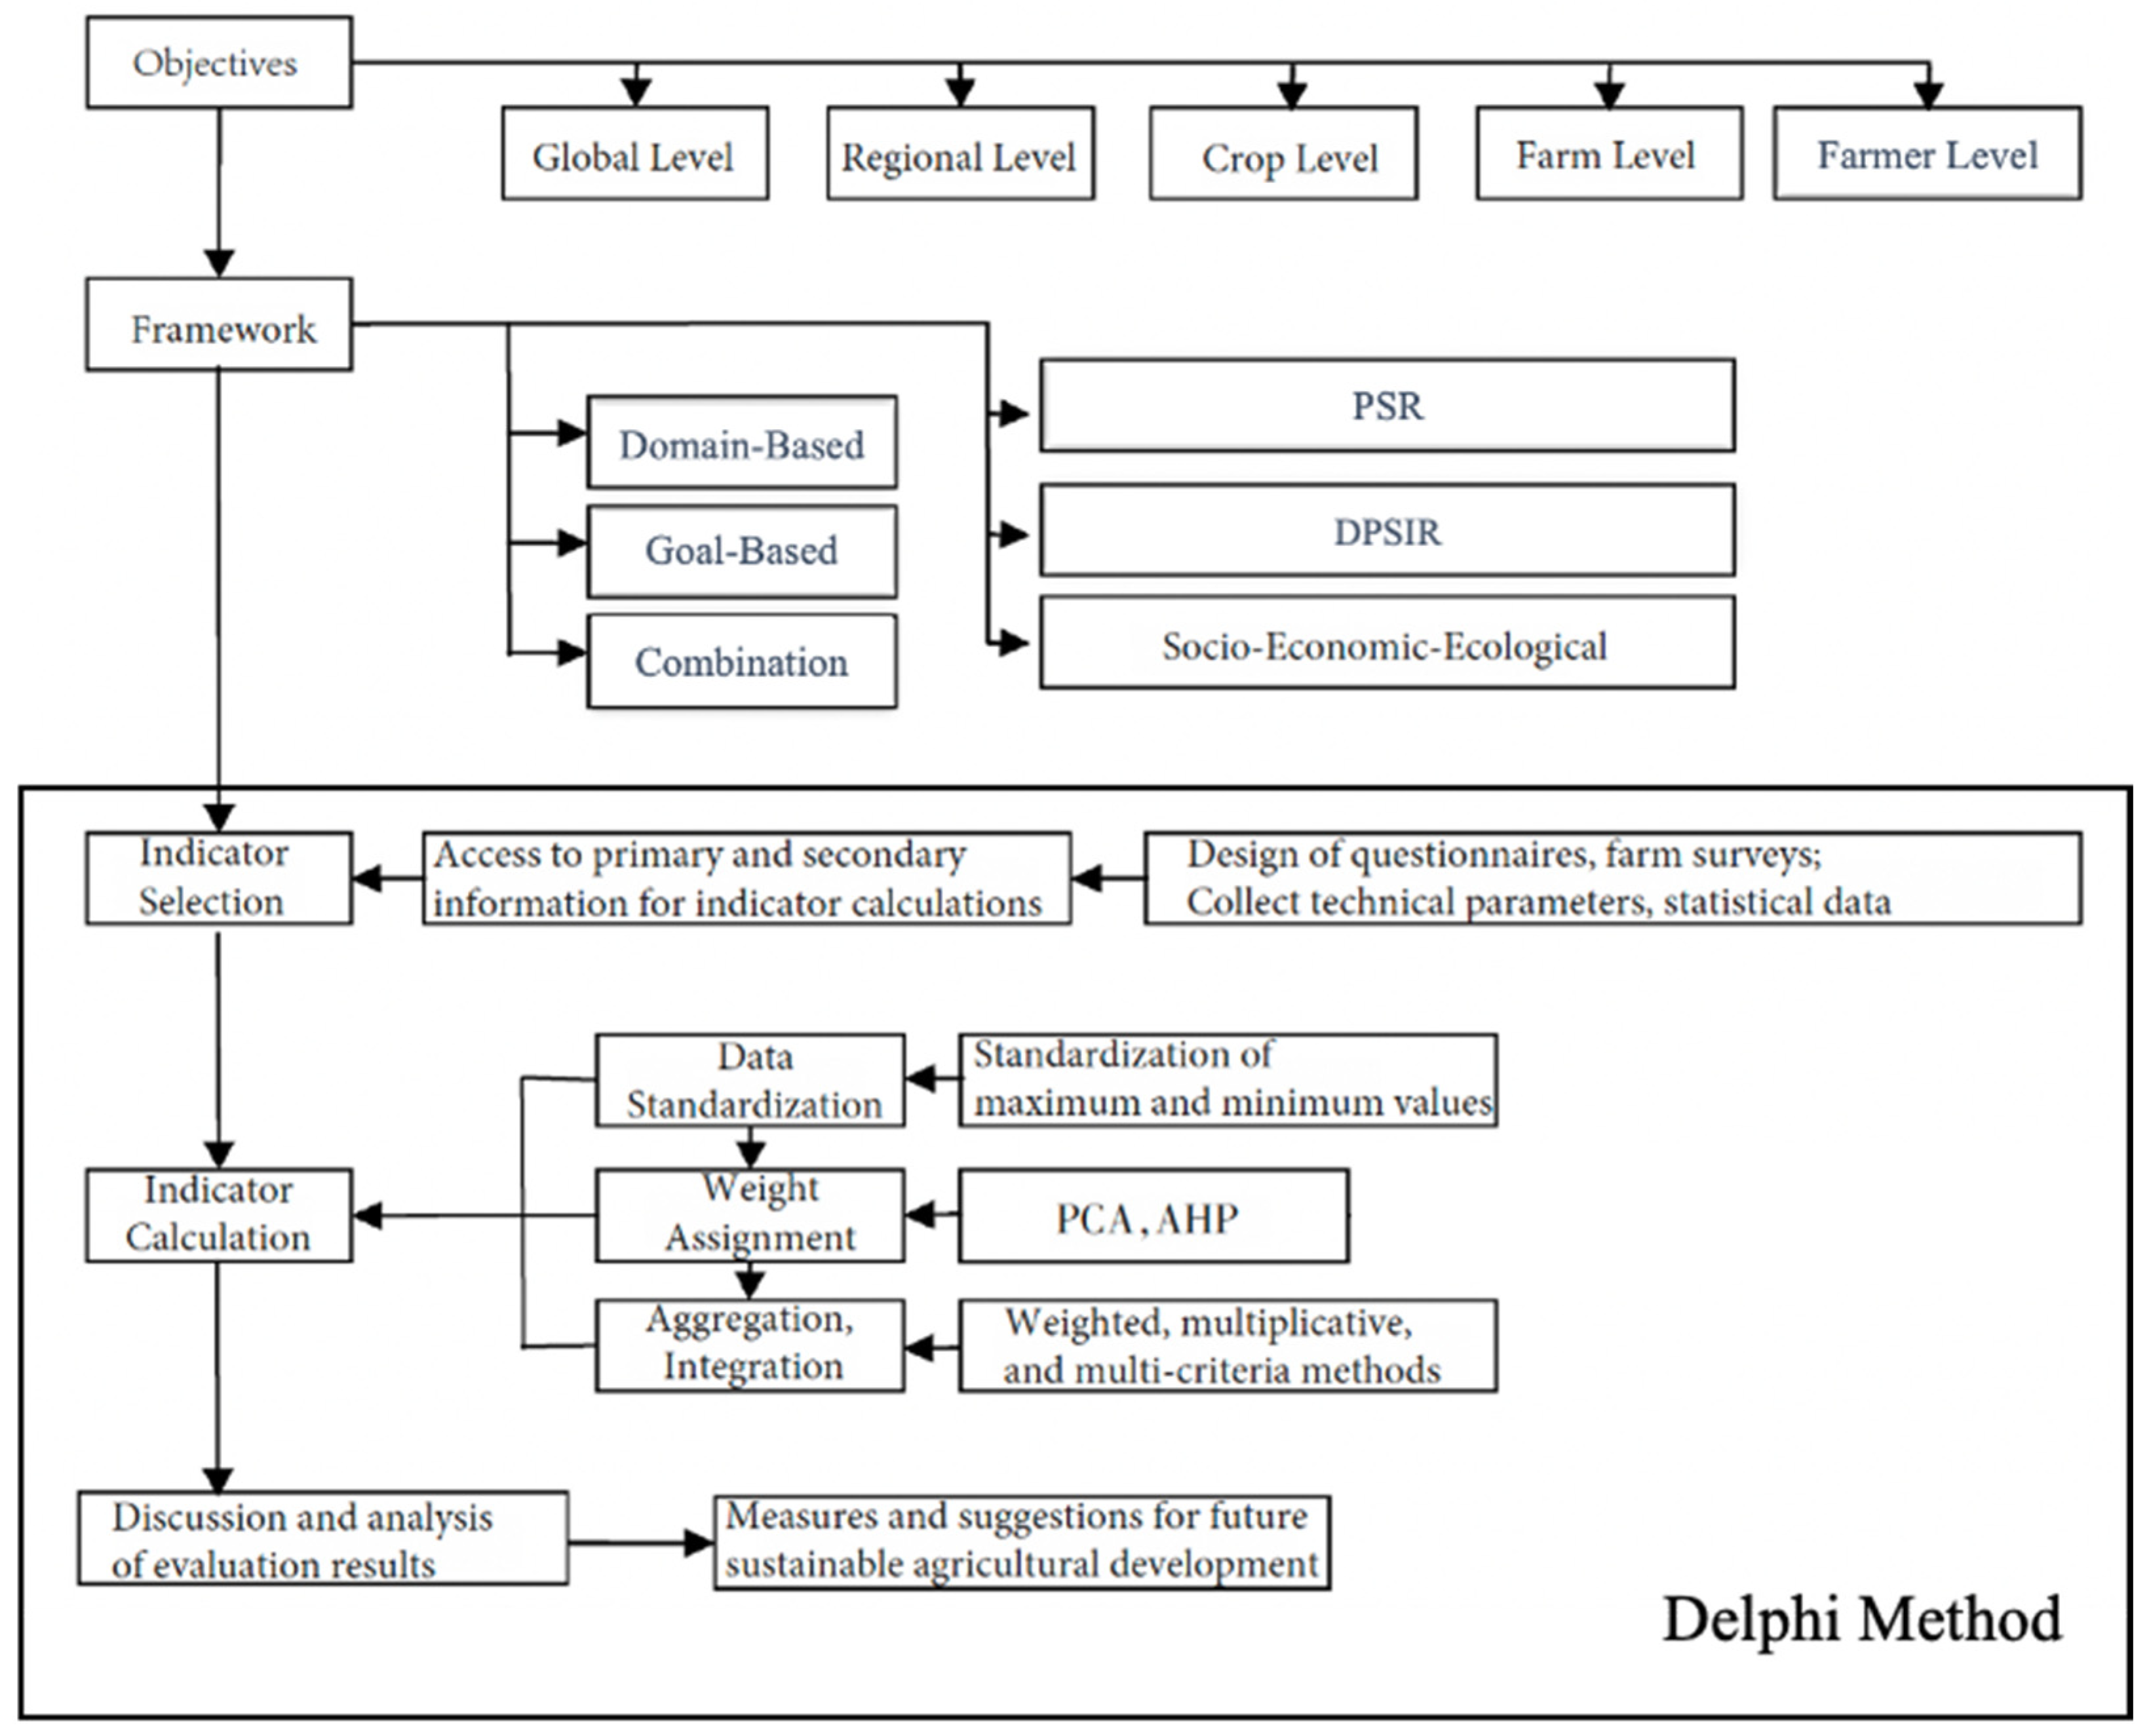
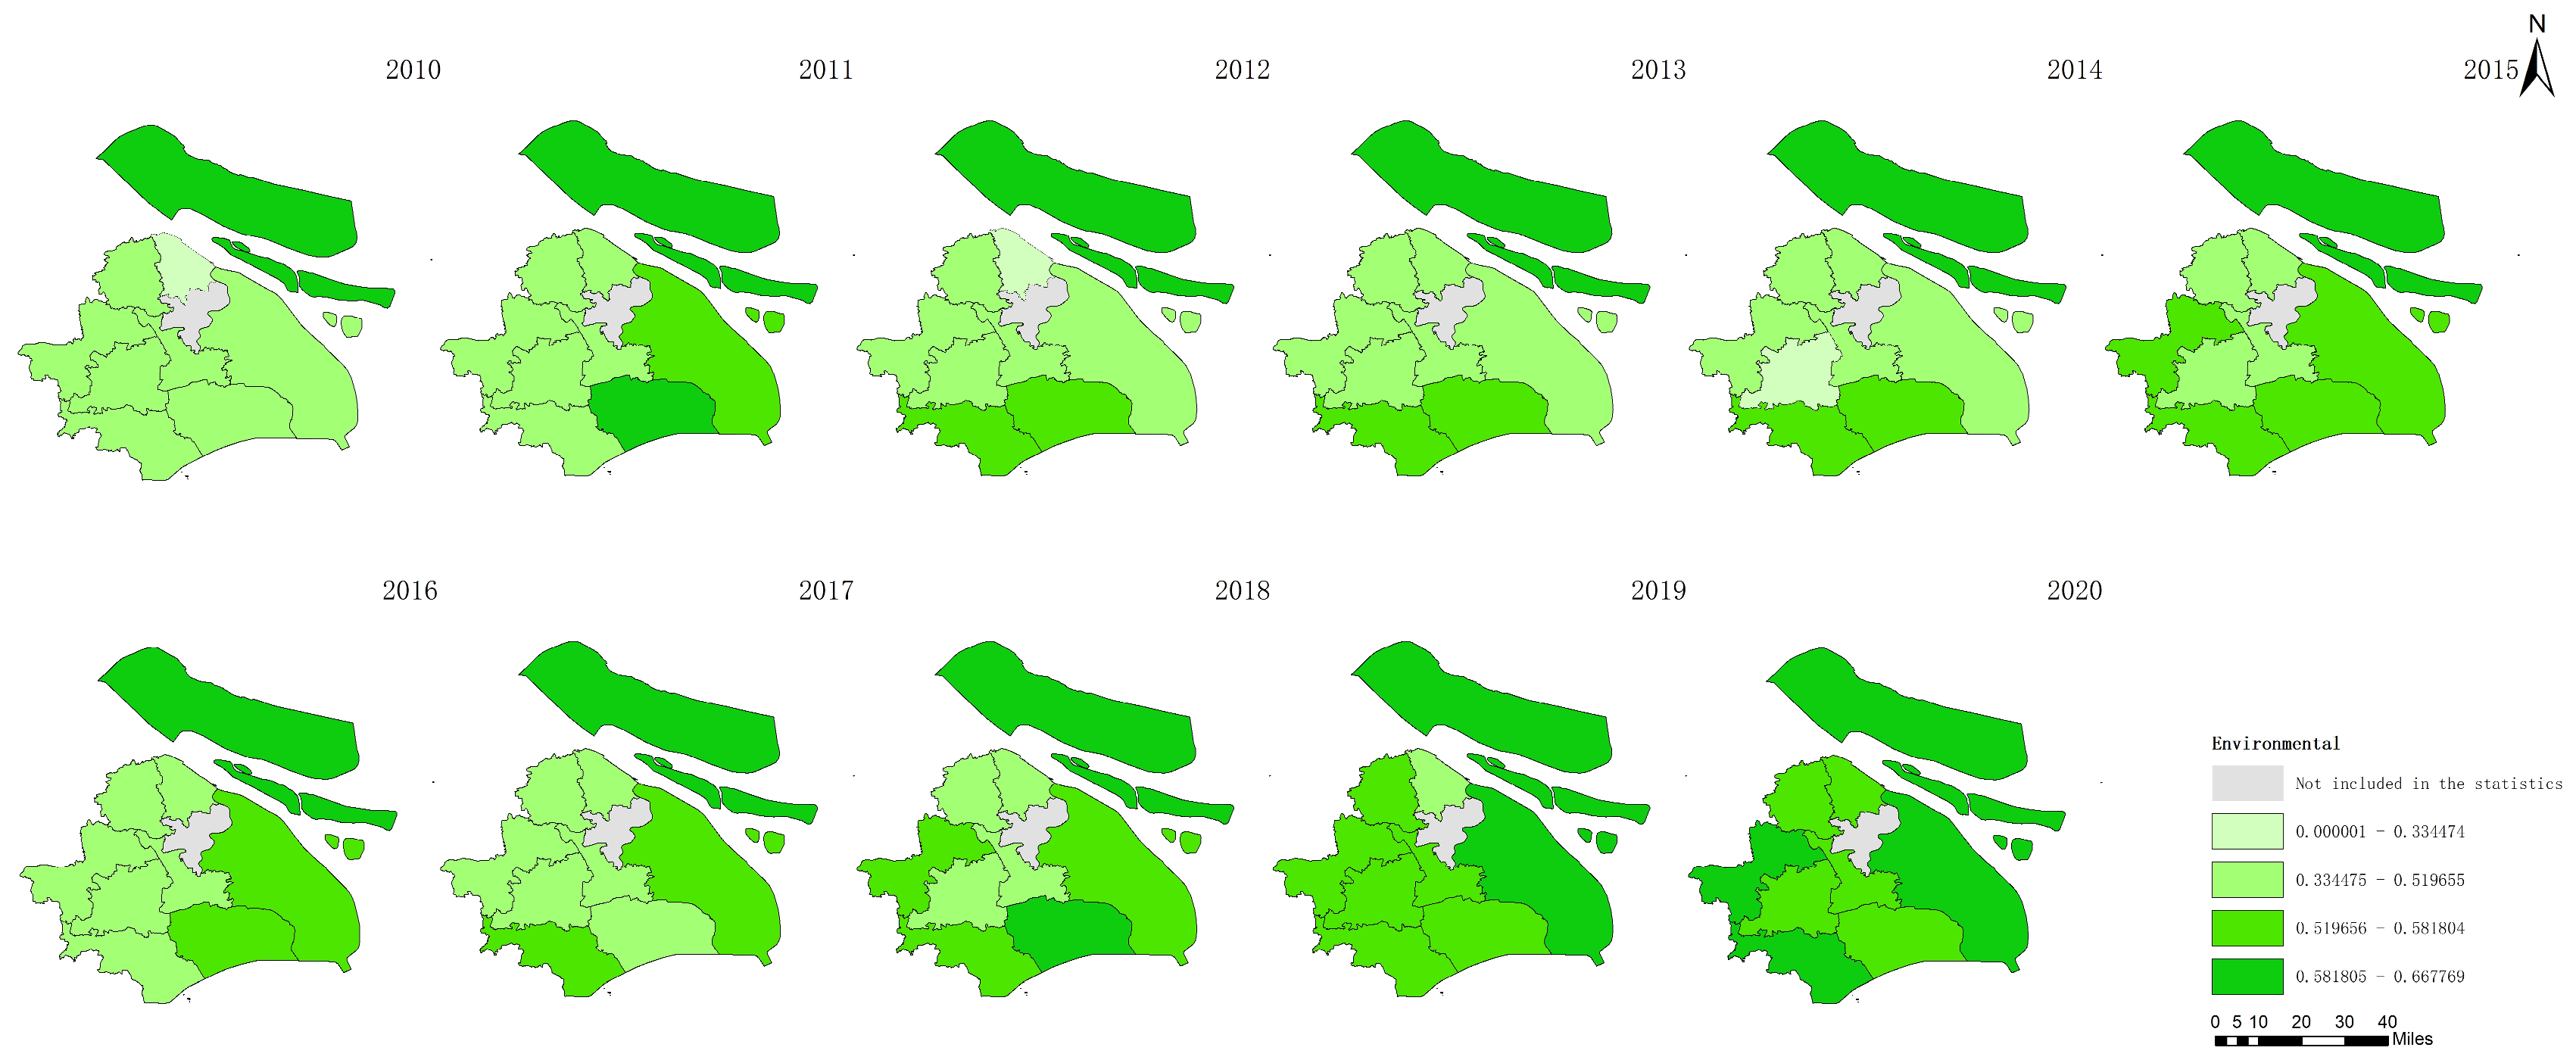
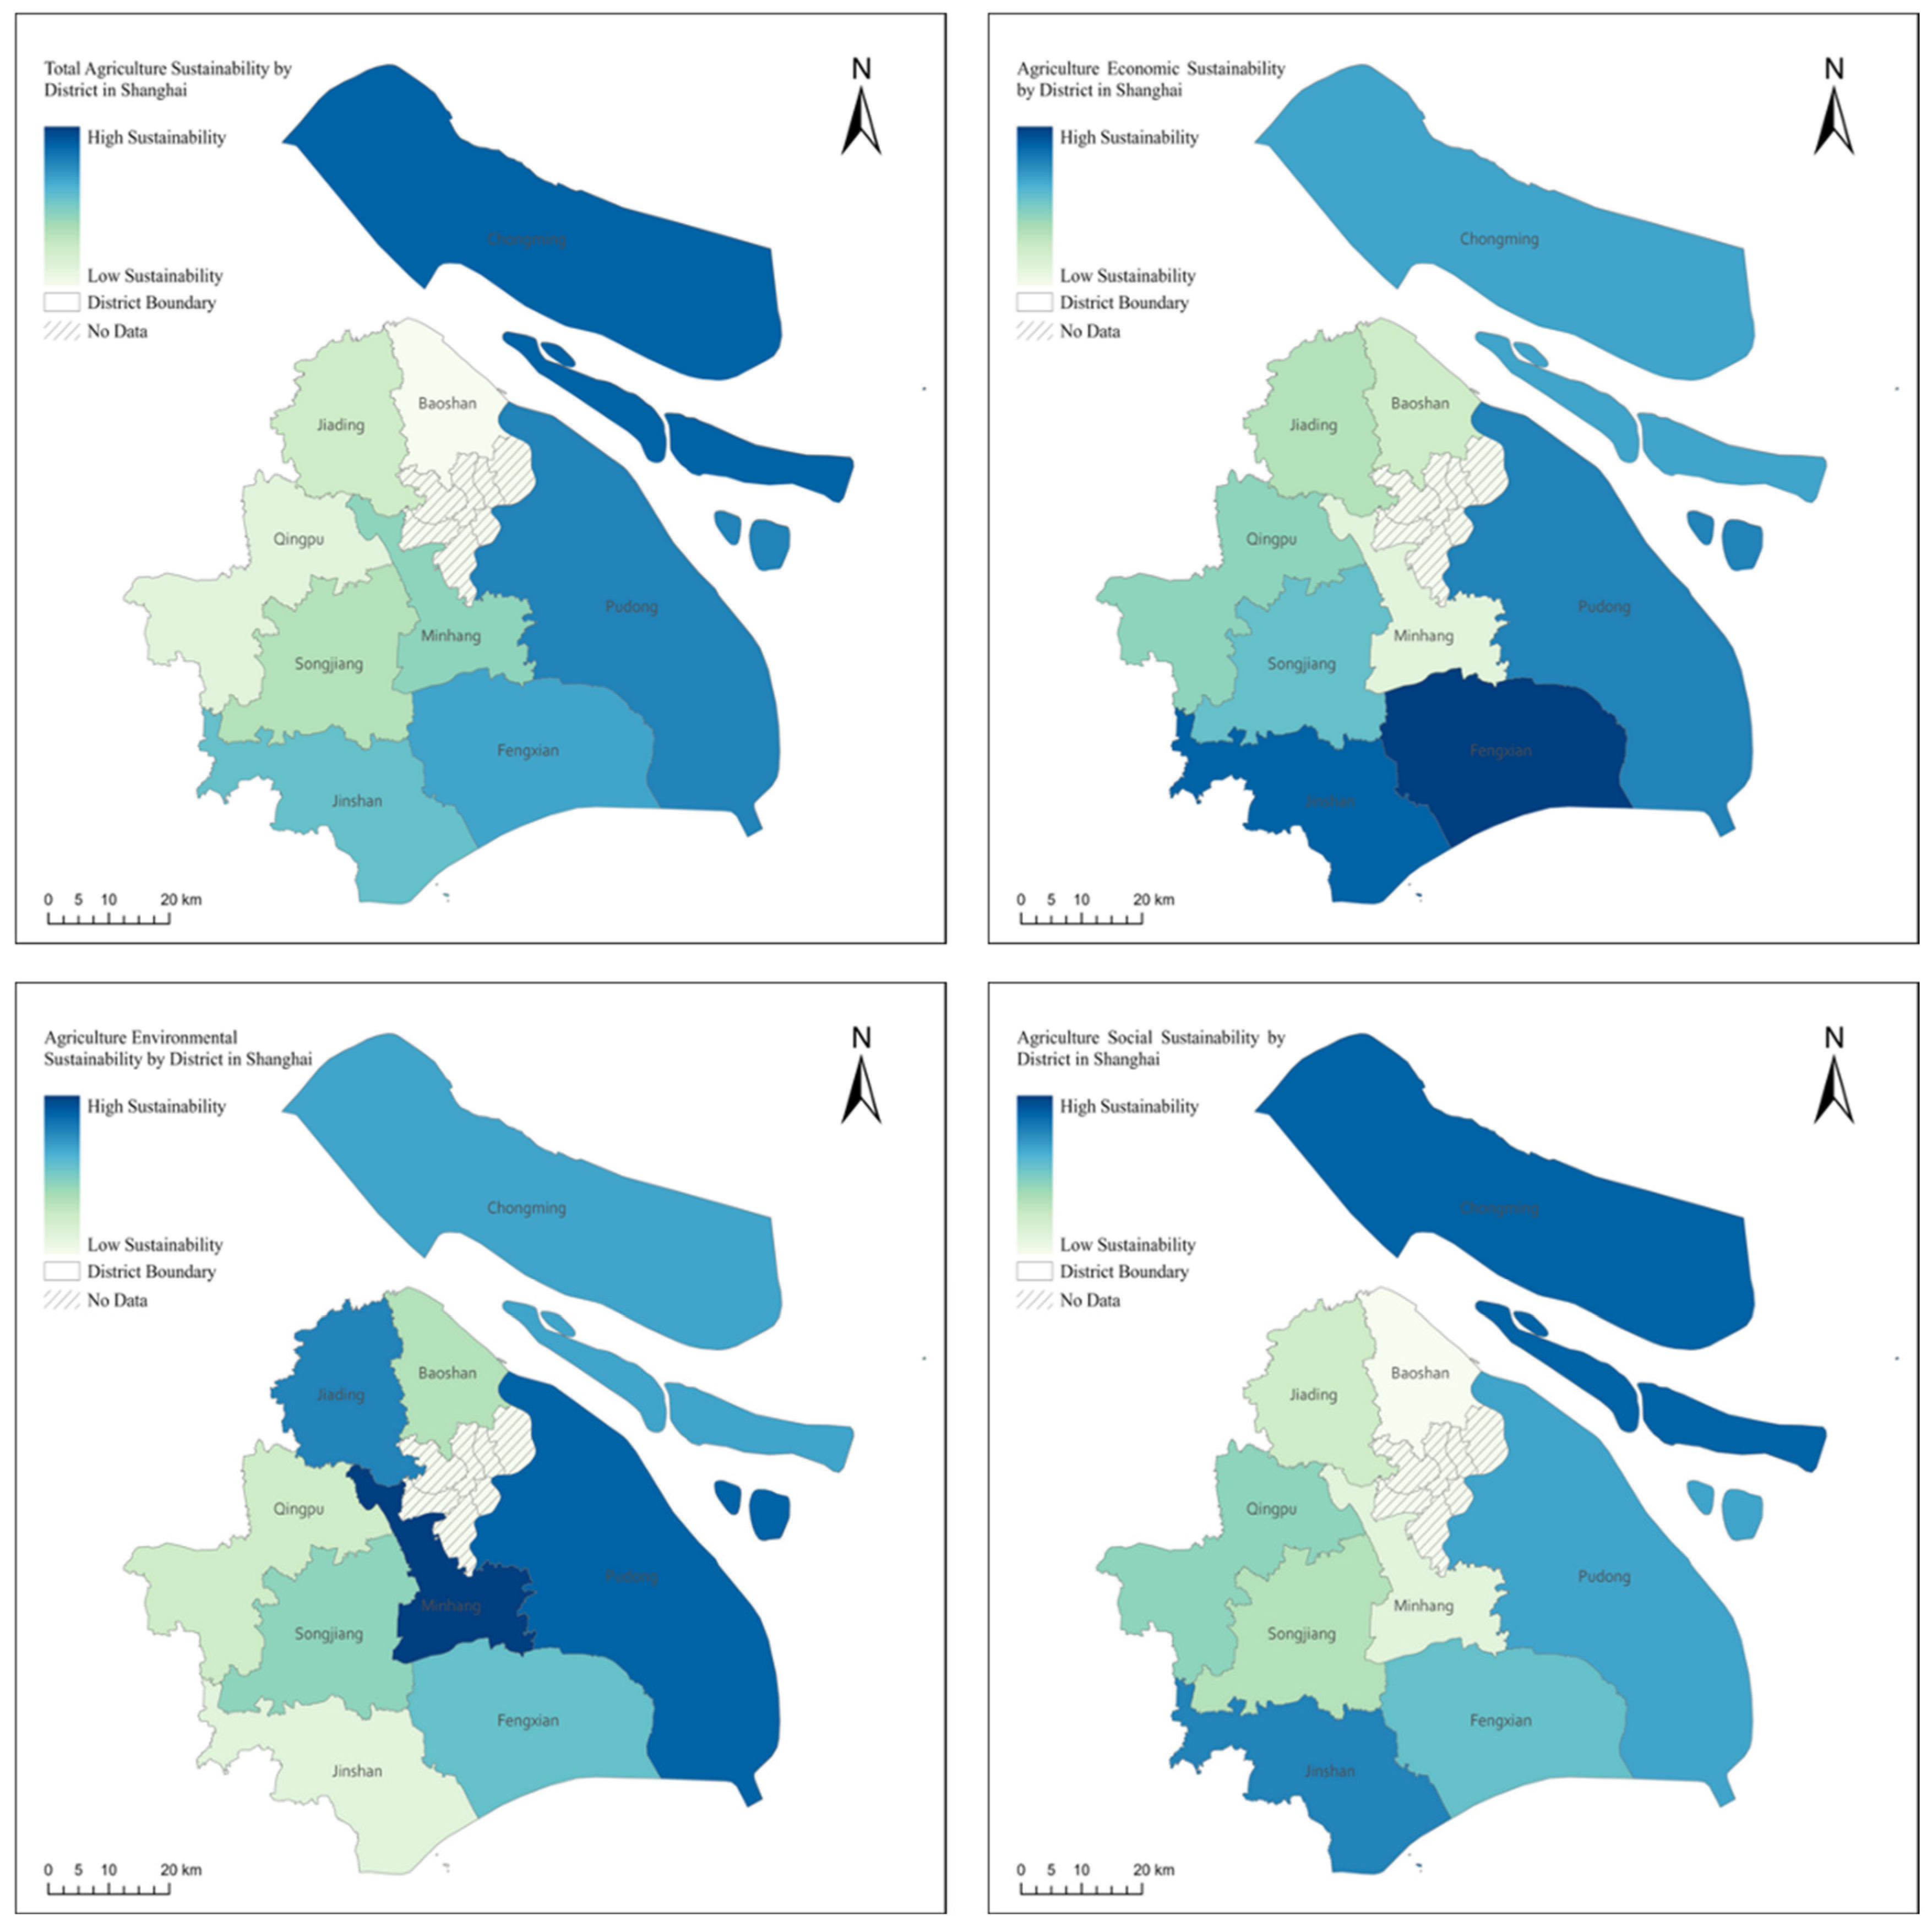
Table 1.
The source literature from which indicators were collated in this study.
| Number | System Level | Author |
|---|---|---|
| 64 | Regional level | Aarts et al. [28], An and Wang [29], Bastian et al. [30], Cao et al. [31], Chen and Zhao [32], Chen et al. [33], Dang [34], Dantsis et al. [35], Deng et al. [36], Ding [37], Ding et al. [38], Hu [39], Li [40], Li and Wang [41], Li et al. [42], Lin [43], Liu [44], Liu et al. [45], Liu et al. [46], Liu et al. [47], Liu et al. [48], Luo et al. [49], Mao et al. [50], Miao et al. [51], Nemecek et al. [52], Nie et al. [53], Peng et al. [54], Shao et al. [23], Shi [55], Simoncini [56], Speelman et al. [57], Sun [58], Thiollet-Scholtus and Bockstaller [59], Valizadeh and Hayati [60], Van Calker et al. [61], Viglizzo et al. [62], Wackernagel et al. [63], Wang [64], Wang [65], Wang and Gorobets [66], Wang and Lan [67], Wang and Wang [68], Wang and Yang [69], Wang et al. [70], Wang et al. [71], Wang et al. [72], Wang et al. [73], Wu and Du [74], Xu [75], Yang [76], Yao [77], Yao and Zhang [78], Yu [79], Zhang [80], Zhang and Cao [81], Zhang and Gou [82], Zhang and Zhu [83], Zhang et al. [84], Zhang et al. [85], Zhao [86], Zhao [87], Zhao et al. [88], Zhou [89], and Zhu and Ma [90] |
| 15 | Farm level | Haas et al. [91], Hani et al. [92], Hou and Li [93], Wang [94], Lewis and Bardon [95], López-Ridaura et al. [96], Meul et al. [97], Pacini et al. [98], Pacini et al. [99], Rigby et al. [100], Rodrigues et al. [101], Rong [102], Tzilivakis and Lewis [103], Tzilivakis and Lewis [103], Wang [104], and Zahm et al. [105] |
| 5 | Industry level | Benoît et al. [106], López-Ridaura et al. [107], Pottiez et al. [108], Van Cauwenbergh et al. [109], and Zhuang [110] |
Table 2.
Fourteen new indicators added after the initial round of questionnaires.
| No. | Indicators |
|---|---|
| 1 | Government policy |
| 2 | Technology to promote resource recycling |
| 3 | Sustainable development advocacy |
| 4 | Education for sustainable development |
| 5 | Forms of rural collective organization |
| 6 | Agricultural waste resource utilization rate |
| 7 | Reduction rate of pesticide and chemical fertilizer use |
| 8 | Water-saving irrigation measures |
| 9 | Use rate of mulch |
| 10 | Recycling rate of mulch |
| 11 | Scale of rural collective economy |
| 12 | Water-saving irrigation measures |
| 13 | Organic fertilizer replacement rate |
| 14 | Agricultural product safety sample inspection pass rate |
Table 3.
Sustainability indicators presented in the third round of questionnaires and their calculation methodology.
Table 3.
Sustainability indicators presented in the third round of questionnaires and their calculation methodology.
| No. | Indicators | Measurement Method | Nature | |
|---|---|---|---|---|
| Economic Sustainability | A1 | Per capita income | Total income/population | + |
| A2 | Land productivity | Total output/land area | + | |
| A3 | Agricultural commodity rate | - | + | |
| A4 | Output growth rate per capita | Current output—previous output/previous output/population | + | |
| A5 | Income growth rate per capita | Current income—previous income/previous income/population | + | |
| A6 | Share of agriculture industry in total regional output | Agriculture output/total output | + | |
| A7 | Agricultural input–output ratio | Agriculture input/agriculture output | + | |
| A8 | Vegetable output | - | + | |
| A9 | Grain output | - | + | |
| A10 | Meat output | - | + | |
| A11 | Cash crop output | - | + | |
| Environmental Sustainability | B1 | Air quality | AQI Index | - |
| B2 | Water quality | - | + | |
| B3 | Irrigation rate | Effective irrigated area/total area | + | |
| B4 | Forest coverage rate | Forest area/total area | + | |
| B5 | Total power of agricultural machinery | - | + | |
| B6 | Fertilizer use reduction rate | Previous fertilizer use—current fertilizer use/previous fertilizer use | + | |
| B7 | Reduction rate of pesticide use | Previous pesticide use—current pesticide use/previous pesticide use | + | |
| B8 | Use rate of mulch | Area of mulch used/total area | + | |
| B9 | Organic certification | Number of organic certifications in the district | + | |
| Social Sustainability | C1 | Rural population | - | + |
| C2 | Medical resources per rural resident | Number of rural hospital beds per capita | + | |
| C3 | Employment rate of rural residents | - | + | |
| C4 | Rural logistics conditions | Number of road miles | + | |
| C5 | Life expectancy | - | + | |
| C6 | Urbanization rate | Urban population/total population | - | |
| C7 | Number of people with minimum subsistence guarantee | - | - | |
| C8 | Average age | - | - | |
| C9 | Sustainable development propaganda | Agricultural sustainable development information on website | + | |
| C10 | Number of people working in agriculture-related field | - | + | |
| C11 | Number of skilled personnel | - | + |
Table 4.
The average random consistency indicator (RI) was used.
| n | 1 | 2 | 3 | 4 | 5 | 6 | 7 | 8 | 9 | 10 | 11 | 12 | 13 | 14 |
|---|---|---|---|---|---|---|---|---|---|---|---|---|---|---|
| RI | 0 | 0 | 0.52 | 0.89 | 1.12 | 1.24 | 1.36 | 1.41 | 1.46 | 1.49 | 1.52 | 1.54 | 1.56 | 1.58 |
Table 5.
Calculation results of the weights of the Shanghai urban agriculture sustainability evaluation indicator system.
Table 5.
Calculation results of the weights of the Shanghai urban agriculture sustainability evaluation indicator system.
| Primary Indicators | Weight | No. | Secondary Indicators | Weight |
|---|---|---|---|---|
| Economic Sustainability | 0.3156 | A1 | Per capita income | 0.0960 |
| A2 | Land productivity | 0.0985 | ||
| A3 | Agricultural commodity rate | 0.0957 | ||
| A4 | Output growth rate per capita | 0.0458 | ||
| A5 | Income growth rate per capita | 0.0971 | ||
| A6 | Share of agriculture industry in total regional output | 0.1020 | ||
| A7 | Agricultural input–output ratio | 0.1523 | ||
| A8 | Vegetable output | 0.0405 | ||
| A9 | Grain output | 0.0345 | ||
| A10 | Meat output | 0.2156 | ||
| A11 | Cash crop output | 0.0220 | ||
| Environmental Sustainability | 0.3691 | B1 | Air quality | 0.0776 |
| B2 | Water quality | 0.1503 | ||
| B3 | Irrigation rate | 0.1526 | ||
| B4 | Forest coverage rate | 0.0356 | ||
| B5 | Total power of agricultural machinery | 0.1417 | ||
| B6 | Fertilizer use reduction rate | 0.1083 | ||
| B7 | Reduction rate of pesticide use | 0.1290 | ||
| B8 | Use rate of mulch | 0.1491 | ||
| B9 | Organic certification | 0.0559 | ||
| Social Sustainability | 0.3151 | C1 | Rural population | 0.1006 |
| C2 | Medical resources per rural resident | 0.1024 | ||
| C3 | Employment rate of rural residents | 0.1004 | ||
| C4 | Rural logistics conditions | 0.0644 | ||
| C5 | Life expectancy | 0.0775 | ||
| C6 | Urbanization rate | 0.1021 | ||
| C7 | Number of people with minimum subsistence guarantee | 0.0461 | ||
| C8 | Average age | 0.1255 | ||
| C9 | Sustainable development propaganda | 0.0362 | ||
| C10 | Number of people working in agriculture-related field | 0.1928 | ||
| C11 | Number of skilled personnel | 0.0521 |
Disclaimer/Publisher’s Note: The statements, opinions and data contained in all publications are solely those of the individual author(s) and contributor(s) and not of MDPI and/or the editor(s). MDPI and/or the editor(s) disclaim responsibility for any injury to people or property resulting from any ideas, methods, instructions or products referred to in the content. |
© 2024 by the authors. Licensee MDPI, Basel, Switzerland. This article is an open access article distributed under the terms and conditions of the Creative Commons Attribution (CC BY) license (https://creativecommons.org/licenses/by/4.0/).
Share and Cite
MDPI and ACS Style
Nie, J.; Kiminami, A.; Yagi, H. Assessing the Sustainability of Urban Agriculture in Shanghai’s Nine Agriculture Districts: A Decadal Analysis (2010–2020). Agriculture 2024, 14, 631. https://doi.org/10.3390/agriculture14040631
AMA Style
Nie J, Kiminami A, Yagi H. Assessing the Sustainability of Urban Agriculture in Shanghai’s Nine Agriculture Districts: A Decadal Analysis (2010–2020). Agriculture. 2024; 14(4):631. https://doi.org/10.3390/agriculture14040631
Chicago/Turabian StyleNie, Jianyun, Akira Kiminami, and Hironori Yagi. 2024. "Assessing the Sustainability of Urban Agriculture in Shanghai’s Nine Agriculture Districts: A Decadal Analysis (2010–2020)" Agriculture 14, no. 4: 631. https://doi.org/10.3390/agriculture14040631
Note that from the first issue of 2016, this journal uses article numbers instead of page numbers. See further details here.