
Effects of Particle Size Distribution on the Physicochemical, Functional, and Structural Properties of Alfalfa Leaf Powder


1
Department of Life Sciences, Yuncheng University, Yuncheng 044000, China
2
Shanxi Technology Innovation Center of High Value-Added Echelon Utilization of Premium Agro-Products, Yuncheng University, Yuncheng 044000, China
3
College of Agricultural Engineering, Shanxi Agricultural University, Jinzhong 030801, China
*
Author to whom correspondence should be addressed.
Agriculture 2024, 14(4), 634; https://doi.org/10.3390/agriculture14040634
Submission received: 18 February 2024
/
Revised: 12 April 2024
/
Accepted: 16 April 2024
/
Published: 20 April 2024
(This article belongs to the Section Agricultural Product Quality and Safety)
Abstract
:To explore the effects of particle size distribution on its physicochemical, functional, and structural properties, alfalfa leaf powders with mean particle sizes (D50) of 506.1, 246.3, 209.8, 92.01, and 20.68 μm were prepared by sieving. The physicochemical, functional, and structural properties of alfalfa were compared, and correlation and principal component analyses were conducted. As the D50 of alfalfa leaf decreased, the bulk density, tap density, and the swelling capacity increased first and then decreased, but the compressibility, transition temperature, and melting temperature exhibited an opposite trend. The solubility, lightness, and inhibition of angiotensin-converting enzymes and tyrosinase were enhanced. Specifically, the alfalfa leaf with a D50 of 209.8 μm exhibited a higher bulk density and swelling capacity and a lower compressibility, transition temperature, and melting temperature. The alfalfa leaf with a D50 of 20.68 μm presented better solubility, lightness, and inhibition of angiotensin-converting enzymes and tyrosinase. Additionally, the surface roughness and the number of surface hydroxyls improved and the crystallinity index decreased, but the type of surface functional groups was unchanged. These changes in microstructure can provide an explanation for the trend of the physicochemical and functional properties. Moreover, based on the results of the correlation analysis and principal component analysis, it can be concluded that there are strong correlations among the particle size, physicochemical properties, and functional properties of alfalfa leaf. Overall, this conclusion can help determine the appropriate grinding particle size range for alfalfa leaf in different functional food products.
1. Introduction
Alfalfa (Medicago sativa L.), a herbaceous legume, is widely planted around the world. It contains high contents of protein with a balanced amino acid composition, soluble dietary fiber, flavonoids, and other active ingredients [1]. Researchers have demonstrated that these active ingredients can remove excessive free radicals and absorb harmful substances in the human body, and they can prevent hypertension, hyperlipidemia, cancer, and other diseases [2,3,4]. In addition, modern society is focused on seeking protein foods of high quality to meet the needs of the global population [5,6]. For this reason, there has recently been a significant amount of research focusing on utilizing proteins from different plant sources. Alfalfa leaf, with a high protein content, is a promising source. However, only a minimal amount of the upper alfalfa leaf is used for food when it is in bloom. The vast majority of alfalfa is mainly utilized as livestock feed due to its undesirable sensory attributes (taste and darkness), leading to low resource utilization [5].
Most studies have proven that the particle size affects the physicochemical properties of powder, which in turn affect the product’s quality. When the particle size of purple sweet potato flour decreased from 269 to 66 μm, noodles became more compact and had an orderly microstructure, better cooking properties, and higher sensory score [7]. In addition, as the particle size of grape pomace powder decreased, the total anthocyanins, total phenol content, and antioxidant activity increased, while muffin hardness and lightness were negatively influenced [8]. As the median particle size of highland barley flour decreased from 223.25 to 19.26 μm, it showed higher viscosity and water absorption, and the noodles presented a higher hardness [9]. Our previous research has found a strong correlation between the particle size of wheat bran and its physicochemical properties, as well as the sensory quality of noodles [10].
Micronization is a necessary treatment for alfalfa leaves as a raw food material. Minimal studies are available that involve the effect of particle size on the properties of alfalfa leaf. Therefore, to expand the application of alfalfa leaf in the food sector, its particle size distribution, bulk density, tap density, compressibility, solubility lightness, thermal characteristics, swelling capacity, and inhibition of angiotensin-converting enzymes and tyrosinase were explored. Additionally, the surface micromorphology, functional groups, and crystallinity index of alfalfa leaf were analyzed in this study.
2. Materials and Methods
2.1. Materials
Alfalfa (Golden Queen) was supplied by the forage practice teaching base of Shanxi Agricultural University (longitude: 112.58; latitude: 37.42; altitude: 799 m), located in Jinzhong, Shanxi, China. The average annual amount of precipitation is 547.1 mm, and the day/night cycle is 13 h day/11 h night in this area. The plant was harvested manually in the initial flowering stage (May 2020), at a height of 86–93 cm.
2.2. Reagents
Angiotensin-converting enzymes (≥2 U/mg) were supplied by Shifeng Biotechnology Co., Ltd. (Shanghai, China). Hippuril-L-Histidy-L-Leucine (≥98%) and tyrosinase (≥500 U/mg) were supplied by Solarbio Technology Co., Ltd. (Beijing, China). KBr crystal (spectroscopically pure) was supplied by Brandon Technology Co., Ltd. (Tianjin, China). Ethanol, ethyl acetate, disodium hydrogen phosphate, and sodium dihydrogen phosphate (≥99.7%) were supplied by Zhiyuan Chemical Reagent Co., Ltd. (Tianjin, China).
2.3. Preparation of Alfalfa Leaf
Leaves were obtained from the upper part (above 60 cm) of the alfalfa. Then, the leaves were washed, dried (55 °C, 200 min), crushed using high-speed smashing machines (6202, Zhong Ke Hao Yu Technology Development Co., Ltd., Beijing, China) at 25,000 r/min for 4 min, and sieved through square-hole sieves with side lengths of 0.250, 0.200, 0.160, 0.125, 0.080, and 0.063 mm, successively. The alfalfa leaf on each sieve was collected and recorded as G1 (0.200–0.250 mm), G2 (0.160–0.200 mm), G3 (0.125–0.160 mm), G4 (0.08–0.125 mm), and G5 (0.063–0.08 mm), respectively. The samples were stored at 4 °C and kept away from light. The average contents of protein, fat, ash, and dietary fiber in the alfalfa leaf were 28.62%, 6.23%, 11.35%, and 50.27%, respectively [11].
2.4. Particle Size Distribution
The particle size distribution was measured in the wet dispersion mode with ethanol and ultrasonication using a laser particle size analyzer (2600E, Bettersize Instrument Ltd., Dandong, China). A refraction index of 1.53 and an absorption parameter of 0.7 were adopted [12]. The results were reported as the D10, D50, and D90, representing the corresponding particle sizes when the cumulative particle size distribution reached 10%, 50%, and 90%, respectively. The volume average particle size (VAPS) was also obtained.
2.5. Bulk Density, Tap Density and Compressibility
The bulk density (), tap density (), and compressibility were determined according to the method described by [13] with slight modification. Then, 0.5 g (m) of the powder was transferred into a measuring cylinder (10 mL) and leveled gently, and the volume () of powder was noted. Then, the cylinder was tapped on the experimental table until the powder showed a constant volume (). Each sample was tested 10 times. The , , and compressibility were calculated using Equations (1)–(3):
2.6. Solubility
The solubility was determined according to the method described by [13] with slight modification. First, 1.0 g (m) of powder was mixed with 30 mL of distilled water. The mixture was mixed at 10 r/min for 30 min at 25 °C. Then, the mixture was filtered, and the filtrate was dried to a constant weight () at 105 °C. The solubility of the alfalfa was calculated using Equation (4):
2.7. Color
The color was measured using a spectrophotometer (CM-5, Wengkaier Trading Ltd., Foshan, China), and the results were presented according the CIELAB color parameters. The lightness (L*) was recorded (0–100: black to white).
2.8. Transition Temperature and Melting Temperature
The transition temperature () and melting temperature () were measured using a differential scanning calorimeter (Q20, TA Instruments Ltd., New Castle, DE, USA) according to the method of Huang et al. [14]. The baseline, cell constant, and temperature were calibrated before testing. Then, 50 mg of powder was transferred to an aluminum crucible and sealed. The crucible was placed in a test furnace and measured under the following test conditions: the same crucible was used as a reference; nitrogen at 0.1 MPa and 50 mL/min was used as a protective gas; the test temperature increased from 20 °C to 200 °C, increasing by10 °C/min.
2.9. Swelling Capacity
The swelling capacity (SC) was determined according to the method described by [15]. First, 0.5 g (m) of powder was added to a 10 mL of measuring cylinder. Then 8 mL of distilled water was mixed in, and the volume (V0) of the suspension was recorded. The cylinder was sealed with plastic wrap and incubated at 25 °C for 24 h, and then the volume (V1) of the suspension was recorded. The SC of the alfalfa was calculated using Equation (5):
2.10. Angiotensin-Converting Enzyme Inhibitory Activity
The angiotensin-converting enzyme (ACE) inhibitory activity was determined according to the method of Rodríguez-Hernández et al. [16]. First, 0.5 g of powder was extracted with 50 mL of 60% (V/V) ethanol for 30 min under ultrasonic power of 100 W and an ultrasonic temperature of 35 °C using ultrasonic equipment (JP-040S, Jiemeng Cleaning Equipment Co., Ltd., Shenzhen, China). The mixture was centrifuged at 2432× g for 20 min using a centrifuge (SC-2546, USTC Zonkia Scientific Instrument Co., Ltd., Anhui, China), and the supernatant was diluted to 0.5 mg/mL. Then, 20 μL of diluent, 45 μL of 0.05 U/mL ACEs, and 280 μL of phosphate buffer were mixed and preincubated at 37 °C for 3 min. Then, 75 μL of 7.6 mmol/L Hippuril-L-Histidy-L-Leucine (HHL) was added, and the mixture was preincubated at 37 °C for 30 min again. And then, 150 μL of HCl was added to stop the reaction. After that, 1.4 mL of ethyl acetate was added and centrifuged for 20 min at 4000 r/min. The supernatant of 1.2 mL was transferred into another tube and dried, and the solid obtained was re-dissolved in 0.5 mL of distilled water. The absorbance of the solution was measured at 228 nm using a spectrophotometer (UV-1200, Mapada Co., Ltd., Shanghai, China). The ACE inhibitory activity was calculated using Equation (6):
where A is the absorbance of the ACEs and diluent; B is the absorbance of the ACEs and HHL solution; C is the absorbance of the HHL solution.
Inhibition (%) = (B − A)/(B − C) × 100%
2.11. Tyrosinase Inhibitory Activity
The tyrosinase inhibitory activity was determined according to the method of Lu et al. [17]. The extract was obtained in the same way as determining the ACE inhibitory activity, and the extract was diluted to 0.1, 0.2, 0.3, 0.4, and 0.5 mg/mL. Then, 100 μL of the diluent and 100 μL of 50 U/mL L-tyrosinase were mixed, and the mixture was placed at 37 °C for 10 min. Then, 100 μL of 0.1 mg/mL L-tyrosine was added and placed at 37 °C for 30 min. After that, the absorbance was measured using a microplate reader (SpectraMax i3x, Molecular Devices, Silicon Valley, CA, USA) at 475 nm. The tyrosinase inhibitory activity was calculated using Equation (7):
where A is the absorbance of the L-tyrosine and L-tyrosinase solution; B is the absorbance of the L-tyrosine solution; C is the absorbance of the diluent, L-tyrosine, and L-tyrosinase solution; D is the absorbance of the diluent and L-tyrosine solution.
Inhibition (%) = [1 − (C − D)/(A − B)] × 100%
2.12. Surface Micromorphology
A proper amount of alfalfa was spread evenly on a conductive film and sprayed with gold in a vacuum environment. Then, the surface micromorphology of the alfalfa was observed using a scanning electron microscope (JSM–6490LV, JEOL Co., Ltd., Tokyo, Japan) at magnifications of 500 and 1000 times.
2.13. Functional Groups
First, 200 mg of KBr crystal was ground, and then 2 mg of alfalfa was added, mixed, and pressed into sheets. The sheet was scanned using a near-infrared spectrometer (Spectrum Two N, PerkinElmer Co., Ltd., Hopkinton, MA, USA), in which the wave number ranged between 450 and 4000 cm−1.
2.14. Crystallinity Index
The crystallinity was measured using an X-ray diffractometer (DX-2700, Haoyuan Instrument Co., Ltd., Dandong, China) according to the method of Zhang et al. [18]. A proper amount of alfalfa leaf powder was put into the groove of the sample plate and pressed into a sheet. Then, the sheet was scanned with Cu-Kα radial under 40 kV and 30 mA, and the diffraction angle (2θ) ranged between 5° and 40° at 2°/min. The crystallinity index (CI) of the alfalfa was calculated using Equation (8):
where I002 is the maximum intensity of the diffraction angle, and Iam is the diffraction intensity at 2θ = 18°.
2.15. Statistical Analysis
All experiments were conducted at least in triplicate, and the results were presented as the means ± standard error. Duncan’s test was used to analyze the variance (ANOVA) using SPSS17.0 software for Windows, and the difference was considered significant at p < 0.05. Pearson’s correlation and principal component analyses were performed with Origin v2022 software for Windows.
3. Results and Discussion
3.1. Physicochemical Properties of Alfalfa Leaf Powder
3.1.1. Particle Size Distribution
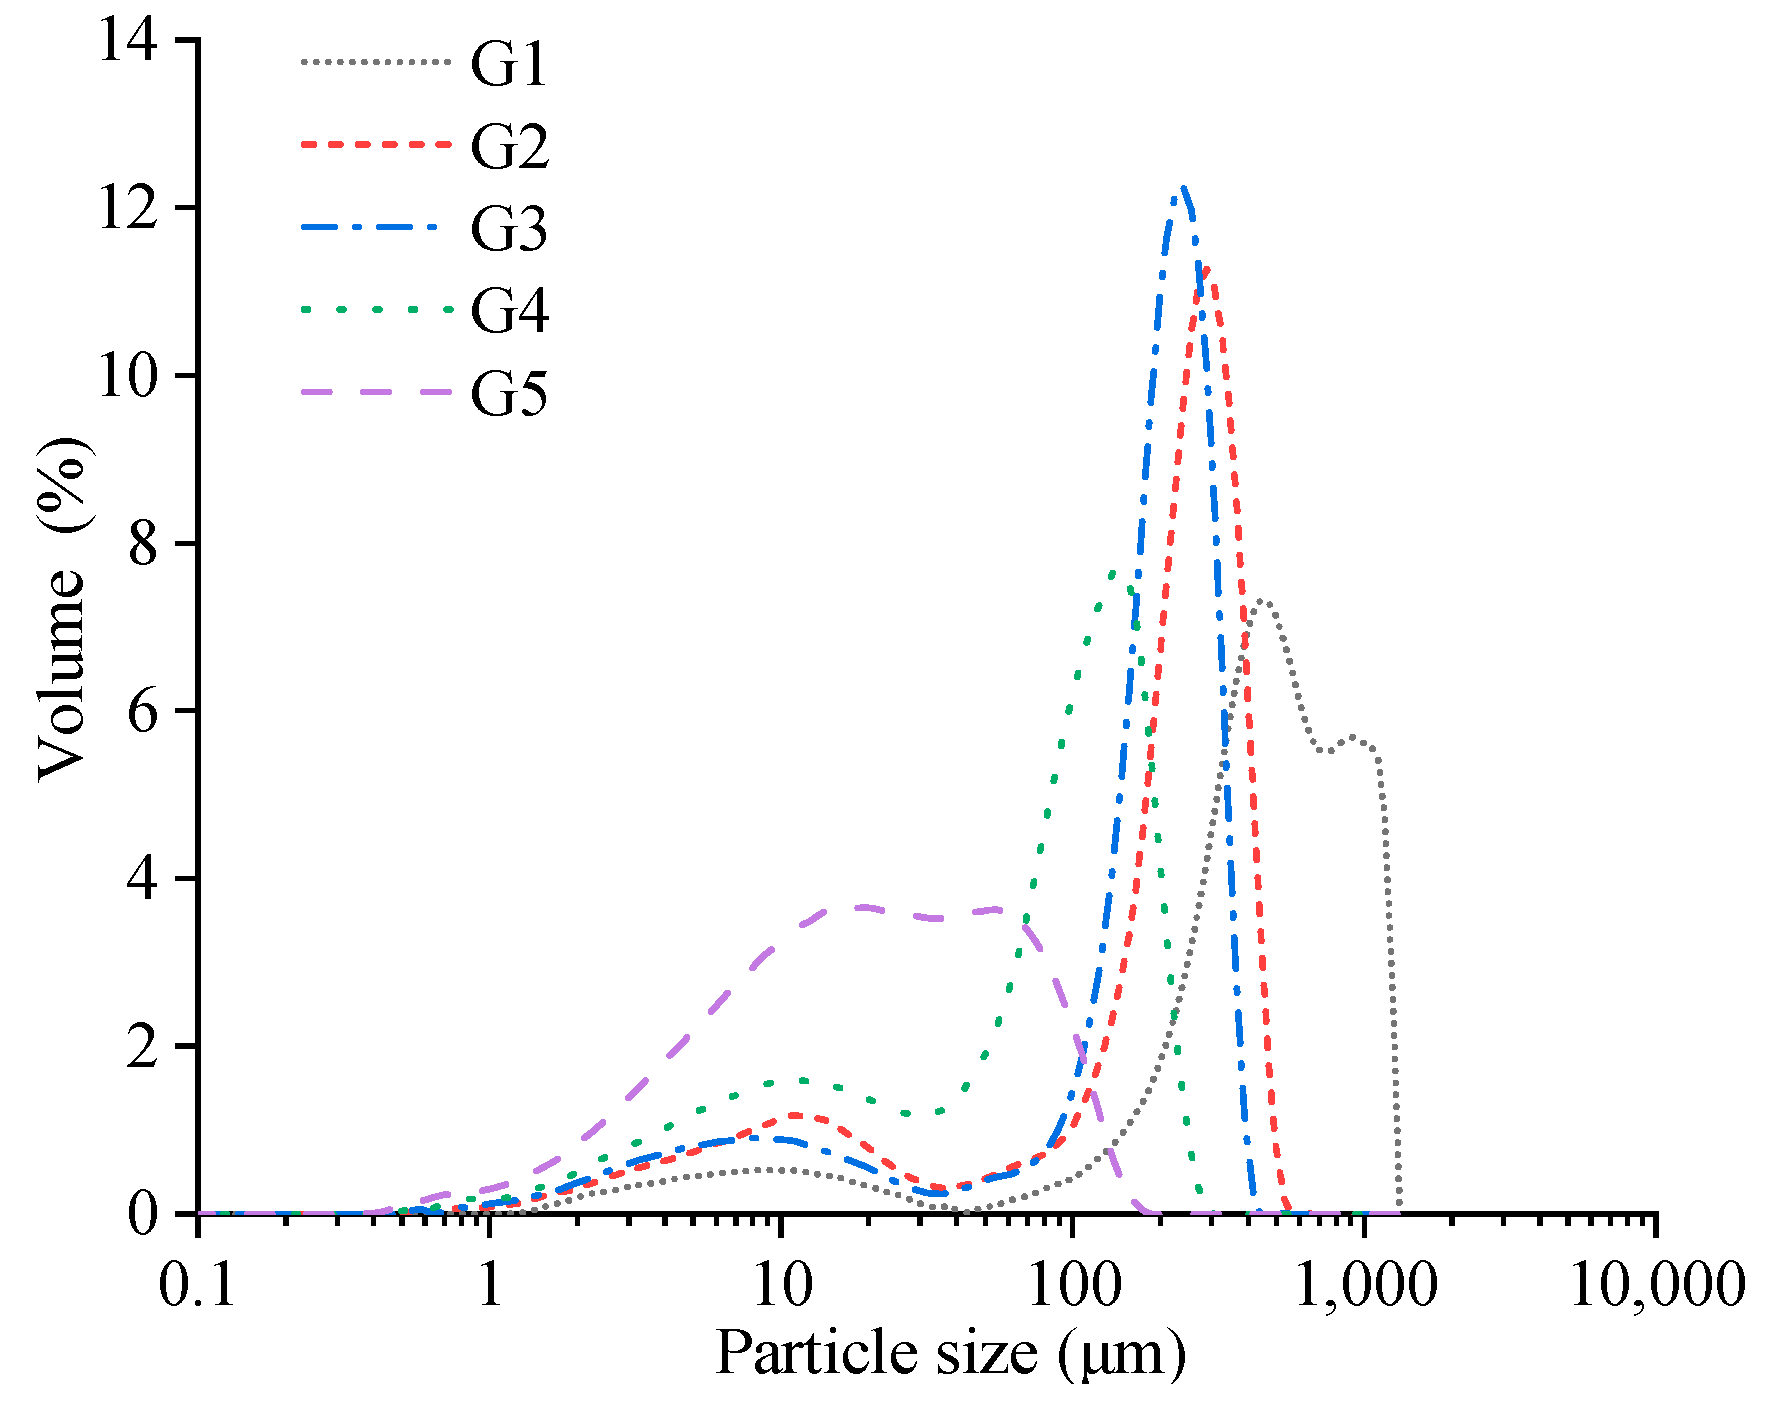
The particle size distribution of powder affects its physicochemical properties, functional properties, and processing qualities, which further affects the quality of the end-product [19]. The particle size distribution patterns of alfalfa leaf sieved through the different pore-sized sieves are shown in Figure 1, and the statistical results are shown in Table 1. The particle size of G1 presents a trimodal distribution. The particle sizes of G2, G3, G4, and G5 present bimodal distributions, and the center of the bimodal was approached gradually. In addition, the difference between D90 and D10 reduced gradually (Table 1). These changes suggest that the size distribution of alfalfa leaf is more concentrated, and the particle size is more uniform. As Table 1 shows, the D50 alfalfa leaf decreased significantly from 506.1 to 20.68 μm (p < 0.05), suggesting that the sieve could control the particle size distribution of alfalfa leaf, which is agreement with Bala’s findings [5]. Additionally, the VAPS of the alfalfa leaf increased significantly from 33.08 to 577.4 μm (p < 0.05). Zhang et al. [20] reported that the physicochemical and functional properties of tobacco leaf changed with its particle size. Therefore, the physicochemical and functional properties of G1, G2, G3, G4, and G5 were further studied in this study.
3.1.2. Bulk Density, Tap Density, and Compressibility
The bulk density, tap density, and compressibility of powder are important considerations in food processing and affect the packing, transportation, and processing of powder or food [21]. With decreases in the particle size of alfalfa leaf powder, its bulk density and tap density first decreased and then increased; the bulk density and tap density of G4 was the highest (0.32 mL/g and 0.42 mL/g, respectively) (Table 2). Relatively finer powder results in less space between the particles, contributing to higher bulk density and tap density [19]. Powders with too-small particle sizes would agglomerate due to electrostatic attraction, leading to a decrease in the bulk density and tap density [22]. He et al. [23] found that a smaller particle size of wheat bran powder displayed lower bulk density and tap density, where the average particle size ranged from 102.64 to 22.35 μm. However, Liang et al. [19] found that a smaller particle size of rice flour displayed higher bulk density and tap density, where the average particle size ranged from 330.3 to 54.7 μm. These opposite results may be attributed to the different materials, crushing methods, and crushing degree.
Compressibility reflects the flowability of powder, and higher compressibility means poorer flowability. As illustrated in Table 2, the compressibility values of G1, G2, G4, and G5 were higher than 16%, suggesting that the flowability of the alfalfa leaf was poor. With the decrease in the particle size of alfalfa leaf, the compressibility of the alfalfa leaf powder first decreased and then increased. The compressibility of G3 was the lowest (15.63%), indicating that the flowability of G3 was better than the other samples (Table 2). With the decrease in the particle size of alfalfa leaf, the increasing sphericity of the particles and the decreasing friction resistance between the particles contributed to its better flowability. But the increasing cohesive force and electrostatic attraction resist flow, leading to worse flowability [24,25]. The balance between these two mechanisms provides a basis for the results of the flowability of alfalfa leaf powder in this study.
3.1.3. Solubility and Color
The solubility of powder affects its physicochemical properties, nutritional properties, and functional properties. With the decrease in the particle size of alfalfa leaf, the solubility increased from 24.15% to 29.09% (Table 3), indicating that decreasing the particle size of alfalfa leaf promotes the dissolution of water-soluble substances. Similar to our results, Bala et al. [26] also found that the solubility of grass pea flour increased from 9.7 to 19.58% as the particle sizes decreased from 179 to 74 μm. The increasing solubility can be attributed to the damage to the cells, leading to more leached substances (e.g., soluble proteins and carbohydrates).
Food color plays an important role in sensory evaluation and affects consumer acceptance [27]. As shown in Table 3, with the decrease in the particle size of alfalfa leaf, the L* value significantly increased from 55.48 to 60.80 (p < 0.05). The increasing L* value may be ascribed to the increasing surface area of alfalfa leaf, which produced more light reflection [19]. Drakos et al. [12] reported that the L* values of barley and rye increased with decreases in the particle size of their flours, which is good agreement with our findings. A higher L* value of alfalfa leaf is advantageous in terms of incorporating it into certain foods, leading to a higher appetite for it and a higher commodity value [27].
3.1.4. Transition Temperature and Melting Temperature
DSC is typically used to analyze the thermal properties of materials. Alfalfa leaf powder is a mixture of various nutrients, including 28.62% protein, 6.23% fat, 11.35% ash, and 50.27% dietary fiber [11]. Hence, there are chemical changes in alfalfa leaf as the temperature rises. As shown in Figure 2a, obvious endothermic peaks were observed at around 80 °C and 170 °C (Figure 2a), and according to Huang et al. [14], the two peak temperatures were defined as the transition temperature (TP1) and the melting temperature (TP2), respectively. It is quite possible that the thermal changes in the polysaccharide and protein in alfalfa leaf are responsible for the endothermic peaks of TP1, and the thermal decomposition of cellulose and hemicellulose of alfalfa leaf powder is responsible for the endothermic peaks of TP2 [14]. With the decrease in the particle size of alfalfa leaf, the TP1 and TP2 first decreased and then increased (Figure 2b). The TP1 and TP2 of G3 were the lowest (79.00 °C and 160.54 °C, respectively). Lapčíková et al. suggested that exposing more polysaccharide and protein and reducing the crystallinity index are responsible for the decreases in TP1 and TP2 [28]. However, at the same time, exposing more chemical groups enhances the interactions among molecules, and thus, greater energy is required to destroy the internal structure, contributing to the increases in TP1 and TP2. Compared to the thermal transition temperature of sugar beet pulp, the higher thermal transition temperature of alfalfa leaf could be ascribed to its higher protein content [14]. In summary, the TP1 and TP2 of G1, G2, G3, G4, and G5 were higher than 70 °C, indicating that alfalfa leaf powder is stable in storage and transportation at room temperature.
3.2. Functional Properties of Alfalfa Leaf Powder
3.2.1. Swelling Capacity
Food with a swell capacity can provide a sense of satiety and promote gastrointestinal motility, thus having the function of preventing obesity and colon cancer [29]. With the decrease in the particle size of alfalfa leaf, the SI first increased and then decreased. The SI of G3 was the largest (4.39 mL/g) (Figure 3). Based on the results of previous research, reducing the particle size of alfalfa leaf powder promoted the dissolution of its protein and polysaccharides [11]. In addition, Lapčíková et al. found that high contents of carbohydrates and proteins contributed to a stronger capacity for retaining water [28]. Thus, the SI increased with the decrease in the particle size of alfalfa leaf powder. But Auffret et al. found that excessive crushing might damage the fiber matrix and cause the collapse of pores, causing a decreased SI [30]. Similarly, structure collapse of the fiber matrix in alfalfa leaf powder was seen in our study (Figure 3). These results indicate that the SI of alfalfa leaf was not only related to the chemical group but also affected by its physical structure. Based on the analysis above, G3 exhibits a better capacity for preventing obesity and colon cancer.
3.2.2. Angiotensin-Converting Enzyme Inhibitory Activity
Angiotensin-converting enzymes (ACEs) participate in the renin angiotensin system by converting inactive angiotensin-I into active angiotensin-II, which activates inflammatory cascade in the vasculature [31]. Inhibiting the ACE activity and controlling the formation of angiotensin-II is an effective way to treat hypertension. As illustrated in Figure 4, G1, G2, G3, G4, and G5 all inhibited the ACE activity, suggesting that alfalfa leaf can alleviate hypertension to a certain degree. The extract of alfalfa leaf contains hydrophobic aromatic amino acids, and the residues alone or in combination could link to the active sites of ACEs, which is conducive to decreasing the ACE activity [32]. With the decrease in the particle size of alfalfa leaf, the ACE inhibitory activity significantly increased from 9.63% to 54.59% (p < 0.05). These results suggest that G5 is a more attractive option than the other samples for use as a nutraceutical or functional ingredient for the management and prevention of hypertension. Gammoh et al. [32] suggested that sonication enhanced the ACE inhibitory activity of camel milk casein due to the decreasing average particle size and the net negative surface charge of the casein particles. In addition, Lai et al. found that a decrease in the particle size of alfalfa leaf contributed to increased protein dissolution [11]. These reports are consistent with the results of our study. Overall, the results indicate that a decrease in the particle size of alfalfa leaf powder is conducive to inhibiting ACE activity.
3.2.3. Tyrosinase Inhibitory Activity
Tyrosinase contains copper and is distributed widely in plants and animals. It usually leads to an undesirable color of food or skin. Tyrosinase inhibitors have been adopted to prevent undesirable colors in the food industry and cosmetic industry. Especially inhibitors from natural sources are considered to have no side effects and are popular among consumers and the food industry. The tyrosinase inhibitory activity of alfalfa leaf was evaluated, and the results are shown in Figure 5. Compared to G1, G2, and G3, the tyrosinase inhibitory activity of G4 and G5 was higher, indicating that G4 and G5 could better prevent enzymatic browning and protect color in food. The changing trend of the curve reveals that the decrease in the particle size of alfalfa leaf powder improved the tyrosinase inhibitory activity. Fan et al. [33] proved that flavonoids possess a tyrosinase inhibition ability. Fan et al. [33] also found that the hydroxy groups of flavonoids could interact with the active cavity of tyrosinase by forming a hydrogen bond. This interaction not only blocks substrate access but also realizes the direct interaction with the amino acid residues of active sites [33]. Moreover, Lai et al. suggested that the decrease in the particle size of alfalfa leaf powder enhanced the dissolution of flavonoids [11], which could be responsible for increasing the tyrosinase inhibitory activity. Therefore, the decrease in the particle size of alfalfa leaf powder is also conducive to inhibiting tyrosinase activity.
3.3. Structural Properties of Alfalfa Leaf Powder
3.3.1. Surface Micromorphology
The superficial microstructure reflects the surface structure of particles intuitively, and scanning electron microscopy is usually used to observe it. The surface of alfalfa leaf powder was magnified by a scanning electron microscope, and the results are shown in Figure 6. It can be seen in Figure 6a–e that the particle size of alfalfa leaf powder decreased, which is consistent with the results of the particle size distribution. Figure 6f shows that numerous fine particles were attached to the surface of G1. The fine particles may be the exposing macromolecular substances (fiber or starch cluster) after the cell structure was damaged. By comparing Figure 6f–j, it can be seen that the surface of G1 was relatively complete and smooth. Part of the surface of G2 was destroyed and looked rough, although a few smooth structures can still be seen. The surfaces of G3 and G4 were further damaged, and their surface roughness increased. The surface structure of G5 was seriously damaged, and some small particles were adsorbed on the surface of the larger particles. With the decrease in the particle size of alfalfa leaf, the increasingly damaged surface enhanced the dissolution of certain nutrients, which is consistent with the results of the solubility, ACE, and tyrosinase inhibitory activity in our study. Moreover, the agglomeration resulted in poor flowability of the alfalfa leaf, which is consistent with the results of compressibility in our study [22]. The damaged surface structure also provided evidence for the decreasing SI when the particle size was less than a certain degree, which is in agreement with Auffret’s report [30].
3.3.2. Functional Group
Fourier transform near-infrared spectroscopy (FTIR) was used to reflect the functional groups of the alfalfa leaf powder. The position of the absorption peak in the infrared spectrum indicates the type of functional group, and the height of the absorption peak indicates the number of functional groups. The FTIR results of the alfalfa leaf powder are shown in Figure 7. The positions of the G1, G2, G3, G4, and G5 absorption peaks are similar, and the intensities of their absorption peaks are varied. These results indicate that the types of functional groups were unchanged, but the number of functional groups changed. Based on the above analysis, the decreases in the particle size of the alfalfa leaf powder only involved physical changes. A strong and broad absorption peak at 3300–3500 cm−1 is caused by the O–H stretching vibration within or between cellulose and hemicellulose molecules [34]. The absorption peaks of G1, G2, G3, G4, and G5 were wide and strong at 3367.25 cm−1, indicating the presence of hydroxyl in alfalfa leaf. Moreover, the heights of the absorption peaks were different significantly among G1, G3, G4, and G5, but there was no significant difference between G1 and G2. With the decreases in the particle size of the alfalfa leaf powder, the number of hydroxyls on the surface increased, which is conducive to the formation of intermolecular hydrogen bonds [34]. According to Fan’s study, the increasing hydroxyls provide a theoretical basis for the tyrosinase inhibitory activity of alfalfa leaf in our study [33].
3.3.3. Crystal Structure
X-ray diffraction usually is used for analyzing crystal structures. The X-ray diffraction pattern and crystallinity index of the alfalfa leaf powder are shown in Figure 8. It can be seen in Figure 8a that there were strong diffraction peaks at 21.5° for G1, G2, G3, G4, and G5, indicating the presence of a (101) crystal plane of cellulose type I in the alfalfa leaf. The diffraction peaks of G1, G2, G3, and G4 appeared near 15.4° but did not occur for G5. The peak disappearing around 15.4° for G5 suggests that the (200) crystal plane structure of cellulose type I was destroyed [20,35]. The diffraction peaks of G1, G2, G3, and G4 appeared around 24.4° and 38.2° but did not occur for G5. Based on the above analysis, G5 has a different crystal structure from the other samples. The alfalfa leaf was subjected to shear, friction, and other forces in the crushing process, and the unstable crystallization zone was activated, leading to a changed crystal structure [36]. Meanwhile, the CIs of G1, G2, G4, and G5 were significantly different, but there was no significant difference between G2 and G3 (p < 0.05) (Figure 8b). With the decrease in the particle size of the alfalfa leaf powder, the CI decreased from 39.86% to 30.88%, indicating that the strength of the cellulose fiber was gradually reduced [37]. The decreasing CI in alfalfa leaf may be ascribed to the fact that part of the cellulose chain was broken by mechanical crushing, and the crystalline region was reduced [38]. Similar results in our previous research on wheat bran were reported [15]. The decrease in the CI indicates that the alfalfa leaf powder presented a looser structure, which is conducive to contact with other substances, and thus, the inhibitory effects on angiotensin-converting enzymes and tyrosinase were enhanced.
3.4. Analysis of Correlation and Principal Components
3.4.1. Correlation Analysis
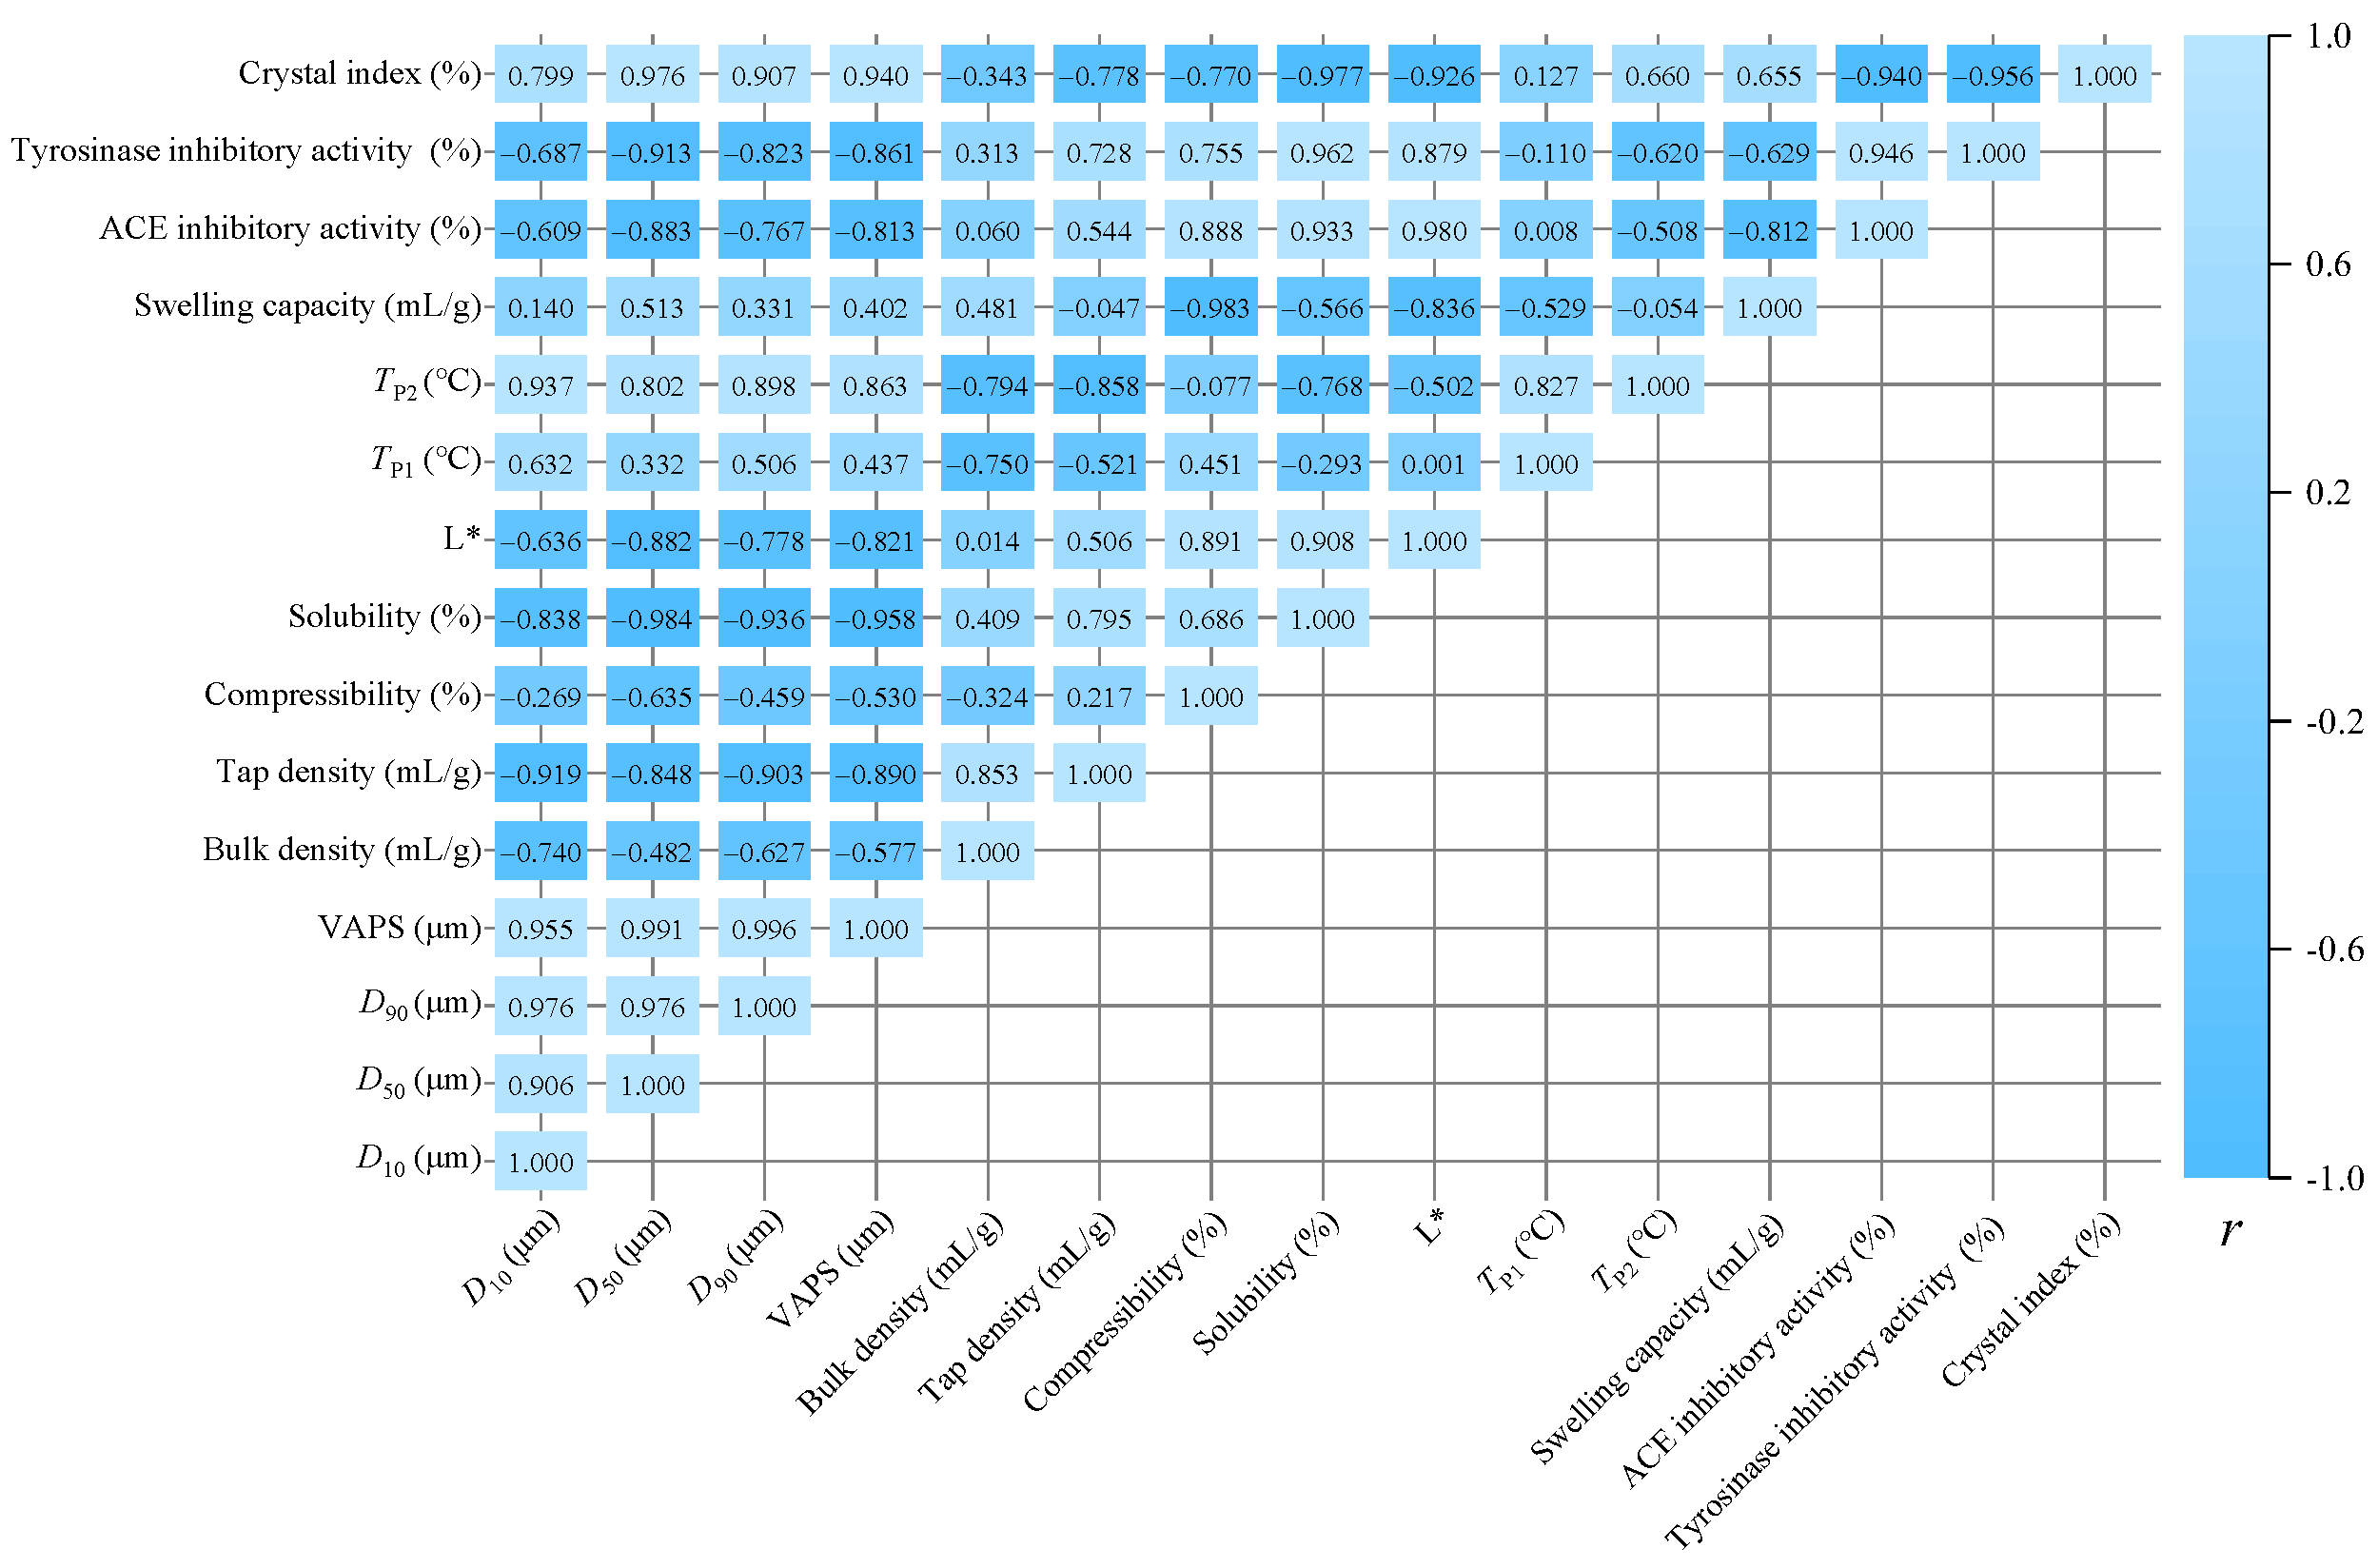
To explore the correlation among the physicochemical, functional, and structural properties of alfalfa leaf, the Pearson analysis method was used for correlation analysis. As illustrated in Figure 9, the D50 was significantly positively correlated with the VAPS (r = −0.991, p < 0.01) and CI (r = 0.976, p < 0.01). The D50 was significantly negatively correlated with the solubility (r = −0.984, p < 0.01), L* value (r = −0.882, p < 0.05), angiotensin-converting enzyme inhibitory activity (r = −0.883, p < 0.05), and tyrosinase inhibitory activity (r = −0.913, p < 0.05). Additionally, there were strong correlations between the swelling capacity and compressibility, the tap density and Tp2, and among other properties. If all collinear indicators are included in the evaluation method, it is hard to accurately describe the relationships among the indicators. Therefore, principal component analysis (PCA) was applied to reduce the dimensions of the original data.
3.4.2. Principal Component Analysis
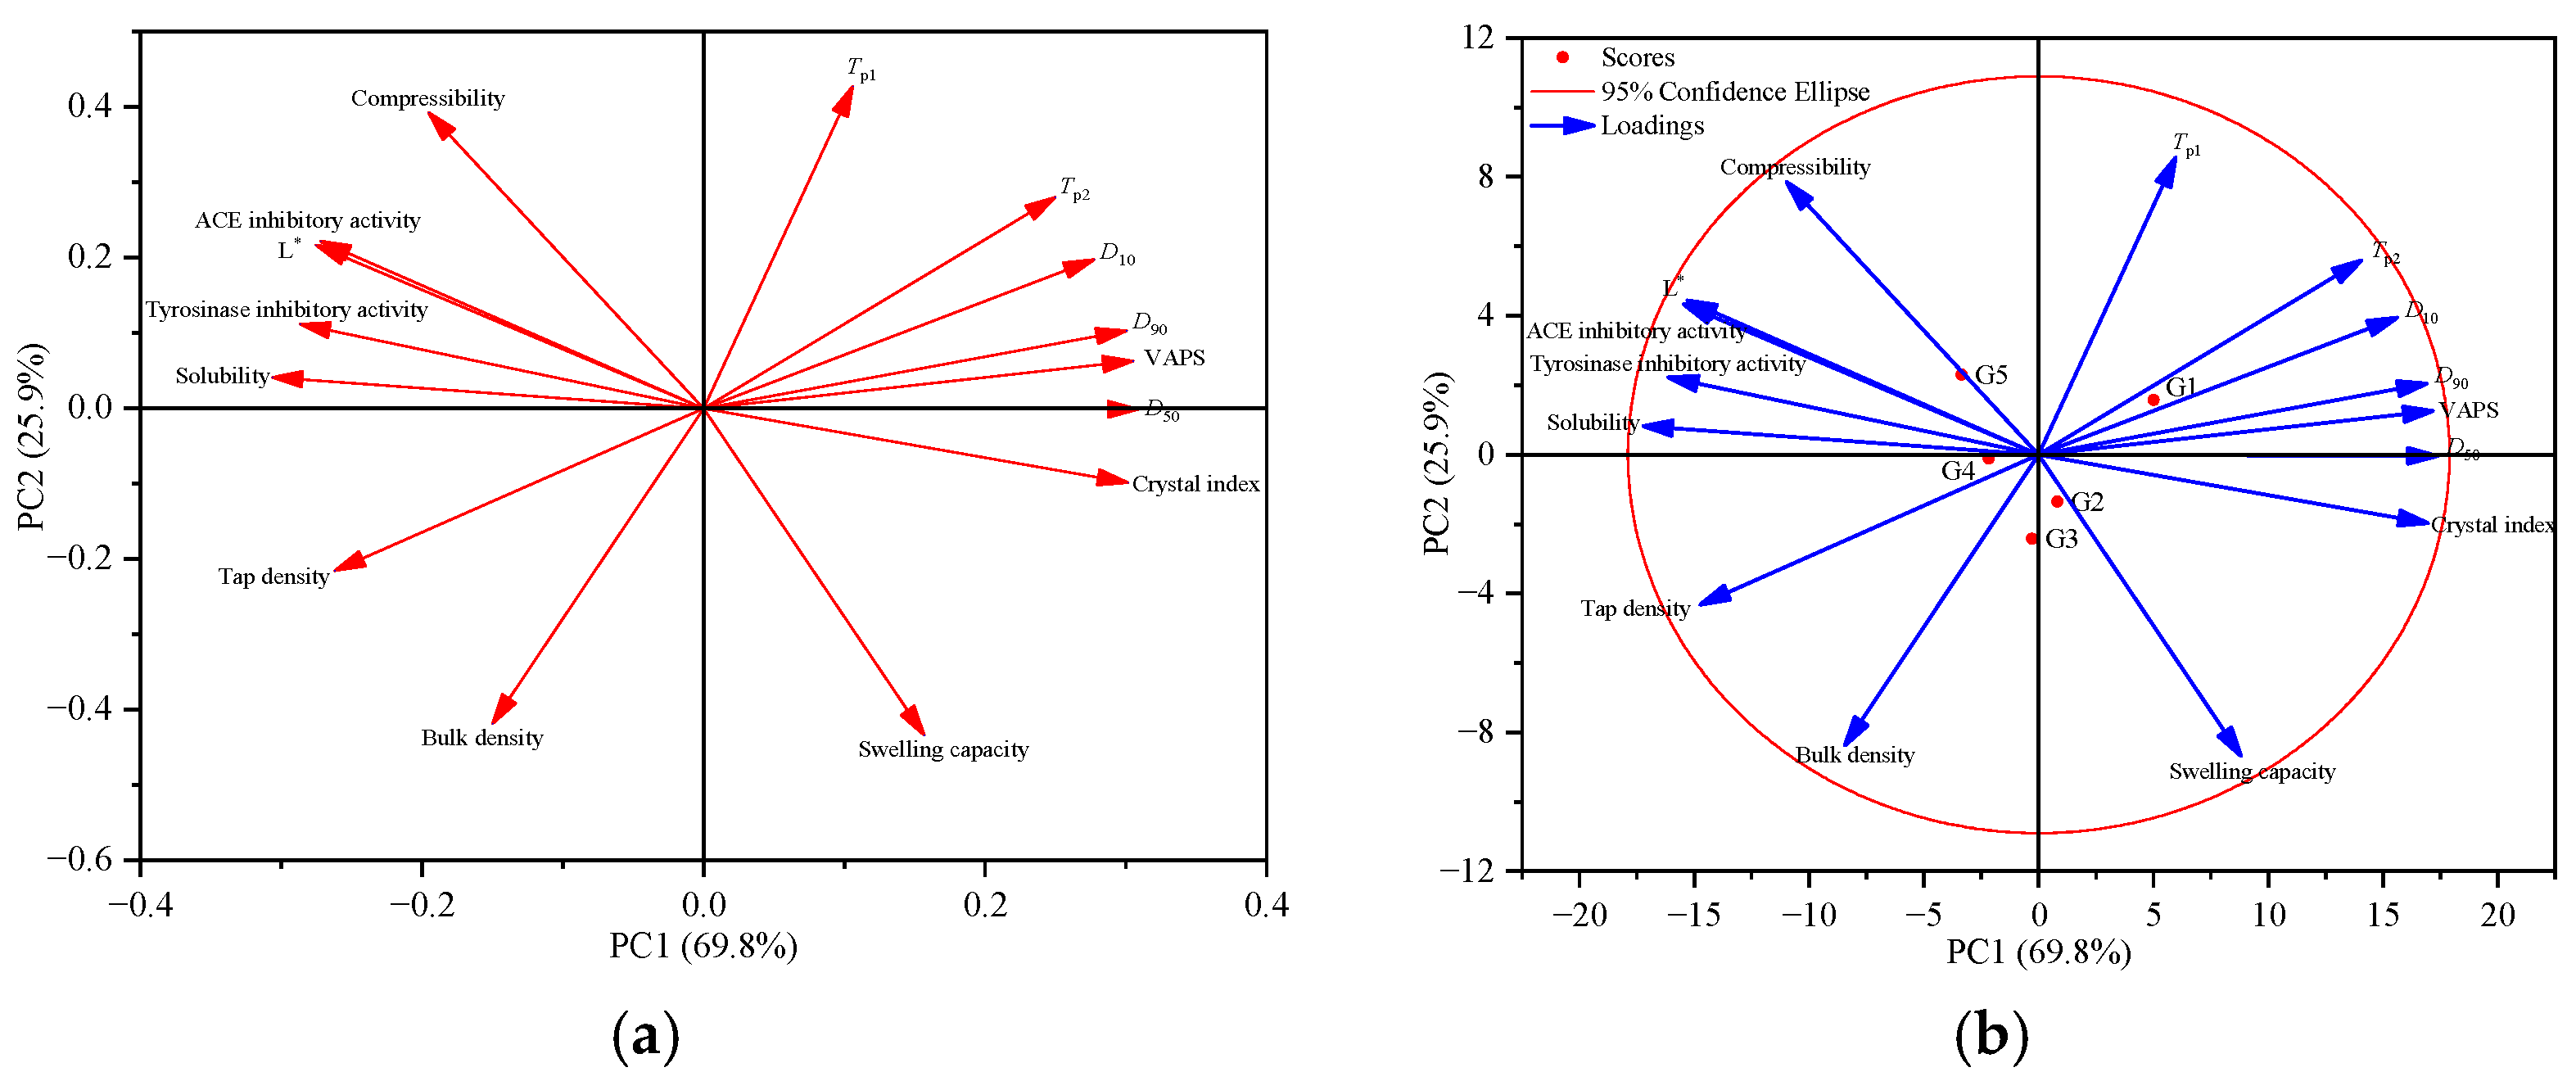
The results of the PCA are shown in Table 4 and Table 5 and Figure 10. Based on the criterion of the dimensionality reduction analysis where the cumulative contribution rate exceeded 85% and the eigenvalue was larger than 1, the principal component was chosen [39]. As shown in Table 4, the contribution rate of PC 1 was 69.79%, the contribution rate of PC 2 was 25.90%, and the cumulative contribution rate of the first two principal components was 95.69%, which surpassed 85%. Additionally, the eigenvalues of PC 1 and PC 2 were larger than 1. Thus, PC 1 and PC 2 were extracted to represent most of the information on the properties of alfalfa leaf. In the component matrix, the absolute value of the variable reflects the contribution of each indicator to the principal component [39]. As shown in Table 5, the D10, D50, D90, VAPS, compressibility, solubility, L*, ACE inhibitory activity, tyrosinase inhibitory activity, and crystal index mainly reflect PC1. PC1 mainly reflects the indicators that were positively or negatively correlated with the particle size. The bulk density, compressibility TP1, TP2, and swelling capacity mainly reflect PC2. PC2 mainly reflects the indicators that were incompletely affected by the physical size of the particles. In the loading plot (Figure 10a), the properties display distinct spatial orientations. In the biplot (Figure 10b), there is not a noticeable clustering amongst the alfalfa leaf powders. These results suggest that the decrease in the particle size of the alfalfa leaf powder induced changes in the physicochemical, functional, and structural properties of the alfalfa leaf. These results are consistent with those obtained by correlation analysis.
4. Conclusions
In this study, the effects of the particle size distribution on the physicochemical, functional, and structural properties of alfalfa leaf powder were investigated. Alfalfa leaf powders with average particle sizes of 506.1, 246.3, 209.8, 92.01, and 20.68 μm were prepared and recorded as G1, G2, G3, G4, and G5, respectively. The alfalfa leaf powder with an average particle size of 209.8 μm exhibited a higher bulk density and swelling capacity and a lower compressibility, transition temperature, and melting temperature. The alfalfa leaf powder with an average particle size of 20.68 μm presented better solubility, lightness, and inhibition on angiotensin-converting enzymes and tyrosinase. And it displayed a higher surface roughness and an existing agglomeration phenomenon. Furthermore, it showed a lower crystallinity index and a larger number of surface hydroxyls. Specifically, the positions of the G1, G2, G3, G4, and G5 absorption peaks were similar, suggesting that the type of surface functional groups was unchanged. The microstructure of alfalfa leaf can provide an explanation for the trends in its physicochemical and functional properties. Based on the results of the correlation analysis and principal component analysis, it can be concluded that the particle size significantly affects the physicochemical and functional properties of alfalfa leaf. These results suggest that alfalfa leaves with an average particle size of 209.8 μm lead to a better sense of satiety, and alfalfa leaves with an average particle size of 20.68 μm are easily digested, which can better treat hypertension and maintain the color of food. In future research, the quality of alfalfa products will be considered to optimize the particle size of alfalfa powder.
Author Contributions
Conceptualization, methodology, investigation, data curation, writing—original draft, and writing—review and editing, S.L.; methodology, investigation, and data curation, S.L.; data curation, R.L.; investigation, Y.N.; conceptualization, funding acquisition, and project administration, Q.C. and Y.S. All authors have read and agreed to the published version of the manuscript.
Funding
This research was financially supported by grants from the Fundamental Research Program of Shanxi Province, China (202303021222237); Doctoral Scientific Research Start-up Funding of Shanxi Province, China (QZX-2023040); the Application Research Project of Yuncheng University, China (YY-202301); the National Natural Science Foundation of China (32072222); and the Key Discipline Project for Food Science and Engineering of Yuncheng University (XK-2021016).
Institutional Review Board Statement
Not applicable.
Data Availability Statement
The data are available upon request to the corresponding author.
Acknowledgments
We sincerely thank the forage practice teaching base of Shanxi Agricultural University (Shanxi, China) for providing the alfalfa, and the Basic Department (Shanxi Agricultural University) for providing the analytical chemistry laboratory.
Conflicts of Interest
The authors declare no conflicts of interest.
References
- Hadidi, M.; Rostamabadi, H.; Moreno, A.; Jafari, S.M. Nanoencapsulation of essential oils from industrial hemp (Cannabis sativa L.) by-products into alfalfa protein nanoparticles. Food Chem. 2022, 386, 132765. [Google Scholar] [CrossRef] [PubMed]
- Delannoy-Bruno, O.; Desai, C.; Raman, A.S.; Chen, R.Y.; Gordon, J.I. Evaluating microbiome-directed fibre snacks in gnotobiotic mice and humans. Nature 2021, 595, 91–94. [Google Scholar] [CrossRef] [PubMed]
- Zhao, L.; Zhang, F.; Ding, X.; Wu, G.; Lam, Y.; Wang, X. Gut bacteria selectively promoted by dietary fibers alleviate type 2 diabetes. Science 2018, 359, 1151–1156. [Google Scholar] [CrossRef] [PubMed]
- Fazmiya, M.J.A.; Sultana, A.; Rahman, K.; Heyat, M.B.B.; Akhtar, F.; Khan, S.; Appiah, S.C.Y. Current insights on bioactive molecules, antioxidant, anti-inflammatory, and other pharmacological activities of Cinnamomum camphora Linn. Oxid. Med. Cell. Longev. 2022, 2022, 9354555. [Google Scholar] [CrossRef] [PubMed]
- Hadidi, M.; Palacios, J.C.O.; McClements, D.J.; Mahfouzi, M.; Moreno, A. Alfalfa as a sustainable source of plant-based food proteins. Trends Food Sci. Technol. 2023, 135, 202–214. [Google Scholar] [CrossRef]
- Augustin, M.A.; Cole, M.B. Towards a sustainable food system by design using faba bean protein as an example. Trends Food Sci. Technol. 2022, 125, 1–11. [Google Scholar] [CrossRef]
- Hu, H.; Zhou, X.Y.; Wang, Y.S.; Zhang, Y.X.; Zhou, W.H.; Zhang, L. Effects of particle size on the structure, cooking quality and anthocyanin diffusion of purple sweet potato noodles. Food Chem. 2023, 18, 100672. [Google Scholar] [CrossRef] [PubMed]
- Troilo, M.; Difonzo, G.; Paradiso, V.M.; Pasqualone, A.; Caponio, F. Grape pomace as innovative flour for the formulation of functional muffins: How particle size affects the nutritional, textural and sensory properties. Foods 2022, 11, 1799. [Google Scholar] [CrossRef] [PubMed]
- Liu, H.; Duan, J.; Zhu, J.; Liu, X. Effects of highland barley flour with different particle sizes on the characteristics of reconstituted flour and noodles. Foods 2023, 12, 1074. [Google Scholar] [CrossRef]
- Lai, S.; Liu, J.; Zhang, Y.; Wang, Y.; Li, G.; Cui, Q. Effects of wheat bran micronization on the quality of reconstituted whole-wheat flour and its cooked noodles. Processes 2022, 10, 1001. [Google Scholar] [CrossRef]
- Lai, S.; Cui, Q.; Liu, J.; Liu, J.; Sun, D. Determination and analysis of functional characteristics of alfalfa stems and leaves. Food Sci. 2020, 41, 6. (In Chinese) [Google Scholar]
- Drakos, A.; Kyriakakis, G.; Evageliou, V.; Protonotariou, S.; Mandala, I.; Ritzoulis, C. Influence of jet milling and particle size on the composition, physicochemical and mechanical properties of barley and rye flours. Food Chem. 2017, 215, 326–332. [Google Scholar] [CrossRef] [PubMed]
- Kanatt, S.R. Irradiation as a tool for modifying tapioca starch and development of an active food packaging film with irradiated starch. Radiat. Phys. Chem. 2020, 173, 108873. [Google Scholar] [CrossRef]
- Huang, X.; Dou, J.Y.; Li, D.; Wang, L.J. Effects of superfine grinding on properties of sugar beet pulp powders. LWT 2018, 87, 203–209. [Google Scholar] [CrossRef]
- Lai, S.; Chen, Z.; Zhang, Y.; Li, G.; Wang, Y.; Cui, Q. Micronization effects on structural, functional, and antioxidant properties of wheat bran. Foods 2022, 12, 98. [Google Scholar] [CrossRef] [PubMed]
- Rodríguez-Hernández, G.; Rentería-Monterrubio, A.L.; Gutiérrez-Méndez, N.; Ortega-Gutiérrez, J.A.; Santellano-Estrada, E.; Rojas-González, S.; Chávez-Martínez, A. Effect of probiotic cultures on the angiotensin converting enzyme inhibitory activity of whey-based fermented beverages. J. Food Sci. Technol. 2020, 57, 3731–3738. [Google Scholar] [CrossRef] [PubMed]
- Lu, H.; Yang, K.; Zhan, L.; Lu, T.; Chen, X.; Cai, X.; Zhou, C.; Li, H.; Qian, L.; Lv, G.; et al. Optimization of flavonoid extraction in Dendrobium officinale leaves and their inhibitory effects on tyrosinase activity. Int. J. Anal. 2019, 2019, 7849198. [Google Scholar] [CrossRef] [PubMed]
- Zhang, Y.; Xiao, W.; Ji, G.; Chen, X.; Han, L.; Gao, C. Effects on physicochemical properties of black tea by mechanical superfine and general grinding. T. Chinese Soc. Agric. Eng. 2016, 41, 1670–1677. (In Chinese) [Google Scholar]
- Liang, K.; Zhu, H.; Zhang, Y. Effect of mechanical grinding on the physicochemical, structural, and functional properties of foxtail millet (Setaria italica (L.) P. Beauv) bran powder. Foods 2022, 11, 2688. [Google Scholar] [CrossRef]
- Zhang, Y.; Li, R.; Shang, G.; Zhu, H. Mechanical grinding alters physicochemical, structural, and functional properties of tobacco (Nicotiana tabacum L.) leaf powders. Ind. Crop Prod. 2021, 173, 114149. [Google Scholar] [CrossRef]
- Ding, H.; Li, B.; Boiarkina, I.; Wilson, D.I.; Yu, W.; Young, B.R. Effects of morphology on the bulk density of instant whole milk powder. Foods 2020, 9, 1024. [Google Scholar] [CrossRef] [PubMed]
- Rayo, L.M.; Carvalho, L.C.; Sardá, F.A.; Dacanal, G.C.; Menezes, E.W.; Tadini, C.C. Production of instant green banana flour (Musa cavendischii, var. Nanicão) by a pulsed-fluidized bed agglomeration. LWT Food Sci. Technol. 2015, 63, 461–469. [Google Scholar] [CrossRef]
- He, S.; Li, J.; He, Q.; Jian, H.; Zhang, Y.; Wang, J.; Sun, H. Physicochemical and antioxidant properties of hard white winter wheat (Triticum aestivm L.) bran superfine powder produced by eccentric vibratory milling. Powder Technol. 2018, 325, 126–133. [Google Scholar] [CrossRef]
- Savlak, N.; Türker, B.; Yeşilkanat, N. Effects of particle size distribution on some physical, chemical and functional properties of unripe banana flour. Food Chem. 2016, 213, 180–186. [Google Scholar] [CrossRef]
- Liu, Z.; Muzzio, F.J.; Callegari, G. Powder property change after passing through a feeder: The effect of electrostatics on powder flow. Powder Technol. 2023, 425, 118532. [Google Scholar] [CrossRef]
- Bala, M.; Handa, S.; Mridula, D.; Singh, R.K. Physicochemical, functional and rheological properties of grass pea (Lathyrus sativus L.) flour as influenced by particle size. Heliyon 2020, 6, e05471. [Google Scholar] [CrossRef] [PubMed]
- Xia, X.; Li, F.; Ran, H.; Zhao, J.; Lei, X.; Lei, L.; Xiao, G.; Ming, J. Effect of jujube kernel powder addition on moisture absorption performance, color stability, texture properties and agglomeration characteristics of jujube powder. LWT 2023, 174, 114452. [Google Scholar] [CrossRef]
- Lapčíková, B.; Lapčík, L.; Valenta, T.; Majar, P.; Ondroušková, K. Effect of the rice flour particle size and variety type on water holding capacity and water diffusivity in aqueous dispersions. LWT 2021, 142, 111082. [Google Scholar] [CrossRef]
- Zhu, R.; Tan, S.; Wang, Y.; Zhang, L.; Huang, L. Physicochemical properties and hypolipidemic activity of dietary fiber from rice bran meal obtained by three oil-production methods. Foods 2023, 12, 3695. [Google Scholar] [CrossRef]
- Auffret, A.; Ralet, M.C.; Guillon, F.; Barry, J.L.; Thibault, J.F. Effect of grinding and experimental conditions on the measurement of hydration properties of dietary fibres. LWT Food Sci. Technol. 1994, 27, 166–172. [Google Scholar] [CrossRef]
- Ambigaipalan, P.; Shahidi, F. Bioactive peptides from shrimp shell processing discards: Antioxidant and biological activities. J. Funct. Foods 2017, 34, 7–17. [Google Scholar] [CrossRef]
- Gammoh, S.; Alu’datt, M.H.; Tranchant, C.C.; Alhamad, M.N.; Rababah, T.; Kubow, S.; Haddain, M.; Ammari, Z.; Maghaydah, S.; Banat, H. Modification of the functional and bioactive properties of camel milk casein and whey proteins by ultrasonication and fermentation with Lactobacillus delbrueckii subsp. lactis. LWT 2020, 129, 109501. [Google Scholar] [CrossRef]
- Fan, M.; Ding, H.; Zhang, G.; Hu, X.; Gong, D. Relationships of dietary flavonoid structure with its tyrosinase inhibitory activity and affinity. LWT 2019, 107, 25–34. [Google Scholar] [CrossRef]
- Wu, L.; Dong, K.; Chu, W.; Hu, X. Effects of microwave modification on the structure and functional properties of oat bran dietary fiber. J. Chin. I. Food Sci. Technol. 2021, 21, 30–37. (In Chinese) [Google Scholar]
- Nishiyama, Y.; Langan, P.; Chanzy, H. Crystal structure and hydrogen-bonding system in cellulose Iβ from synchrotron X-ray and neutron fiber diffraction. J. Am. Chem. Soc. 2002, 124, 9074–9082. [Google Scholar] [CrossRef] [PubMed]
- Bhattacharyya, S.S.; Galerne, Y. Elongation of discotic liquid crystal strands and lubricant effects. ChemPhysChem 2014, 15, 1432–1446. [Google Scholar] [CrossRef] [PubMed]
- Lu, H.; Gui, Y.; Zheng, L.; Liu, X. Morphological, crystalline, thermal and physicochemical properties of cellulose nanocrystals obtained from sweet potato residue. Food Res. Int. 2013, 50, 121–128. [Google Scholar] [CrossRef]
- Ji, G.; Gao, C.; Xiao, W.; Han, L. Mechanical fragmentation of corncob at different plant scales: Impact and mechanism on microstructure features and enzymatic hydrolysis. Bioresour. Technol. 2016, 205, 159–165. [Google Scholar] [CrossRef]
- Hu, G.; Li, X.; Lai, A.; Liu, Y.; Zhang, Y.; Wang, J.; Sun, S.; Zhu, J.; Yang, M. Comparative analysis of the nutritional quality of Zizania latifolia cultivars harvested in different growing seasons. Foods 2024, 13, 30. [Google Scholar] [CrossRef]
Figure 1.
Particle size distribution patterns of alfalfa leaf. G1, G2, G3, G4, and G5 are the alfalfa leaf powders on sieve surfaces with specific side lengths of 0.200, 0.160, 0.125, 0.080, and 0.063 mm, respectively.
Figure 1.
Particle size distribution patterns of alfalfa leaf. G1, G2, G3, G4, and G5 are the alfalfa leaf powders on sieve surfaces with specific side lengths of 0.200, 0.160, 0.125, 0.080, and 0.063 mm, respectively.

Figure 2.
Heat flow curves (a), transition temperature (b), and transition temperature (b) of alfalfa leaf. Tp1 refers to the transition temperature, and Tp2 refers to the melting temperature. G1, G2, G3, G4, and G5 are the alfalfa leaf powders on sieve surfaces with specific side lengths of 0.200, 0.160, 0.125, 0.080, and 0.063 mm, respectively. Different letters on the same indicators indicate significant differences (p < 0.05).

Figure 3.
Swelling capacity of alfalfa leaf. G1, G2, G3, G4, and G5 are the alfalfa leaf powders on sieve surfaces with specific side lengths of 0.200, 0.160, 0.125, 0.080, and 0.063 mm, respectively. Different letters on the same indicators indicate significant differences (p < 0.05).
Figure 3.
Swelling capacity of alfalfa leaf. G1, G2, G3, G4, and G5 are the alfalfa leaf powders on sieve surfaces with specific side lengths of 0.200, 0.160, 0.125, 0.080, and 0.063 mm, respectively. Different letters on the same indicators indicate significant differences (p < 0.05).

Figure 4.
Angiotensin-converting enzyme inhibitory activity of alfalfa leaf. G1, G2, G3, G4, and G5 are the alfalfa leaf powders on sieve surfaces with specific side lengths of 0.200, 0.160, 0.125, 0.080, and 0.063 mm, respectively. ACE stands for angiotensin-converting enzyme. Different letters on the same indicators indicate significant differences (p < 0.05).

Figure 5.
Tyrosinase inhibitory activity of alfalfa leaf powder. G1, G2, G3, G4, and G5 are the alfalfa leaf powders on sieve surfaces with specific side lengths of 0.200, 0.160, 0.125, 0.080, and 0.063 mm, respectively.
Figure 5.
Tyrosinase inhibitory activity of alfalfa leaf powder. G1, G2, G3, G4, and G5 are the alfalfa leaf powders on sieve surfaces with specific side lengths of 0.200, 0.160, 0.125, 0.080, and 0.063 mm, respectively.

Figure 6.
Surface micromorphology of alfalfa leaf. (a–d) G1, G2, G3, and G4, respectively, magnified 60 times; (e) G5, magnified 500 times; (f–j) G1, G2, G3, G4, and G5, respectively, magnified 1000 times. G1, G2, G3, G4, and G5 are the alfalfa leaf powders on sieve surfaces with specific side lengths of 0.200, 0.160, 0.125, 0.080, and 0.063 mm, respectively.

Figure 7.
Fourier transform near-infrared spectroscopy of alfalfa leaf. G1, G2, G3, G4, and G5 are the alfalfa leaf powders on sieve surfaces with specific side lengths of 0.200, 0.160, 0.125, 0.080, and 0.063 mm, respectively.
Figure 7.
Fourier transform near-infrared spectroscopy of alfalfa leaf. G1, G2, G3, G4, and G5 are the alfalfa leaf powders on sieve surfaces with specific side lengths of 0.200, 0.160, 0.125, 0.080, and 0.063 mm, respectively.

Figure 8.
X-ray diffraction pattern (a) and crystallinity index (b) of alfalfa leaf. G1, G2, G3, G4, and G5 are the alfalfa leaf powders on sieve surfaces with specific side lengths of 0.200, 0.160, 0.125, 0.080, and 0.063 mm, respectively. Different letters on the same indicators indicate significant differences (p < 0.05).

Figure 9.
Heatmap of correlation analysis among the physicochemical, functional, and structural properties of alfalfa leaf. r is the correlation coefficient. D10, D50, and D90 are the mean particle sizes at 10%, 50%, and 90% of the volume distribution, respectively. VAPS indicates the volume average particle size. Tp1 refers to the transition temperature, and Tp2 refers to the melting temperature. ACE indicates angiotensin-converting enzyme.

Figure 10.
Loading plot (a) and biplot (b) of the principal component analysis. G1, G2, G3, G4, and G5 are the alfalfa leaf powders on sieve surfaces with specific side lengths of 0.200, 0.160, 0.125, 0.080, and 0.063 mm, respectively. D10, D50, and D90 are the mean particle sizes at 10%, 50%, and 90% of the volume distribution, respectively. VAPS indicates the volume average particle size. Tp1 refers to the transition temperature, and Tp2 refers to the melting temperature. ACE indicates angiotensin-converting enzyme.


Table 1.
Particle size distribution of alfalfa leaf.
| Sample | D10 (μm) | D50 (μm) | D90 (μm) | VAPS (μm) |
|---|---|---|---|---|
| G1 | 86.85 ± 5.00 a | 506.1 ± 7.41 a | 1152 ± 24.19 a | 577.4 ± 6.56 a |
| G2 | 10.02 ± 1.32 b | 246.3 ± 5.74 b | 395.8 ± 5.31 b | 225.1 ± 7.90 b |
| G3 | 9.128 ± 0.36 b | 209.8 ± 3.55 c | 321.4 ± 8.51 c | 192.1 ± 7.72 c |
| G4 | 6.055 ± 0.48 c | 92.01 ± 2.95 d | 188.0 ± 8.44 d | 92.7 ± 5.50 d |
| G5 | 3.789 ± 0.36 d | 20.68 ± 1.80 e | 82.66 ± 3.62 e | 33.08 ± 7.11 e |
G1, G2, G3, G4, and G5 are the alfalfa leaf powders on sieve surfaces with specific side lengths of 0.200, 0.160, 0.125, 0.080, and 0.063 mm, respectively. D10, D50, and D90 are the mean particle sizes at 10%, 50%, and 90% of the volume distribution, respectively. VAPS indicates the volume average particle size. Different letters within the same column indicate significant differences (p < 0.05).
Table 2.
Bulk density, tap density, and compressibility of alfalfa leaf.
| Sample | Bulk Density (mL/g) | Tap Density (mL/g) | Compressibility (%) |
|---|---|---|---|
| G1 | 0.22 ± 0.02 b | 0.28 ± 0.02 c | 19.57 ± 1.85 c |
| G2 | 0.30 ± 0.02 a | 0.37 ± 0.02 b | 17.6 ± 1.47 cd |
| G3 | 0.32 ± 0.01 a | 0.38 ± 0.02 b | 15.63 ± 1.60 d |
| G4 | 0.32 ± 0.02 a | 0.42 ± 0.01 a | 24.93 ± 1.76 b |
| G5 | 0.25 ± 0.02 b | 0.37 ± 0.02 b | 32.50 ± 1.15 a |
G1, G2, G3, G4, and G5 are the alfalfa leaf powders on sieve surfaces with specific side lengths of 0.200, 0.160, 0.125, 0.080, and 0.063 mm, respectively. Different letters within the same column indicate significant differences (p < 0.05).
Table 3.
Solubility and color of alfalfa leaf.
| Sample | Solubility (%) | L* |
|---|---|---|
| G1 | 24.15 ± 0.34 e | 55.48 ± 0.17 d |
| G2 | 25.99 ± 0.39 d | 56.68 ± 0.27 c |
| G3 | 27.13 ± 0.32 c | 56.87 ± 0.07 c |
| G4 | 28.19 ± 0.42 b | 58.14 ± 0.29 b |
| G5 | 29.09 ± 0.36 a | 60.80 ± 0.96 a |
G1, G2, G3, G4, and G5 are the alfalfa leaf powders on sieve surfaces with specific side lengths of 0.200, 0.160, 0.125, 0.080, and 0.063 mm, respectively. Different letters within the same column indicate significant differences (p < 0.05).
Table 4.
Eigenvalue, contribution rate, and cumulative contribution rate of principal components.
| Principal Component | Eigenvalue | Contribution Rate (%) | Cumulative Contribution Rate (%) |
|---|---|---|---|
| 1 | 10.47 | 69.79 | 69.79 |
| 2 | 3.88 | 25.90 | 95.69 |
| 3 | 0.45 | 3.03 | 98.72 |
| 4 | 0.19 | 1.29 | 100 |
| 5 | 0 | 0 | 100 |
Table 5.
The loading of each variable in the principal components.
| Indicators | Component Matrix | |
|---|---|---|
| PC1 | PC2 | |
| D10 (μm) | 0.28 | 0.20 |
| D50 (μm) | 0.31 | 0 |
| D90 (μm) | 0.30 | 0.10 |
| APS (μm) | 0.31 | 0.06 |
| Bulk density (mL/g) | −0.15 | −0.42 |
| Tap density (mL/g) | −0.26 | −0.22 |
| Compressibility (%) | −0.20 | 0.39 |
| Solubility (%) | −0.31 | 0.04 |
| L* | −0.27 | 0.22 |
| TP1 (°C) | 0.11 | 0.43 |
| TP2 (°C) | 0.25 | 0.28 |
| Swelling capacity (mL/g) | 0.16 | −0.43 |
| ACE inhibitory activity (%) | −0.28 | 0.22 |
| Tyrosinase inhibitory activity (%) | −0.29 | 0.11 |
| Crystal index (%) | 0.30 | −0.10 |
D10, D50, and D90 are the mean particle sizes at 10%, 50%, and 90% of the volume distribution, respectively. VAPS indicates the volume average particle size. Tp1 refers to the transition temperature, and Tp2 refers to the melting temperature. ACE indicates angiotensin-converting enzyme.
Disclaimer/Publisher’s Note: The statements, opinions and data contained in all publications are solely those of the individual author(s) and contributor(s) and not of MDPI and/or the editor(s). MDPI and/or the editor(s) disclaim responsibility for any injury to people or property resulting from any ideas, methods, instructions or products referred to in the content. |
© 2024 by the authors. Licensee MDPI, Basel, Switzerland. This article is an open access article distributed under the terms and conditions of the Creative Commons Attribution (CC BY) license (https://creativecommons.org/licenses/by/4.0/).
Share and Cite
MDPI and ACS Style
Lai, S.; Cui, Q.; Sun, Y.; Liu, R.; Niu, Y. Effects of Particle Size Distribution on the Physicochemical, Functional, and Structural Properties of Alfalfa Leaf Powder. Agriculture 2024, 14, 634. https://doi.org/10.3390/agriculture14040634
AMA Style
Lai S, Cui Q, Sun Y, Liu R, Niu Y. Effects of Particle Size Distribution on the Physicochemical, Functional, and Structural Properties of Alfalfa Leaf Powder. Agriculture. 2024; 14(4):634. https://doi.org/10.3390/agriculture14040634
Chicago/Turabian StyleLai, Sitong, Qingliang Cui, Yuanlin Sun, Rui Liu, and Yajie Niu. 2024. "Effects of Particle Size Distribution on the Physicochemical, Functional, and Structural Properties of Alfalfa Leaf Powder" Agriculture 14, no. 4: 634. https://doi.org/10.3390/agriculture14040634
Note that from the first issue of 2016, this journal uses article numbers instead of page numbers. See further details here.