
Design and Test of Disturbed Fertilizer Strip-Ejection Device with Vertical Pendulum Bar Based on Discrete Element Method
Abstract
:1. Introduction
2. Materials and Methods
2.1. Overall DFSD Structure and Working Principle
2.1.1. Overall DFSD Structure
2.1.2. Working Principle
2.2. Design and Analysis of Key Components
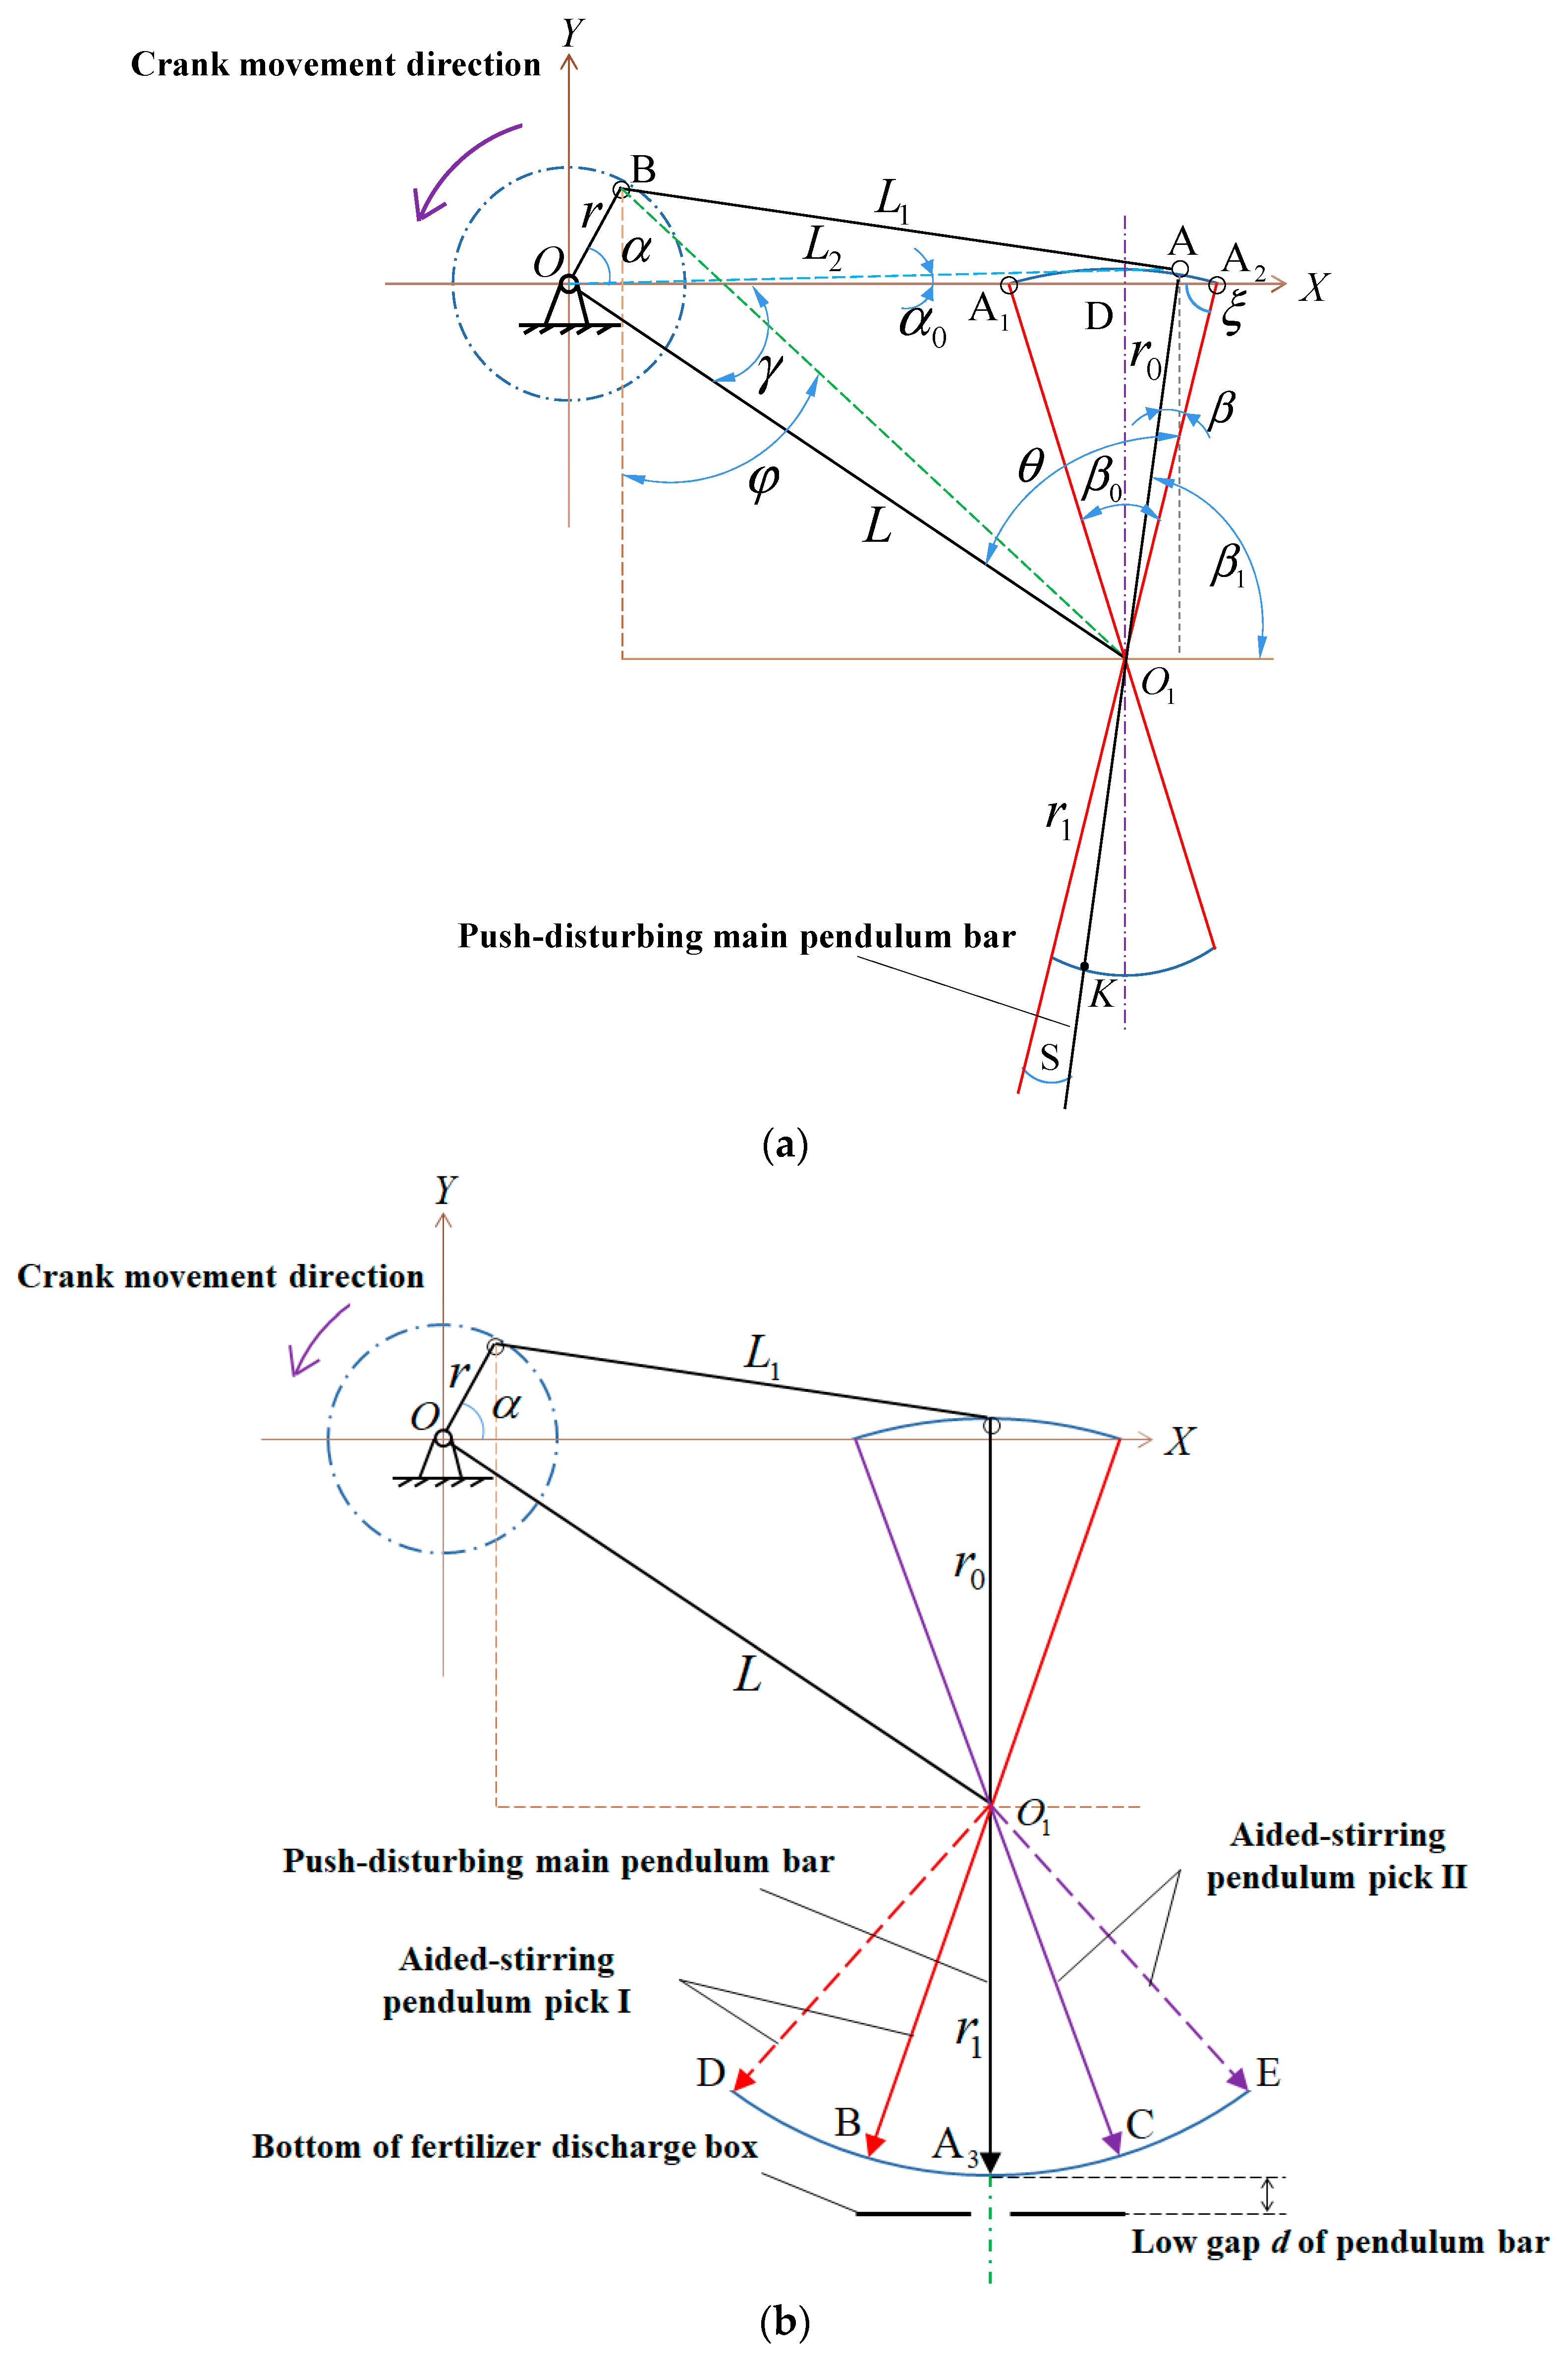
2.2.1. Analysis of SRC Motion
- Motion Analysis of PMPB
- 2.
- Motion Analysis of APP
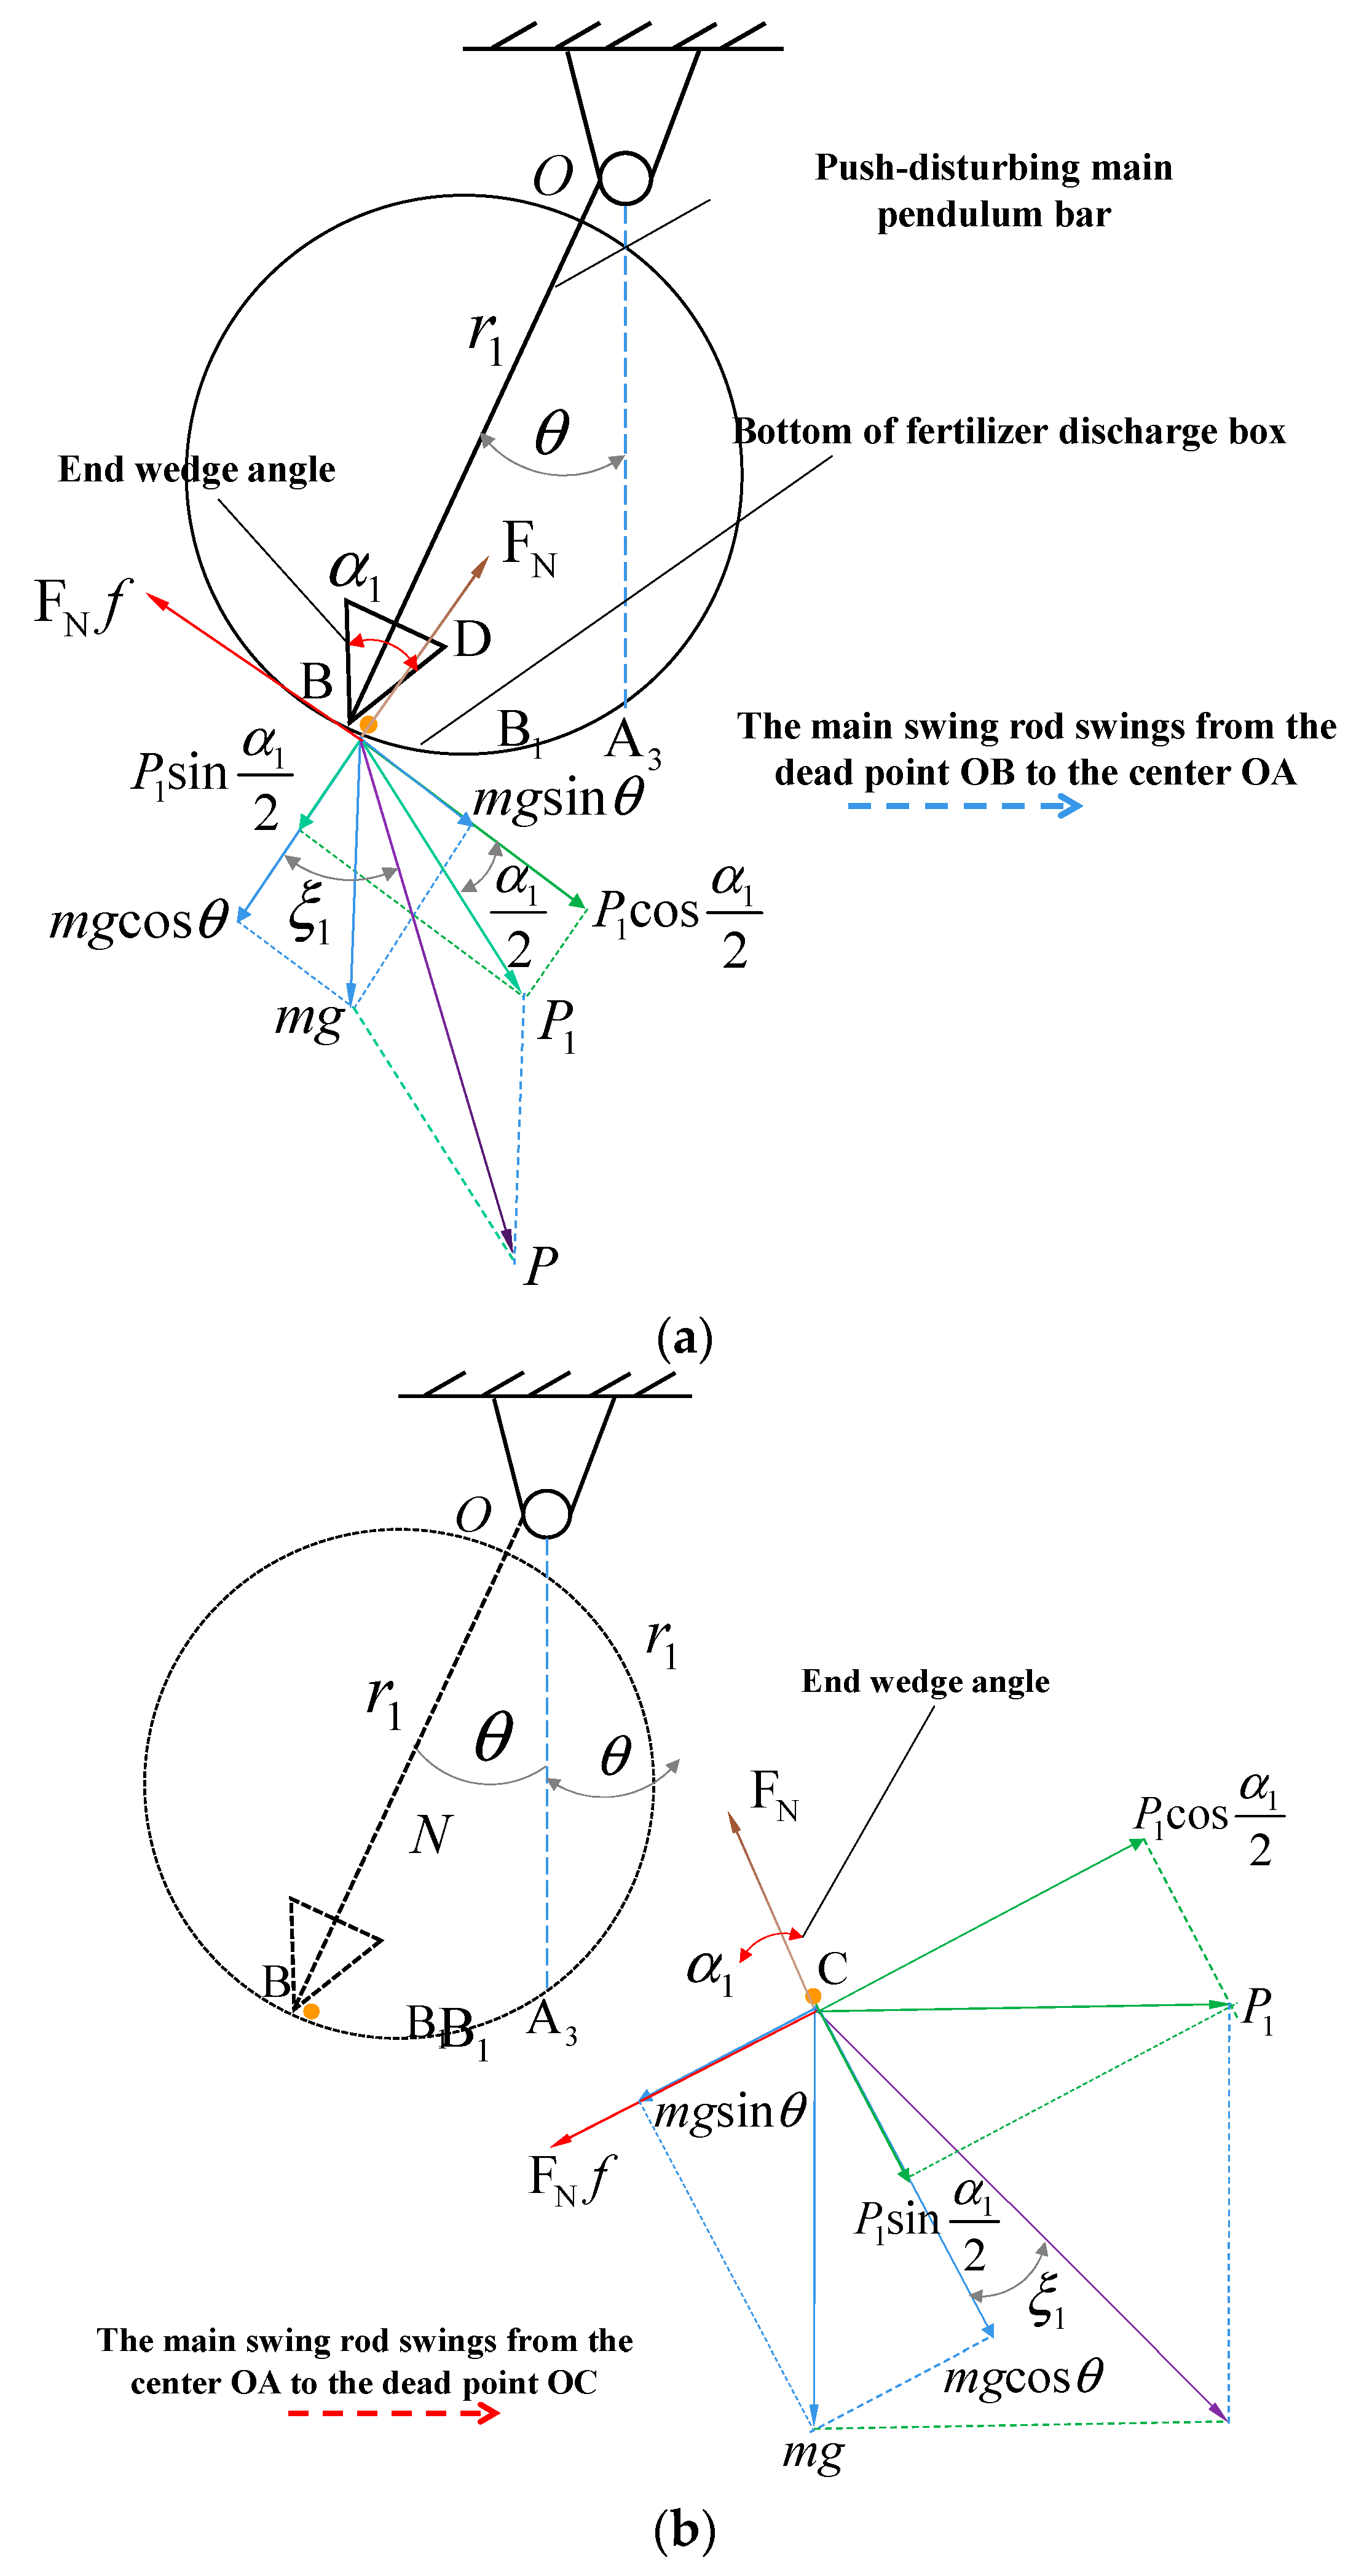
2.2.2. Mechanical Analysis of SRC
- Mechanical Analysis of PMPB
- 2.
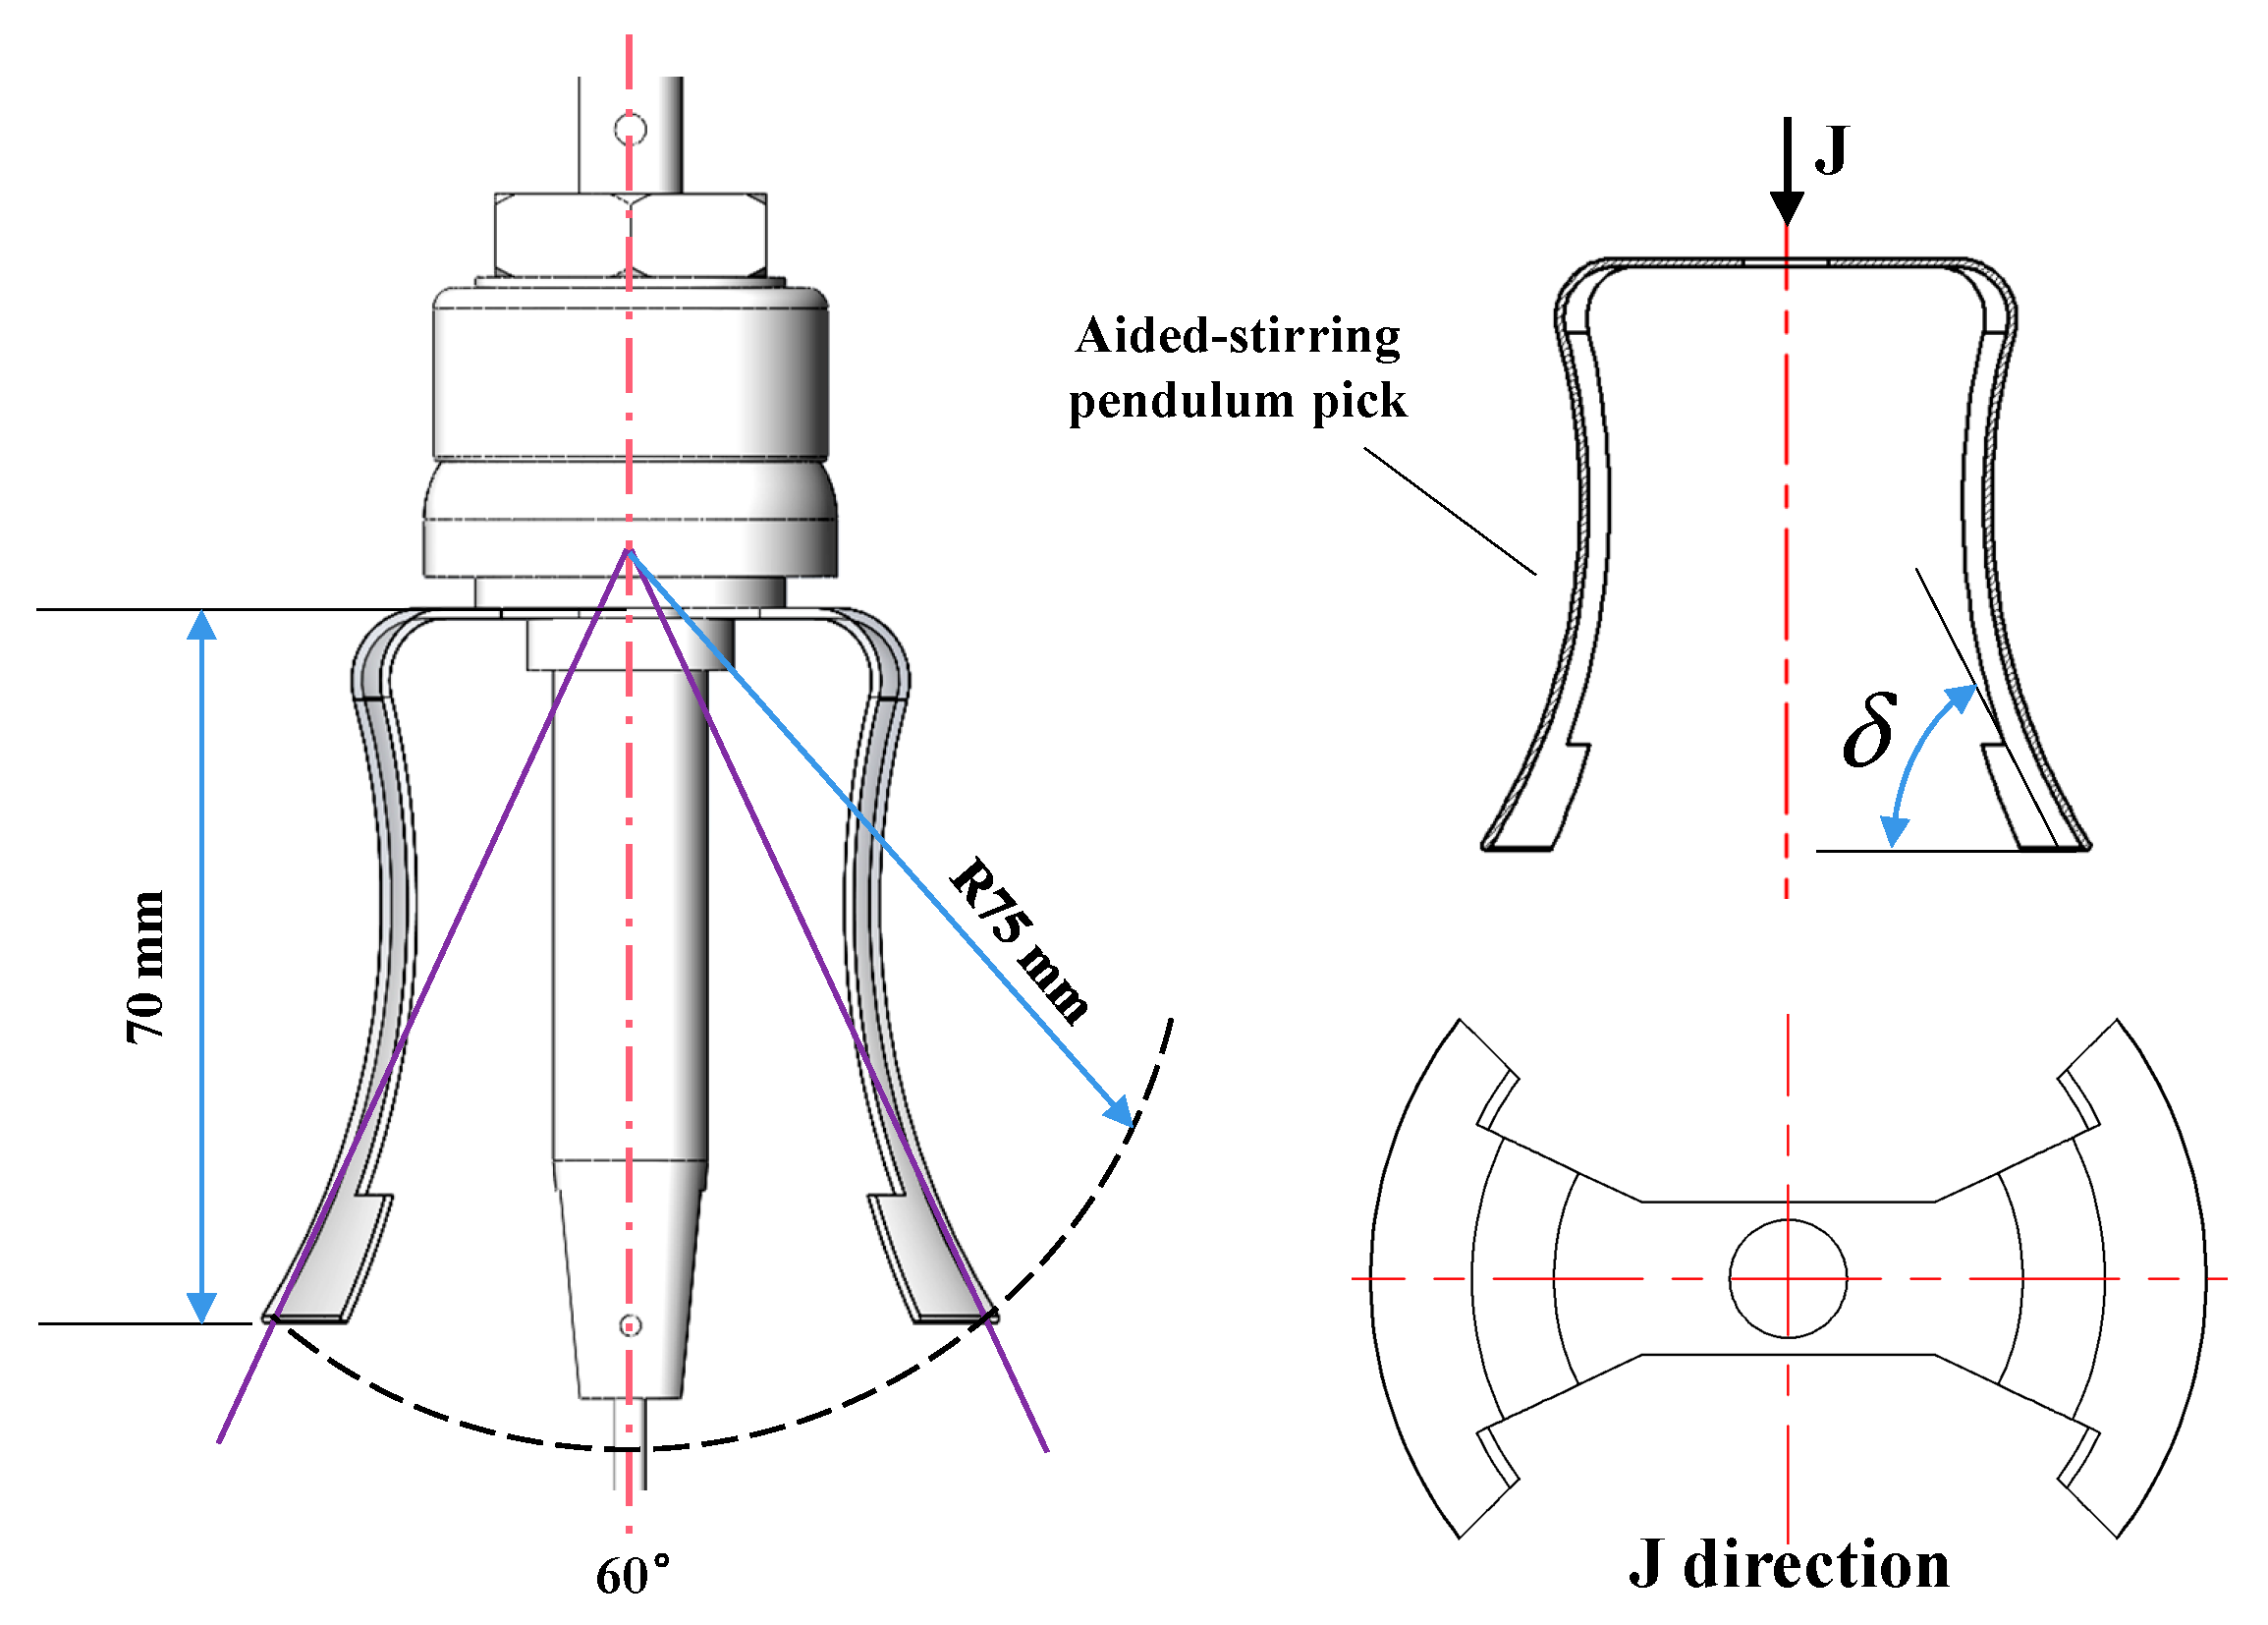
- Obliquity design of APP
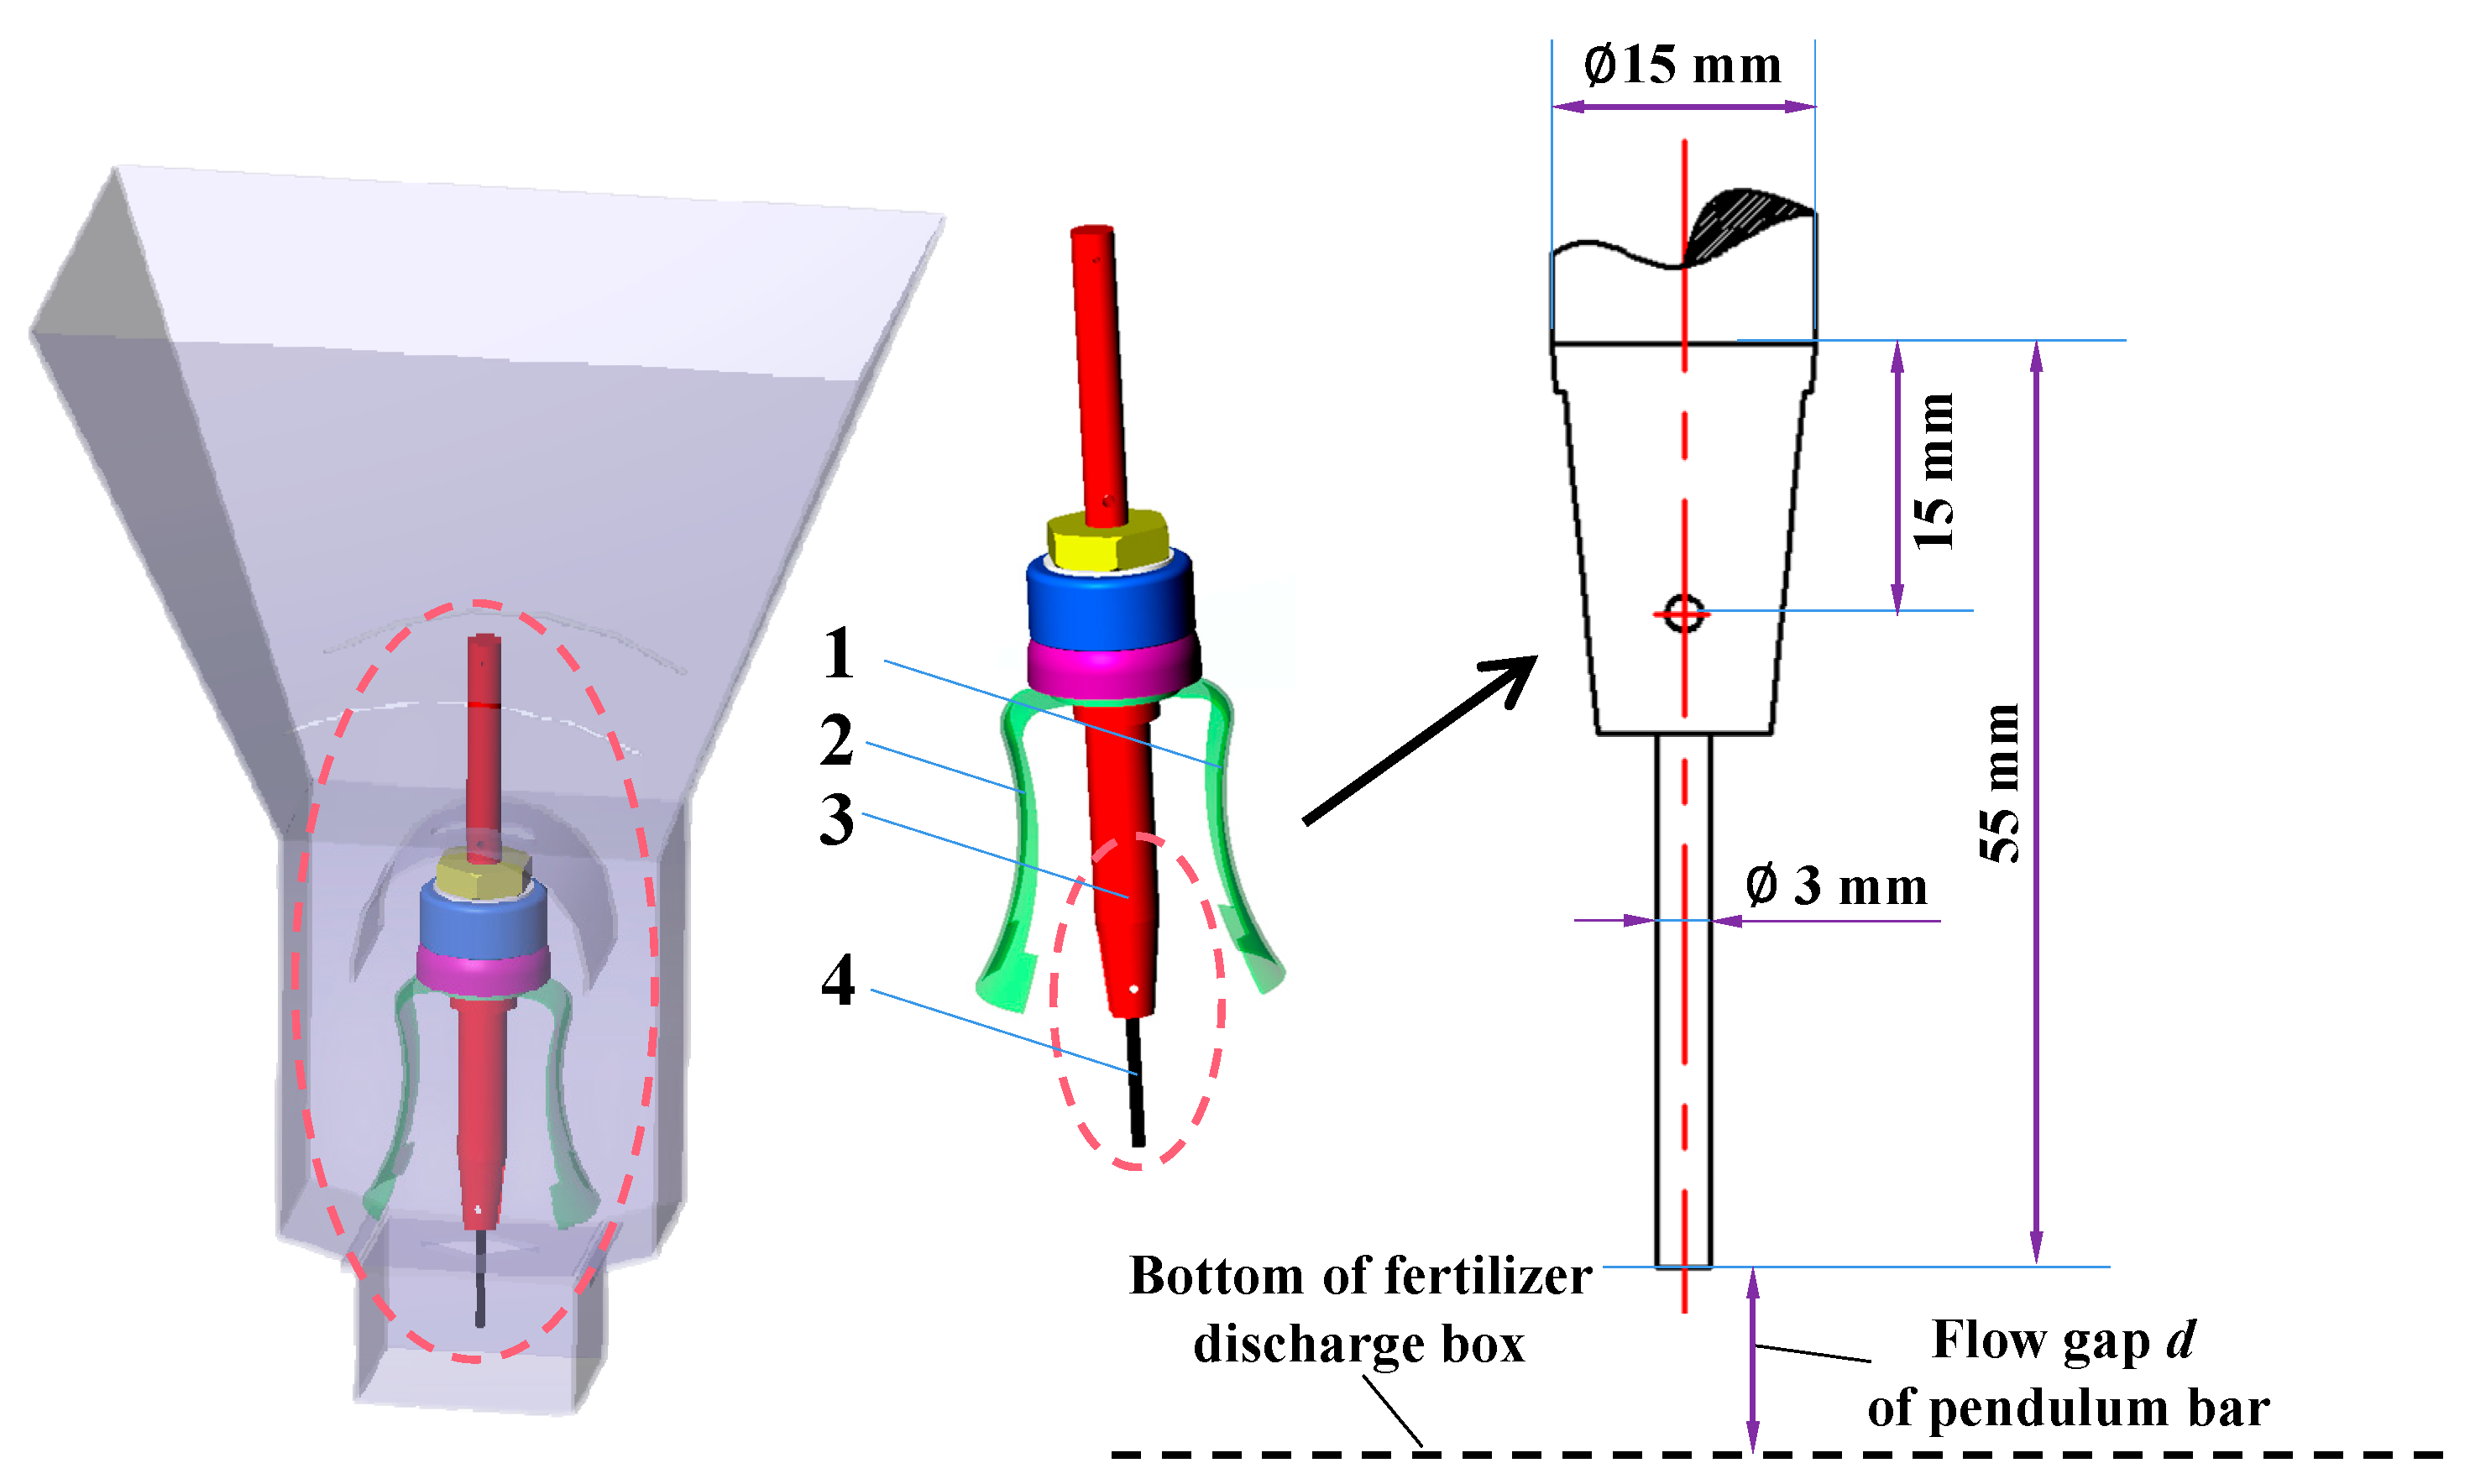
2.2.3. Guide Needle and FGPB
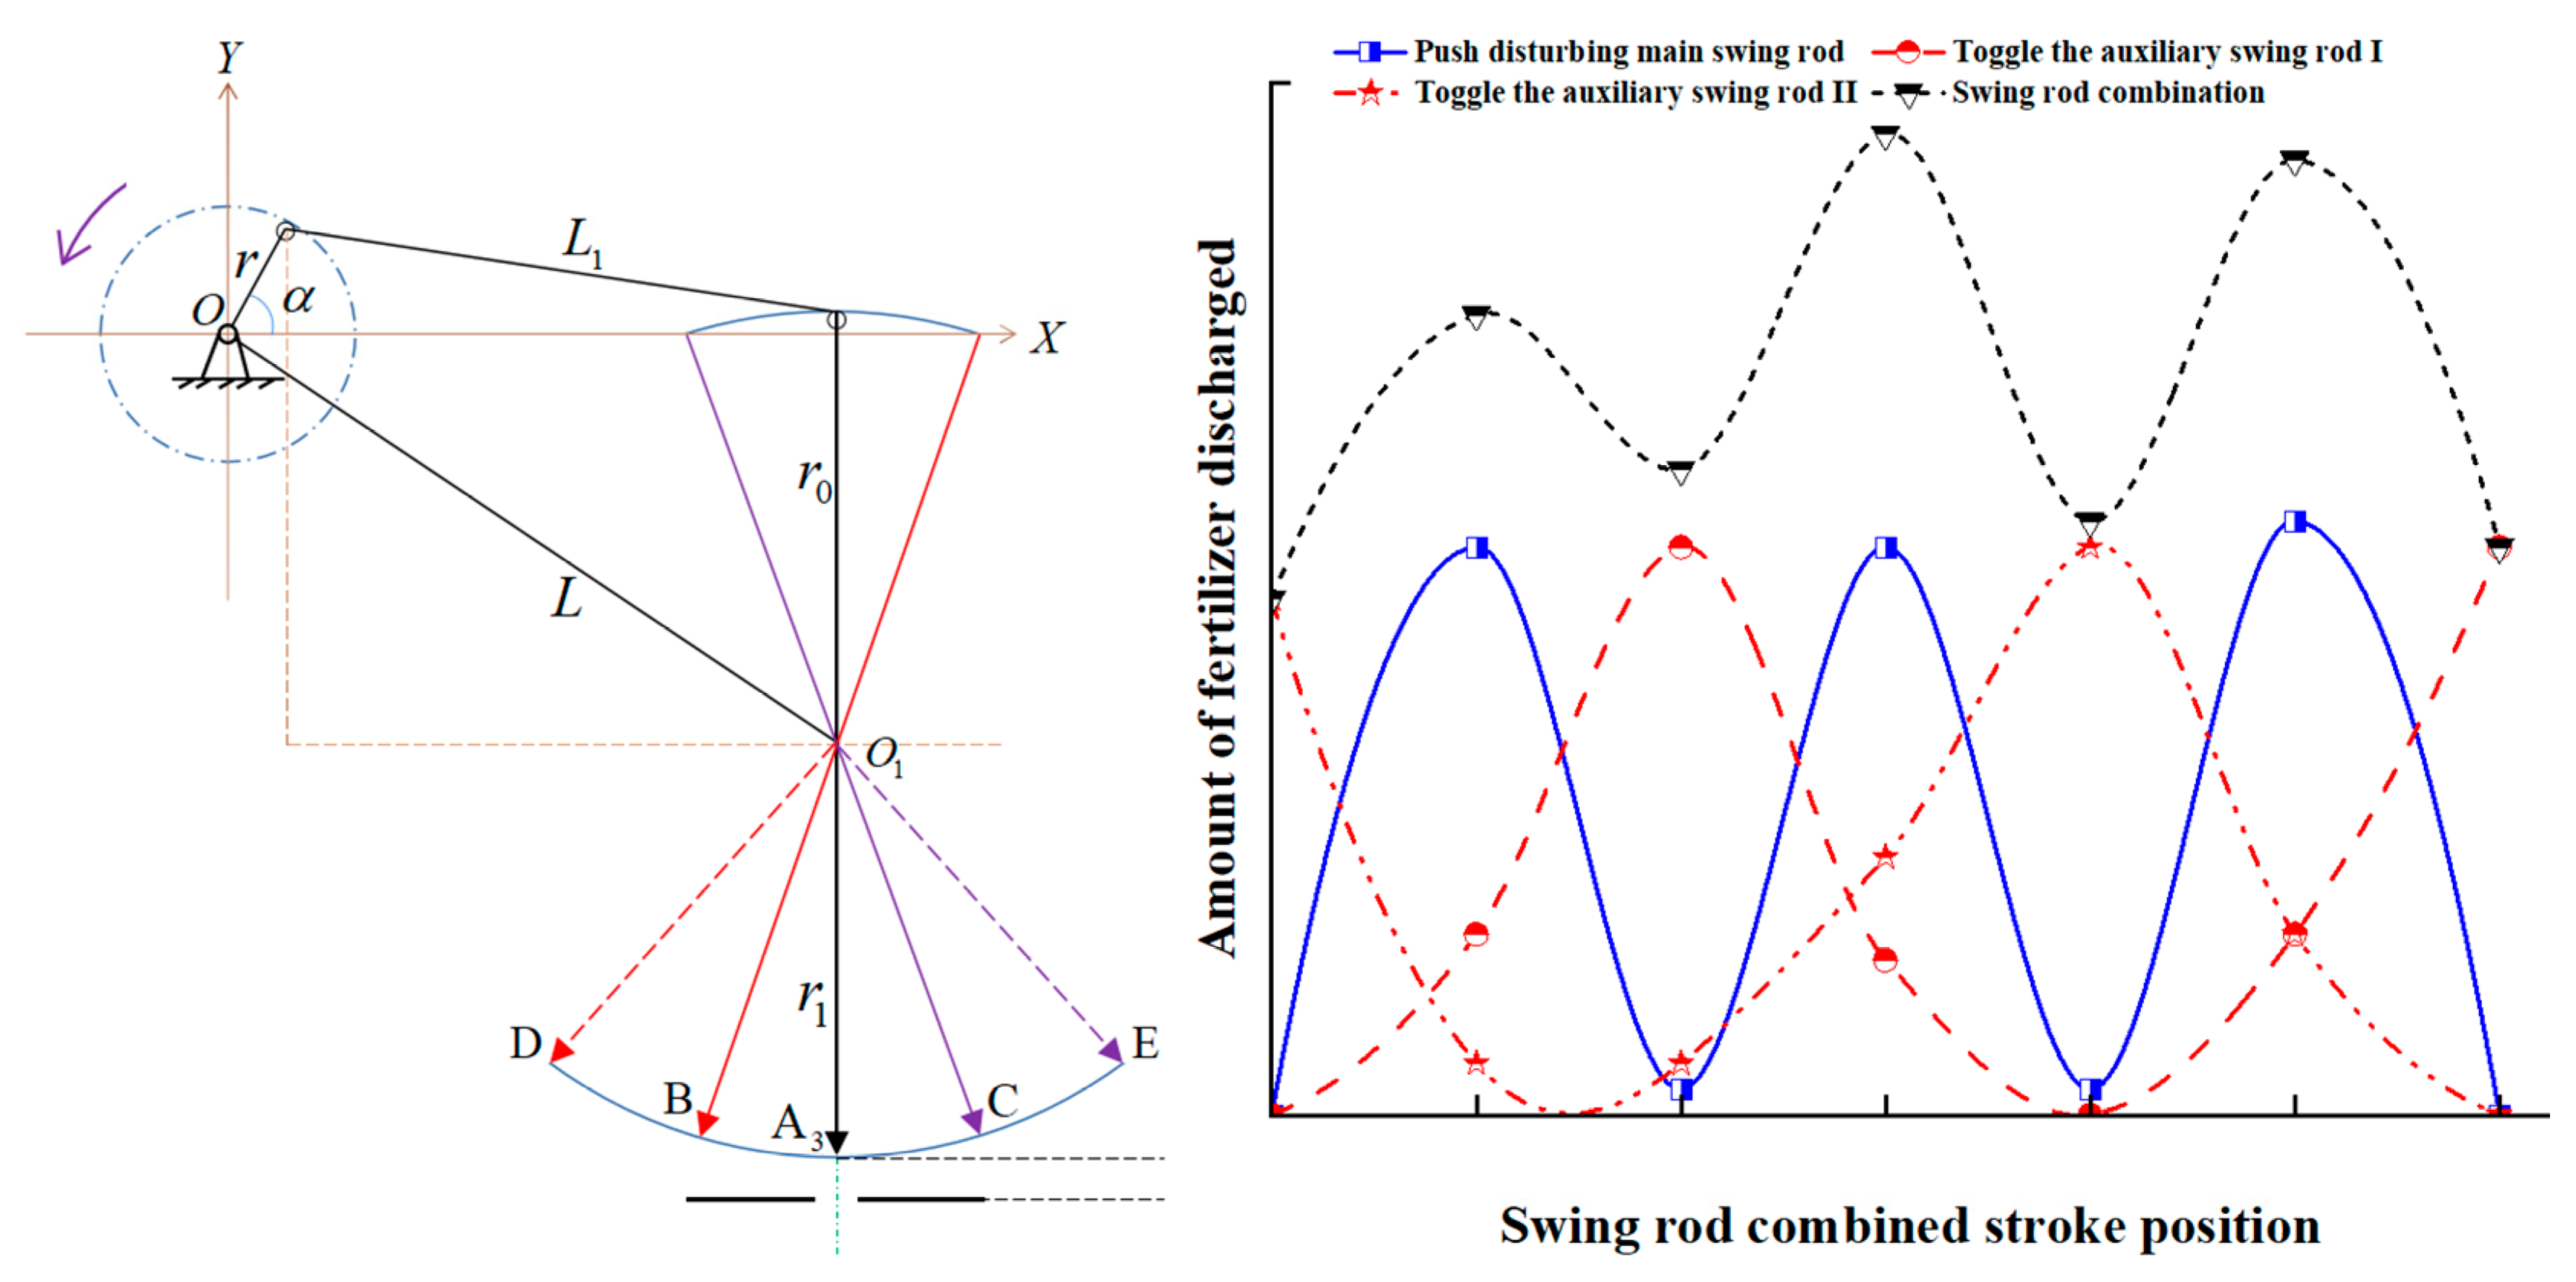
2.2.4. The Amount of Fertilizer Discharged
2.3. Simulation Test
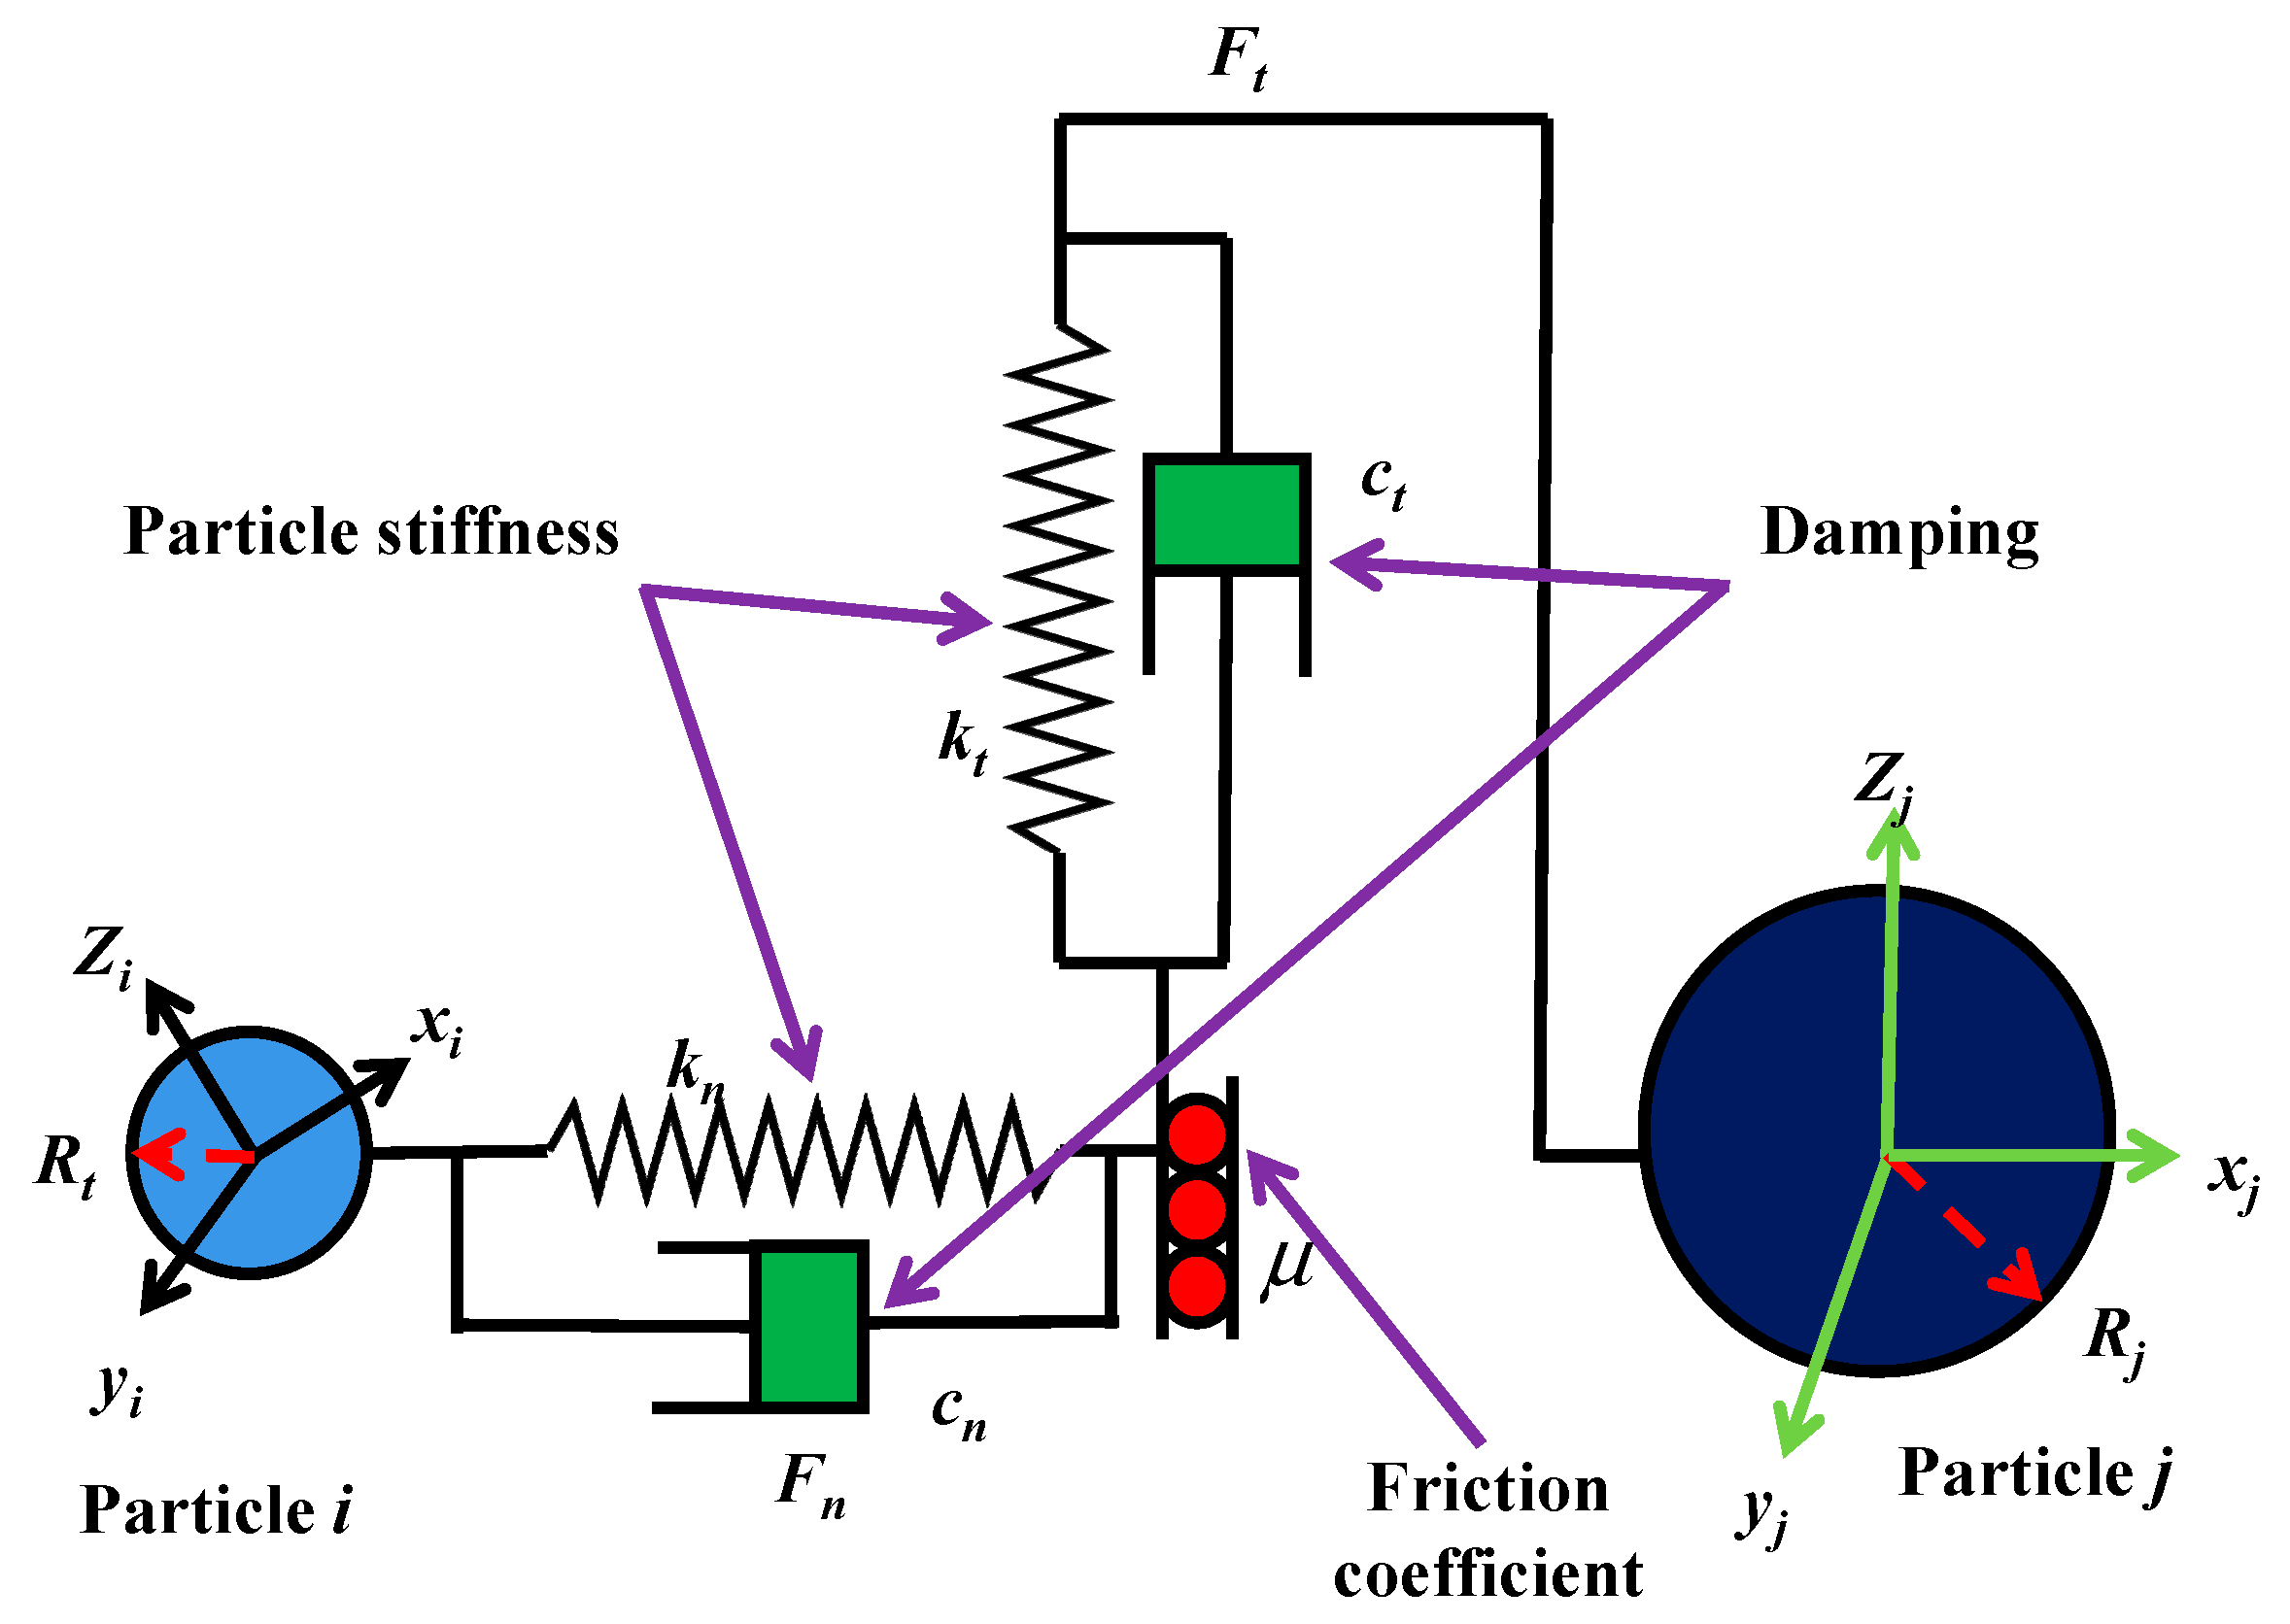
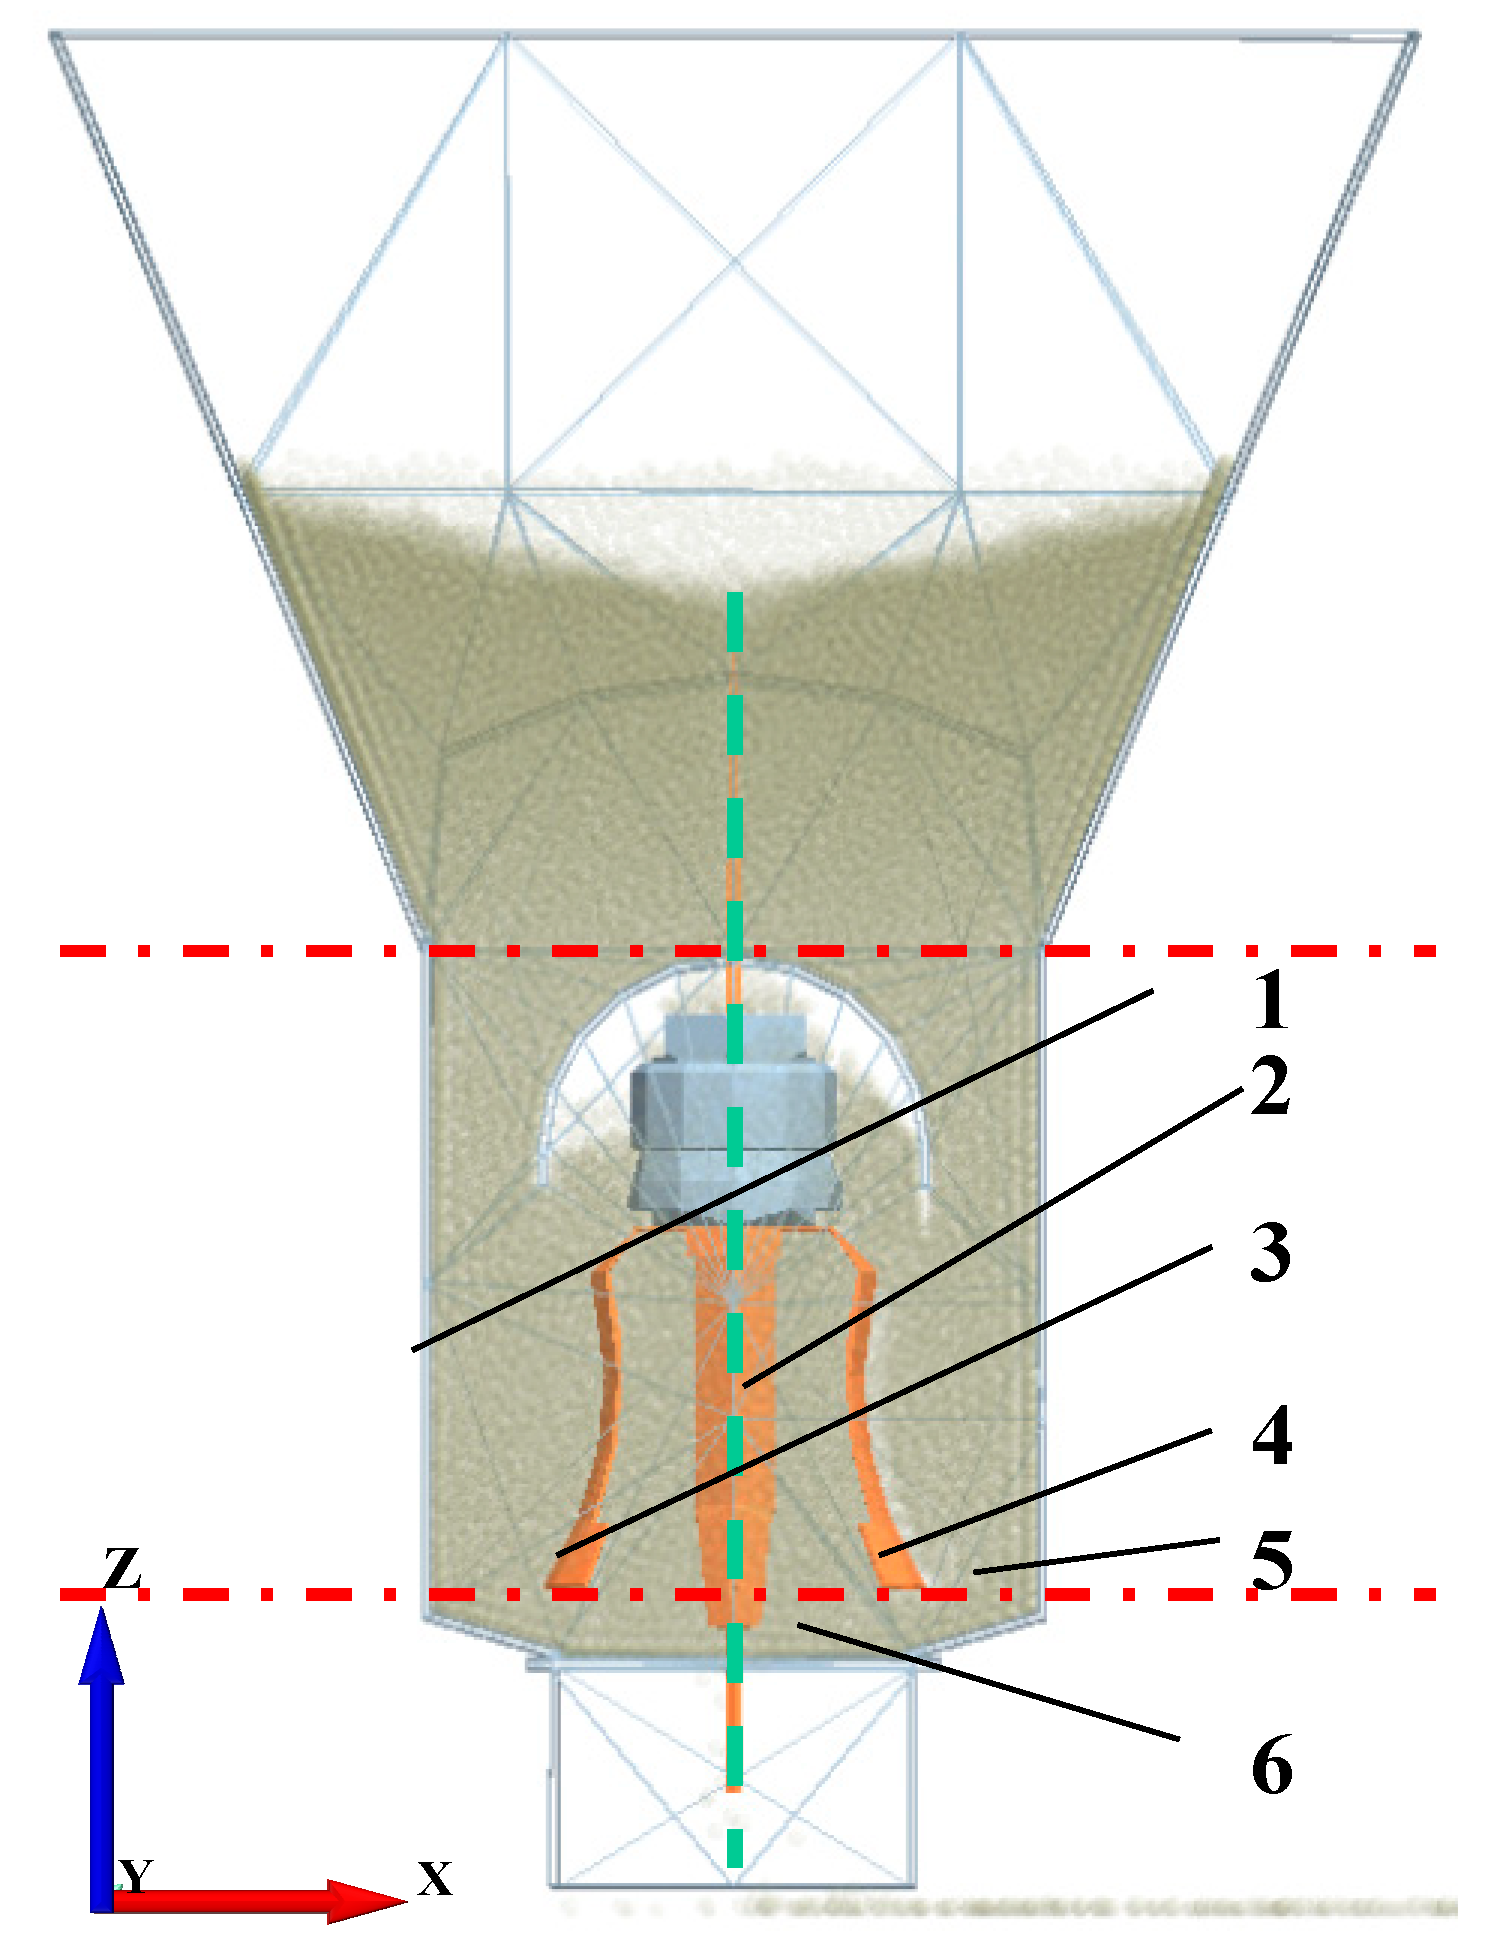
2.3.1. Simulation Model Establishment
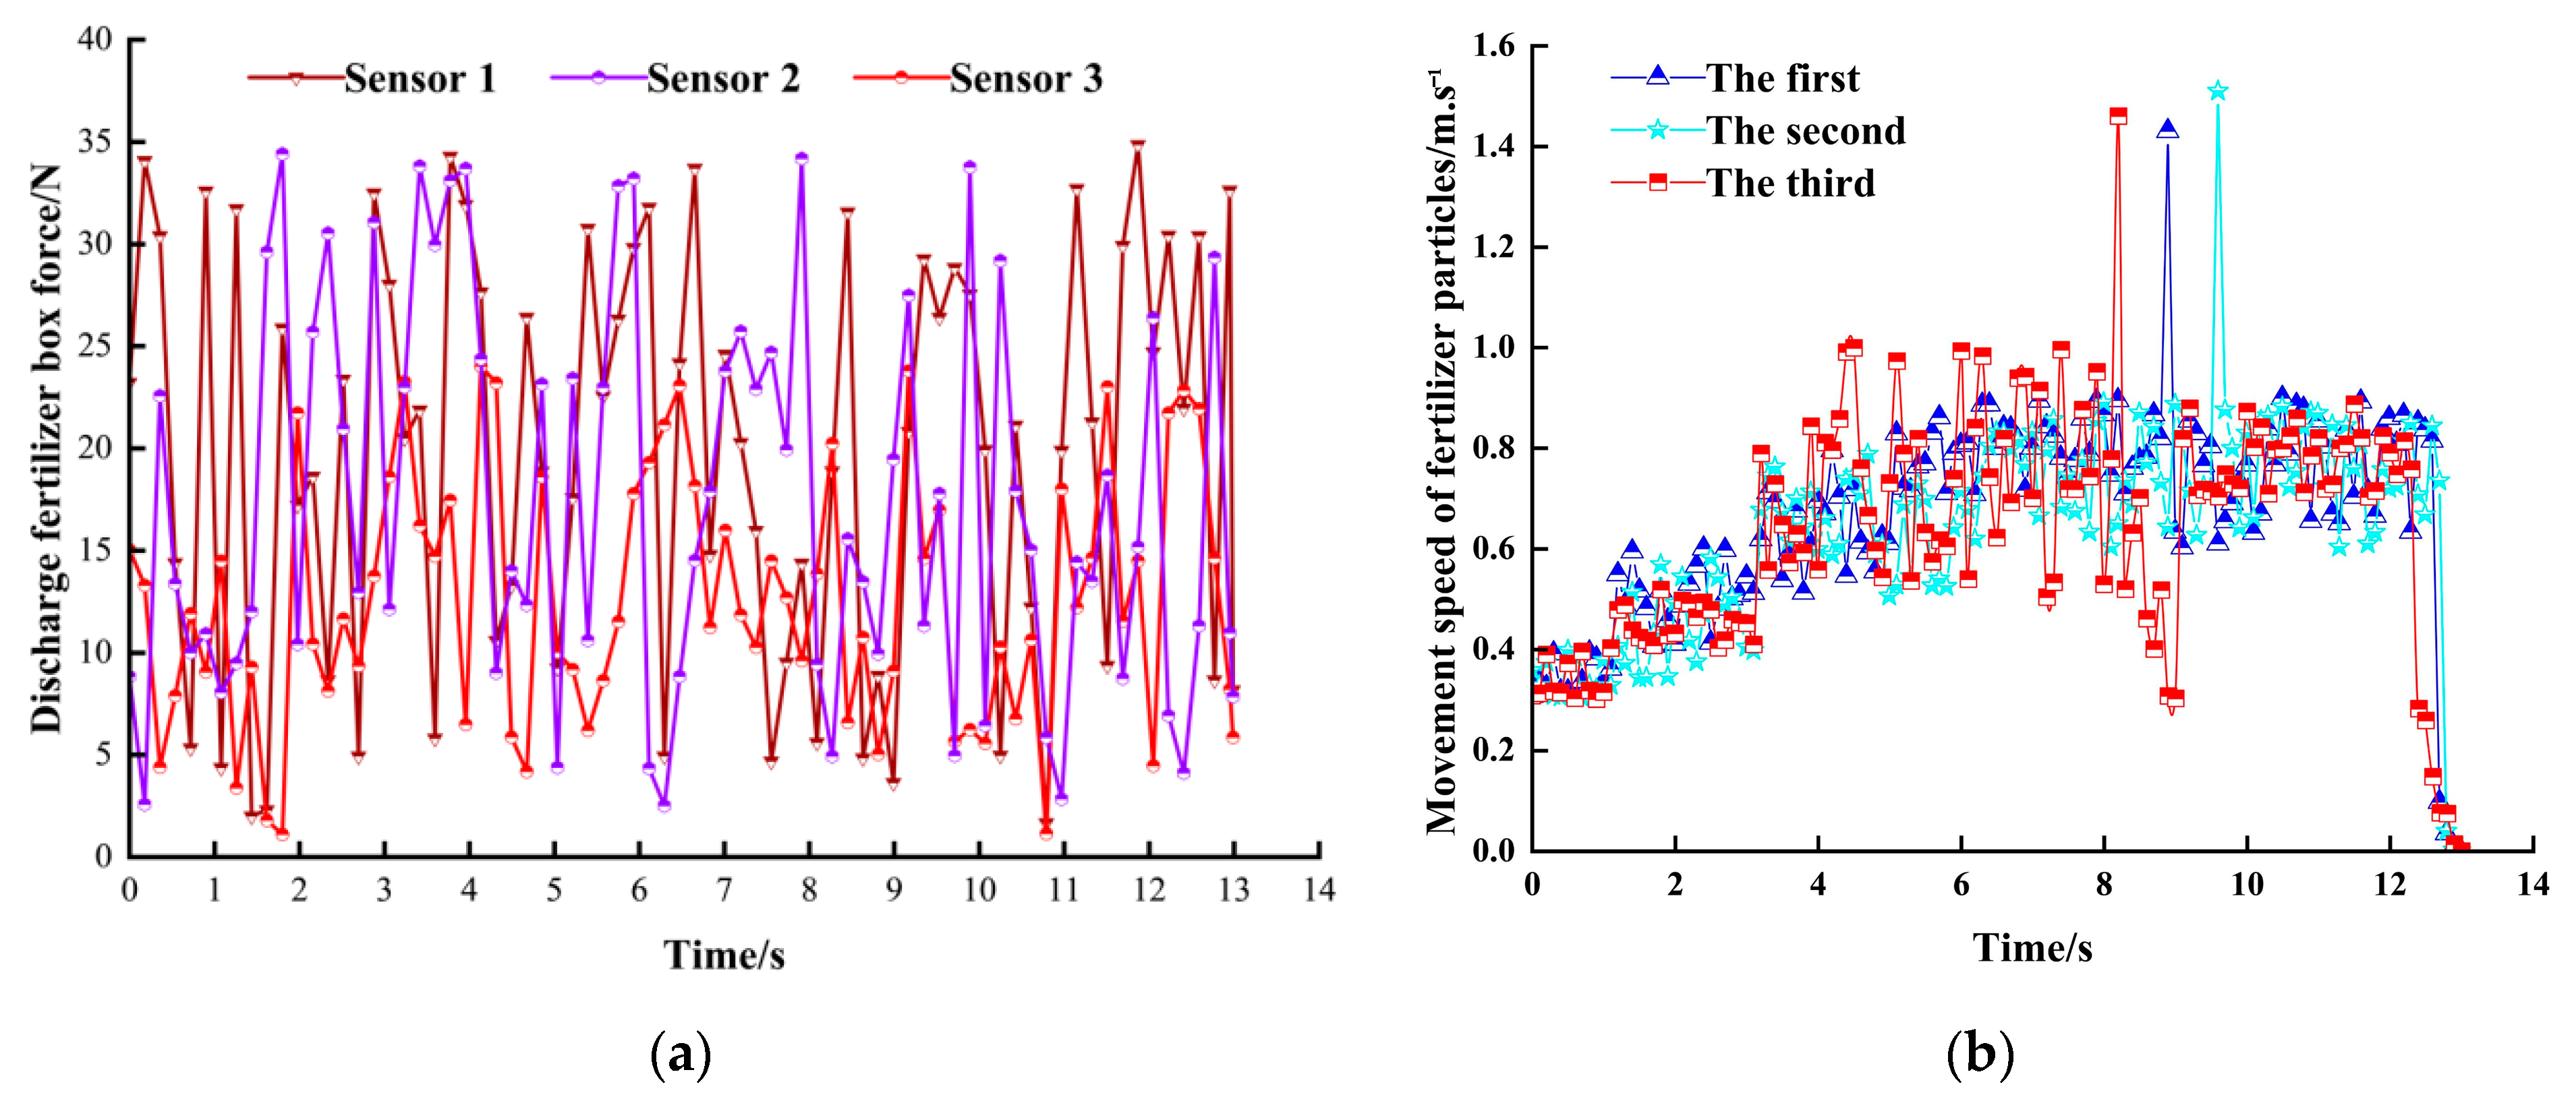
2.3.2. Analysis of Discrete Element Simulation Process
2.3.3. Experimental Factors and Levels
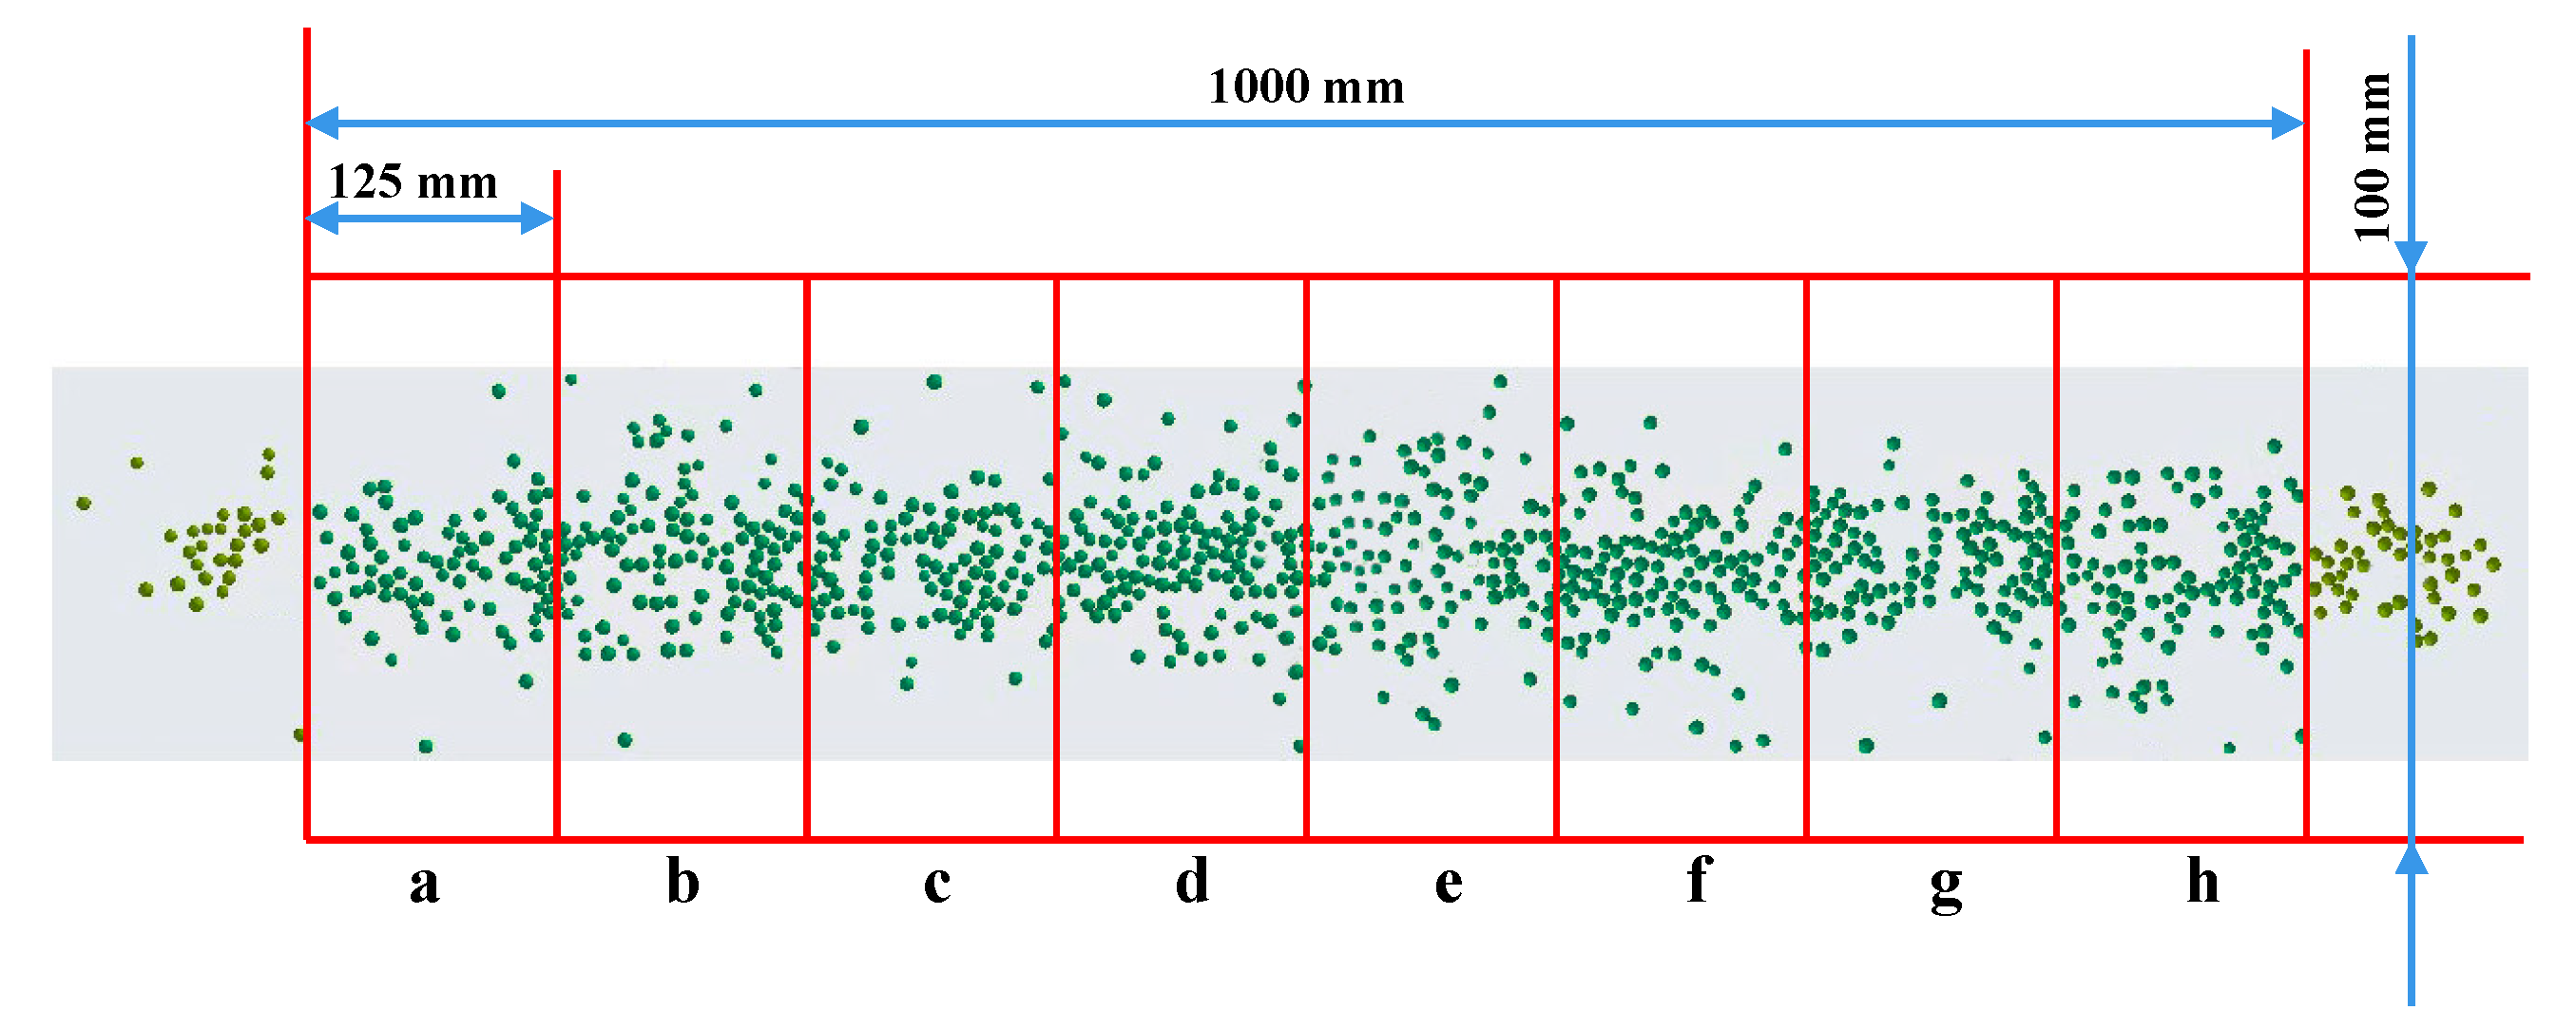
2.3.4. Calculation of Evaluation Indicators
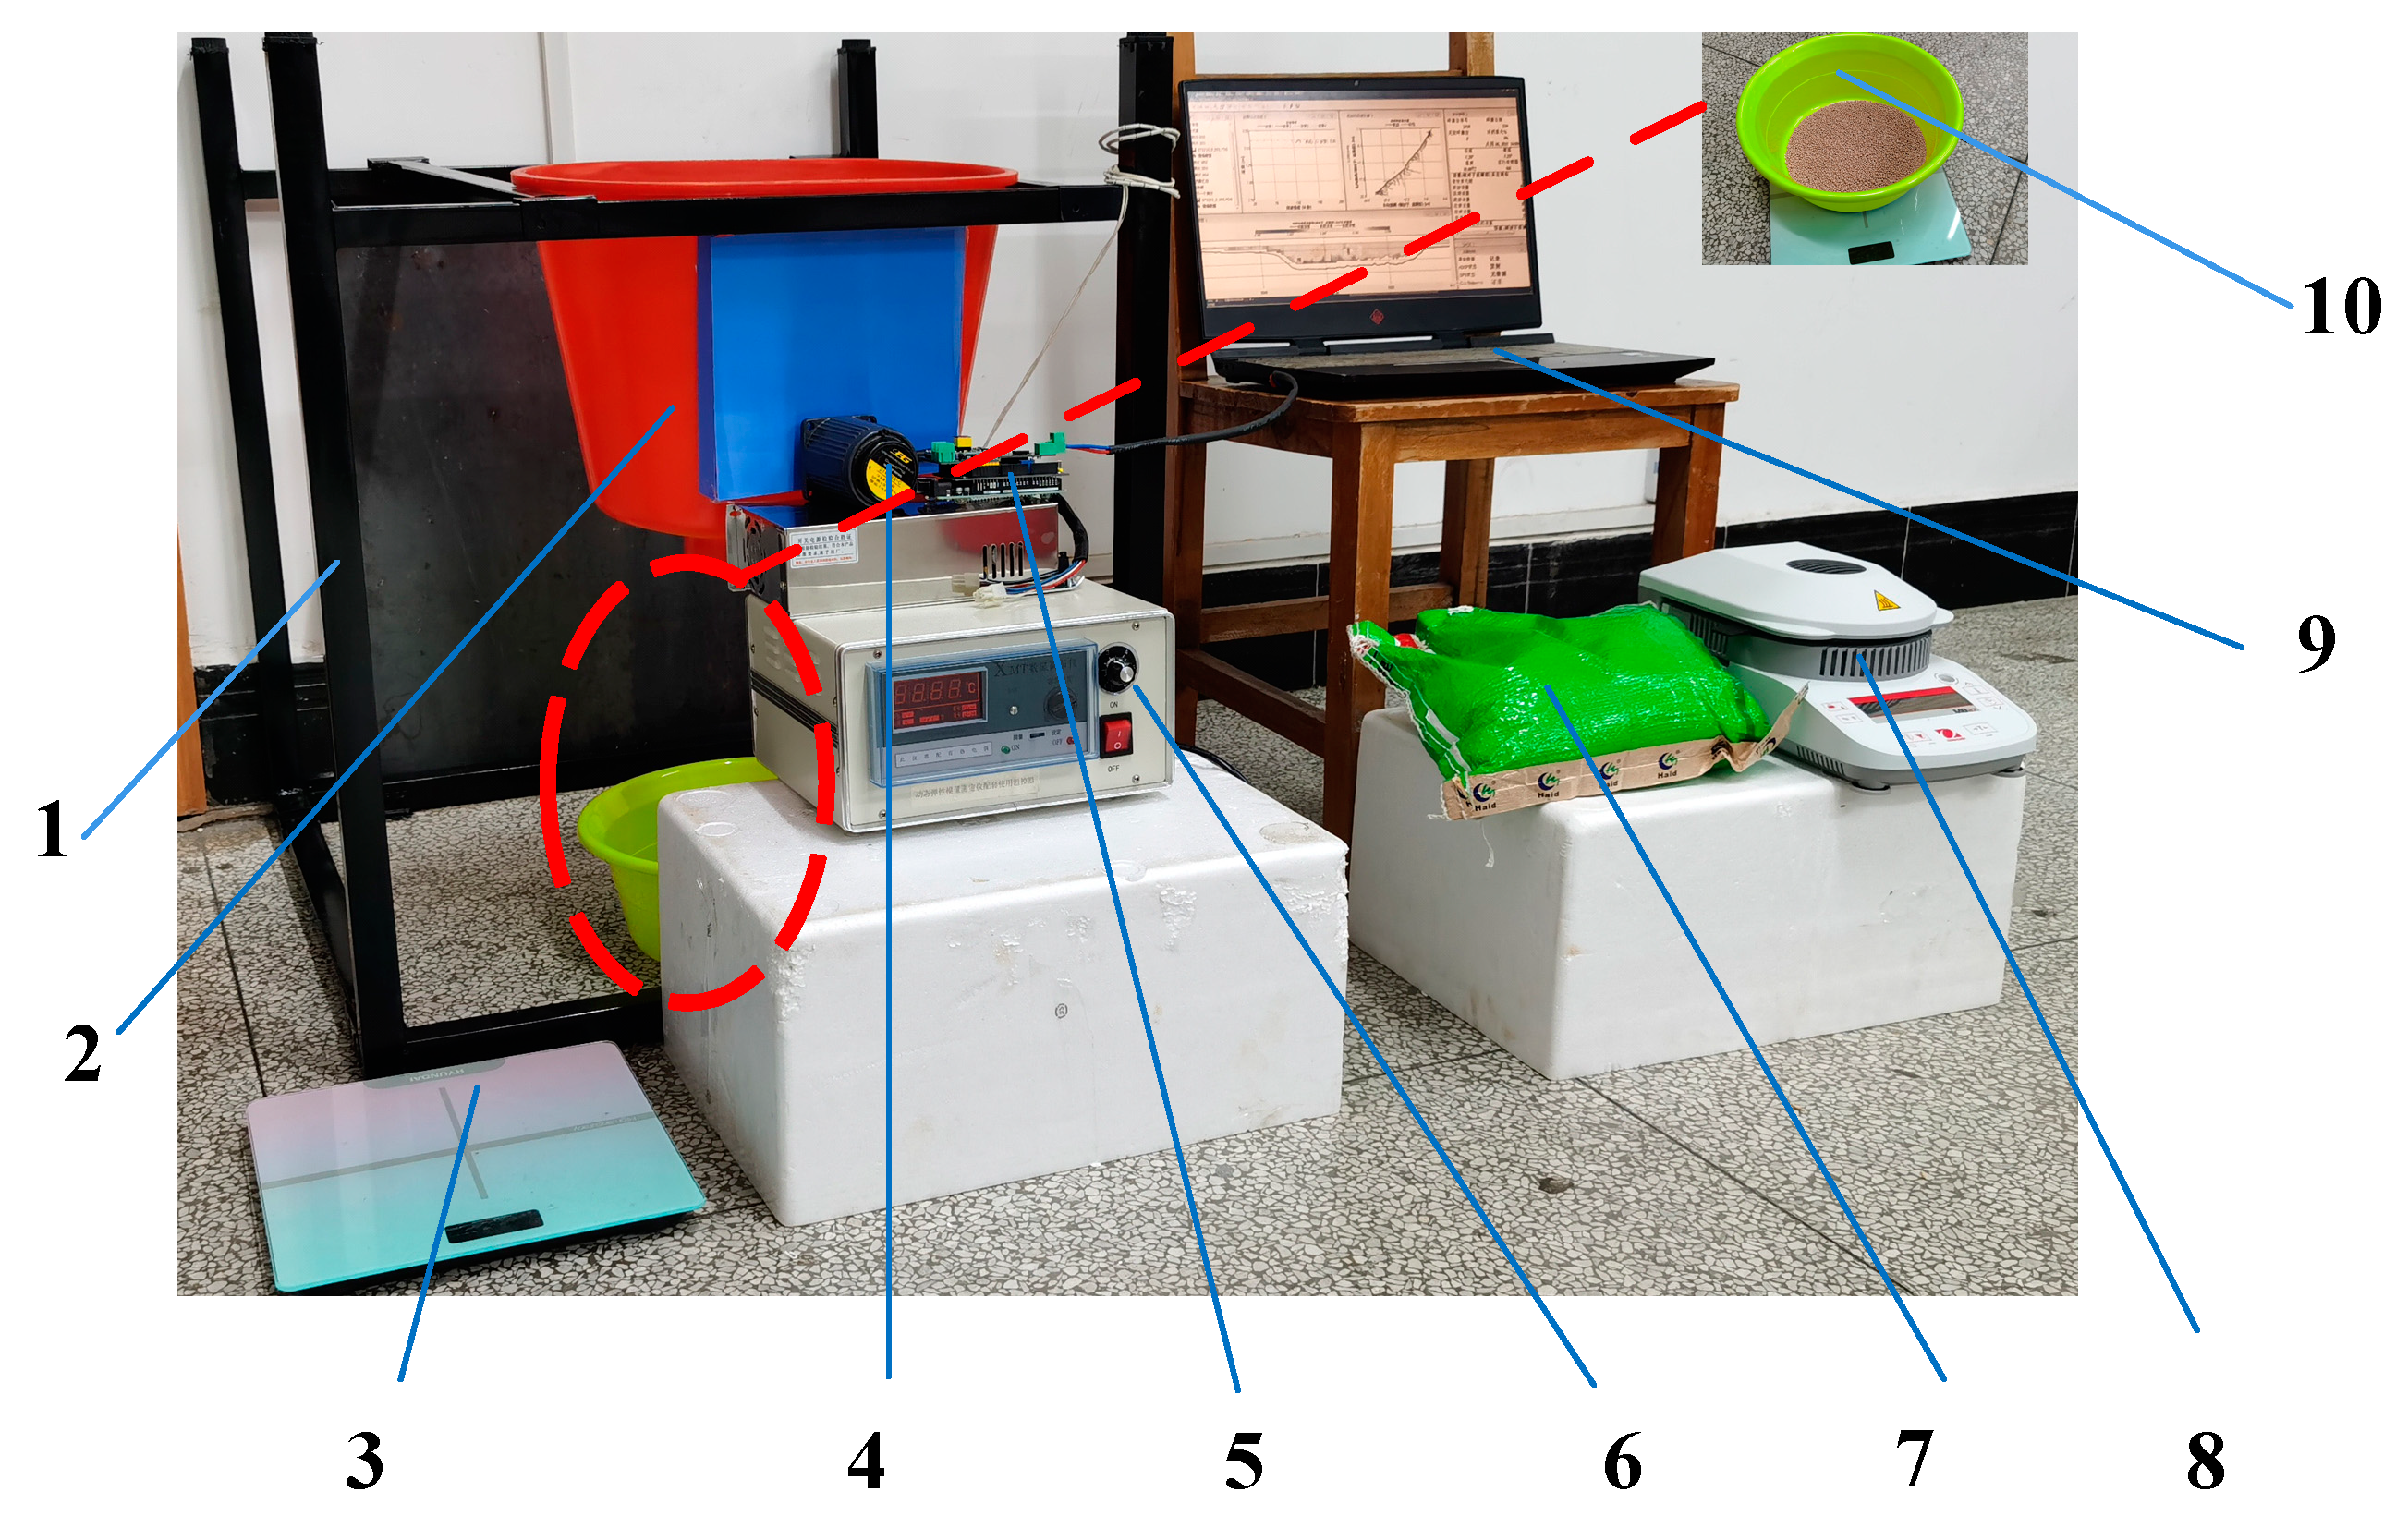
2.4. Test Materials and Equipment
3. Results
3.1. Results of Regression Model
3.1.1. Scheme and Results of the Experiment
3.1.2. Regression Model and Significance Test 2
3.2. Analysis of Simulation Results of Key Component
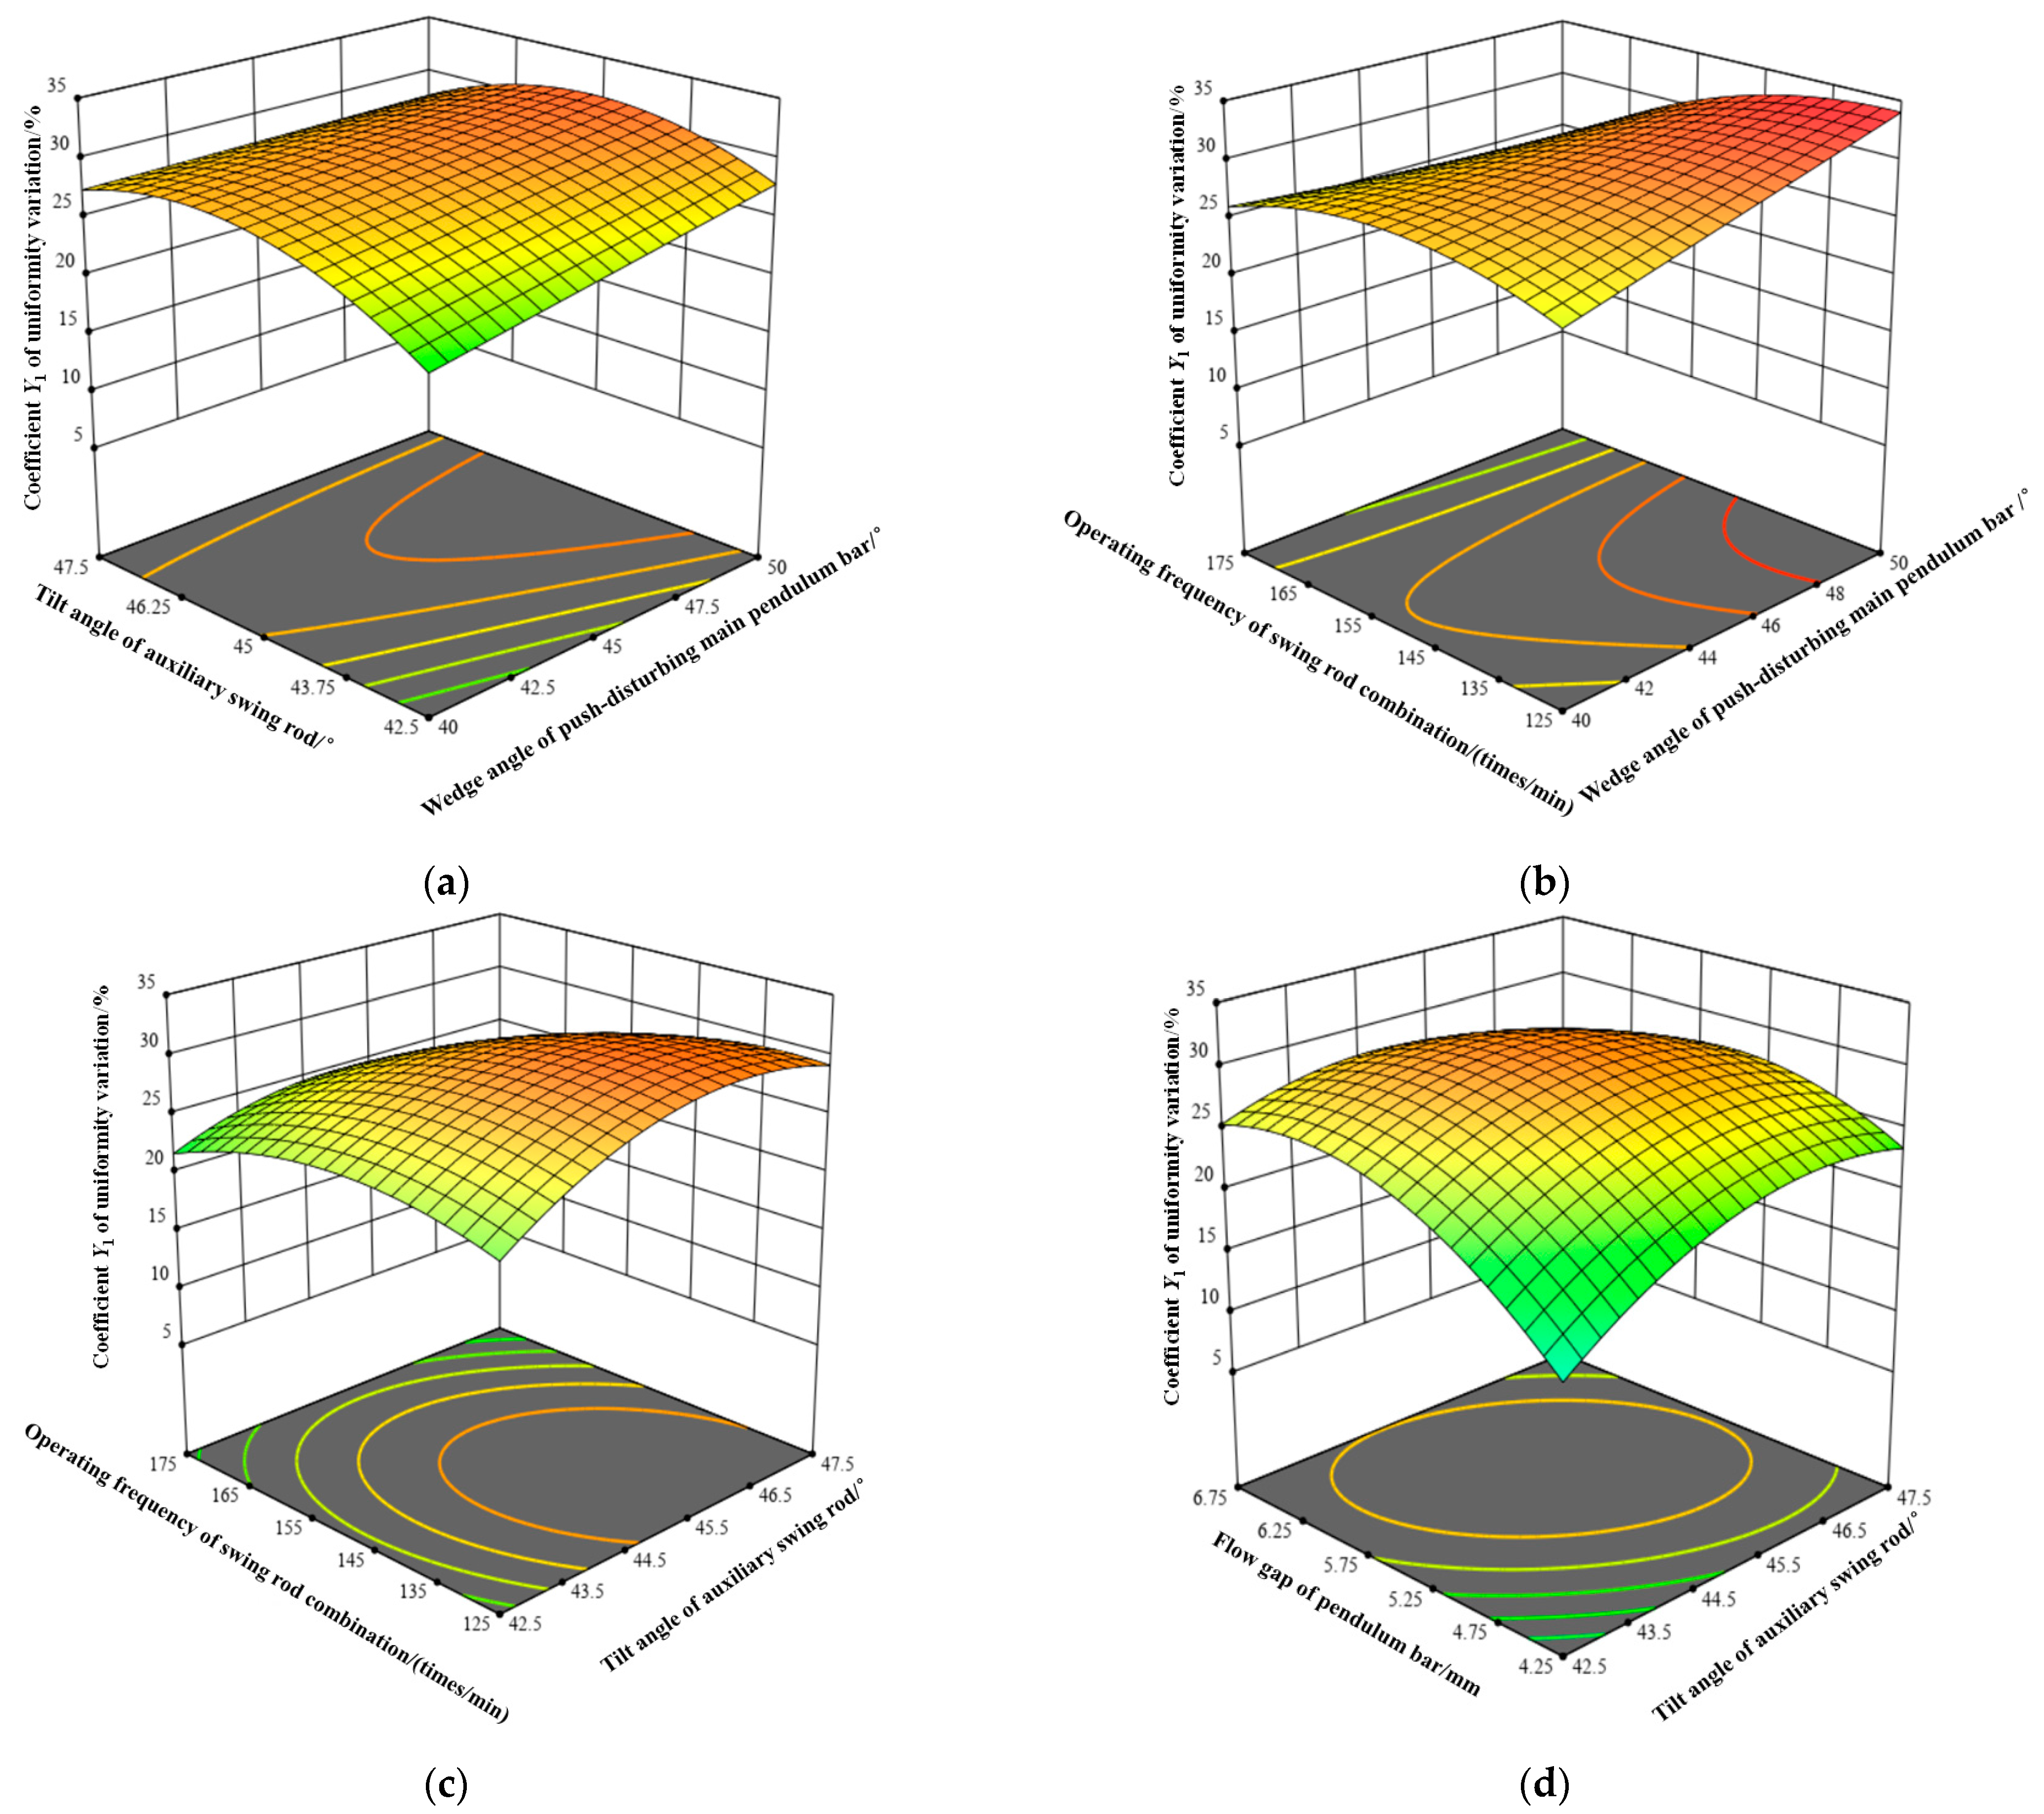
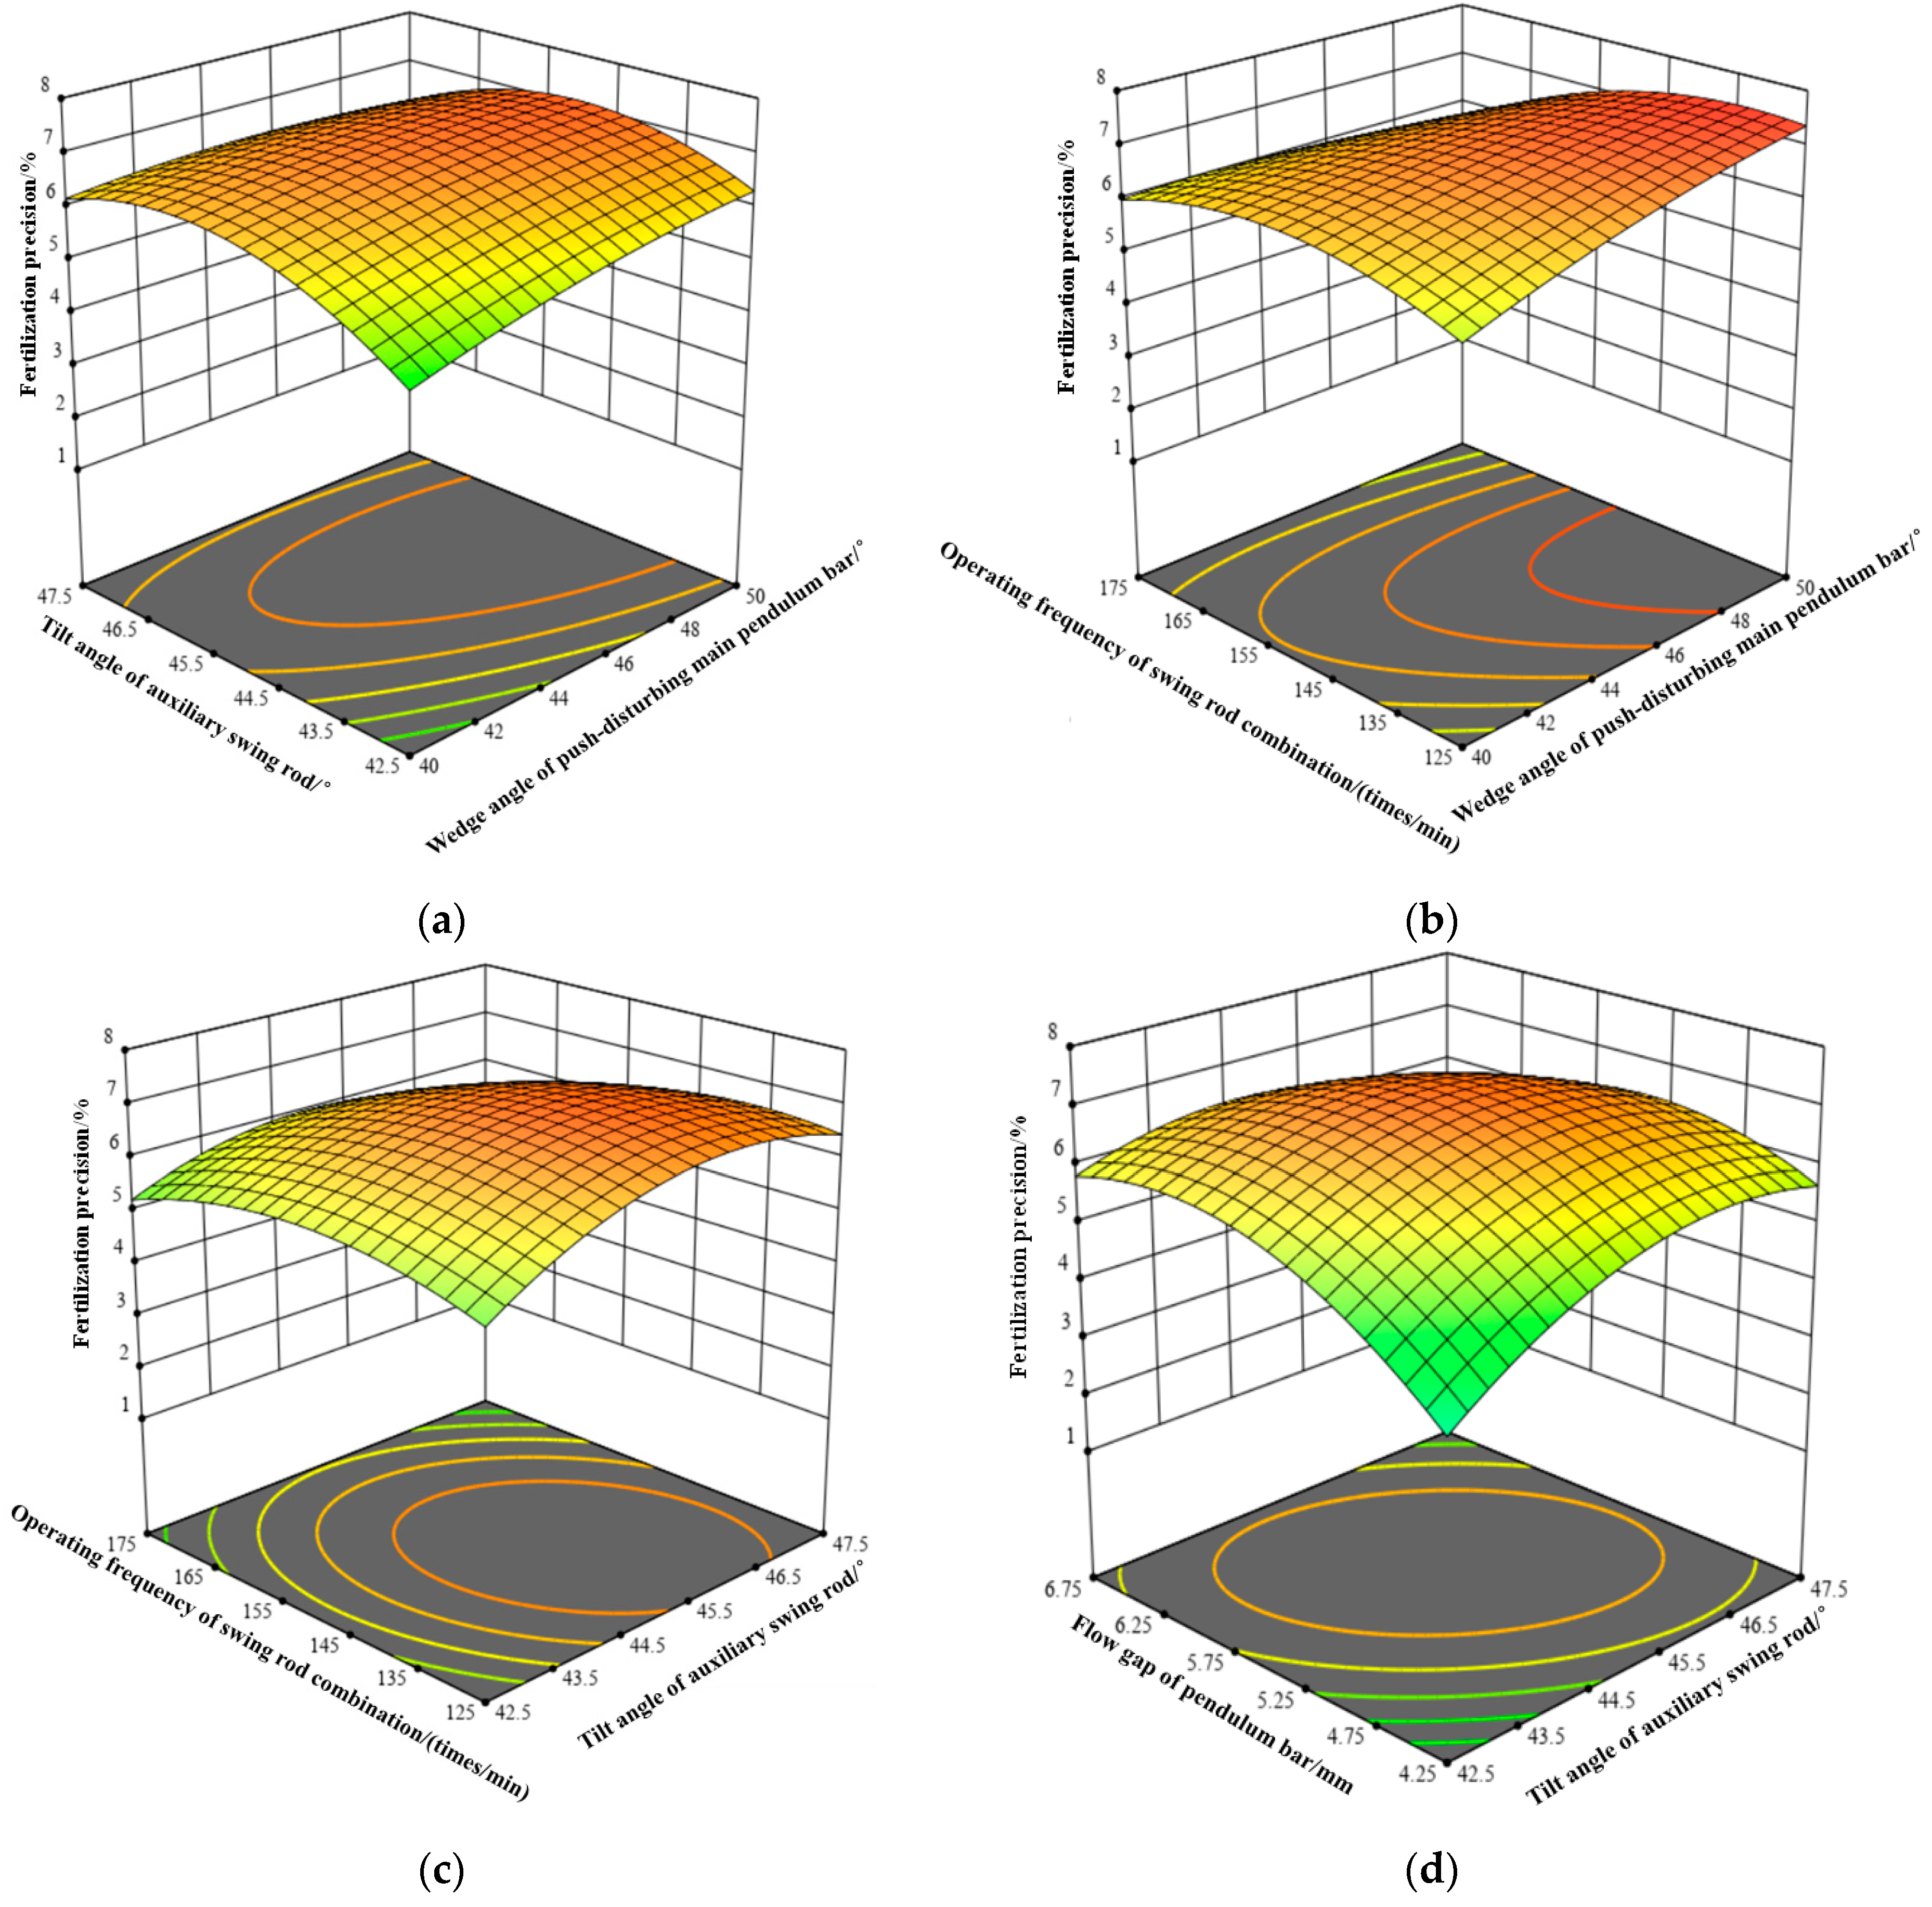
3.2.1. Analysis of Factors Influencing Effects
3.2.2. Optimization of Key Component Parameters
3.3. Bench Test Results
3.3.1. Test Results
3.3.2. Results of Fertilizer Discharge Performance Tests at Different Frequencies
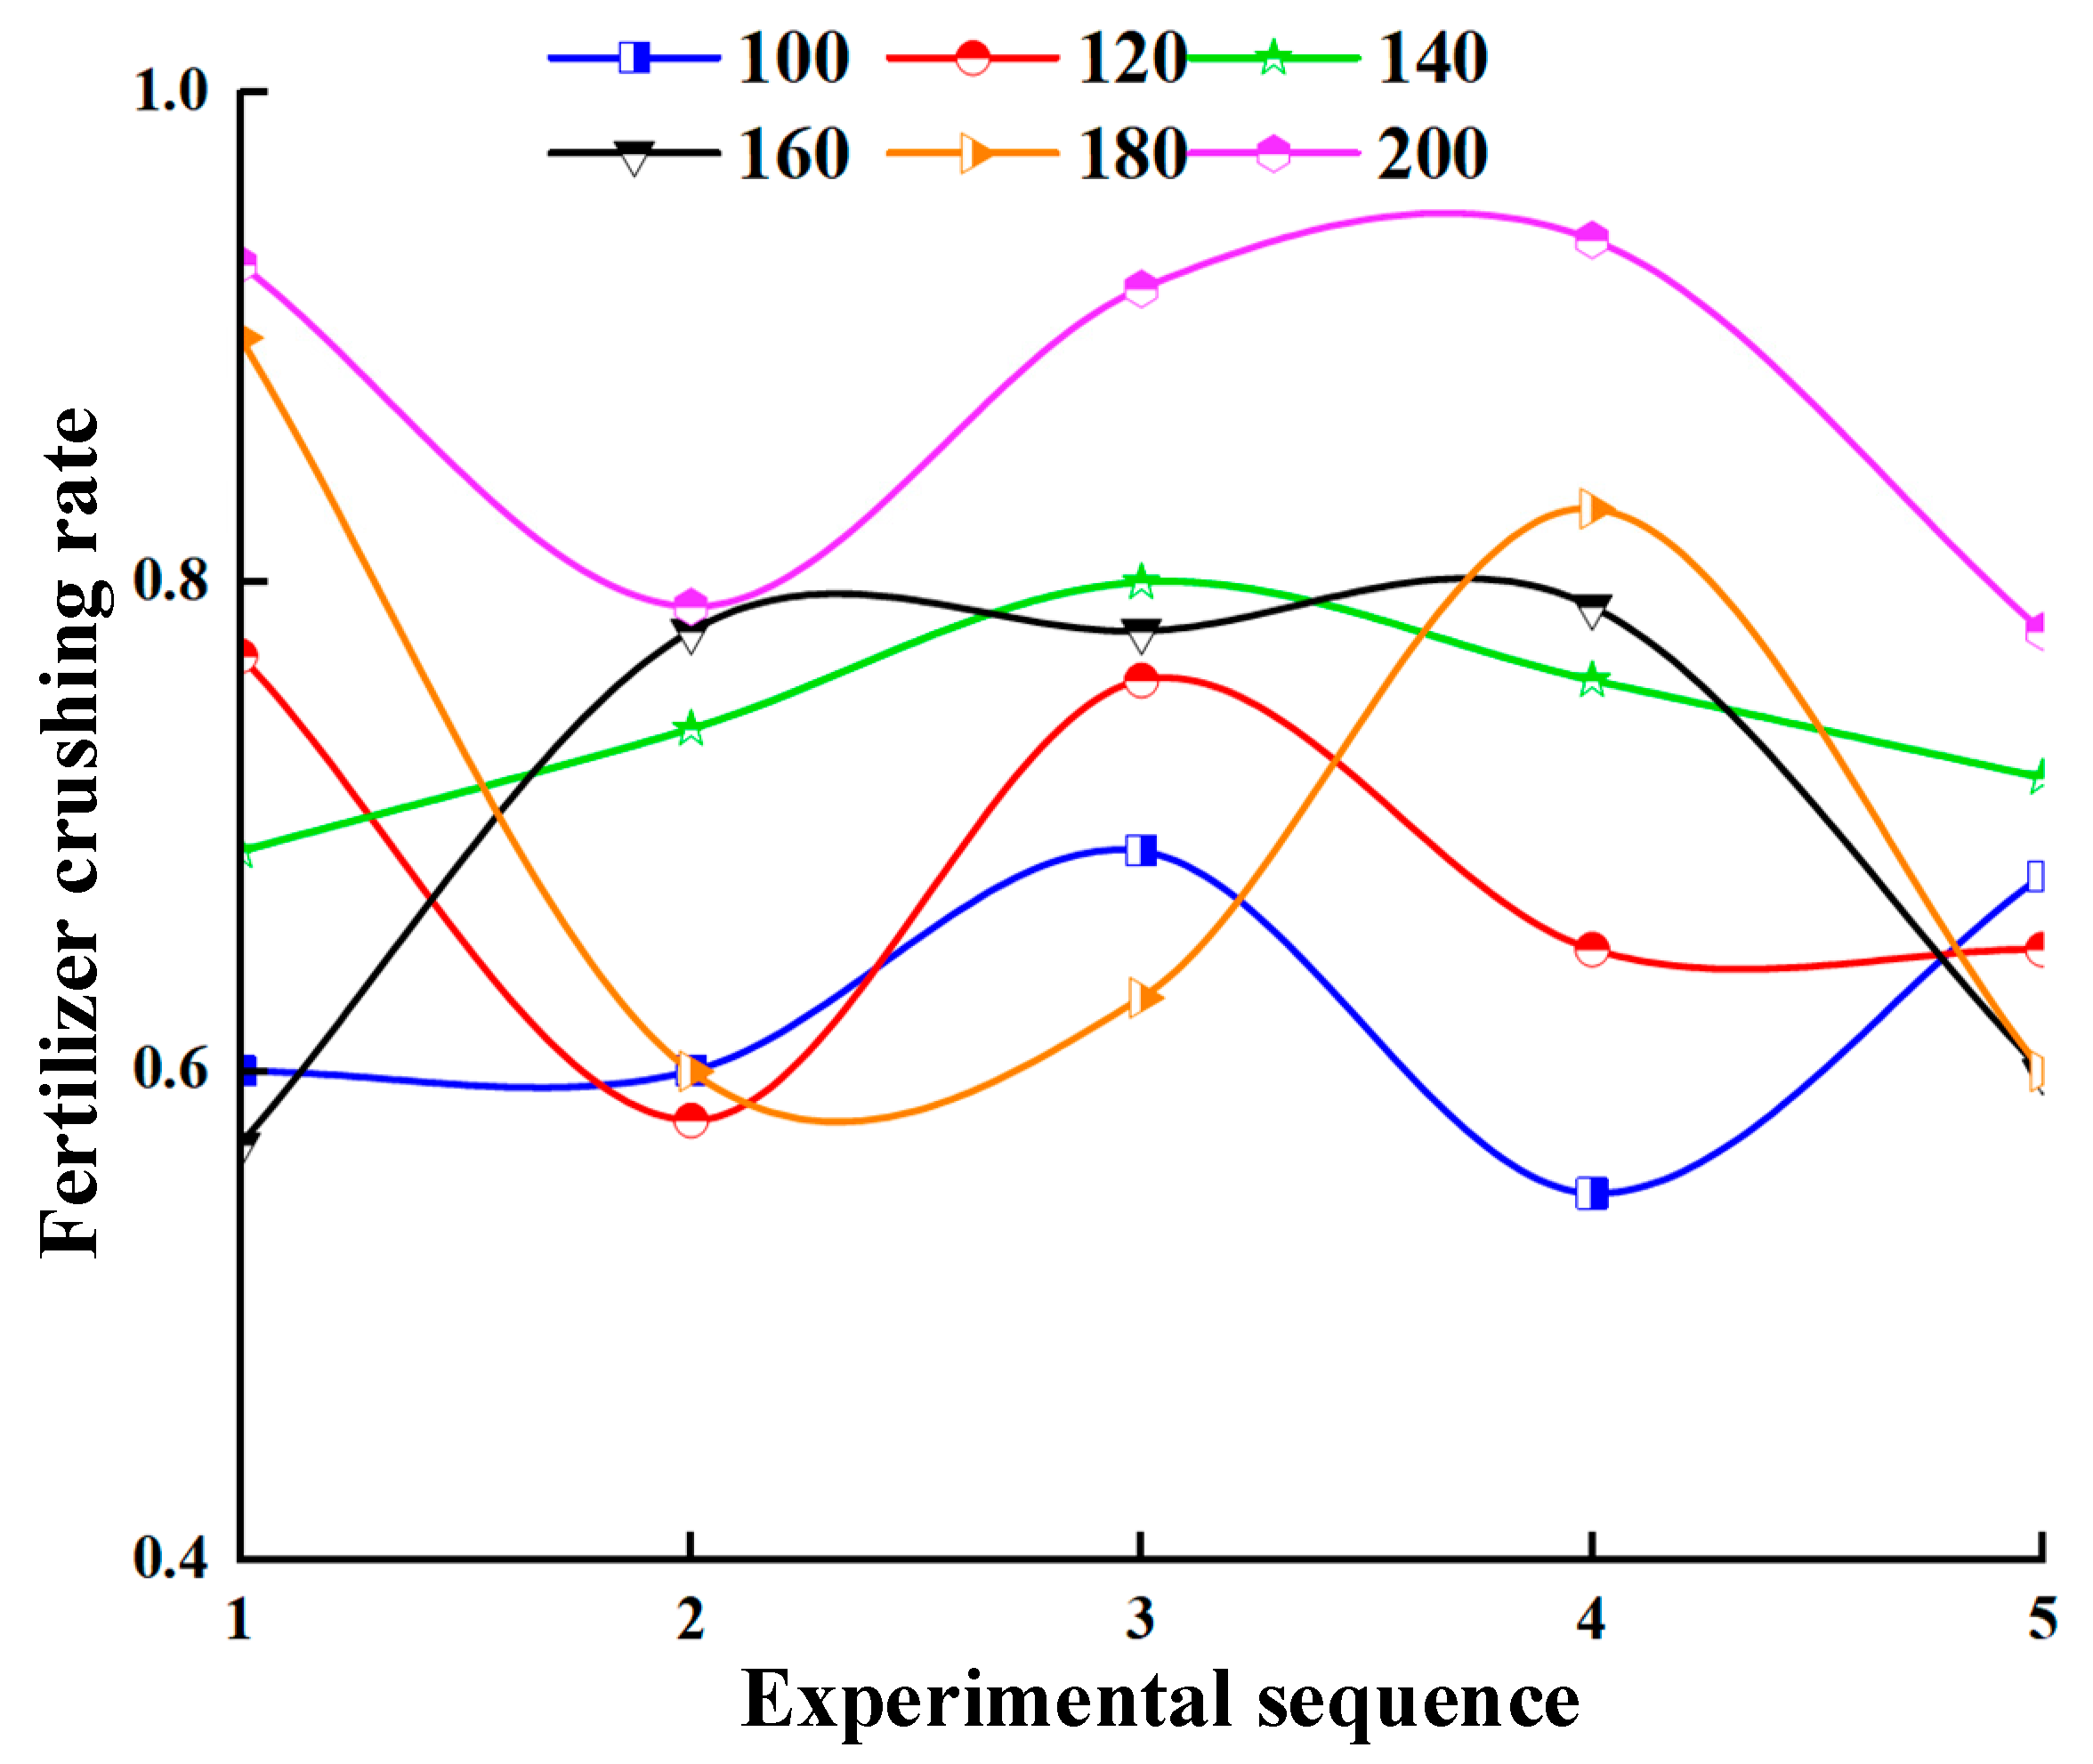
3.3.3. Fertilizer Crushing Rate Test Results at Different Frequencies
3.4. Adaptability Test Results
4. Discussion
5. Conclusions
Author Contributions
Funding
Institutional Review Board Statement
Data Availability Statement
Conflicts of Interest
References
- Zhang, Y.; Xia, C.Z.; Zhang, X.Y.; Sha, Y.; Feng, G.Z.; Gao, Q. Quantifying the relationships of soil properties and crop growth with yield in a NPK fertilizer application maize field. Comput. Electron. Agric. 2022, 198, 107011. [Google Scholar] [CrossRef]
- Sun, X.B.; Niu, L.H.; Cai, M.C.; Liu, Z.; Wang, Z.H.; Wang, J.W. Particle motion analysis and performance investigation of a fertilizer discharge device with helical staggered groove wheel. Comput. Electron. Agric. 2023, 213, 108241. [Google Scholar] [CrossRef]
- Xi, X.B.; Wang, R.Y.; Wang, X.T.; Shi, Y.J.; Zhao, Y.; Zhang, B.F.; Qu, J.W.; Gan, H.; Zhang, R.H. Parametric optimization and experimental verification of multi-fertilizer mixing by air blowing and blade stirring based on discrete element simulations. Comput. Electron. Agric. 2023, 210, 107895. [Google Scholar] [CrossRef]
- Chen, G.B.; Wang, Q.J.; Xu, D.J.; Li, H.W.; He, J.; Lu, C.Y. Design and experimental research on the counter roll differential speed solid organic fertilizer crusher based on DEM. Comput. Electron. Agric. 2023, 207, 107748. [Google Scholar] [CrossRef]
- Villette, S.; Piron, E.; Miclet, D. Hybrid centrifugal spreading model to study the fertiliser spatial distribution and its assessment using the transverse coefficient of variation. Comput. Electron. Agric. 2017, 137, 115–129. [Google Scholar] [CrossRef]
- Heiß, A.; Paraforos, D.S.; Sharipov, G.M.; Griepentrog, H.W. Real-time control for multi-parametric data fusion and dynamic offset optimization in sensor-based variable rate nitrogen application. Comput. Electron. Agric. 2022, 196, 106893. [Google Scholar] [CrossRef]
- Patterson, D.E.; Reece, A.R. The theory of the centrifugal distributor. I: Motion on the disc, near-centre feed. J. Agric. Eng. Res. 1962, 7, 232–240. [Google Scholar]
- Cool, S.C.; Pieters, J.; Mertens, K.C.; Hijazi, B.; Vangeyte, J. A simulation of the influence of spinning on the ballistic flight of spherical fertiliser grains. Comput. Electron. Agric. 2014, 105, 121–131. [Google Scholar] [CrossRef]
- Lv, J.Q.; Sun, Y.K.; Li, J.C.; Li, Z.H.; Li, Z.Y. Design and test of vertical spiral organic fertilizer spreading device. Trans. Chin. Soc. Agric. Eng. 2020, 36, 19–28. [Google Scholar] [CrossRef]
- Shen, C.J.; Zhang, L.X.; Zhou, Y.; Dai, Y.M.; Li, F.; Zhang, J. Kinematic analysis and tests of the insertion mechanism of a self-propelled orchard gas explosion subsoiling and fertilizing machine. Trans. Chin. Soc. Agric. Eng. 2022, 38, 44–52. [Google Scholar] [CrossRef]
- Du, X.; Liu, C.L.; Jiang, M.; Yuan, H.; Dai, L.; Li, F.L. Design and Experiment of Inclined Trapezoidal Hole Fertilizer Point-applied Discharging Device. Trans. Chin. Soc. Agric. Mach. 2021, 52, 43–53. [Google Scholar] [CrossRef]
- Wang, J.F.; Fu, Z.D.; Weng, W.X.; Wang, Z.T.; Wang, J.W.; Yang, D.Z. Design and Experiment of Conical-disc Push Plate Double-row Fertilizer Apparatus for Side-deep Fertilization in Paddy Field. Trans. Chin. Soc. Agric. Eng. 2023, 54, 53–62. [Google Scholar] [CrossRef]
- Ulloa, C.C.; Krus, A.; Barrientos, A.; del Cerro, J.; Valero, C. Robotic Fertilization in Strip Cropping using a CNN Vegetables Detection-Characterization Method. Comput. Electron. Agric. 2022, 193, 106684. [Google Scholar] [CrossRef]
- Wang, J.F.; Wang, Z.T.; Weng, W.X.; Liu, Y.F.; Fu, Z.D.; Wang, J.W. Development status and trends in side-deep fertilization of rice. Renew. Agric. Food Syst. 2022, 37, 550–575. [Google Scholar] [CrossRef]
- Zhu, Q.Z.; Zhu, Z.H.; Zhang, H.Y.; Gao, Y.Y.; Chen, L.P. Design of an Electronically Controlled Fertilization System for an Air-Assisted Side-Deep Fertilization Machine. Agriculture 2023, 13, 2210. [Google Scholar] [CrossRef]
- Tang, H.; Jiang, Y.M.; Wang, J.W.; Wang, J.F.; Zhou, W.Q. Numerical analysis and performance optimization of a spiral fertilizer distributor in side deep fertilization of a paddy field. Proc. Inst. Mech. Eng. Part C J. Mech. Eng. Sci. 2021, 235, 3495–3505. [Google Scholar] [CrossRef]
- Bulgakov, V.; Pascuzzi, S.; Ivanovs, S.; Nadykto, V.; Nowak, J. Kinematic discrepancy between driving wheels evaluated for a modular traction device. Biosyst. Eng. 2020, 196, 88–96. [Google Scholar] [CrossRef]
- Adamchuk, V.; Lund, E.D.; Sethuramasamyraja, B.; Morgan, M.T.; Dobermann, A.; Marx, D.B. Direct measurement of soil chemical properties on-the-go using ion-selective electrodes. Comput. Electron. Agric. 2005, 48, 272–294. [Google Scholar] [CrossRef]
- Chen, Z. Agricultural Machinery Design Handbook; China Agricultural Science and Technology Press: Beijing, China, 2007; pp. 74–96. [Google Scholar]
- Zhu, H.B.; Wu, X.; Bai, L.Z.; Qian, C.; Zhao, H.R.; Li, H. Development of the biaxial stubble breaking no-tillage device for rice stubble field based on EDEM-ADAMS simulation. Trans. Chin. Soc. Agric. Eng. 2022, 38, 10–22. [Google Scholar] [CrossRef]
- Wang, Y.Y.; Chen, G.P.; Sun, H.; Liu, S.; Wang, C.; Hao, J.J. Design and experiments of a vertical aerobic composting reactor based on EDEM. Trans. Chin. Soc. Agric. Eng. 2023, 39, 171–179. [Google Scholar] [CrossRef]
- Kang, Q.X.; Zhang, G.Z.; Zheng, K.; Liu, H.P.; Tang, N.R.; Liu, W.R.; Ji, C. Design and experiment of the spoon clip type seed metering device for Allium chinense. Trans. Chin. Soc. Agric. Eng. 2023, 39, 15–25. [Google Scholar] [CrossRef]
- Liu, C.L.; Li, Y.N.; Song, J.N.; Ma, T.; Wang, M.M.; Wang, X.J.; Zhang, C. Performance analysis and experiment on fertilizer spreader with centrifugal swing disk based on EDEM. Trans. Chin. Soc. Agric. Eng. 2017, 33, 32–39. [Google Scholar] [CrossRef]
- Sugirbay, A.M.; Zhao, J.; Nukeshev, S.O.; Chen, J. Determination of pin-roller parameters and evaluation of the uniformity of granular fertilizer application metering devices in precision farming. Comput. Electron. Agric. 2020, 179, 105835. [Google Scholar] [CrossRef]
- Yang, Z.; Ou, Z.W.; Sun, J.F.; Duan, J.L.; Song, S.S.; Duan, J.; Song, S. Development of variable rate fertilizer applicator based on distribution characteristics of banana roots. Trans. Chin. Soc. Agric. Eng. 2020, 36, 1–10. [Google Scholar] [CrossRef]
- Hu, J.; He, J.C.; Wang, Y.; Wu, Y.P.; Chen, C.; Ren, Z.Y.; Li, X.X.; Shi, S.J.; Du, Y.P.; He, P.X. Design and study on lightweight organic fertilizer distributor. Comput. Electron. Agric. 2020, 169, 105149. [Google Scholar] [CrossRef]
- Song, C.C.; Wang, G.B.; Zhao, J.; Wang, J.H.; Yan, Y.; Wang, M.; Zhou, Z.Y.; Lan, Y.B. Research progress on the particle deposition and distribution characteristics of granular fertilizer application. Trans. Chin. Soc. Agric. Eng. 2022, 38, 59–70. [Google Scholar] [CrossRef]
- Song, C.C.; Zhou, Z.Y.; Wang, G.B.; Wang, X.W.; Zang, Y. Optimization of the groove wheel structural parameters of UAV-based fertilizer apparatus. Trans. Chin. Soc. Agric. Eng. 2021, 37, 1–10. [Google Scholar] [CrossRef]
- Wang, Y.; Xia, Z.L.; He, J.C.; Zhao, J.; Liu, H.B.; He, P.X. Design and Experiment of Quantitative Fertilizer Distributor with Vertical Screw. J. Agric. Mech. Res. 2018, 40, 88–92. [Google Scholar] [CrossRef]
- Wei, G.J.; Qi, B.; Jiao, W.; Shi, S.; Jian, S.C. Design and Experiment of Mechanical Forced Fertilizing Device for Paddy Field. Trans. Chin. Soc. Agric. Eng. 2020, 51, 154–164. [Google Scholar] [CrossRef]
- Dun, G.Q.; Ye, J.; Xia, W.Z.; Yang, Y.Z.; Yu, C.L.; Guo, Y.L.; Ji, W.Y. Design and simulation test of arc gear fertilizer apparatus. J. China Agric. Univ. 2019, 24, 111–120. [Google Scholar] [CrossRef]
- Liu, X.D.; Lü, Q.Q.; Yang, L.Q.; Li, G.X. Design and Test of Peanut Root-Disk Full-Feeding Longitudinal Axial Flow Pod-Picking Device. Agriculture 2023, 13, 1103. [Google Scholar] [CrossRef]


| Project | Parameter | Unit | Values |
|---|---|---|---|
| Fertilizer granules | Poisson’s ratio | / | 0.25 |
| Shear modulus | pa | 2.6 × 10⁷ | |
| Density | kg/m3 | 1861 | |
| Fertilizer-discharge box and swing rod combination | Poisson’s ratio | / | 0.394 |
| Shear modulus | pa | 1.3 × 10⁹ | |
| Density | kg/m3 | 1240 | |
| Fertilizer granules and fertilizer granules | Restitution | / | 0.11 |
| Static friction coefficient | / | 0.30 | |
| Rolling friction coefficient | / | 0.10 | |
| Fertilizer granules, fertilizer-discharge box, and swing-rod combination | Restitution | / | 0.41 |
| Static friction coefficient | / | 0.32 | |
| Rolling friction coefficient | / | 0.18 |
| Parameter | Unit | Value |
|---|---|---|
| Time step | s | 9.25 × 10⁻⁶ |
| Acceleration | m·s−2 | 0 |
| Stiffness and damping coefficient | / | 0 |
| Local damping coefficient | / | 0 |
| Levels | Wedge Angle of PMPB X1/(°) | Inclination Angle of APP X2/(°) | Operating Frequency of SRC X3/(times/min) | FGPB X4/mm |
|---|---|---|---|---|
| −2 | 35.00 | 40.00 | 100.00 | 3.00 |
| −1 | 40.00 | 42.50 | 125.00 | 4.25 |
| 0 | 45.00 | 45.00 | 150.00 | 5.50 |
| 1 | 50.00 | 47.50 | 175.00 | 6.75 |
| 2 | 55.00 | 50.00 | 200.00 | 8.00 |
| Test No. | Experimental Factors | Test Index | ||||
|---|---|---|---|---|---|---|
| x1/(°) | x2/(°) | x3/(times/min) | x4/mm | Y1/% | Y2/% | |
| 1 | −1 | −1 | −1 | −1 | 6.50 | 1.56 |
| 2 | 1 | −1 | −1 | −1 | 19.92 | 4.86 |
| 3 | −1 | 1 | −1 | −1 | 24.16 | 5.85 |
| 4 | 1 | 1 | −1 | −1 | 23.41 | 5.52 |
| 5 | −1 | −1 | 1 | −1 | 14.71 | 3.28 |
| 6 | 1 | −1 | 1 | −1 | 11.61 | 3.22 |
| 7 | −1 | 1 | 1 | −1 | 17.04 | 4.42 |
| 8 | 1 | 1 | 1 | −1 | 14.70 | 3.84 |
| 9 | −1 | −1 | −1 | 1 | 17.59 | 4.20 |
| 10 | 1 | −1 | −1 | 1 | 29.00 | 5.85 |
| 11 | −1 | 1 | −1 | 1 | 20.36 | 4.19 |
| 12 | 1 | 1 | −1 | 1 | 25.82 | 5.45 |
| 13 | −1 | −1 | 1 | 1 | 22.72 | 5.31 |
| 14 | 1 | −1 | 1 | 1 | 19.09 | 4.73 |
| 15 | −1 | 1 | 1 | 1 | 16.04 | 4.20 |
| 16 | 1 | 1 | 1 | 1 | 11.61 | 3.22 |
| 17 | −2 | 0 | 0 | 0 | 23.89 | 5.19 |
| 18 | 2 | 0 | 0 | 0 | 33.41 | 7.16 |
| 19 | 0 | −2 | 0 | 0 | 12.40 | 2.92 |
| 20 | 0 | 2 | 0 | 0 | 21.01 | 4.03 |
| 21 | 0 | 0 | −2 | 0 | 25.97 | 5.30 |
| 22 | 0 | 0 | 2 | 0 | 15.35 | 3.62 |
| 23 | 0 | 0 | 0 | −2 | 8.21 | 2.19 |
| 24 | 0 | 0 | 0 | 2 | 19.13 | 3.80 |
| 25 | 0 | 0 | 0 | 0 | 31.73 | 7.17 |
| 26 | 0 | 0 | 0 | 0 | 30.29 | 6.84 |
| 27 | 0 | 0 | 0 | 0 | 31.73 | 7.17 |
| 28 | 0 | 0 | 0 | 0 | 27.41 | 6.18 |
| 29 | 0 | 0 | 0 | 0 | 31.73 | 7.17 |
| 30 | 0 | 0 | 0 | 0 | 27.41 | 6.18 |
| 31 | 0 | 0 | 0 | 0 | 30.29 | 6.84 |
| 32 | 0 | 0 | 0 | 0 | 32.41 | 7.56 |
| 33 | 0 | 0 | 0 | 0 | 30.73 | 7.17 |
| 34 | 0 | 0 | 0 | 0 | 32.41 | 7.56 |
| 35 | 0 | 0 | 0 | 0 | 30.29 | 6.84 |
| 36 | 0 | 0 | 0 | 0 | 30.73 | 7.17 |
| Index | Source | Sum of Squares | Freedom | F | p |
|---|---|---|---|---|---|
| Y1 | Model | 1982.12 | 11 | 34.21 | <0.0001 ** |
| x1 | 51.28 | 1 | 9.74 | 0.0047 ** | |
| x2 | 35.58 | 1 | 6.75 | 0.0157 * | |
| x3 | 152.41 | 1 | 28.94 | <0.0001 ** | |
| x4 | 112.75 | 1 | 21.41 | 0.0001 ** | |
| x1x2 | 25.4 | 1 | 4.82 | 0.038 * | |
| x1x3 | 115.78 | 1 | 21.98 | <0.0001 ** | |
| x2x3 | 54.32 | 1 | 10.31 | 0.0037 ** | |
| x2x4 | 105.78 | 1 | 20.08 | 0.0002 ** | |
| x22 | 444.67 | 1 | 84.43 | <0.0001 ** | |
| x32 | 240.06 | 1 | 45.58 | <0.0001 ** | |
| x42 | 644.11 | 1 | 122.3 | <0.0001 ** | |
| Residual | 126.4 | 24 | |||
| Lack of fit | 95.35 | 13 | 2.6 | 0.0606 | |
| Error | 31.06 | 11 | |||
| Sum | 2108.53 | 35 | |||
| Y2 | Model | 91.23 | 12 | 36.12 | <0.0001 ** |
| x1 | 2.42 | 1 | 11.49 | 0.0025 ** | |
| x2 | 1.45 | 1 | 6.89 | 0.0151 * | |
| x3 | 3.1 | 1 | 14.71 | 0.0008 ** | |
| x4 | 2.55 | 1 | 12.11 | 0.002 ** | |
| x1x2 | 1.53 | 1 | 7.25 | 0.013 * | |
| x1x3 | 4.08 | 1 | 19.39 | 0.0002 ** | |
| x2x3 | 1.82 | 1 | 8.66 | 0.0073 ** | |
| x2x4 | 5.93 | 1 | 28.17 | <0.0001 ** | |
| x12 | 1.15 | 1 | 5.48 | 0.0283 * | |
| x22 | 23.93 | 1 | 113.7 | <0.0001 ** | |
| x32 | 12.24 | 1 | 58.17 | <0.0001 ** | |
| x42 | 31.03 | 1 | 147.45 | <0.0001 ** | |
| Residual | 4.84 | 23 | |||
| Lack of fit | 2.65 | 12 | 1.11 | 0.4358 | |
| Error | 2.19 | 11 | |||
| Sum | 96.07 | 35 |
| No. | Y1/% | Y2/% |
|---|---|---|
| 1 | 10.71 | 3.45 |
| 2 | 11.89 | 3.77 |
| 3 | 11.42 | 4.18 |
| 4 | 10.53 | 2.98 |
| 5 | 10.77 | 3.17 |
| average value | 11.06 | 3.51 |
| Operating Frequency of SRC X3/(times/min) | Y1/% | Y2/% |
|---|---|---|
| 100 | 14.17 | 4.76 |
| 120 | 12.36 | 4.33 |
| 140 | 12.24 | 4.26 |
| 160 | 11.68 | 3.98 |
| 180 | 11.39 | 3.68 |
| 200 | 10.84 | 4.12 |
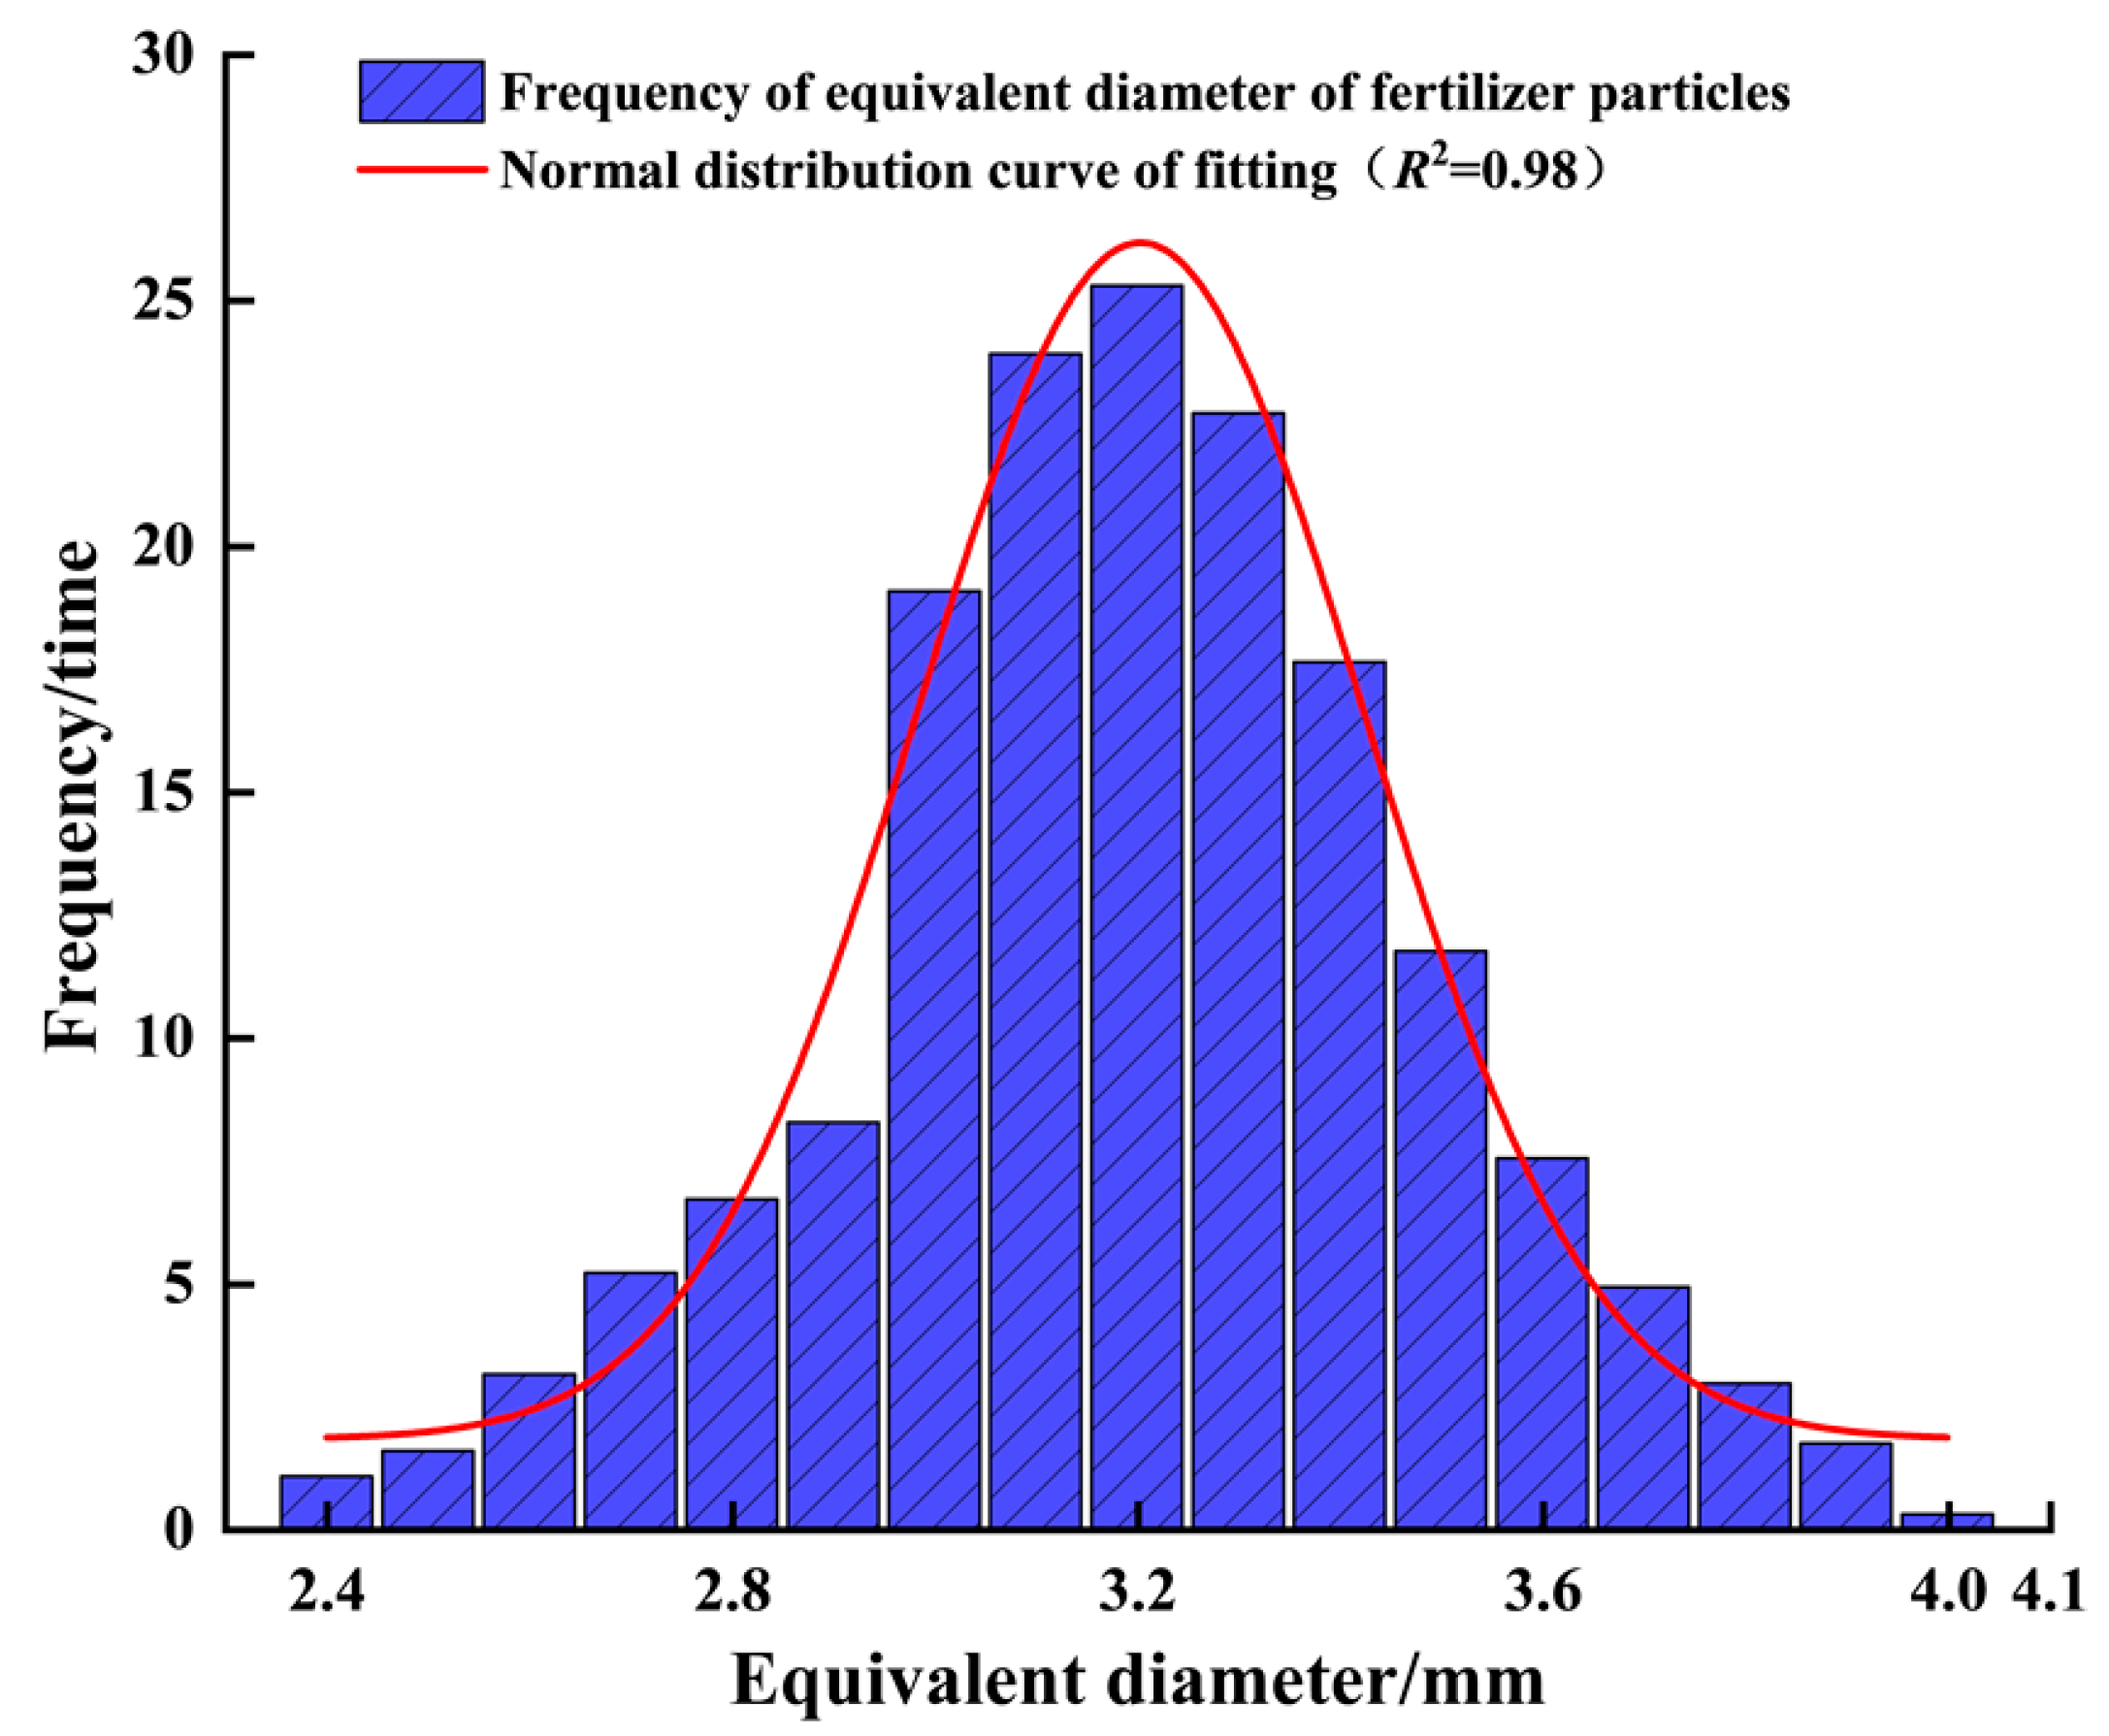
| Fertilizer Types | Equivalent Diameter/mm | Density (kg·m−3) | Sphericity/% | Angle of Repose/° |
|---|---|---|---|---|
| Lanjingling | 3.08 | 820.14 | 94 | 27.7 |
| Changqingshu | 3.19 | 1122.5 | 92 | 29.3 |
| Shidanli | 3.44 | 915.3 | 83 | 33.9 |
| Projects | Y1/% | Y2/% | |
|---|---|---|---|
| Lanjingling | 1 | 9.93 | 3.71 |
| 2 | 9.74 | 3.69 | |
| 3 | 9.94 | 3.64 | |
| Average value | 9.87 | 3.68 | |
| Changqingshu | 1 | 10.51 | 3.75 |
| 2 | 10.25 | 3.69 | |
| 3 | 10.77 | 3.27 | |
| Average value | 10.51 | 3.57 | |
| Shidanli | 1 | 10.87 | 3.52 |
| 2 | 10.77 | 3.51 | |
| 3 | 11.15 | 3.65 | |
| Average value | 10.93 | 3.56 | |
Disclaimer/Publisher’s Note: The statements, opinions and data contained in all publications are solely those of the individual author(s) and contributor(s) and not of MDPI and/or the editor(s). MDPI and/or the editor(s) disclaim responsibility for any injury to people or property resulting from any ideas, methods, instructions or products referred to in the content. |
© 2024 by the authors. Licensee MDPI, Basel, Switzerland. This article is an open access article distributed under the terms and conditions of the Creative Commons Attribution (CC BY) license (https://creativecommons.org/licenses/by/4.0/).
Share and Cite
Chen, L.; Deng, X.; Liu, Z.; Mou, X.; Ma, X.; Chen, R. Design and Test of Disturbed Fertilizer Strip-Ejection Device with Vertical Pendulum Bar Based on Discrete Element Method. Agriculture 2024, 14, 635. https://doi.org/10.3390/agriculture14040635
Chen L, Deng X, Liu Z, Mou X, Ma X, Chen R. Design and Test of Disturbed Fertilizer Strip-Ejection Device with Vertical Pendulum Bar Based on Discrete Element Method. Agriculture. 2024; 14(4):635. https://doi.org/10.3390/agriculture14040635
Chicago/Turabian StyleChen, Lintao, Xiangwu Deng, Zhaoxiang Liu, Xiangwei Mou, Xu Ma, and Rui Chen. 2024. "Design and Test of Disturbed Fertilizer Strip-Ejection Device with Vertical Pendulum Bar Based on Discrete Element Method" Agriculture 14, no. 4: 635. https://doi.org/10.3390/agriculture14040635