
Intercropping Industrial Hemp and Cowpea Enhances the Yield of Squash—A Pollinator-Dependent Crop

Department of Natural Resources and Environmental Design, North Carolina A&T State University, Greensboro, NC 27411, USA
*
Author to whom correspondence should be addressed.
Agriculture 2024, 14(4), 636; https://doi.org/10.3390/agriculture14040636
Submission received: 7 March 2024
/
Revised: 15 April 2024
/
Accepted: 16 April 2024
/
Published: 20 April 2024
(This article belongs to the Special Issue Bees as a Tool for Agricultural Production)
Abstract
:Cultural crop-production practices are not only engineered to minimize pest incidence but also improve resource use efficiency and increase the diversity of habitat for beneficial insects that provide pollination services. With the increasing cultivation of industrial hemp and the benefits associated with the cultivation of multiple crops, its integration into a polyculture cropping system remains to be evaluated. We intercropped two pollinator-attractive crops, hemp and cowpea, with squash, a pollinator-dependent crop, to evaluate the impact of pollinator abundance and diversity on crop yield. Intercropping significantly increased the overall abundance of pollinators with 79.1% recorded from the intercropping systems compared to 21.9% in the monocropping systems. Sweat bees and bumble bees were the most abundant bees, and Squash+Cowpea was the most diverse cropping system. Intercropping significantly increased the yield of squash with higher squash yield (155%) in Hemp+Squash and (161%) in Squash+Cowpea than in squash monocrop. Also, intercropping resulted in higher hemp yield (64%) in Hemp+Cowpea and (165%) in Hemp+Squash compared to hemp monocrop. This study demonstrated that agricultural systems such as intercropping that are designed to attract pollinators are much more productive by not only improving crop yield but also growers’ returns on investments.
1. Introduction
Pollinators, especially bees, are an integral component of biodiversity, providing valuable ecological services through pollination of crops and complementary support for food security. Annually, pollinators contribute more than USD 209 billion to world food production [1], and USD 16 billion to the United States economy [2]. Bee-pollinated crops, which include pollinator-dependent crops (PDCs) such as squash (Cucurbita pepo L.), blueberries (Vaccinium corymbosum), watermelon (Citrullus lanatus), apple (Malus domestica), and okra (Abelmoschus esculentus), contribute about one-third of the total human dietary supply [3,4]. In recent years, the production of these crops has risen concomitantly with population growth. For instance, the total hectares for pollinator-dependent crops produced in the United States increased by 36% from 1992 to 2009, representing a 32% rise in food production, valued at over USD 50 billion [2,5,6].
Despite their economic importance, there have been reports of bee decline associated with stressors, including the loss of flower-rich plants, the widespread use of pesticides in agricultural systems, and climate change [7,8,9,10,11]. This trend raises concerns about the production of pollinator-dependent crops and its impact on food security. More importantly, this hastens the need to investigate measures to integrate floral resources into cropping systems to create a mutual relationship where pollinators obtain nectar and pollen, and, in return, plants receive the service of pollination. Intercropping is one such system and involves the practice of growing two or more crops simultaneously on the same field during the same growing season [12]. This system is recognized for increasing crop yield and insect diversity. However, the impact of introducing hemp into the intercropping system on both pollinator abundance and crop yield remains unexplored.
Industrial hemp (Cannabis sativa L.) cultivation is expanding worldwide, with the United States reporting an increase in acreage from 0 in 2013 to over 90,000 acres in 2018 [13]. The flowers of both the grain and fiber varieties produce profuse pollen (but no nectar) and attract bees and other pollinators [14,15,16,17,18]. According to [19], the acreage harvested for grain and fiber in the United States was estimated at over 24,000 acres, an indication that growers are turning towards scaling up the cultivation of fiber and grain varieties. Despite the resource efficiency of intercropping, there has been limited research on the impact of intercropping hemp, a crop that has resurfaced in the United States as the “new crop on the farm”, requiring about 60 and 273 kg ha−1 N fertilizer, contingent on available soil N and weather conditions [20]. This requirement of hemp for nitrogen can be supplemented by cowpea, (Vigna unguiculata L. Walp), a legume crop grown worldwide and capable of fixing about 116 kg N ha−1 N2 [16,21]. In the United States, cowpea is grown widely in California, Texas, and the Southern States [22]. However, cowpea and cereal intercropping has been the dominant practice to increase N cycling in farming systems [23]. In addition to fixing N2, cowpea is attractive to pollinators (pollinator-attractive crop (PAC)) because of its nectariferous nature and has resulted in increased yields of pollinator-dependent crops such as okra, squash, and watermelon in an intercropping system [24,25]. Squash (Cucurbita pepo L.) is an important vegetable in the United States. Its production has been threatened by, among other factors, the declining population of pollinators. Research is required to investigate the effect of intercropping hemp, cowpea, and squash. Such a system could enhance the presence of pollinators in the crop environment to increase squash yield. It would also provide additional benefits through cowpea’s ability to fix atmospheric N, which would reduce the application of synthetic N fertilizers, thus reducing financial input for hemp cultivation. Furthermore, the system buffers against total crop loss when hemp is destroyed if the level of delta-tetrahydrocannabinol (THC) exceeds the acceptable threshold of 0.3%.
Another important contributing factor to this study is the fact that, in a previous survey of organic growers, over 90% of respondents indicated that they would grow industrial hemp if the crop allowed them to diversify their farm production [26]. Our objective here was to evaluate the effect of intercropping hemp, cowpea, and a pollinator-dependent crop on pollinator abundance, diversity, and crop yield.
2. Materials and Methods
2.1. Experimental Design
A field experiment intercropping hemp (Joey variety), cowpea (Pinkeye Purple Hull variety), and squash (Tempest Yellow Summer variety) was conducted at the North Carolina Agricultural and Technical State University Research Farm in Greensboro, North Carolina, USA (latitude 36.068965/longitude −79.745647), during summer 2022. The experiment was conducted in a field that had not been cultivated for over a decade before the study. The soil is classified as Mecklenburg sandy clay loam and categorized as fine, mixed, active, thermic Ultic Hapludalfs.
The experiment consisted of three intercrop treatments, namely Hemp+Cowpea, Squash+Cowpea, and Hemp+Squash; and three monocrop treatments, comprising Hemp Monocrop, Squash Monocrop, and Cowpea Monocrop. The intercrop treatments consisted of two rows for each crop, each 5 m long, with 2 m spacing between each treatment. The monocrop treatments comprised two rows each of hemp, squash, and cowpea, and the control plots were separated from the intercrop plots by two rows of field corn. The monocrop plot was set up 9 m away from the intercrop treatments, and each treatment was separated by two rows of field corn. Both intercrop and monocrop treatments were replicated four times in a randomized complete block design. Cowpea was planted on the 10 May, hemp on the 25 May, and squash on the 3 June to synchronize the flowering of pollinator-attractive crops with that of the pollinator-dependent crop. Cowpea and squash seeds were planted manually at a depth of approximately 0.001–0.015 m below the soil surface and 0.4 m apart in the row. Hemp seeds were planted using a planter at 0.013 m below the soil surface, spaced about 3 cm apart within rows. The experimental setup was mulched with wheat straw about four inches in thickness on all plots. No insecticides were applied, and plots were drip-irrigated as needed.
At the seedling stage, hemp received fish fertilizer at the manufacturer’s recommended rate and ammonium nitrate (34-0-0) as broadcast applications (100 kg N ha−1) once during the vegetative and flowering stages. Squash plants were side-dressed once with 10-10-10 fertilizer three weeks after planting.
2.2. Pollinator Sampling
Pan traps (blue, yellow, and white colored) and direct visual counts were used to sample pollinators within each treatment. Both methods were applied to account for a comprehensive assessment of pollinator abundance and diversity. As described by [24], traps consisted of 16 oz. squat polypropylene deli bowls painted with UV-bright fluorescent blue paint (blue trap) or yellow paint (yellow trap) and unpainted (white trap). The trap setup was carried out by gluing individual 16 oz unpainted bowls onto a 2.5 cm plant prop, and three of these were placed between each of the two rows of each treatment for the entire sampling period. At flowering, one of each of the three traps was placed inside each of the unpainted bowls on the prop and filled with approximately 250 mL of soapy water solution. The traps were placed so that they were at the same level as the crop canopy. Traps were set out weekly from 6 July to 3 August, between 08:00 to 10:00 a.m., and collected after 24 h. Each colored pan trap was drained, and the contents were placed in vials containing 70% ethanol and taken to the laboratory, where they were stored in a refrigerator for later identification with an SZMT2 stereomicroscope. Traps were collected in the order they were placed to ensure that all traps were available to insects for roughly the same duration.
Direct visual counts of pollinators were carried out by counting the number of pollinator types (honeybees, bumble bees, carpenter bees, and wasps) observed on each 5 m row. This was performed by walking through each row and counting using “snapshot”, in which pollinators were counted for 60 s. For each treatment, the visual count of pollinators started about 38 days after planting (DAP), which corresponded to the first incidence of pollinators on the experimental plots. Counts were conducted weekly, from 08:00 to 10:00 a.m., for five weeks, from 30 June to 28 July 2022. All observations were carried out by a single trained technician for consistency.
2.3. Assessment of Crop Yield
At maturity, squash fruits in the intercrop and control plots were manually harvested three times a week for five weeks, from 11 July to 13 August. Twenty-five cowpea pods from each treatment were randomly harvested from each of the 5 m rows 78 days after planting. Harvested cowpea pods and squash fruits were weighed using an Ohaus™ T51P scale (Ohaus Corporation, Parsippany, NJ, USA). At 70 DAP, the panicle of 20 hemp plants per treatment was bagged to prevent insect pest damage. About five weeks later (108 DAP), the stalks of the entire plants were harvested with the aid of a handheld Fiskars® Bypass Pruner (The Home Depot®, Greensboro, NC, USA). Harvested hemp stalks with panicles in bags were sun-dried for two weeks to facilitate seed collection. Hemp seeds were collected through the manual threshing of stalks and sieving, using USA standard testing sieve number 8 (Gilson Company Inc., Lewis Center, OH, USA). Seeds per treatment were weighed using an Ohaus NV422 Navigator scale (Ohaus Corporation, Parsippany, NJ, USA), and data were recorded.
2.4. Statistical Analyses
All data were tested for normality, and homoscedasticity of variance and subsequently analyzed using the “car”, “lme4”, and “agricolae” packages in R version 4.2.3 [27,28,29,30]. The role of cropping systems in pollinator abundance (weekly and total counts) was examined using a Generalized Linear Mixed Model (GLMM) with fixed effects, and diversity (Shannon, Evenness, and Dominance) indices were computed using PAST [31]. Parameters (factors, e.g., crop yield) that were more than two were tested in a one-way analysis of variance (ANOVA) (when parametric assumptions were satisfied) or Kruskal–Wallis test (when assumptions were violated), with the significance criterion set at 5%. The Wilcoxon test was used for two-level factors that violated the parametric assumptions. Means of significant analyses were subjected to post hoc analysis, using Tukey’s HSD for parametric tests, and Kruskal–Wallis multiple comparison tests (for non-parametric tests) with Bonferroni correction for false-error detection. The “multcompView” and “emmeans” packages were used for GLMM with p-value adjusted using “sidak” correction factor.
With PAST [31], the Shannon Index [32] H′ = − ∑ pi ln(pi) was computed, where H′ = Shannon Index; pi = the proportion of individuals found in species i and is estimated as pi = ni/N; ni = number of individuals in species i; and N = total number of individuals in the community. The Shannon Index spans from 0 for communities containing only a single taxon to higher values for communities with a multitude of taxa, each represented by relatively few individuals.
The Evenness Index (E) normalizes the Shannon Index (H′) to a value between varies from 0 and 1, and an index value of 1 means that all groups are evenly represented by the same frequency. The Evenness Index (E) = H′/log(k), where E = Evenness, H′ = Shannon Index, and k = number of species per group in the community. The H′ Index is lowest for a single category (H′ = 0) and the highest, Hmax = ln S [33]. While Evenness varies from 0 to 1, as obtained from H′/Hmax, the Dominance (D) remains the notional inverse of Even-ness [33]. The Margalef and Berger–Parker Indices were also used to decipher the pollinator diversity.
3. Results
3.1. Effects of Intercropping on Pollinator Abundance and Diversity in the Cropping Systems
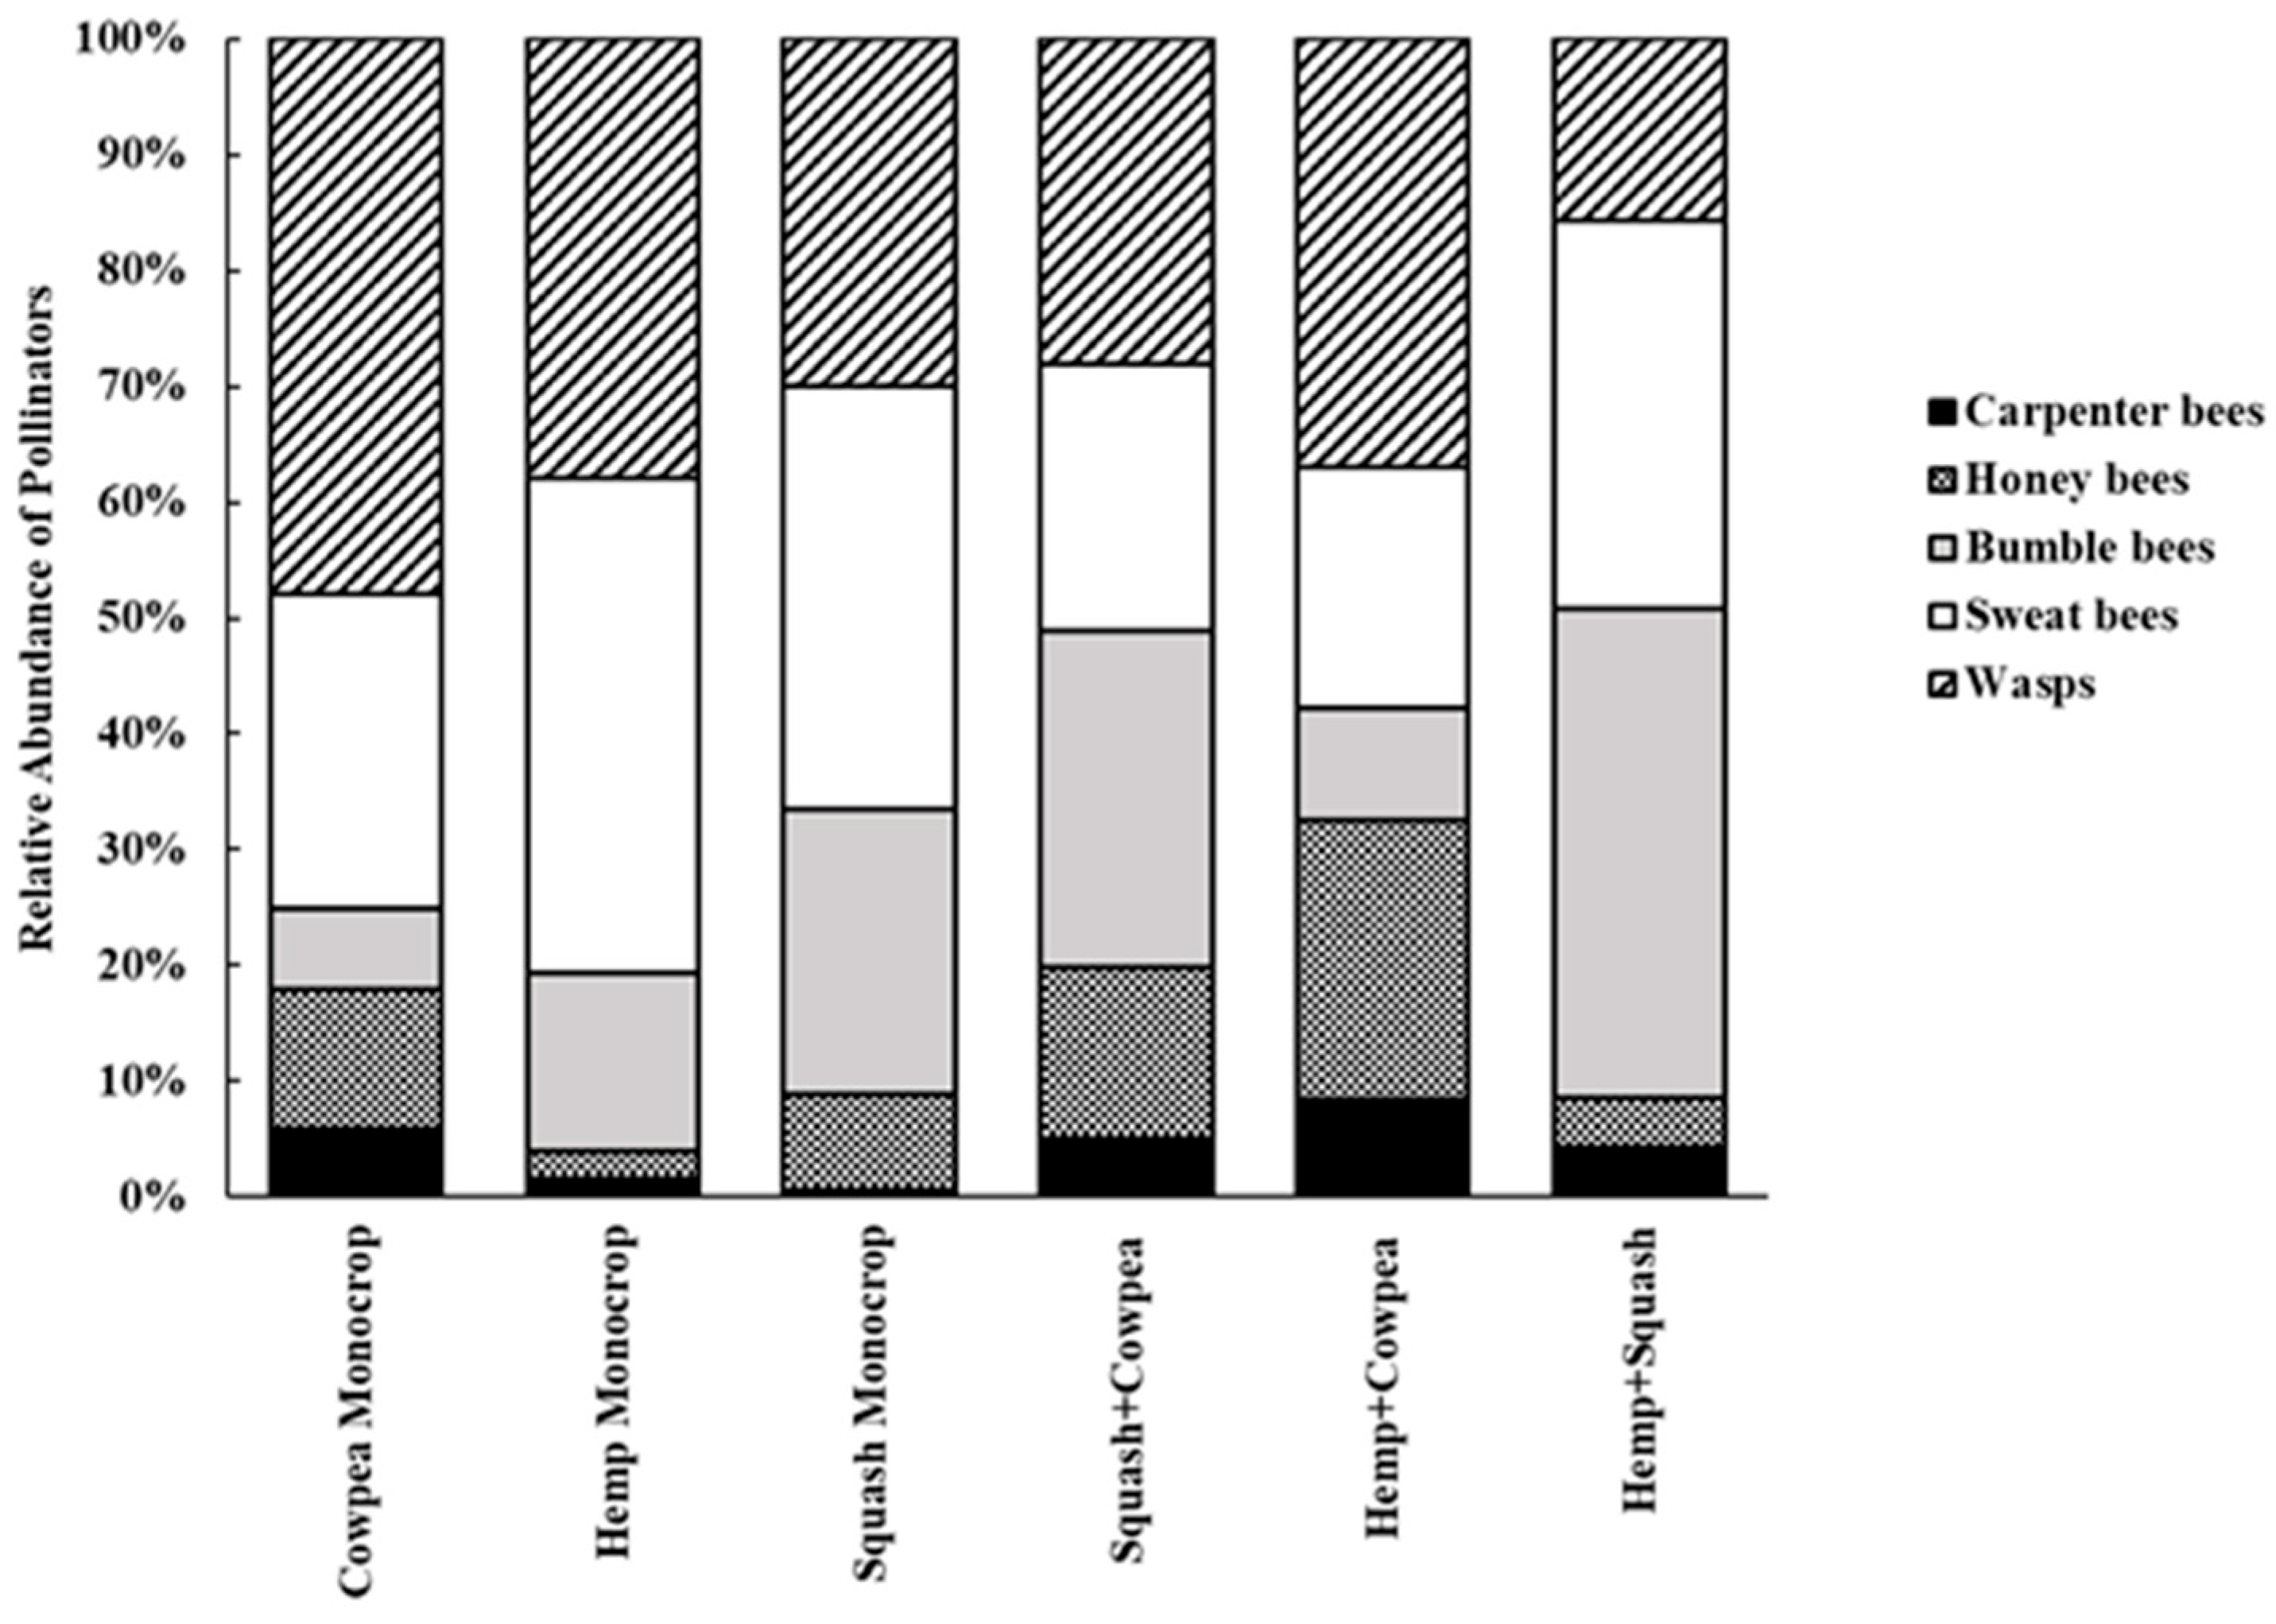
During the entire sampling period, a total of 2848 pollinators representing five pollinator types in varying proportions (5% carpenter bees, 13% honeybees, 24% bumble bees, 27% sweat bees, and 30% wasps) were recorded from all the cropping systems. Figure 1 shows the relative abundance as a percentage of the total count of each pollinator type in the six cropping systems, with carpenter bees being more abundant in the intercropping systems (Hemp+Cowpea (36%), Squash+Cowpea (32%), and Hemp+Squash (17.3%)) than in the monocropping systems, where Squash Monocrop recorded the least (0.7%) carpenter bees. Similarly, bumble bees were highest in the intercropping systems (Squash+Cowpea (40.8%) and Hemp+Squash (37.9%)) than in the monocropping systems, with Hemp Monocrop recording the least (2.9%). Sweat bees were also the lowest pollinators in the monocropping systems, with only 7.2% recorded for Hemp Monocrop, compared to a higher occurrence in the intercropping systems, with 27.7% for Hemp+Squash, and 29.0% for Squash+Cowpea. Furthermore, honeybees were least abundant in the monocropping systems, with 10% recorded for Cowpea Monocrop and the least (0.8%) for Hemp Monocrop, whereas Squash+Cowpea and Hemp+Cowpea intercropping systems had abundant honeybees, 37.4% and 40.8%, respectively. Wasps had the least occurrence in Hemp Monocrop (5.7%) and Squash Monocrop (5.9%) but higher numbers (18.1%) in the Cowpea Monocrop; however, this was less compared to the numbers recorded in the Hemp+Cowpea (27.6%) and Squash+Cowpea (31.4%) intercropping systems.
Figure 2 indicates the relative abundance of each pollinator type from the total count in each cropping system over the entire sampling period. In the Cowpea Monocrop system, wasps (48%) were the major pollinators, followed by sweat bees (27.1%) and honeybees (12.0%), while in the Hemp Monocrop system, sweat bees were the majority, (42.6%) followed by wasps (38.0%) and bumble bees (15.5%). On the other hand, in the Squash Monocrop system, sweat bees (36.5%), wasps (30.0%), and bumble bees (24.7%) were the major pollinators. Meanwhile, the Squash+Cowpea intercropping system was dominated by bumble bees (29.1%), wasps (28.1%), and sweat bees (23.0%). The Hemp+Cowpea intercrop had wasps (37.0%), honeybees (24.2%), and sweat bees (20.9%) as the major pollinators. Bumble bees (42.1%) and sweat bees (33.6%) were the most abundant pollinators in the Hemp+Squash intercropping.
The weekly pollinator abundance indicates that, in week one, significant differences were observed among the six cropping systems (X2 = 52.23, df = 5; p < 0.001), with more pollinators in the Squash+Cowpea intercrop (15.5 ± 4.29) compared to the other cropping systems (Figure 3). In week two, statistically different numbers (X2 = 42.27, df = 5; p < 0.001) of pollinators were recorded among the cropping systems, with the highest numbers recorded for the Cowpea Monocrop (17.25 ± 8.6), Squash+Cowpea intercrop (12.4 ± 3.2), and Hemp+Cowpea intercrop (10.85 ± 3.0). Among the five sampling weeks, the pollinator count peaked at week three (Figure 3), with the highest number of pollinators recorded for Cowpea Monocrop and Squash+Cowpea, a number that was significantly different (X2 = 54.19, df = 5; p < 0.001) from the other cropping systems. For Squash Monocrop, the peak was in the fourth week (Figure 3); however, during this sampling week, Cowpea Monocrop and Squash+Cowpea recorded significantly (X2 = 56.06, df = 5; p < 0.001) more pollinators compared to the other cropping systems. Similarly, in the fifth week, Cowpea Monocrop and Squash+Cowpea recorded significantly (X2 = 55.76, df = 5; p < 0.001) more pollinators compared to the other cropping systems. Overall, for each sampling week, there were more pollinators in the Squash+Cowpea intercrop and the Cowpea Monocrop compared to the other cropping systems (Figure 3).
The total pollinators captured during the entire sampling period in each cropping system is presented in Figure 4. Among the six cropping systems, there was a significant difference (X2 = 183.57, df = 5, p < 0.001), with pollinator counts higher on Cowpea Monocrop (16.2 ± 3.36) and Squash+Cowpea (15.52 ± 1.17) compared to the other cropping systems (Figure 4). Overall, there was a significant difference (Wilcoxon: W = 5142.5; p = 0.0023) in the total number of pollinators recorded between the two systems, with 79.1% recorded from the intercrop systems (33.8% on Squash+Cowpea, 22.7% on Hemp+Cowpea, and 21.7% on Hemp+Squash) compared to 21.9% from the monocrop systems (11.4% on Cowpea Monocrop, 6.0% on Squash Monocrop, and 4.5% on Hemp Monocrop).
Combining all pollinator types within each cropping system over the five-week sampling period, we found that Hemp Monocrop attracted the least diverse community of pollinators (H′ = 1.17), the highest Dominance, and the least equitable spread (E = 0.65) (Table 1). Cowpea Monocrop and Squash Monocrop had comparable Shannon (1.31) and Evenness (0.74) Indices, while Squash+Cowpea intercrop was most diverse (H′ = 1.49), evenly represented with a low Dominance Index (Table 1). The Margalef Index was highest (0.82) in Hemp Monocrop and lowest in Squash+Cowpea intercrop (0.58), while Berger–Parker’s Index was lowest in Squash+Cowpea intercrop (0.29) and Cowpea Monocrop (0.48) (Table 1).
3.2. Effects of Intercropping on Crop Yield
Table 2 shows that the yield among the squash intercropped systems was significantly different (H = 20.03; p < 0.001), with a higher percent for squash yield (155%) in the Hemp+Squash and (161%) in the Squash+Cowpea than in the Squash Monocrop. Similarly, the hemp systems showed a significantly (H = 12.95, df = 2, p < 0.01) higher hemp yield of 64% and 165% for the Hemp+Cowpea intercrop and Hemp+Squash intercrop, respectively, than the Hemp Monocrop. On the other hand, the cowpea yield was higher but not significant in the monocropping system than in the intercropping systems (Table 2).
4. Discussion
Sustainable agricultural practices that enhance pollination are urgently required given the increasing demand for pollinator-dependent crops and the current global decline in the population of pollinators. Intercropping systems rich in floral resources have been shown to attract abundant and diverse pollinators, resulting in increased crop yield [25]. This could be attributed to the mutual relationship whereby pollinators visit plants for their floral sources (nectar and pollen) and, in the process, transfer pollen from the anther to the stigma, resulting in pollination. To the best of our knowledge, the intercropping of hemp, which produces profuse pollen, and cowpea, which produces nectar and fixes atmospheric N, with a pollinator-dependent crop has yet to be studied. In this study, we evaluated the effect of intercropping hemp, cowpea, and squash (a pollinator-dependent crop) on crop yield. This combination and the inherent benefits could be important for farmers, especially in the wake of increased interest in hemp cultivation [26].
Pollinator assemblage in all cropping systems in our study was dominated by four pollinator types, namely honeybees (13%), bumble bees (24%), sweat bees (27%), and wasps (30%), insects similar to those documented in both cowpea and hemp monocrop [14,18,24,34], and cowpea intercropped with pollinator-dependent crops [25]. In addition, our findings reveal that the proportions of the different pollinator types among the six cropping systems were higher in the intercropping systems (Figure 1) compared to the monocrop. Among these pollinator types were native bees, including bumble bees, carpenter bees, and sweat bees, which are known to be efficient at pollinating squash [35,36,37] and were more abundant in the intercropping systems compared to the monocrop (Figure 1). Supporting our findings, Refs. [25,37] also reported the abundance of more native bees in intercropped systems than in monocrop systems. Since native bees cannot be artificially introduced into any agricultural system in adequate numbers, an ecologically sustainable practice such as intercropping, which promotes plant biodiversity within crop fields, could improve the habitat for these bees.
Even though, among the six cropping systems, the monocrop systems recorded fewer pollinator types, a majority of these pollinators (ranging from 27% to 48%) were wasps and sweat bees, except for Cowpea Monocrop, with 12% honeybees; and Hemp Monocrop, 15.5% bumble bees (Figure 2). This is not surprising because, among four hemp varieties grown as monocrops, sweat bees were the most abundant bees, followed by bumble bees [18]; on the other hand, honeybees and sweat bees were the most abundant pollinators recorded among twenty-four cowpea varieties grown as monocrops [24]. According to these authors [18,24], the attractiveness to bees could be a result of their pursuit of the profuse pollen from hemp and the nectariferous nature of cowpeas. This makes their use in an intercropping system vital for increased crop pollination, as well as enhancing bee management and conservation in agricultural environments. In our study, intercropping cowpea and hemp with squash, a pollinator-dependent crop, enhanced pollinator abundance. For example, there were more carpenter bees, bumble bees, honeybees, and wasps in the Squash+Cowpea intercrop compared to the Cowpea Monocrop and Squash Monocrop; similarly, more carpenter bees, bumble bees, and honeybees were recorded in Hemp+Squash intercrop compared to Hemp Monocrop and Squash Monocrop (Figure 2). Within the Hemp+Squash and Squash+Cowpea intercropping systems, there were abundant bumble bees and sweat bees (Figure 2). Our findings suggest that different intercropping systems can benefit diverse pollinator types, and some pollinator types have shared responses to common resources. To some extent the latter scenario may result in resource competition; however, in the long run, it could further strengthen pollination services. This will not only benefit the pollinators; it is a win-win for other fauna up the trophic levels.
Consistent with other studies [25,38,39,40,41], our results also indicated that pollinator abundance within the intercropping system resulted in an improved pollination efficiency and increased crop yield of pollinator-dependent crops. The intercropped systems (Hemp+Squash and Squash+Cowpea) increased squash yield by 155% and 161%, respectively, compared to the squash monocrop system. Both systems recorded the most pollinators, especially those needed for efficient squash pollination, and the Squash+Cowpea intercrop was the most diverse. The efficiency demonstrated by cowpea and hemp in an intercropping system for increased crop yield could be attributed to the fact that these crops are attractive enough to pull in pollinators but not more attractive than the pollinator-dependent crop, thereby avoiding competition for pollinators. In other studies, pollinator diversity or species richness, but not abundance, significantly increased the seed set of pumpkins [38], the fruit set of apples and almonds [39,41], and the yield of bell peppers [40]. This could be attributed to the fact that species’ interaction can impact pollination services. For instance, some pollinators, such as honeybees, modify their forage behavior in the presence of native bees, thereby resulting in higher overall pollination effectiveness [42,43]. In other situations, the complementary effect of wild bees and managed bees enhanced crop pollination [44,45].
In addition to its ability to attract pollinators, cowpea is a crop that enhances soil N, as it contributes to biological N fixation and augments soil conditions. Though hemp is not a pollinator-dependent crop, the Hemp+Cowpea intercrop increased hemp yield by 64% compared to the Hemp Monocrop. This finding aligns with previous research highlighting the potential of incorporating legumes into intercropping systems to improve soil N for increased crop yield [46,47,48]. This may indicate that the specific crop combination of intercropping hemp and cowpea shows resource complementarity, with cowpeas influencing nutrient availability for hemp that could potentially reduce production costs. The overall increase in the yield of squash could also be attributed to the fact that crops were planted in a manner that synchronized the flowering of both the pollinator-dependent crops and pollinator-attractive crops. As is evident in our study (Figure 3), each week, more bees were reported in the Squash+Cowpea intercrop, thereby increasing the pollinator population with the pollination period of squash. Plants that flower asynchronously with others that need them result in reduced fruit and seed yield [25,49].
5. Conclusions
Our findings suggest that the use of cowpea and hemp, which provided floral resources in the intercropping system and enhanced the presence of bees and crop pollination, subsequently resulted in an increased yield of squash. This is because the presence of diverse crops in the same field offers multiple floral resources, including nectar and pollen for pollinators. Plants that are dependent on bees for pollination can benefit from the proximity of the floral resources and, in the process, enhance pollination and yield. Our results also highlight the role of N fixation by cowpea in enhancing soil fertility, which could have resulted in the increased yield of hemp.
Author Contributions
Conceptualization and methodology, B.N.D. and L.E.J.; data curation, G.N.M.; data analyses, I.N.E.; writing—original draft preparation, B.N.D. and I.N.E.; writing—review and editing, all authors; project administration, B.N.D.; funding acquisition, B.N.D. and L.E.J. All authors have read and agreed to the published version of the manuscript.
Funding
This work was supported with funding from Sustainable Agriculture Research and Education (SARE), Project Number LS20-333.
Institutional Review Board Statement
Not applicable.
Data Availability Statement
Data are contained within the article.
Acknowledgments
We hereby acknowledge the assistance of the staff in the Integrated Pest Management (IPM) Laboratory at NC A&T State University including Min Zaw Oo (Research Technician) for their help in setting up experimental plots and data collection.
Conflicts of Interest
The authors declare no conflict of interest.
References
- Gallai, N.; Salles, J.; Settele, J.; Vaissière, B. Economic valuation of the vulnerability of world agriculture confronted with pollinator decline. Ecol. Econ. 2009, 68, 810–821. [Google Scholar] [CrossRef]
- Calderone, N.W. Insect pollinated crops, insect pollinators and US agriculture: Trend analysis of aggregate data for the period 1992–2009. PLoS ONE 2012, 7, e37235. [Google Scholar] [CrossRef]
- Free, J.B. Insect Pollination of Crops, 2nd ed.; Academic Press: London, UK, 1993; p. 684. [Google Scholar]
- Khalifa, S.A.M.; Elshafiey, E.H.; Shetaia, A.A.; El-Wahed, A.A.A.; Algethami, A.F.; Musharraf, S.G.; AlAjmi, M.F.; Zhao, C.; Masry, S.H.D.; Abdel-Daim, M.M.; et al. Overview of bee pollination and its economic value for crop production. Insects 2021, 12, 688. [Google Scholar] [CrossRef]
- Bauer, D.; Wing, I. The macroeconomic cost of catastrophic pollinator declines. Ecol. Econ. 2016, 126, 1–13. [Google Scholar] [CrossRef]
- Reilly, J.R.; Artz, D.R.; Biddinger, D.; Bobiwash, K.; Boyle, N.K.; Brittain, C.; Brokaw, J.; Campbell, J.W.; Daniels, J.; Elle, E.; et al. Crop production in the USA is frequently limited by a lack of pollinators. Proc. R. Soc. B 2020, 287, 20200922. [Google Scholar] [CrossRef] [PubMed]
- Kremen, C.; Williams, N.M.; Thorp, R.W. Crop pollination from native bees at risk from agricultural intensification. Proc. Natl. Acad. Sci. USA 2002, 99, 16812–16816. [Google Scholar] [CrossRef] [PubMed]
- Kleijn, D.; Raemakers, I. A retrospective analysis of pollen host plant use by stable and declining bumble bee species. Ecology 2008, 89, 1811–1823. [Google Scholar] [CrossRef] [PubMed]
- Potts, S.G.; Biesmeijer, J.C.; Kremen, C.; Neumann, P.; Schweiger, O.; Kunin, W.E. Global pollinator declines: Trends, impacts and drivers. Trends Ecol. Evol. 2010, 25, 345–353. [Google Scholar] [CrossRef] [PubMed]
- Desneux, N.; Decourtye, A.; Delpuech, J.M. The sublethal effects of pesticides on beneficial arthropods. Annu. Rev. Entomol. 2007, 52, 81–106. [Google Scholar] [CrossRef]
- Winfree, R.; Aguilar, R.; Vázquez, D.; LeBuhn, G.; Aizen, M.A. Meta-analysis of bees’ response to anthropogenic disturbance. Ecology 2009, 90, 2068–2076. [Google Scholar] [CrossRef]
- Vandermeer, J.H. The Ecology of Intercropping; Cambridge University Press: New York, NY, USA, 1989. [Google Scholar]
- Olsen, D.W.; Thornsbury, S.D.; Scott, S. Hope for Hemp: New Opportunities and Challenges for an Old Crop. In Amber Waves: The Economics of Food, Farming, Natural Resources, and Rural America; United States Department of Agriculture, Economic Research Service: Washington, DC, USA, 2020. [Google Scholar]
- Flicker, N.R.; Poveda, K.; Grab, H. The bee community of Cannabis sativa and corresponding effects of landscape composition. Environ. Entomol. 2020, 49, 197–202. [Google Scholar] [CrossRef] [PubMed]
- Dalio, J.S. Cannabis sativa-An important subsistence pollen source for Apis mellifera. IOSR J. Pharm. Biol. Sci. 2012, 1, 1–3. [Google Scholar] [CrossRef]
- O’Brien, C.; Arathi, H.S. Bee diversity and abundance on flowers of industrial hemp (Cannabis sativa L.). Biomass Bioenergy 2019, 122, 331–335. [Google Scholar] [CrossRef]
- Ely, K.; Podder, S.; Reiss, M.; Fike, J. Industrial hemp as a crop for a sustainable agriculture. In Cannabis/Hemp for Sustainable Agriculture and Materials; Agrawal, D.C., Kumar, R., Dhanasekaran, M., Eds.; Springer: Singapore, 2022; pp. 1–28. [Google Scholar]
- Dingha, B.N.; Jackai, L.E. Chemical composition of four industrial hemp (Cannabis sativa L.) pollen and bee preference. Insects 2023, 14, 668. [Google Scholar] [CrossRef] [PubMed]
- USDA-NASS. Agricultural Statistics 2022; National Hemp Report; USDA-NASS: Washington, DC, USA, 2022.
- Kaur, N.; Brym, Z.; Oyola, L.A.M.; Sharma, L.K. Nitrogen fertilization impact on hemp (Cannabis sativa L.) crop production: A review. Agron. J. 2023, 4, 1557–1570. [Google Scholar] [CrossRef]
- Awonaike, K.O.; Kumarasinghe, K.S.; Danso, S.K.A. Nitrogen fixation and yield of cowpea (Vigna unguiculata) as influenced by cultivar and Bradyrhizobium strain. Field Crops Res. 1990, 24, 163–171. [Google Scholar] [CrossRef]
- Hall, A.E.; Frate, C.A. Blackeye Bean Production in California; University of California Division of Agriculture and Natural Resources: Oakland, CA, USA, 1996; p. 24. [Google Scholar]
- Ongom, P.O.; Fatokun, C.; Togola, A.; Mohammed, S.B.; Ishaya, D.J.; Bala, G.; Popoola, B.; Mansur, A.; Tukur, S.; Ibikunle, M.; et al. Exploiting the genetic potential of cowpea in an intercropping complex. Agronomy 2023, 13, 1594. [Google Scholar] [CrossRef]
- Dingha, B.N.; Jackai, L.E.; Amoah, B.A.; Akotsen-Mensah, C. Pollinators on cowpea Vigna unguiculata: Implications for intercropping to enhance biodiversity. Insects 2021, 12, 54. [Google Scholar] [CrossRef] [PubMed]
- Dingha, B.N.; Omaliko, P.C.; Amoah, B.A.; Jackai, L.E.; Shrestha, D. Evaluation of cowpea (Vigna unguiculata) in an intercropping system as pollinator enhancer for increased crop yield. Sustainability 2021, 13, 9612. [Google Scholar] [CrossRef]
- Dingha, B.; Sandler, L.; Bhowmik, A.; Akotsen-Mensah, C.; Jackai, L.; Gibson, K.; Turco, R. Industrial hemp knowledge and interest among North Carolina organic farmers in the United States. Sustainability 2019, 11, 2691. [Google Scholar] [CrossRef]
- Fox, J.; Weisberg, S. An R Companion to Applied Regression, 3rd ed.; Sage: Thousand Oaks, CA, USA, 2019. [Google Scholar]
- de Mendiburu, F. Agricolae: Statistical Procedures for Agricultural Research. R Package Version 1.3-1. Available online: https://CRAN.R-project.org/package=agricolae (accessed on 23 September 2023).
- Ogle, D.H.; Wheeler, P.; Dinno, A. FSA: Fisheries Stock Analysis. R Package Version 0.8.26. Available online: https://github.com/droglenc/FSA (accessed on 23 September 2023).
- R Core Team. R: A Language and Environment for Statistical Computing; R Foundation for Statistical Computing: Vienna, Austria; Available online: https://www.R-project.org/ (accessed on 1 September 2023).
- Hammer, Ø.; Harper, D.A.T.; Ryan, P.D. PAST: Paleontological statistics software package for education and data analysis. Palaeontol. Electron. 2001, 4, 9. [Google Scholar]
- Spellerberg, I.F.; Fedor, P.J. A tribute to Claude Shannon (1916–2001) and a plea for more rigorous use of species richness, species diversity and the ‘Shannon–Wiener’ Index. Glob. Ecol. Biogeogr. 2003, 12, 177–179. [Google Scholar] [CrossRef]
- Hammer, Ø.; Harper, D. Paleontological Data Analysis, 2nd ed.; Blackwell Publishing: Oxford, UK, 2006; p. 351. [Google Scholar]
- Lago, P.K.; Stanford, D.F. Phytophagous insects associated with cultivated marijuana (Cannabis sativa L.) in northern Mississippi. J. Entomol. Sci. 1989, 24, 437–445. [Google Scholar] [CrossRef]
- Shuler, R.E.; Roulston, T.H.; Farris, G.E. Farming practices influence wild pollinator populations on squash and pumpkin. J. Econ. Entomol. 2005, 98, 790–795. [Google Scholar] [CrossRef] [PubMed]
- Kamo, T.; Nikkeshi, A.; Tawaratsumida, T.; Tanaka, Y.; Nakamura, S.; Kishi, S. Pollination efficiency of bumblebee, honeybee, and hawkmoth in kabocha squash, Cucurbita maxima, production in Kagoshima. Jpn. Appl. Entomol. Zool. 2022, 57, 119–129. [Google Scholar] [CrossRef]
- Guzman, A.; Chase, M.; Kremen, C. On-farm diversification in an agriculturally dominated landscape positively influences specialist pollinators. Front. Sustain. Food Syst. 2019, 3, 87. [Google Scholar] [CrossRef]
- Hoehn, P.; Tscharntke, T.; Tylianakis, J.M.; Steffan-Dewenter, I. Functional group diversity of bee pollinators increases crop yield. Proc. R. Soc. B 2008, 275, 2283–2291. [Google Scholar] [CrossRef] [PubMed]
- Mallinger, R.E.; Gratton, C. Species richness of wild bees, but not the use of managed honeybees, increases fruit set of a pollinator-dependent crop. J. Appl. Ecol. 2015, 52, 323–330. [Google Scholar] [CrossRef]
- Pereira, A.L.C.; Taques, T.C.; Valim, J.O.S.; Madureira, A.P.; Campos, W.G. The management of bee communities by intercropping with flowering basil (Ocimum basilicum) enhances pollination and yield of bell pepper (Capsicum annuum). J. Insect Conserv. 2015, 19, 479–486. [Google Scholar] [CrossRef]
- Norfolk, O.; Eichhorn, M.P.; Gilbert, F. Flowering ground vegetation benefits wild pollinators and fruit set of almond within arid smallholder orchards. Insect Conserv. Divers. 2016, 9, 236–243. [Google Scholar] [CrossRef]
- Brittain, C.; Williams, N.; Kremen, C.; Klein, A.M. Synergistic effects of non-Apis bees and honeybees for pollination services. Proc. Biol. Sci. 2013, 280, 20122767. [Google Scholar]
- Greenleaf, S.S.; Kremen, C. Wild bees enhance honeybees’ pollination of hybrid sunflower. Proc. Natl. Acad. Sci. USA 2006, 103, 13890–13895. [Google Scholar] [CrossRef] [PubMed]
- Chagnon, M.; Gingras, J.; De Oliveira, D. Complementary aspects of strawberry pollination by honey and indigenous bees (Hymenoptera). J. Econ. Entomol. 1993, 86, 416–420. [Google Scholar] [CrossRef]
- Fründ, J.; Dormann, C.F.; Holzschuh, A.; Tscharntke, T. Bee diversity effects on pollination depend on functional complementarity and niche shifts. Ecology 2013, 94, 2042–2054. [Google Scholar] [CrossRef] [PubMed]
- Salama, H.S.A.; Nawar, A.I.; Khalil, H.E. Intercropping pattern and N fertilizer schedule affect the performance of additively intercropped maize and forage cowpea in the Mediterranean region. Agronomy 2022, 12, 107. [Google Scholar] [CrossRef]
- Hei, Z.; Xiang, H.; Zhang, J.; Liang, K.; Zhong, J.; Li, M.; Ren, X. Intercropping of rice and water mimosa (Neptunia oleracea Lour.): A novel model to control pests and diseases and improve yield and grain quality while reducing N fertilizer application. Agriculture 2022, 12, 13. [Google Scholar] [CrossRef]
- Karavidas, I.; Ntatsi, G.; Marka, S.; Ntanasi, T.; Consentino, B.B.; Sabatino, L.; Iannetta, P.P.M.; Savvas, D. Fresh pod yield, physical and nutritional quality attributes of common bean as influenced by conventional or organic farming practices. Plants 2023, 12, 32. [Google Scholar] [CrossRef]
- Tachiki, Y.; Iwasa, Y.; Satake, A. Pollinator coupling can induce synchronized flowering in different plant species. J. Theor. Biol. 2010, 267, 153–163. [Google Scholar] [CrossRef]
Figure 1.
Relative abundance of the different pollinator types among the six cropping systems.

Figure 2.
Distribution of pollinator types within each cropping system.

Figure 3.
Weekly distribution of pollinators on each of the six cropping systems.

Figure 4.
Mean total pollinators captured in each cropping system over five sampling weeks. Bars followed by the same letters are not significantly different (p > 0.05).
Figure 4.
Mean total pollinators captured in each cropping system over five sampling weeks. Bars followed by the same letters are not significantly different (p > 0.05).


Table 1.
Pollinator diversity for each cropping system over the sampling period.
| Cropping Systems | Dominance (D) | Shannon (H’) | Evenness | Margalef | Berger–Parker |
|---|---|---|---|---|---|
| Cowpea Monocrop | 0.33 | 1.31 | 0.74 | 0.69 | 0.48 |
| Hemp Monocrop | 0.35 | 1.17 | 0.65 | 0.82 | 0.43 |
| Squash Monocrop | 0.29 | 1.31 | 0.74 | 0.78 | 0.36 |
| Hemp+Cowpea | 0.25 | 1.47 | 0.87 | 0.62 | 0.37 |
| Hemp+Squash | 0.32 | 1.29 | 0.73 | 0.62 | 0.42 |
| Squash+Cowpea | 0.24 | 1.49 | 0.88 | 0.58 | 0.29 |
Table 2.
Mean (±SE) yield of squash, hemp, and cowpea grown in monocrop and intercrop systems.
| Crops | Cropping Systems | Yield |
|---|---|---|
| Squash (kg) | Squash Monocrop | 3.00 ± 0.46 a |
| Hemp+Squash | 7.66 ± 0.71 b | |
| Squash+Cowpea | 7.83 ± 0.44 b | |
| H statistic | 20.03 *** | |
| Hemp (g) | Hemp Monocrop | 2.99 ± 0.49 a |
| Hemp+Cowpea | 4.91 ± 0.67 ab | |
| Hemp+Squash | 7.94 ± 1.15 b | |
| H statistic | 12.95 ** | |
| Cowpea (g) | Cowpea Monocrop | 1.9 ± 0.00 |
| Squash+Cowpea | 1.6 ± 0.01 | |
| Hemp+Cowpea | 1.5 ± 0.01 | |
| F statistic | 1.70 ns |
Values in the same (sub-)column followed by the same letters are not significantly different (** p ≤ 0.01; *** p ≤ 0.001).
Disclaimer/Publisher’s Note: The statements, opinions and data contained in all publications are solely those of the individual author(s) and contributor(s) and not of MDPI and/or the editor(s). MDPI and/or the editor(s) disclaim responsibility for any injury to people or property resulting from any ideas, methods, instructions or products referred to in the content. |
© 2024 by the authors. Licensee MDPI, Basel, Switzerland. This article is an open access article distributed under the terms and conditions of the Creative Commons Attribution (CC BY) license (https://creativecommons.org/licenses/by/4.0/).
Share and Cite
MDPI and ACS Style
Dingha, B.N.; Mukoko, G.N.; Egbon, I.N.; Jackai, L.E. Intercropping Industrial Hemp and Cowpea Enhances the Yield of Squash—A Pollinator-Dependent Crop. Agriculture 2024, 14, 636. https://doi.org/10.3390/agriculture14040636
AMA Style
Dingha BN, Mukoko GN, Egbon IN, Jackai LE. Intercropping Industrial Hemp and Cowpea Enhances the Yield of Squash—A Pollinator-Dependent Crop. Agriculture. 2024; 14(4):636. https://doi.org/10.3390/agriculture14040636
Chicago/Turabian StyleDingha, Beatrice N., Gilbert N. Mukoko, Ikponmwosa N. Egbon, and Louis E. Jackai. 2024. "Intercropping Industrial Hemp and Cowpea Enhances the Yield of Squash—A Pollinator-Dependent Crop" Agriculture 14, no. 4: 636. https://doi.org/10.3390/agriculture14040636
Note that from the first issue of 2016, this journal uses article numbers instead of page numbers. See further details here.