Review

Ammonia and Methane Emission Factors from Cattle Operations Expressed as Losses of Dietary Nutrients or Energy

Department of Biological and Agricultural Engineering, Kansas State University, Manhattan, KS 66056, USA
*
Author to whom correspondence should be addressed.
Agriculture 2017, 7(3), 16; https://doi.org/10.3390/agriculture7030016
Submission received: 15 December 2016 / Revised: 28 January 2017 / Accepted: 20 February 2017 / Published: 23 February 2017
(This article belongs to the Special Issue C and N Cycling and Greenhouse Gas Emissions in Agroecosystem)

Abstract

:
The objective of this study was to conduct a systematic review of published literature on ammonia (NH3) and enteric methane (CH4) emissions from beef and dairy cattle operations to obtain statistically representative emission factors based on dietary intakes of nutrients or energy, and to identify major causes of emission variations. NH3 emissions from lagoon or other manure storage facilities were not included in this review. The NH3 and CH4 emission rates, expressed as a percentage losses of dietary nutrients or energy, demonstrated much less variation compared with emission rates expressed in g/animal/day. Air temperature and dietary crude protein (CP) content were identified as two major factors that can affect NH3 emission rates in addition to farm type. Feed digestibility and energy intake were identified as two major factors that can affect CH4 emission rates expressed as a percentage losses of dietary energy. Generally, increasing productivity and feed efficiency represented the greatest opportunity for mitigating NH3 or CH4 emissions per unit of livestock product. Expressing CH4 loss on a digestible energy basis rather than a gross energy intake basis can better represent the large variation among diets and the effects of varying dietary emission mitigation strategies.

1. Introduction

Beef and dairy cattle operations emit gases into the atmosphere from animal feed digestion (enteric fermentation) and manure decomposition. Ammonia (NH3) is produced as a by-product of the microbial decomposition of the organic nitrogen (N) compounds in manure, and has been listed as one of the most important atmospheric species emitted from livestock operations in the U.S. due to its impact on ecosystems and air quality concerns [1]. Enteric methane (CH4) is produced by ruminants as a result of microbial breakdown of carbohydrates in the rumen, and enteric CH4 emissions from cattle operations are considered a major contributor to greenhouse gas (GHG) emissions in the U.S. [2]. In addition to environmental concerns, NH3 emissions represent an unproductive loss of dietary nutrients. The fertilizer value of manure is reduced due to N volatilization to the atmosphere as NH3. Similarly, CH4 emissions represent an unproductive loss of dietary energy (Figure 1). The U.S. Environmental Protection Agency (EPA) estimated that more than 80% of human-induced NH3 emissions in the U.S. come from livestock production, in which beef and dairy cattle contributed more than half [3]. Enteric fermentation and manure management of livestock production are responsible for 2.2% and 1.1% of the total human-induced GHG emissions in the U.S., respectively, and cattle operations are considered the major contributors within the various livestock species [2].
With increasingly stringent air pollution regulations and the emerging pressure to regulate agricultural enterprises, there will be a continued need for emission inventories based on reliable and representative emission factors, as well as an increasing demand for mitigation strategies. On the other hand, production efficiency is a contributing factor in reducing the environmental footprint per unit of product. Strategies that increase production efficiency will conserve resources and improve environmental stewardship, and could represent a great opportunity for mitigating NH3 and CH4 emissions per unit of livestock product. In evaluating these mitigation practices, quantifying NH3 and CH4 emissions as a percentage of losses of dietary nutrients or energy would be beneficial. In addition, emission factors based on intakes of dietary nutrients or energy can address the effect of feed intake and reduce uncertainties in estimation of emissions, and also be used as a key parameter in establishing emission inventories. Various emission models have been developed to simulate NH3 and CH4 emissions from beef and dairy cattle operations. Most of the current empirical or statistical models are built from data collected under controlled conditions or from a particular site, and care must be taken when generalizing these models to estimate emissions under different scenarios.
The objective of this study was to conduct a systematic review of published literature on NH3 and CH4 emissions from beef and dairy cattle operations in order to obtain statistically representative emission factors based on intakes of dietary nutrients or energy, and to identify major causes of emission variations. The review focused on NH3 emissions from beef feedlots and dairy cattle barns, and enteric CH4 emissions from cattle. NH3 and CH4 emissions from lagoons or other manure storage facilities were not included in this review.

2. Literature Search and Data Analysis

An exhaustive search using multiple strategies was undertaken to identify eligible studies to be included in the review. The literature searches were performed in the following electronic bibliographic databases: AGRICOLA, AGRIS, Biological & Agricultural Index, Biological Abstracts, CAB Abstracts, CAB Reviews, Environment Complete, Pollution Abstracts, Web of Science, and Google Scholar. In each database, an iterative process was used to refine the search strategy through testing of several search terms and incorporation of new search terms as new relevant studies were identified. A manual search was carried out for references that were cited in the identified studies. The inclusion criteria were that the study must report measured NH3 or enteric CH4 emission from cattle operations and the emission can be expressed as a percentage of intakes of dietary nutrients or energy based on given information. The study must be published in English and inclusion was not restricted by study size or publication type. Studies that only reported emissions from manure storage facilities were not included.
Two individuals independently conducted the search processes and screened the studies by reading the title and abstract in order to select studies for full review according to the inclusion criteria. The included studies were distributed to a group of reviewers for data extraction. Standard data extraction sheets were developed for consistency. Each study was reviewed in duplicate by two independent reviewers for quality control. As a result of the data review and extraction processes, a database that included treatment means at various common feed and animal combinations from various studies was created and is available for independent scrutiny of the process.
For each study, the following general information was recorded: (1) Geographic region: Asia, Europe, North America, Oceania, or South America; (2) Cattle type: beef or dairy; (3) Average weight of animal, kg; (4) Number of animals measured; and (5) Measurement method.
For studies that reported NH3 emissions, the following variables were recorded in addition: (1) Farm type: beef feedlot, dairy open-lot, free-stall or tie-stall dairy barns; (2) Dietary crude protein (CP), %; (3) N intake: g/day/animal; (4) Air temperature: outdoor air temperature for beef feedlots or dairy open-lots, indoor air temperature for free-stall/tie-stall dairy barns, °C; (5) Ventilation: natural or mechanical; (6) Floor type: solid or slatted; (7) NH3 emission per animal, g/day/animal; and (8) NH3-N loss as a percentage of N intake.
For studies that reported CH4 emissions, the following variables were recorded in addition: (1) Breed of animal; (2) Lactation status: lactating or dry; (3) Days in milk: for lactating dairy; (4) Feeding method: grazing or housed; (5) Diet forage-to-concentrate ratio; (6) Fat content in diet, g/kg DM; (7) Energy digestibility of feed (ED), %; (8) General energy intake (GEI), MJ/day/animal; (9) Energy intake level (EIL): calculated as ratio of digestible energy intake to energy requirement for maintenance of cattle; (10) CH4 emission per head, g/day/animal; (11) Ym: percentage of GEI converted to CH4; and (12) Dm: percentage of digestible energy intake converted to CH4.
When a study provided treatment means at different conditions (sites), multiple treatment means (data points) were extracted from the study. Treatment means from special feed additive experiments were considered not representative and thus were not included.
Normality of the data across studies was evaluated using the Shapiro–Wilk test, and funnel plots were used to detect potential publication bias, using number of animals measured as the y-axis. The MIXED procedures of SAS (SAS for Windows, ver. 9.4, SAS Institute, Cary, NC, USA) were used to investigate effects of various factors. The study effect was treated as a random variable since some studies contain multiple data points. The number of animals contributing to each treatment mean was used as a weighting variable. A backward elimination process was used to remove the confounded terms and to reduce non-significant terms one by one. The data were also classified into various homogeneous subgroups to conduct subgroup analysis based on identified significant factors such as farm type. In each subgroup, regressions were undertaken to quantify the effects of identified important variables, such as air temperature and dietary CP for NH3, and feed digestibility and energy intake for CH4. Significant effects were declared at p-value < 0.05.

3. NH3 Emissions as a Loss of Dietary Nutrients

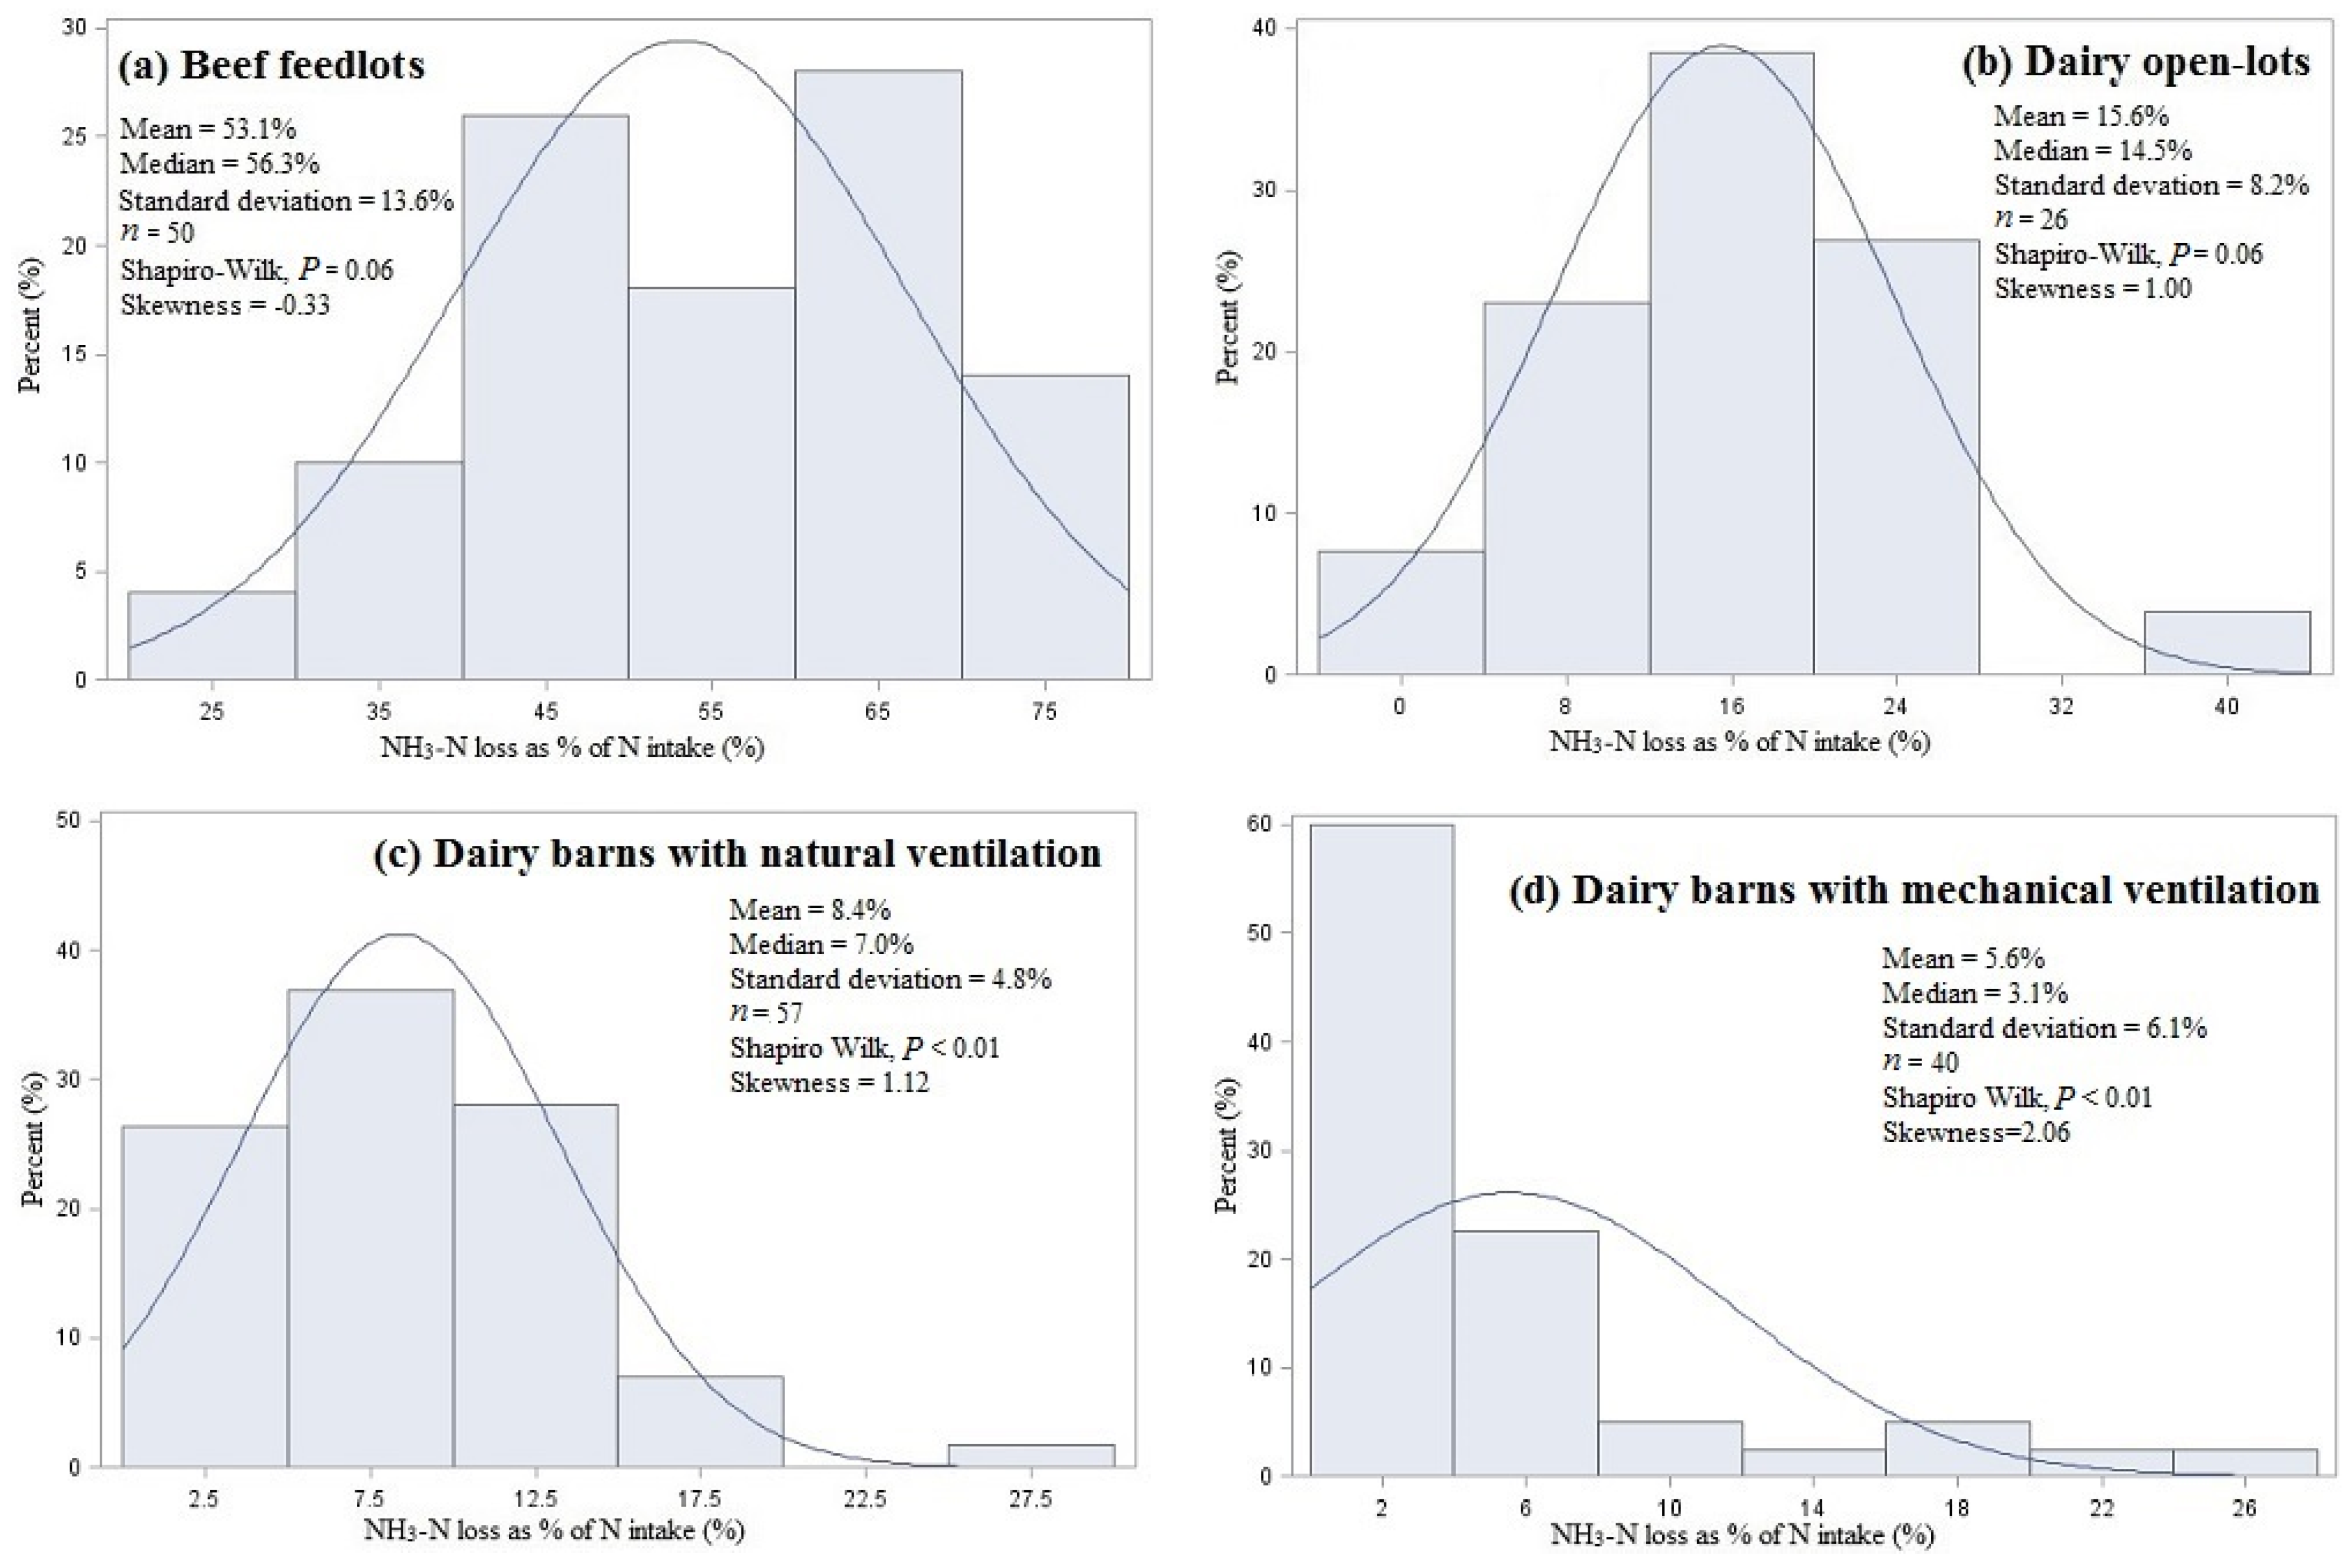
3.1. Overall Statistics

Under practical conditions, only 20% to 35% of the nitrogen (N) fed to a dairy cow is secreted in milk [4,5]. For beef cattle, only 10% to 20% of the N consumed is retained by the animal [6]. Almost all of the remaining N is excreted in urine and feces. The N in the urine is mainly in the form of urea, which can rapidly be converted to NH3 when in contact with the urease enzyme in feces. It has been reported that NH3 emissions from cattle operations could be linearly related with feed N intake [7] and are sensitive to CP in rations [8]. However, in reality, the total N volatilization from manure (primarily in the form of NH3) had wide variations, ranging from 5% to 80% of manure N, depending on the type of manure management system [9].
The literature search yielded a total of 92 papers published from 1997 to 2016, which included 173 treatment means of measured NH3-N loss as a percentage of N intake at various animal and farm type combinations for beef or dairy cattle operations. Distributions of these treatment means are presented in Figure 2. The average NH3-N loss as a percentage of N intake were 53.1%, 15.6%, 8.4%, and 5.6% for beef feedlots, dairy open-lots, free/tie-stall dairy barns with natural ventilation, and free/tie-stall dairy barns with mechanical ventilation, respectively. Although the average emission rates for dairy open-lots (125.6 g/day/animal) were comparable with that for beef feedlots (105.9 g/day/animal), the average NH3-N loss as a percentage of N intake for dairy open-lots was less than one third of that for beef feedlots (15.6% vs. 53.1%) because dairy cattle usually have much higher N intake. The NH3-N loss as a percentage of N intake for dairy open-lots was about two times higher than that for free/tie-stall dairy barns with natural or mechanical ventilation when emissions from manure storage facilities were not included (15.6% vs. 8.4% or 5.6%). The total NH3-N loss as a percentage of N intake that for dairy barns with emissions from manure storage facilities included has been estimated to be 20% to 55% by the MidWest Plan Service [10], which was even larger than that for dairy open-lots (15.6%). The average NH3-N loss as a percentage of N intake for dairy barns with mechanical ventilation was lower than that for dairy barns with natural ventilation. The NH3-N loss as a percentage of N intake for beef feedlots and dairy open-lots both demonstrated a normal distribution. In contrast, the NH3-N loss as a percentage of N intake for free/tie-stall dairy barns with natural or mechanical ventilation demonstrated a skewed distribution with a long tail on the right side, which indicated the heterogeneity caused by relatively complex influencing factors in free/tie-stall barns, such as various manure handling practices, ventilation and floor types. No evidence of publication bias was found based on the funnel plots.

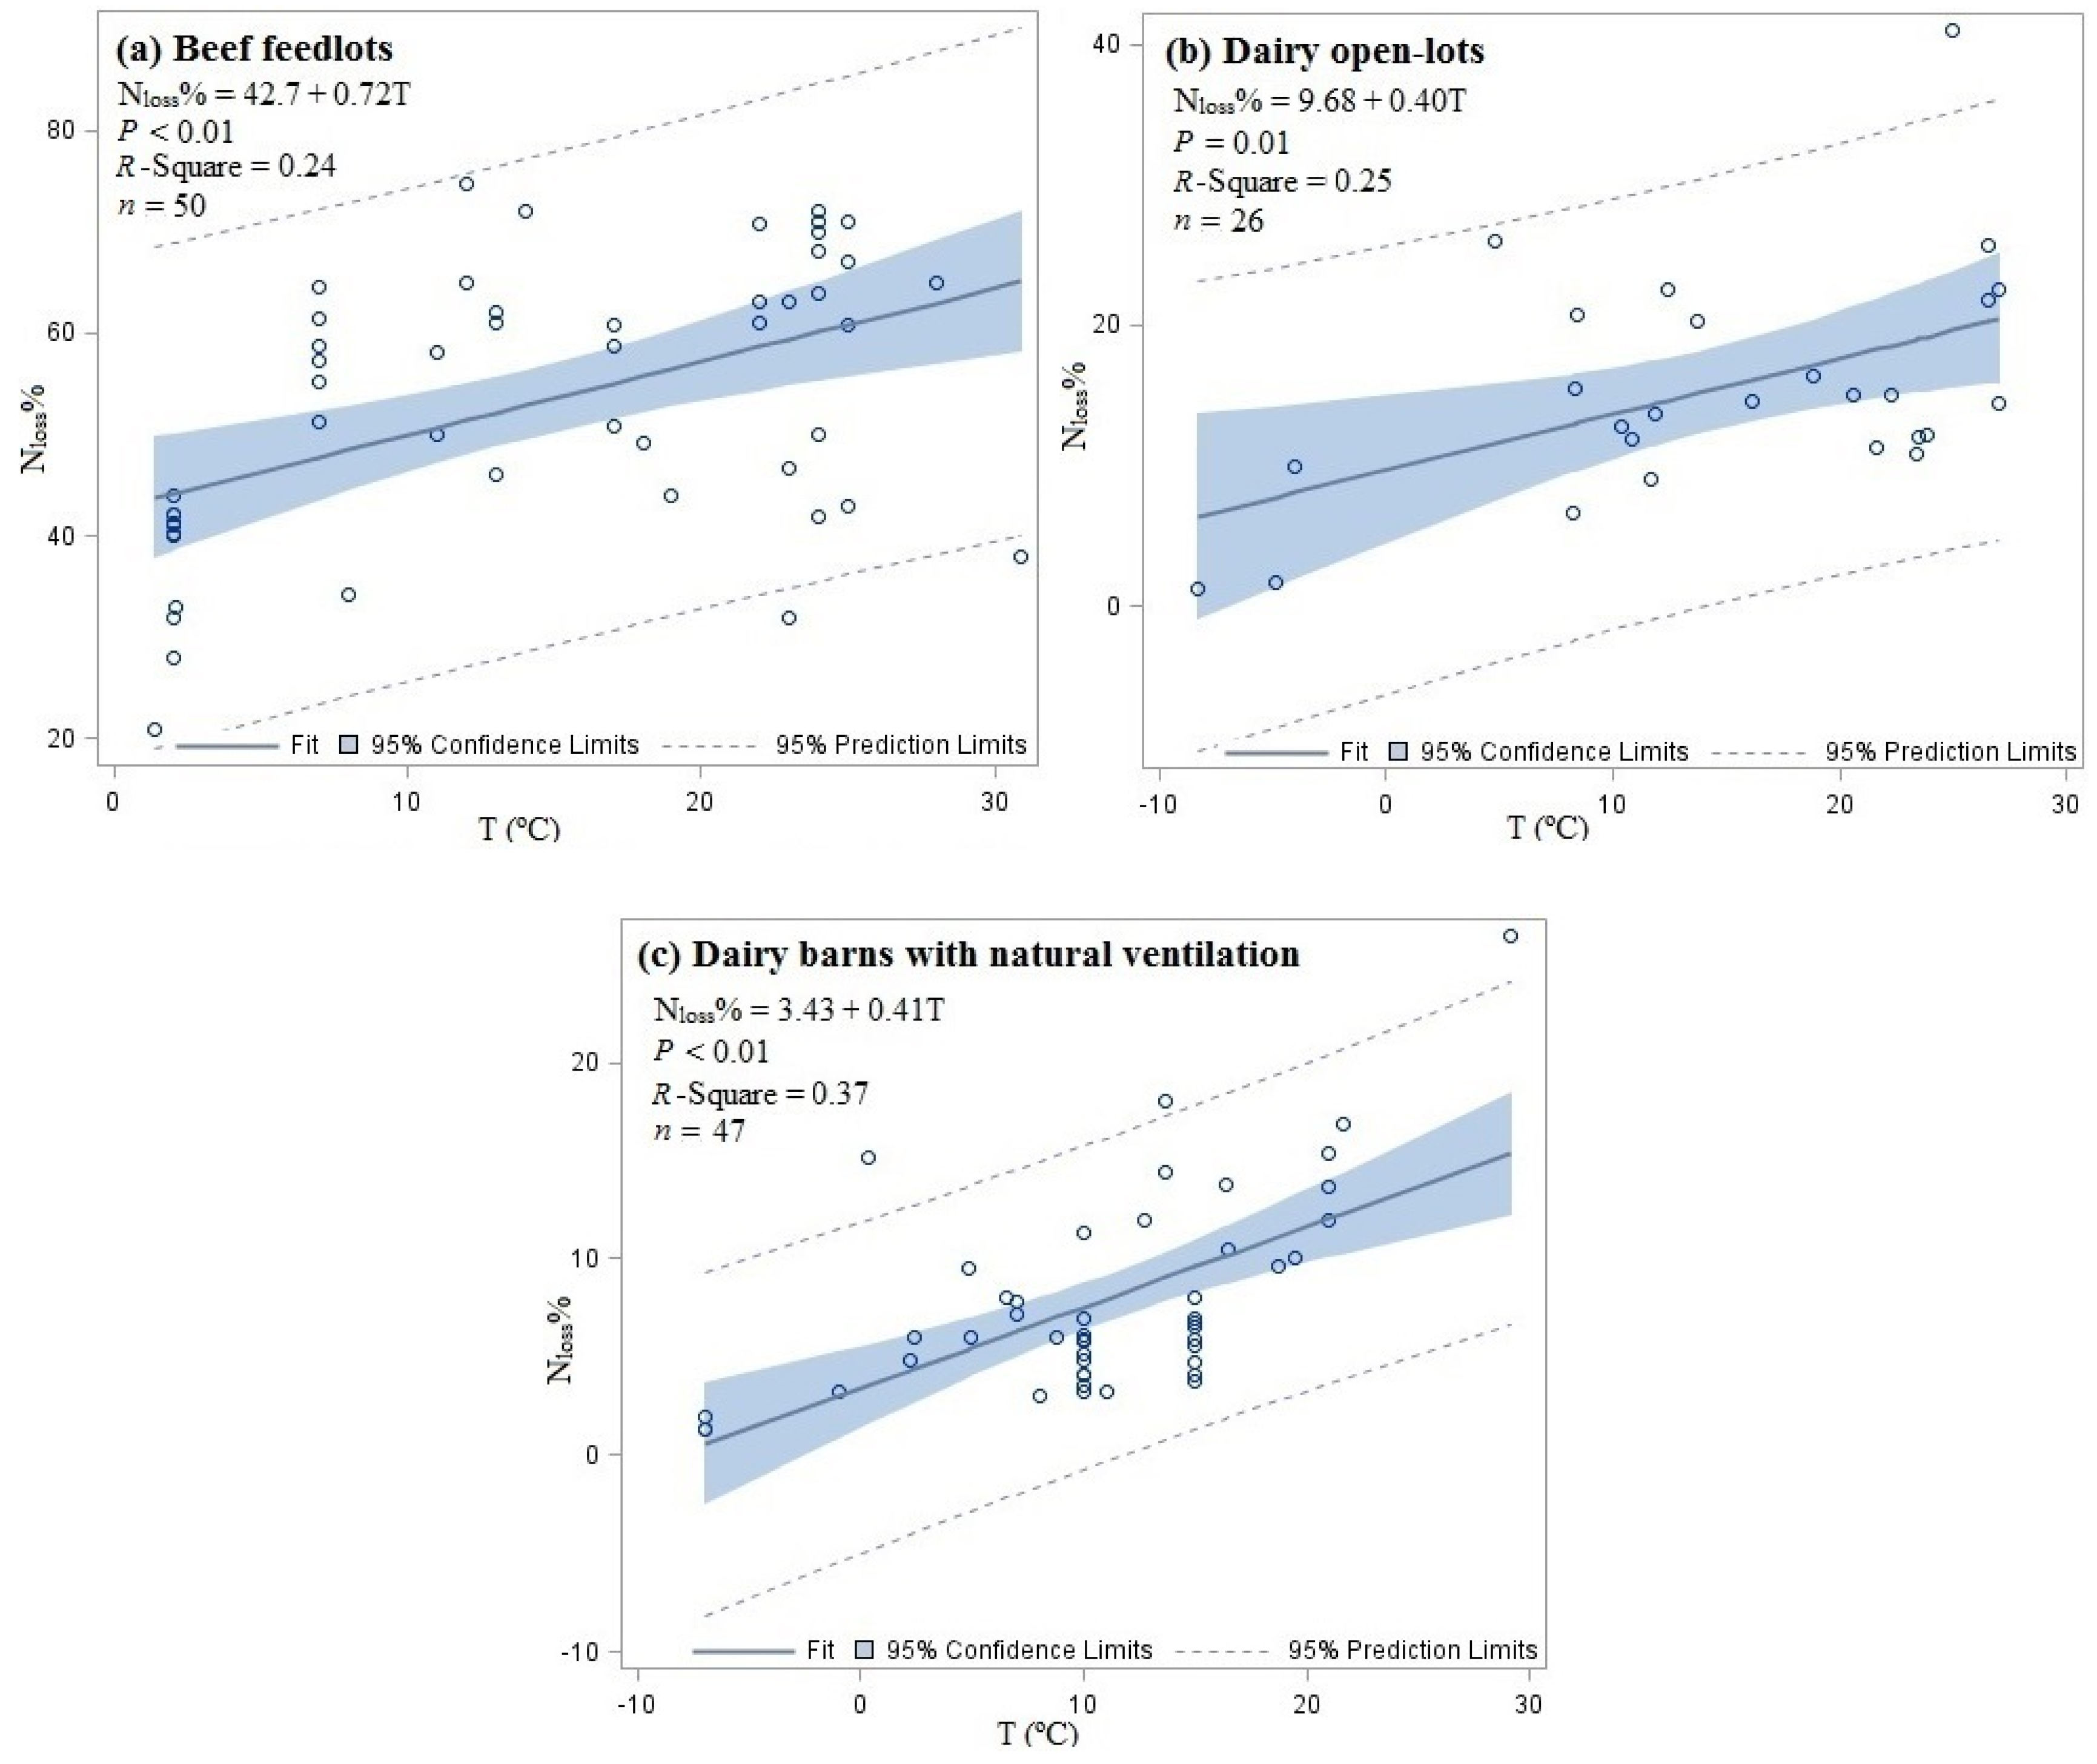
3.2. Effect of Air Temperature

Air temperature can significantly affect NH3 emissions due to its effect on NH3 volatilization and convective mass transfer [11]. Todd [12] reported that summer emissions from a cattle feedyard were about twice as great as in the winter. Regressions were conducted for NH3-N loss as % of N intake as a function of air temperature using data from the literature, and fit plots are presented in Figure 3. For beef feedlot, dairy open-lots, and dairy barns with natural ventilation, the NH3-N loss as % of N intake all increased with increasing temperature. However, for dairy barns with mechanical ventilation, the effect of air temperature was not significant (p = 0.48, n = 32). This was likely due to the large variation of emissions dominated by various mechanical ventilation conditions, since the mechanical ventilation system design determines air velocity near the floor, and thus has significant influence on NH3 emission in dairy barns [11]. The sensitivity of NH3-N loss as a percentage of N intake to temperatures obtained from studies on dairy barns with natural ventilation was comparable with that for open-lot dairy barns (0.46% vs. 0.40% per °C), while the sensitivity was higher for beef feedlots (0.72% per °C). This was because beef cattle usually have lower N intake than dairy cattle. In fact, the sensitivity of NH3 emission rate in g/d/animal to air temperature obtained from various types of cattle operations was comparable with each other (2.33, 2.39, 2.66 g/day/animal per °C, respectively, for beef feedlots, dairy open-lots, and dairy barns with natural ventilation).

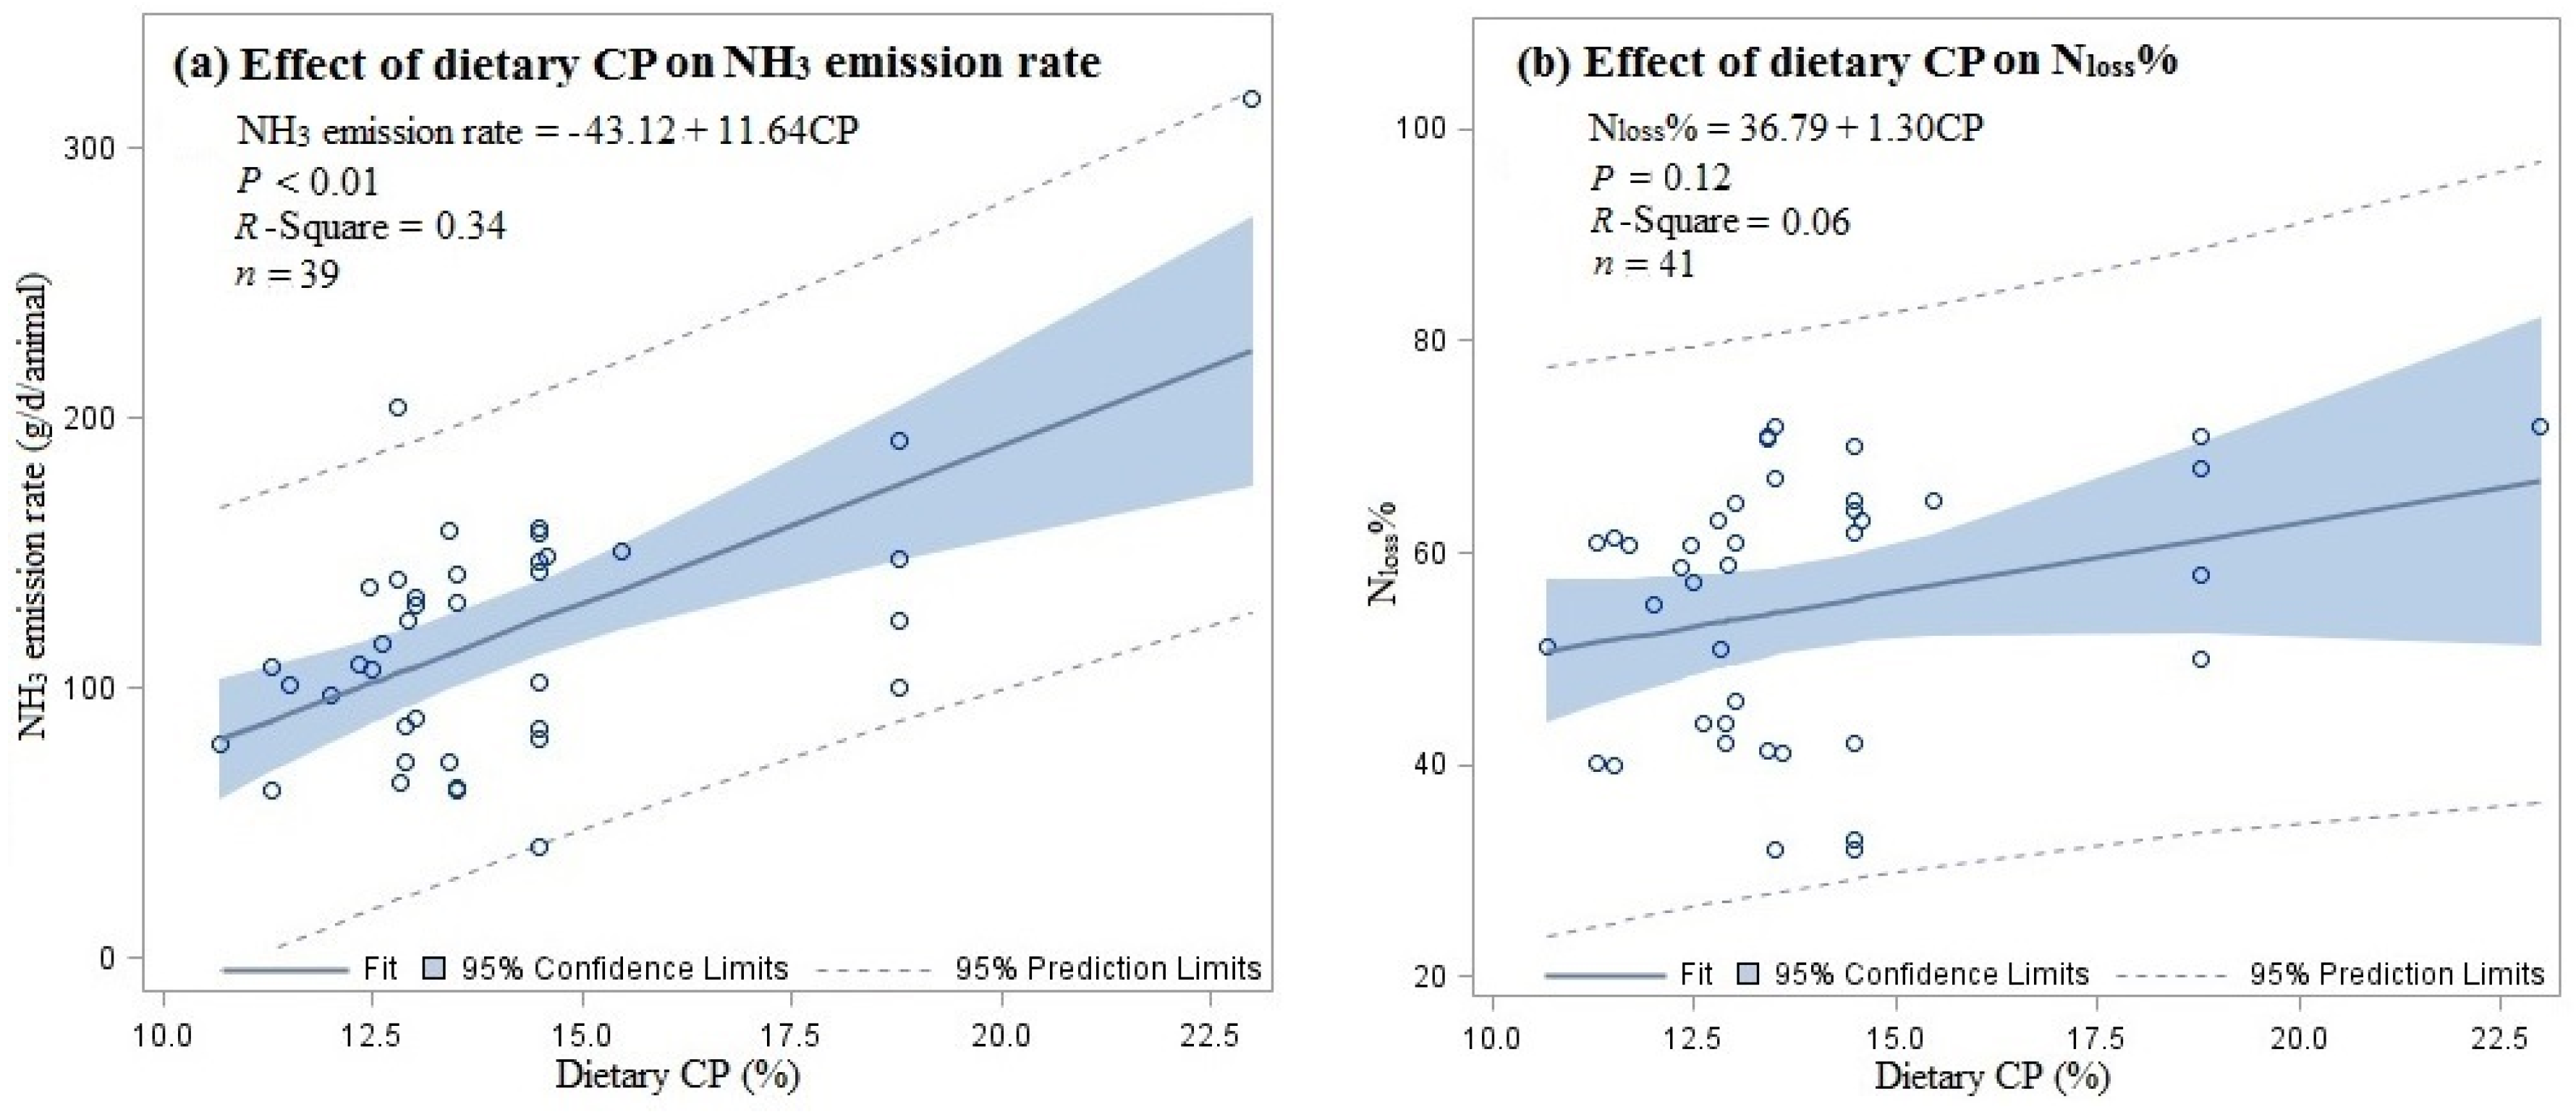
3.3. Effect of Dietary Crude Protein (CP) Content

Another important factor that affects NH3 emissions is dietary CP. For beef feedlots, open-lot dairy barns and dairy barns with natural ventilation, the NH3 emission rates were significantly affected by both air temperature and dietary CP (p < 0.05). When both air temperature and dietary CP were included in regression, the sensitivity of emission rates to dietary CP obtained for various types of cattle operations was 9.9, 12.7, and 10.4 g·day−1·animal−1 per 1% CP, respectively, for beef feedlots, dairy open-lots and free/tie-stall dairy barns with natural ventilation. The result indicated that, for every one percentage point increase in dietary CP (e.g., from 14% to 15%), an increase of 9.9 to 12.7 g/day/animal in NH3 emission rates can be expected. This was comparable with the results of Bougouin et al. [13], which concluded that a unit increase in dietary CP resulted in a 10.2 g/day/animal increase in NH3 emissions from dairy operations. The effect of dietary CP on NH3 emissions for free/tie-stall dairy barns with mechanical ventilation was not observed, possibly due to the large variation in emissions dominated by mechanical ventilation conditions. For beef feedlots and dairy barns with natural ventilation, higher dietary CP not only resulted in higher NH3 emission rates but also corresponded with higher NH3-N loss as percentage of N intake, although the effect was not statistically significant at α = 0.05 level (p = 0.31 and 0.14, respectively, for beef feedlots and dairy barns with natural ventilation). Figure 4 demonstrates the effect of dietary CP on NH3 emission rate as well as on the NH3-N loss as percentage of N intake for beef feedlots when dietary CP was the only factor considered in the regression. The results were in agreement with the report that the proportion of total N excreted in urine was positively related with dietary CP [14]. Huhtanen et al. [15] once estimated that 84% of the incremental N intake was excreted in urine. The excess CP fed to the animal is mostly voided as urea in urine, and thus will result in increased percentage of N excreted in urine and increased percentage of N loss as NH3. The effect of dietary CP on NH3-N loss as a percentage of N intake for dairy open-lots was not observed, possibly due to the limited number of data points in literature. More studies on dairy open-lots using various dietary CP levels are needed to better evaluate the effect of dietary CP.

3.4. Other Factors That Affect NH3 Emission

There are many other factors that can affect NH3 emissions from cattle operations, such as manure handling practices (scraping or flushing), manure removal frequency, floor types (solid or slatted), barn types (free-stall or tie-stall), ventilation of barns, wind speed/solar radiation/precipitation for open-lots, etc. It is very difficult to quantify and generalize the effects of these factors with the limited amount of data in literature, and many of these factors were confounded with each other. As mentioned earlier, the NH3-N loss as a percentage of N intake for dairy barns with mechanical ventilation was lower than that for dairy barns with natural ventilation. The effect of ventilation type was confounded by barn type. One possible reason for lower emissions from barns with mechanical ventilation is that 72% of the barns with mechanical ventilation were tie-stall barns, while 96% of the barns with natural ventilation were free-stall barns in the data analyzed. The beddings typically used in tie-stall barns can separate urine and feces and thus reduce NH3 production [16], and the emitting surface area of tie-stall barns was often less than that of free-stall barns [17]. Another reason could be that mechanical ventilation can reduce moisture in barns and thus reduce NH3 emissions. Generally, the NH3-N loss as a percentage of N intake for free/tie-stall dairy barns demonstrated much larger variation than that for beef feedlots. The coefficients of variation were 0.3, 0.5, 0.6, and 1.1 for beef feedlots, dairy open-lots, free/tie-stall dairy barns with natural ventilation, and free/tie-stall dairy barns with mechanical ventilation. The larger variation and the skewed distribution with long tails on the right side in Figure 2c,d indicated that there may be considerable room for reducing NH3 emission with improved management practices in free/tie-stall dairy barns, especially in barns with mechanical ventilation. When developing mitigating strategies, for open-lot dairy barns and beef feedlots, managing N intake and improving feed efficiency seem to represent the greatest opportunities. For free/tie-stall dairy barns, improving ventilation design and management practices could be more effective.

4. Enteric CH4 Emissions as a Loss of Dietary Energy

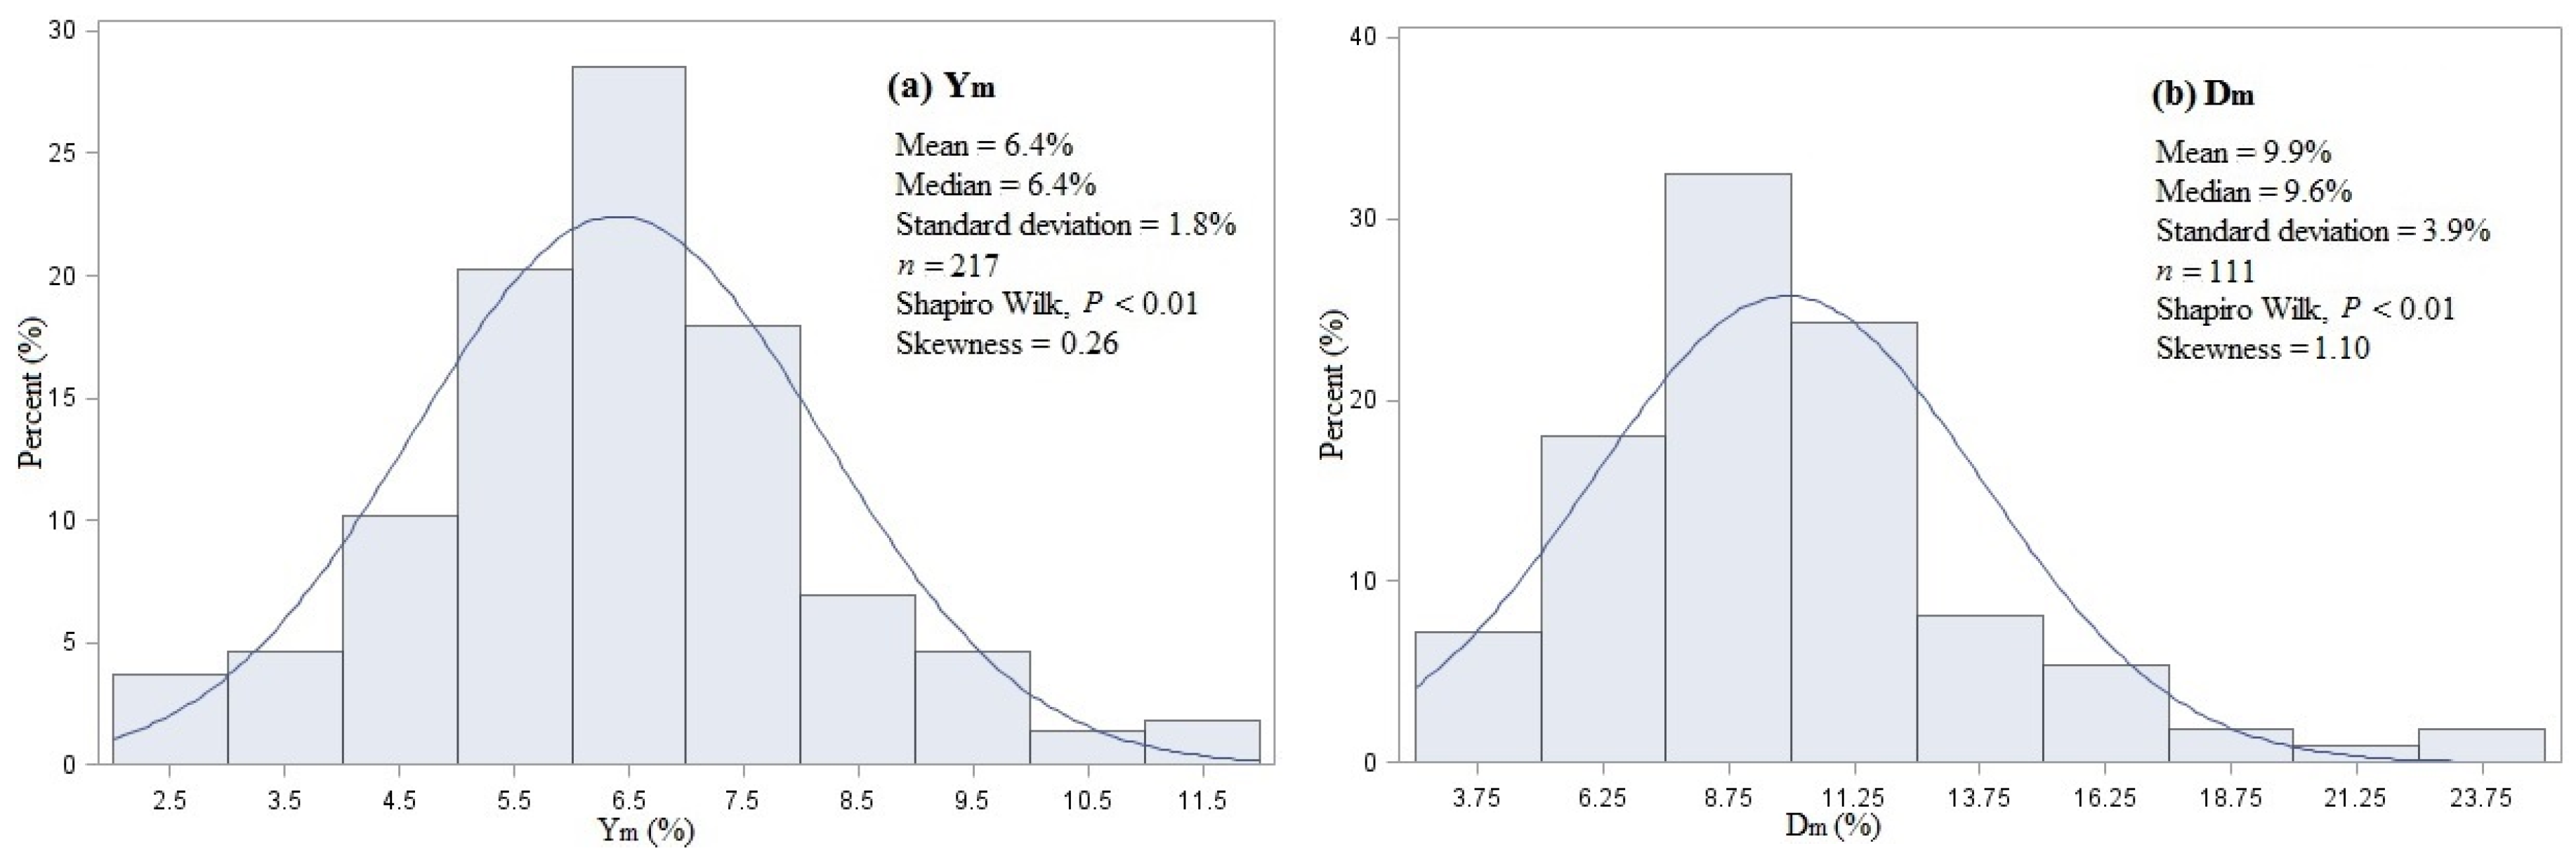
4.1. Overall Statistics

Since CH4 represents an unproductive loss of dietary energy, one of the predominant enteric CH4 emission estimation procedures is driven by first estimating daily gross energy intake (GEI) by individual animals and then multiplying the GEI by an estimate of “methane conversion factor (Ym)”, which ranges from 2% to 11% of GEI in literature. An alternative approach is to express CH4 conversion factors on a digestible energy basis. Dm was defined as percentage of digestible energy intake converted to CH4. Typical ruminant diets contain about 18.4 MJ of gross energy (GE) per kg of dry matter (DM) and CH4 has energy content of 55.65 MJ/kg [18]. Therefore, a typical Ym value of 6% corresponds to 19.8 g CH4/kg DM intake. Assuming the energy digestibility of feed is 65%, a Ym value of 6.5% corresponds to a Dm value of 10%.
The literature search yielded a total of 89 papers published from 1992 to 2015, which included 217 treatment means of measured enteric CH4 loss as a percentage of dietary energy intake at various animal and farm type combinations for beef or dairy cattle operations. The treatment means of Ym or Dm were obtained from these studies directly or calculated based on given information. Distributions of these treatment means are presented in Figure 5. No significant difference was observed between beef and dairy cattle for Ym (p = 0.79) or Dm (p = 0.93). Grazing cattle had higher Ym than housed cattle (7.3% vs. 6.1%, p < 0.01), but Dm was not significantly affected by feeding method (p = 0.56). The difference in Ym between grazing and housed cattle could be due to the effect of feed digestibility. No evidence of publication bias was found based on the funnel plot.

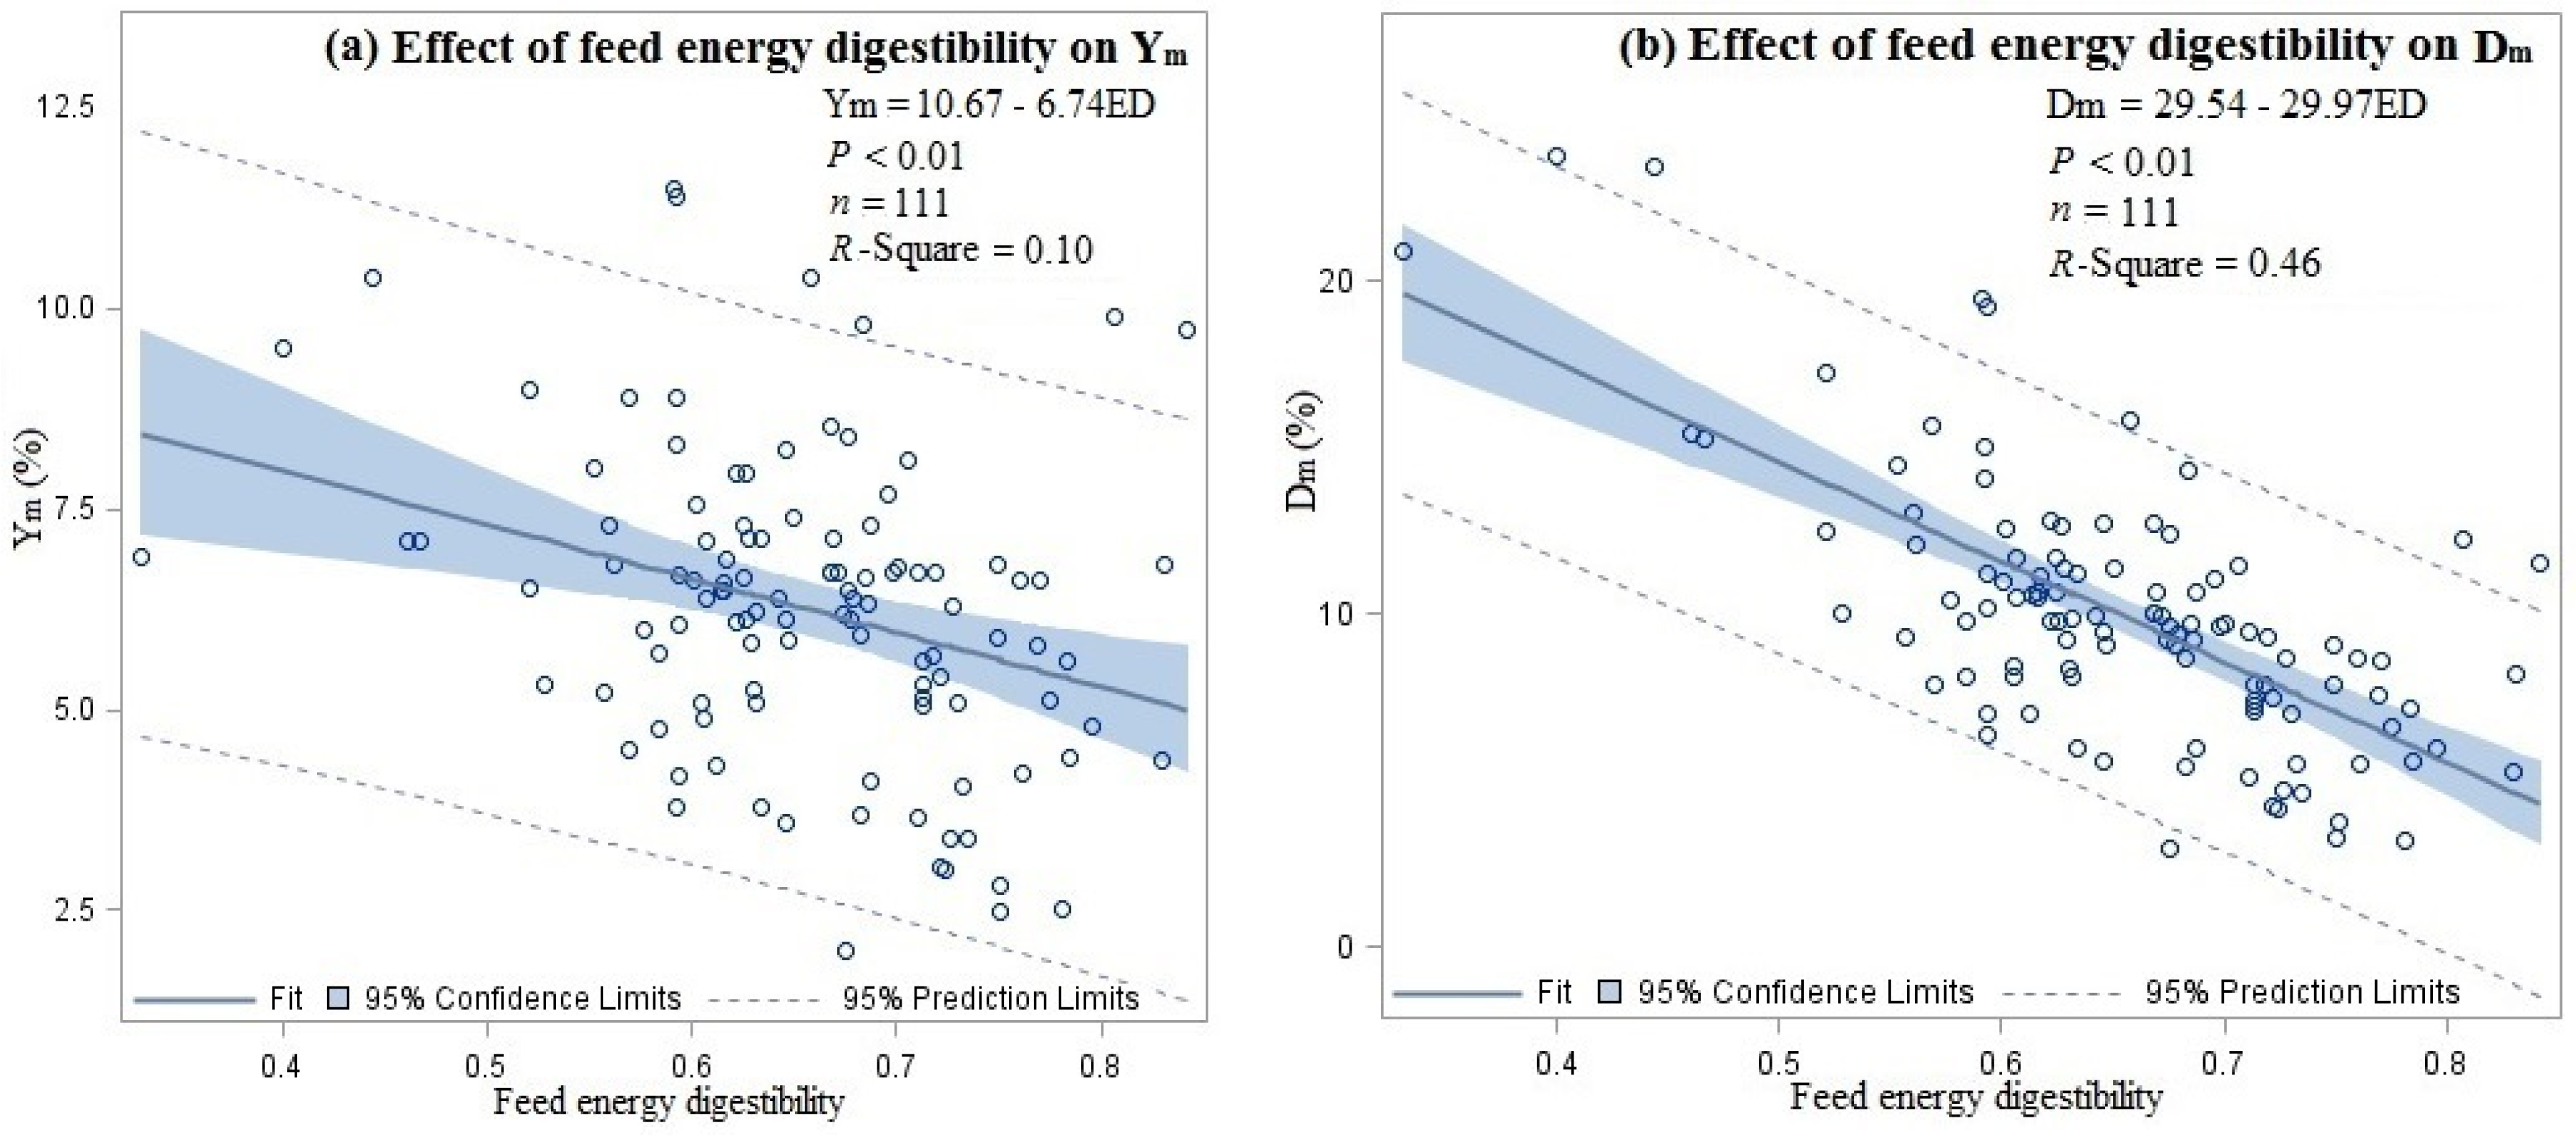
4.2. Effect of Feed Digestibility

Increasing the proportion of concentrate in the diet will likely increase animal productivity and thus decrease enteric CH4 emission per unit of animal product even though the absolute CH4 emissions may not be reduced [19,20,21]. The default values of Ym provided by the Intergovernmental Panel on Climate Change (IPCC) [9] are 3.0% ± 1.0% for feedlot cattle that are fed diets containing 90% or more concentrates, and 6.5% ± 1.0% for dairy cows and cattle that are primarily fed low quality crop residues and by-products. Analysis of data across studies showed that lower forage-to-concentrate ratio in diets generally resulted in lower Ym and Dm (p < 0.01 for both Ym and Dm). The least squares mean of Ym for cattle that were fed diets containing 90% or more concentrates was 3.8% ± 0.5%, which was higher than the 3.0% ± 1.0% provided by the IPCC [9]. In contrast, the least squares mean of Ym for cattle that were fed diets containing 10% or less concentrates was 7.3% ± 0.4%. Lower forage-to-concentrate ratio in diets corresponded to higher digestibility. Typical feed energy digestibility in U.S. was 66.7% for dairy cows and 82.5% for feedlot cattle in 2012 [2]. For grazing cattle, forage digestibility is mainly affected by stage of maturity and forage species in addition to environmental conditions [22,23]. Increased forage digestibility is expected to decrease enteric CH4 emission per unit of animal products [21]. Based on the 51 studies included in this review, the average feed energy digestibility for grazing cattle was 58.8%, 68.0%, and 70.2% in North America, Europe, and Oceania, respectively, which provided an explanation for the higher Ym in North America as compared with Europe and Oceania (7.7% vs. 6.6% and 5.7%). The observed higher Ym for grazing cattle as compared with housed cattle was expected since grazing cattle generally had lower feed digestibility than most housed cattle. Regressions were conducted for Ym and Dm as a function of feed energy digestibility using data from literature including both housed and grazing cattle studies, and fit plots are presented in Figure 6. As shown in Figure 6, Dm demonstrated a much better fit than Ym to reflect the effect of feed energy digestibility on CH4 emissions.

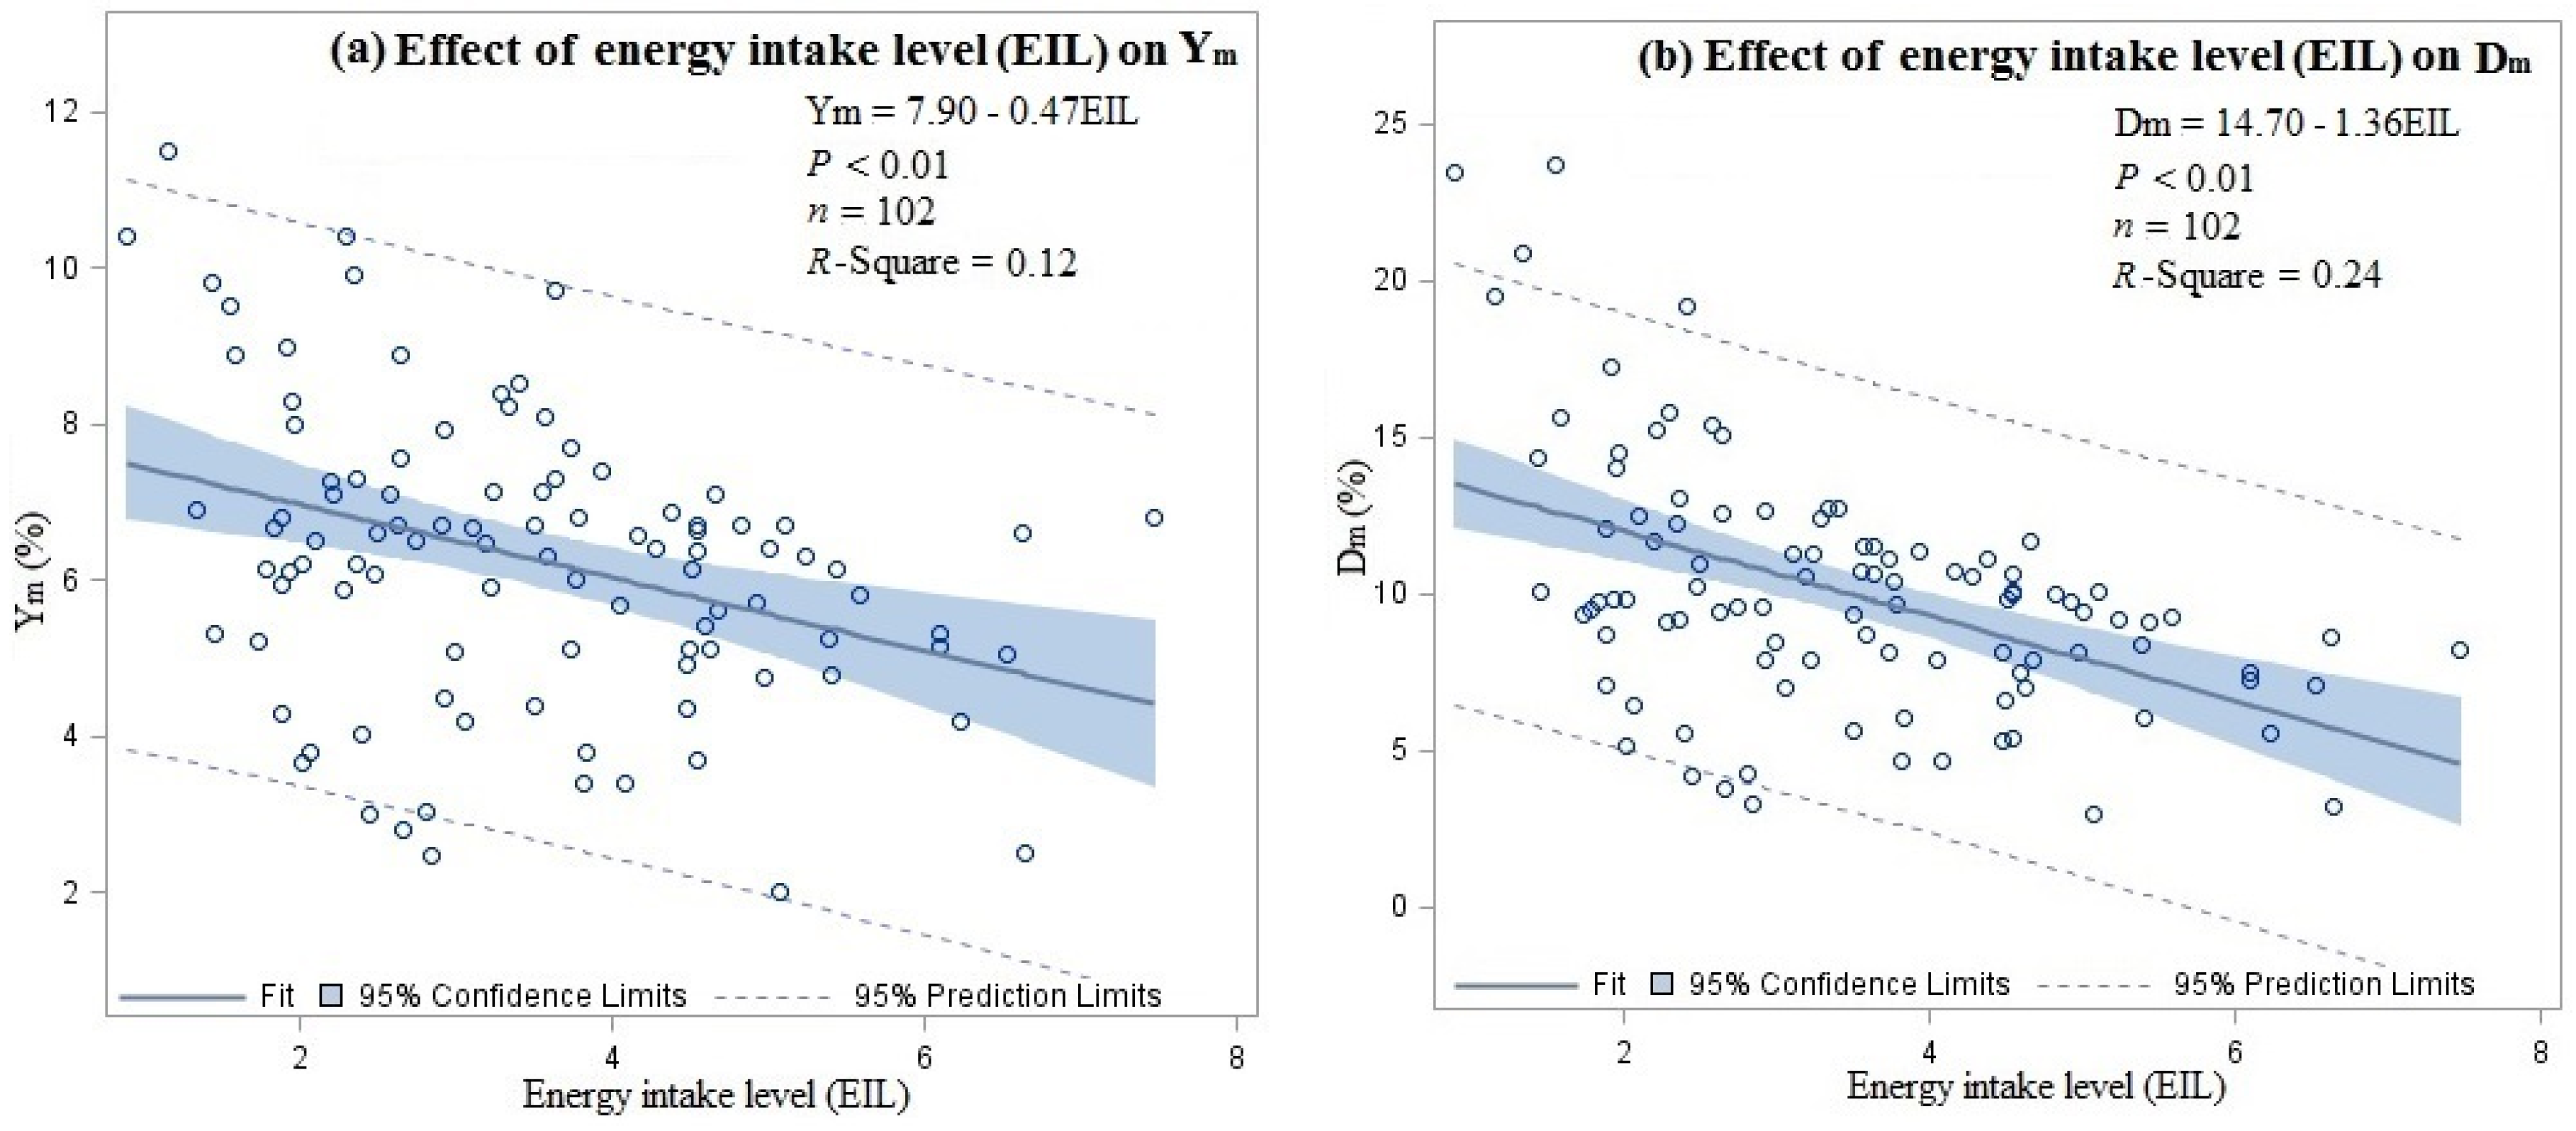
4.3. Effect of Energy Intake

Enteric fermentation and hence Ym was also affected by feed intake. Kujawa [24] and Diarra [25] reported that Ym varied from 8% to 11% when measured at restricted feed intakes and from 5% to 6% when measured at ad libitum intake. Johnson and Johnson [26] stated that as feed intake increased, the Ym decreased by about 1.6 percent-units per each level of intake above maintenance. Sauvant and Giger-Reverdin [27] reported a linear decrease in Ym with increasing feed intake. Feed digestibility and intake level could affect each other. Increasing feed digestibility could help to increase intake level, and, conversely, excessive intake could reduce digestibility [27,28,29]. Generally, high digestibility did not necessarily result in a high intake level, but low digestibility usually resulted in a low intake level. However, a strong relationship between them has not been documented [26].
In this review, the energy intake level (EIL) was defined as the ratio of digestible energy intake to energy requirement for maintenance of cattle and was used to evaluate the effect of feed intake. It was calculated for all reviewed studies when needed information was available. The energy requirement for maintenance (NEm) was estimated using an equation from the IPCC [9]:
NEm = Cfi × (Weight)0.75,
in which Cfi is a coefficient that varies for each animal category. Assuming the efficiency of conversion of digestible energy to metabolisable energy (ME) is 0.82 and the efficiency of conversion of ME to NEm ranges from 0.64 to 0.70 [30], when the ME available in feed intake equals the ME required for maintenance, the corresponding EIL is around 1.74 to 1.90. Both Ym and Dm decreased with increasing EIL (p < 0.01 for both Ym and Dm) as expected when EIL was the only factor considered in the regression (Figure 7).
When effects of EIL and energy digestibility of feed were both included in a two-factor analysis, increasing EIL reduced Ym (p = 0.02), but the effect of feed energy digestibility was no longer significant (p = 0.07). A significant effect of digestibility on CH4 emission could not be demonstrated possibly due to the limitations of the Ym approach. The limitations of the Ym approach have been noted [21,31,32]. Boadi and Wittenberg [31] fed low, medium and high quality forage to dairy and beef cattle and reported no statistical differences in Ym, but greater emissions with the lower quality forages were observed when expressed on digestible energy intake basis. Based on this review, Dm was significantly affected by both EIL and feed energy digestibility in a two-factor analysis (p < 0.01 for both effects). An interaction effect was also observed (p < 0.01). The following regression model (Equation (2)) was developed based on data from all studies that provided Dm, energy digestibility and EIL (n = 100, R-Square = 0.54). Based on the regression model, the sensitivity of Dm to feed energy digestibility decreased as EIL increased. On the other hand, the sensitivity of Dm to EIL decreased as feed energy digestibility increased:
Dm = 40.69 − 43.84 × ED − 4.870 × EIL + 6.368 × ED × EIL,
where ED is feed energy digestibility, ranging from 0.33 to 0.84; EIL is energy intake level of cattle, measured as the ratio of digestible energy intake to the energy requirement for maintenance of cattle, ranging from 0.89 to 7.47; and Dm is percentage of digestible energy intake converted to CH4.

4.4. Other Factors That Affect CH4 Emission

Breed of cattle could be another factor that can affect enteric CH4 emissions. The least squares mean of Ym for Holstein cattle is 5.3% (n = 52). The limited data in literature showed that Thai native, Brown Swiss and Brahman cattle reported higher Ym than Holstein cattle, while Nellore cattle reported lower Ym than Holstein cattle. Fat supplementation has been proposed to reduce CH4 emission [33,34], but the microbiological mechanism was not well known. Increasing fat content may decrease digestibility [35] and increase energy intake level. The effect of fat content in diets on CH4 emission could be related to its effects on feed digestibility and energy intake level of cattle. The lactation status of dairy cows could also affect CH4 emission indirectly by affecting energy intake level, since, generally, energy intake level of lactating cows is higher than that of dry cows, and it decreases with increasing days in milk. For grazing cattle, geographic region can affect CH4 emission indirectly by affecting feed digestibility. As mentioned before, North America reported lower digestibility and thus higher Ym as compared with Europe and Oceania.

5. Conclusions

The NH3 and CH4 emission expressed as percentage losses of dietary nutrients or energy both demonstrated much less variation compared with emission rates expressed in g/animal/day. In reality, protein is often fed to livestock above the requirements for growth and maintenance. Improving nutrient management at the farm level and reducing protein intake have been considered as relatively easy ways of reducing NH3 emissions from cattle operations [36]. The NH3-N loss as a percentage of N intake was significantly different for various types of farms. Air temperature and dietary CP content were identified as two major factors that can affect NH3 emission in addition to farm type. In developing NH3 mitigation strategies, generally, managing N intake and improving feed efficiency seem to represent the greatest opportunities. In contrast, the larger variation and the skewed distribution of data in the literature indicated that there may be considerable room for reducing existing NH3 emission with improved management practices in free/tie-stall dairy barns, especially in barns with mechanical ventilation. Feed digestibility and energy intake were identified as two major factors that can affect CH4 emission expressed as percentage losses of dietary energy. Generally, higher energy digestibility of feed and higher energy intake level of cattle resulted in lower percentage of digestible energy intake converted to CH4. Increasing productivity and feed efficiency represent the greatest opportunity for mitigating CH4 emissions per unit of livestock product. However, expressing enteric CH4 energy production on GEI does not have the capacity to fully reflect the effects of diet quality and composition. Compared with the Ym approach, the use of CH4 conversion factor on a digestible energy basis (Dm) can better represent the large variation among diets and the effects of varying dietary emission mitigation strategies.

Acknowledgments

This study is contribution No. 17-223-J from the Kansas Agricultural Experiment Station. Publication of this article was funded in part by the Kansas State University Open Access Publishing Fund.

Author Contributions

Zifei Liu and Yang Liu processed and analyzed the data. Zifei Liu wrote the paper. James P. Murphy and Ronaldo Maghirang reviewed and edited the paper.

Conflicts of Interest

The authors declare no conflict of interest.

References

  1. National Research Council (NRC) of the National Academies. Air Emissions from Animal Feeding Operations: Current Knowledge, Future Needs; National Academies Press: Washington, DC, USA, 2003. [Google Scholar]
  2. United States Environmental Protection Agency (USEPA). Inventory of US Greenhouse Gas Emissions and Sinks: 1990–2012. 2014. Available online: https://www3.epa.gov/climatechange/Downloads/ghgemissions/US-GHG-Inventory-2014-Main-Text.pdf (accessed on 22 February 2017). [Google Scholar]
  3. United States Environmental Protection Agency (USEPA). 2008 National Emissions Inventory, Version 3. Technical Support Document. 2013. Available online: https://www.epa.gov/sites/production/files/2015-07/documents/2008_neiv3_tsd_draft.pdf (accessed on 22 February 2017). [Google Scholar]
  4. Jonker, J.S.; Kohn, R.A.; High, J. Dairy herd management practices that impact nitrogen utilization efficiency. J. Dairy Sci. 2002, 85, 1218–1226. [Google Scholar] [CrossRef]
  5. Liu, Z.; Powers, W.; Oldick, B.; Davidson, J.; Meyer, D. Gas emissions from dairy cows fed typical diets of midwest, south, and west regions of the United States. J. Environ. Qual. 2012, 41, 1228–1237. [Google Scholar] [CrossRef] [PubMed]
  6. Cole, N.A.; Todd, R.W. Nitrogen and phosphorus balance of beef cattle feedyards. In Proceedings of the Texas Animal Manure Management Issues Conference, Texas AgriLife Extension, Round Rock, TX, USA, 29 September 2009; pp. 17–24.
  7. James, T.; Meyer, D.; Esparza, E.; Depeters, E.J.; Perez-Monti, H. Effects of dietary nitrogen manipulation on ammonia volatilization from manure from Holstein heifers. J. Dairy Sci. 1999, 82, 2430–2439. [Google Scholar] [CrossRef]
  8. Todd, R.W.; Cole, N.A.; Rhoades, M.B.; Parker, D.B.; Casey, K.D. Daily, monthly, seasonal, and annual ammonia emissions from southern High Plains cattle feedyards. J. Environ. Qual. 2011, 40, 1090–1095. [Google Scholar] [CrossRef] [PubMed]
  9. Intergovernmental Panel on Climate Change (IPCC). IPCC Guidelines for National Greenhouse Gas Inventories; Agricultural, Forestry and Other Land Use; Institute for Global Environmental Strategies (IGES): Hayama, Japan, 2006; Volume 4. [Google Scholar]
  10. MidWest Plan Service (MWPS). Manure Storages; Manure management system series; MWPS-18, Section 2: Ames, IA, USA, 2001. [Google Scholar]
  11. Rong, L.; Nielsen, P.V.; Zhang, G. Effects of airflow and liquid temperature on ammonia mass transfer above an emission surface: Experimental study on emission rate. Bioresour. Tech. 2009, 100, 4654–4661. [Google Scholar] [CrossRef] [PubMed]
  12. Todd, R.W.; Cole, N.A.; Clark, R.N.; Flesch, T.K.; Harper, L.A.; Baek, B.H. Ammonia emissions from a beef cattle feedyard on the southern High Plains. Atmos. Environ. 2008, 42, 6797–6805. [Google Scholar] [CrossRef]
  13. Bougouin, A.; Leytem, A.B.; Dijkstra, J.; Dungan, R.S.; Kebreab, E. Nutritional and environmental effects on ammonia emissions from dairy cattle housing: A meta-analysis. J. Environ. Qual. 2016, 45, 1123–1132. [Google Scholar] [CrossRef] [PubMed]
  14. Waldrip, H.M.; Todd, R.W.; Cole, N.A. Prediction of nitrogen excretion by beef cattle: A meta-analysis. J. Anim. Sci. 2013, 91, 4290–4302. [Google Scholar] [CrossRef] [PubMed]
  15. Huhtanen, P.; Nousiainen, J.I.; Rinne, M.; Kytola, K.; Khalili, H. Utilization and partition of dietary nitrogen in dairy cows fed grass silage-based diets. J. Dairy Sci. 2008, 91, 3589–3599. [Google Scholar] [CrossRef] [PubMed]
  16. Misselbrook, T.H.; Powell, J.M. Influence of bedding material on ammonia emissions from cattle excreta. J. Dairy Sci. 2005, 88, 4304–4312. [Google Scholar] [CrossRef]
  17. Monteny, G.J.; Erisman, J.W. Ammonia emission from dairy cow buildings: A review of measurement techniques, influencing factors, and possibilities for reduction. Neth. J. Agric. Sci. 1998, 46, 225–247. [Google Scholar]
  18. Commonwealth Scientific and Industrial Research Organisation (CSIRO). Nutrient Requirements of Domesticated Ruminants; CSIRO Publishing: Melbourne, Australia, 2007.
  19. McGeough, E.J.; O’Kiely, P.; Hart, K.J.; Moloney, A.P.; Boland, T.M.; Kenny, D.A. Methane emissions, feed intake, performance, digestibility and rumen fermentation of finishing beef cattle offered whole-crop wheat silages differing in grain content. J. Anim. Sci. 2010, 88, 2703–2716. [Google Scholar] [CrossRef] [PubMed] [Green Version]
  20. Aguerre, M.J.; Wattiaux, M.A.; Powell, J.M.; Broderick, G.A.; Arndt, C. Effect of forage-to-concentrate ratio in dairy cow diets on emission of methane, carbon dioxide, and ammonia, lactation performance, and manure excretion. J. Dairy Sci. 2011, 94, 3081–3093. [Google Scholar] [CrossRef] [PubMed]
  21. Hristov, A.N.; Oh, J.; Lee, C.; Meinen, R.; Montes, F.; Ott, T.; Firkins, J.; Rotz, A.; Dell, C.; Adesogan, A.; et al. Mitigation of Greenhouse Gas Emissions in Livestock Production—A Review of Technical Options for Non-CO2 Emissions; FAO Animal Production and Health Paper; Food and Agriculture Organization of the United Nations: Rome, Italy, 2013. [Google Scholar]
  22. West, J.W. Factors which Influence Forage Quality and Effectiveness in Dairy Rations. In Proceedings of the Western Canadian Dairy Seminar (USA); 1998. Available online: http://www.wcds.ca/proc/1998/ch13.htm (accessed on 22 February 2017). [Google Scholar]
  23. Bruinenberg, M.H.; Valk, H.; Korevaar, H.; Struik, P.C. Factors affecting digestibility of temperate forages from seminatural grasslands: A review. Grass Forage Sci. 2002, 57, 292–301. [Google Scholar] [CrossRef]
  24. Kujawa, M.A. Energy Partitioning in Steers Fed Cottonseed Hulls or Sugar Beet Pulp. Ph.D. Thesis, Colorado State University, Ann Arbor, MI, USA, 1994. [Google Scholar]
  25. Diarra, B. Net Energy Value of Soybean Hulls as Feed for Sheep. Ph.D. Thesis, Colorado State University, Ann Arbor, MI, USA, 1994. [Google Scholar]
  26. Johnson, K.A.; Johnson, D.E. Methane Emissions from Cattle. J. Anim. Sci. 1995, 73, 2483–2492. [Google Scholar] [CrossRef] [PubMed]
  27. Sauvant, D.; Giger-Reverdin, S. Modelling of digestive interactions and methane production in ruminants. Prod. Anim. 2009, 22, 375–384. [Google Scholar]
  28. National Research Council. Nutrient Requirements of Dairy Cattle, 7th ed.; National Academies Press: Washington, DC, USA, 2001. [Google Scholar]
  29. Huhtanen, P.; Rinne, M.; Nousiainen, J. A meta-analysis of feed digestion in dairy cows. 2. The effects of feeding level and diet composition on digestibility. J. Dairy Sci. 2009, 92, 5031–5042. [Google Scholar] [CrossRef] [PubMed]
  30. Agricultural Research Council (Great Britain). The Nutrient Requirements of Ruminant Livestock: Technical Review (No. 2); Commonwealth Agricultural Bureaux: Slough, UK, 1980. [Google Scholar]
  31. Boadi, D.A.; Wittenberg, K.M. Methane production from dairy and beef heifers fed forages differing in nutrient density using the sulphur hexafluoride (SF6) tracer gas technique. Can. J. Anim. Sci. 2002, 82, 201–206. [Google Scholar] [CrossRef]
  32. Kennedy, P.M.; Charmley, E. Methane yields from Brahman cattle fed tropical grasses and legumes. Anim. Prod. Sci. 2012, 52, 225–239. [Google Scholar] [CrossRef]
  33. Grainger, C.; Williams, R.; Clarke, T.; Wright, A.D.G.; Eckard, R.J. Supplementation with whole cottonseed causes long-term reduction of methane emissions from lactating dairy cows offered a forage and cereal grain diet. J. Dairy Sci. 2010, 93, 2612–2619. [Google Scholar] [CrossRef] [PubMed]
  34. Moate, P.J.; Williams, S.R.O.; Grainger, C.; Hannah, M.C.; Ponnampalam, E.N.; Eckard, R.J. Influence of cold-pressed canola, brewers grains and hominy meal as dietary supplements suitable for reducing enteric methane emissions from lactating dairy cows. Anim. Feed Sci. Technol. 2011, 166–167, 254–264. [Google Scholar] [CrossRef]
  35. Doreau, M.; Chilliard, Y.; Bauchart, D.; Michalet-Doreau, B.; Fléchet, J.; Lefaivre, R.; Legay, C.; Meyer, M.; Ollier, A. Influence of different fat supplements on digestibility and ruminal digestion in cows. Ann. Zootech. INRA/EDP Sci. 1991, 40, 19–30. [Google Scholar] [CrossRef]
  36. Smits, M.C.J.; Monteny, G.J.; van Duinkerken, G. Effect of nutrition and management factors on ammonia emission from dairy cow herds: Models and field observations. Livest. Prod. Sci. 2003, 84, 113–123. [Google Scholar] [CrossRef]
Figure 1. Gas emissions represent losses of nutrients and energy from cattle operations.
Agriculture 07 00016 g001
Figure 2. Histograms of NH3-N loss as a percentage of N intake for: (a) beef feedlots; (b) dairy open-lots; (c) dairy barns with natural ventilation; and (d) dairy barns with mechanical ventilation.
Agriculture 07 00016 g002
Figure 3. Fit plots for NH3-N loss as a percentage of N intake (Nloss%) as a function of air temperature (T) for: (a) beef feedlots; (b) dairy open-lots; and (c) dairy barns with natural ventilation.
Agriculture 07 00016 g003
Figure 4. Fit plots for (a) NH3 emission rate and (b) NH3-N loss as a percentage of N intake (Nloss%) as a function of dietary crude protein (CP) for beef feedlots.
Agriculture 07 00016 g004
Figure 5. Histograms of CH4 conversion factors on gross energy intake (GEI) or digestible energy basis: (a) Ym: CH4 loss as a percentage of GEI; and (b) Dm: CH4 loss as a percentage of digestible energy intake.
Agriculture 07 00016 g005
Figure 6. Fit plots for (a) Ym (CH4 loss as a percentage of GEI) and (b) Dm (CH4 loss as a percentage of digestible energy intake) as a function of feed energy digestibility.
Agriculture 07 00016 g006
Figure 7. Fit plots for (a) Ym (CH4 loss as a percentage of GEI) and (b) Dm (CH4 loss as a percentage of digestible energy intake) as a function of energy intake level (EIL).
Agriculture 07 00016 g007

