1. Introduction
Most of the countries around the North Indian Ocean are threatened by storm surges. According to Lamont-Doherty Earth Observatory of Columbia University, since 1970 around 65% of all lives lost as a result of tropical cyclone occurred within the North Indian Ocean. For the low-lying coastal regions accompanied by inundation from upstream rivers and downstream tides, the coast of Bangladesh is always at risk of storm surge flooding induced by the tropical cyclone (TC). TC that occur in the Bay of Bengal generally travels from east to west ascribable to general circulation of the atmosphere. But due to the phenomenon of re-curvature of tropical cyclones in the Bay of Bengal, they turn towards north or even northeast [
1]. Bangladesh is on the receiving end of about two-fifths of total storm surge impacts in the world [
2]. The frequency of cyclone in any of the pre-monsoon and post-monsoon months is independent of the previous months and there is no trend in the frequency of tropical cyclone [
3]. During the years 1797 to 1991, Bangladesh has been hit by 59 severe cyclones, 32 of which were accompanied by storm surge [
4], and since 1991 to 2017 about 17 events of TCs crossed over the coast of Bangladesh. Deaths and destruction during the cyclones in Bangladesh are primarily attributed to surge waves [
5]. This hazard amplifies, even more when TC landfalls during high tide. The range of astronomical tide along the coast of Bangladesh is so large that the storm-induced sea level is apt to become very high [
6].
High astronomical tide [
7] and the shallow continental shelf [
8] of the Bay of Bengal are the main factors that amplify the surges as the cyclone approaches the coast. Cyclones pummeled Bangladesh when the astronomical tide is at its peak, make catastrophic effect on the coast of Bangladesh like tropical cyclones: 1991 BoB cyclone, 1970 Bhola cyclone [
9]. A recent cyclone Mora made landfall in Bangladesh coast on 30 May 2017. An estimated 3.3 million people have been affected by this cyclone which was a Category 1 cyclone in Saffir-Simpson Hurricane Wind Scale (not in terms of surge depth and damage). According to As-Salek and Yasuda [
10], at places of low tide, the rate of progression of the surge is reduced as depth decreases since the propagation speed of the long wave depends on the square root of the total depth of water. So, if a cyclone of similar magnitude like Mora were to make landfall in the coast of Bangladesh during high tide, what might be the potential for inundation by storm surge be? This is the question that stirred our study.
Doodson studied the shapes and heights of storm surges that are affected by the tide-surge interaction in a uniform long gulf [
11]. Few studies [
12,
13,
14,
15,
16] focusing on investigation of the tide-surge interaction in the southern North Sea and the River Thames concluded that the pattern of interaction causes positive surge peaks to avoid times of high tidal water especially during the rising tide. Studies conducted in the Irish Sea by Jones and Davies [
17,
18] showed that tide-surge interaction significantly modified water elevations and currents at the time of the surge in the shallow regions. In the Bay of Bengal, the effect of astronomical tide was studied by Das, Sinha, and Balasubramanyam [
19] on the open boundary of the computational grid for 1970 Bhola cyclone and concluded that ‘superposition of the surge on the tide leads to an overestimate of sea level elevation at the time of landfall.’ Generally, during a tropical storm, water level is contemplated as the superposition of tide and surge. Johns et al. studied tide-surge interaction for two cyclone surge events in the Bay of Bengal [
20]. Their numerical results showed larger nonlinear interaction in shallow water.
According to Antony and Unnukrishnan in shallow seas and estuaries changes in amplitude and phase of the surges occur because of significant interaction between tide and surges [
21]. Surge peak in Meghna estuary is most likely to occur at the high tidal water [
8,
10,
22]. During the low tide along the coast, the speed of surge propagation is substantially slower compared with the high tide due to the combined effect of shallow water depth and bottom friction [
6]. As in terms of tide surge dependency, timing of the tidal peak is one of the important factors for surge height.
Flather on his study of the worst affected area due to inundation during 1991 BoB cyclone, showed that flooding in a large area highly depends on the timing of cyclone landfall and its coincidence with the high tide [
23]. As-Salek and Yasuda through numerical modeling studies, found that peak surges can develop during any tidal phase, but if the peak of maximum surge occurs simultaneously with the tidal peak near landfall, the surge spread faster to the north in the Meghna estuary [
10]. As-Salek and Yasuda in their study of tide-surge interaction showed that the cyclones produce higher surges are those which make landfall before the arrival of the local tidal peak than the ones that make landfall after the arrival of the tidal peak [
24].
All these studies mentioned above consider the impact of landfall timing on propagation speed and surge height. But there is no such study that considers impacts of landfall timing (high tide or low tide) on the areal extent of land inundation due to storm surge, variation of inundation depth in inundated area and resulting thrust force exerted by the combined action of cyclone wind and propagation of surge wave. This study aims to focus on this research gap.
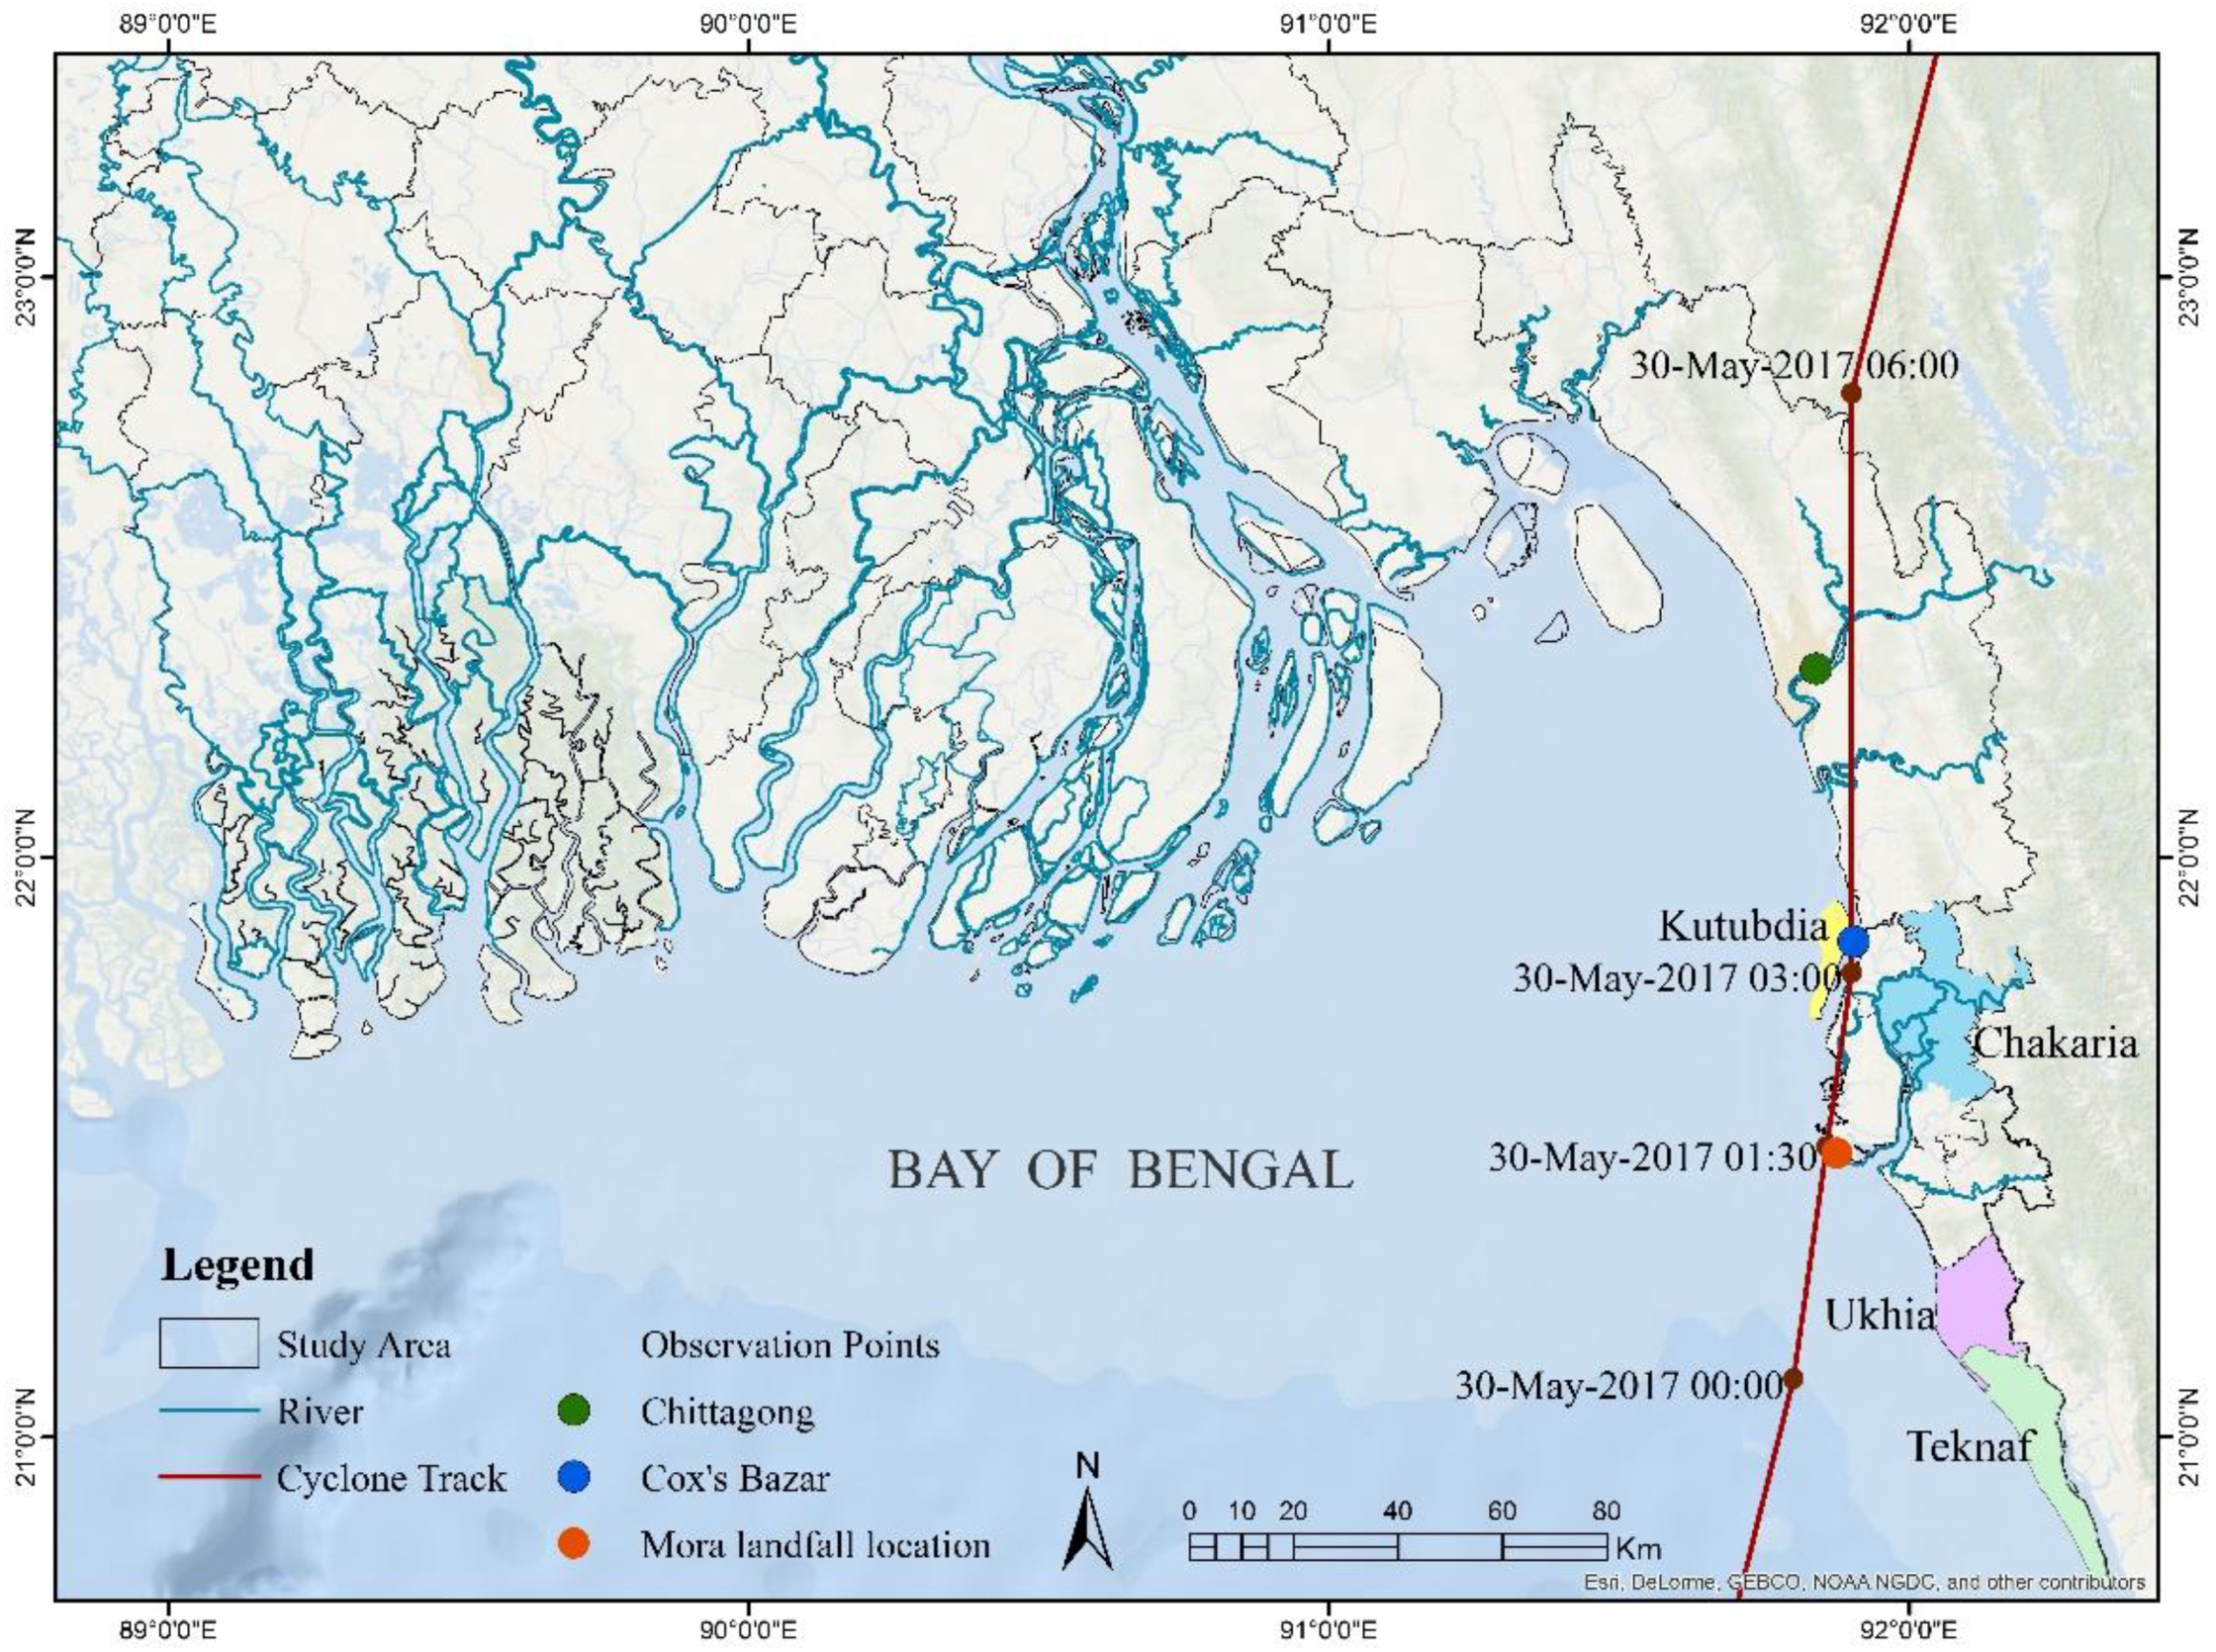
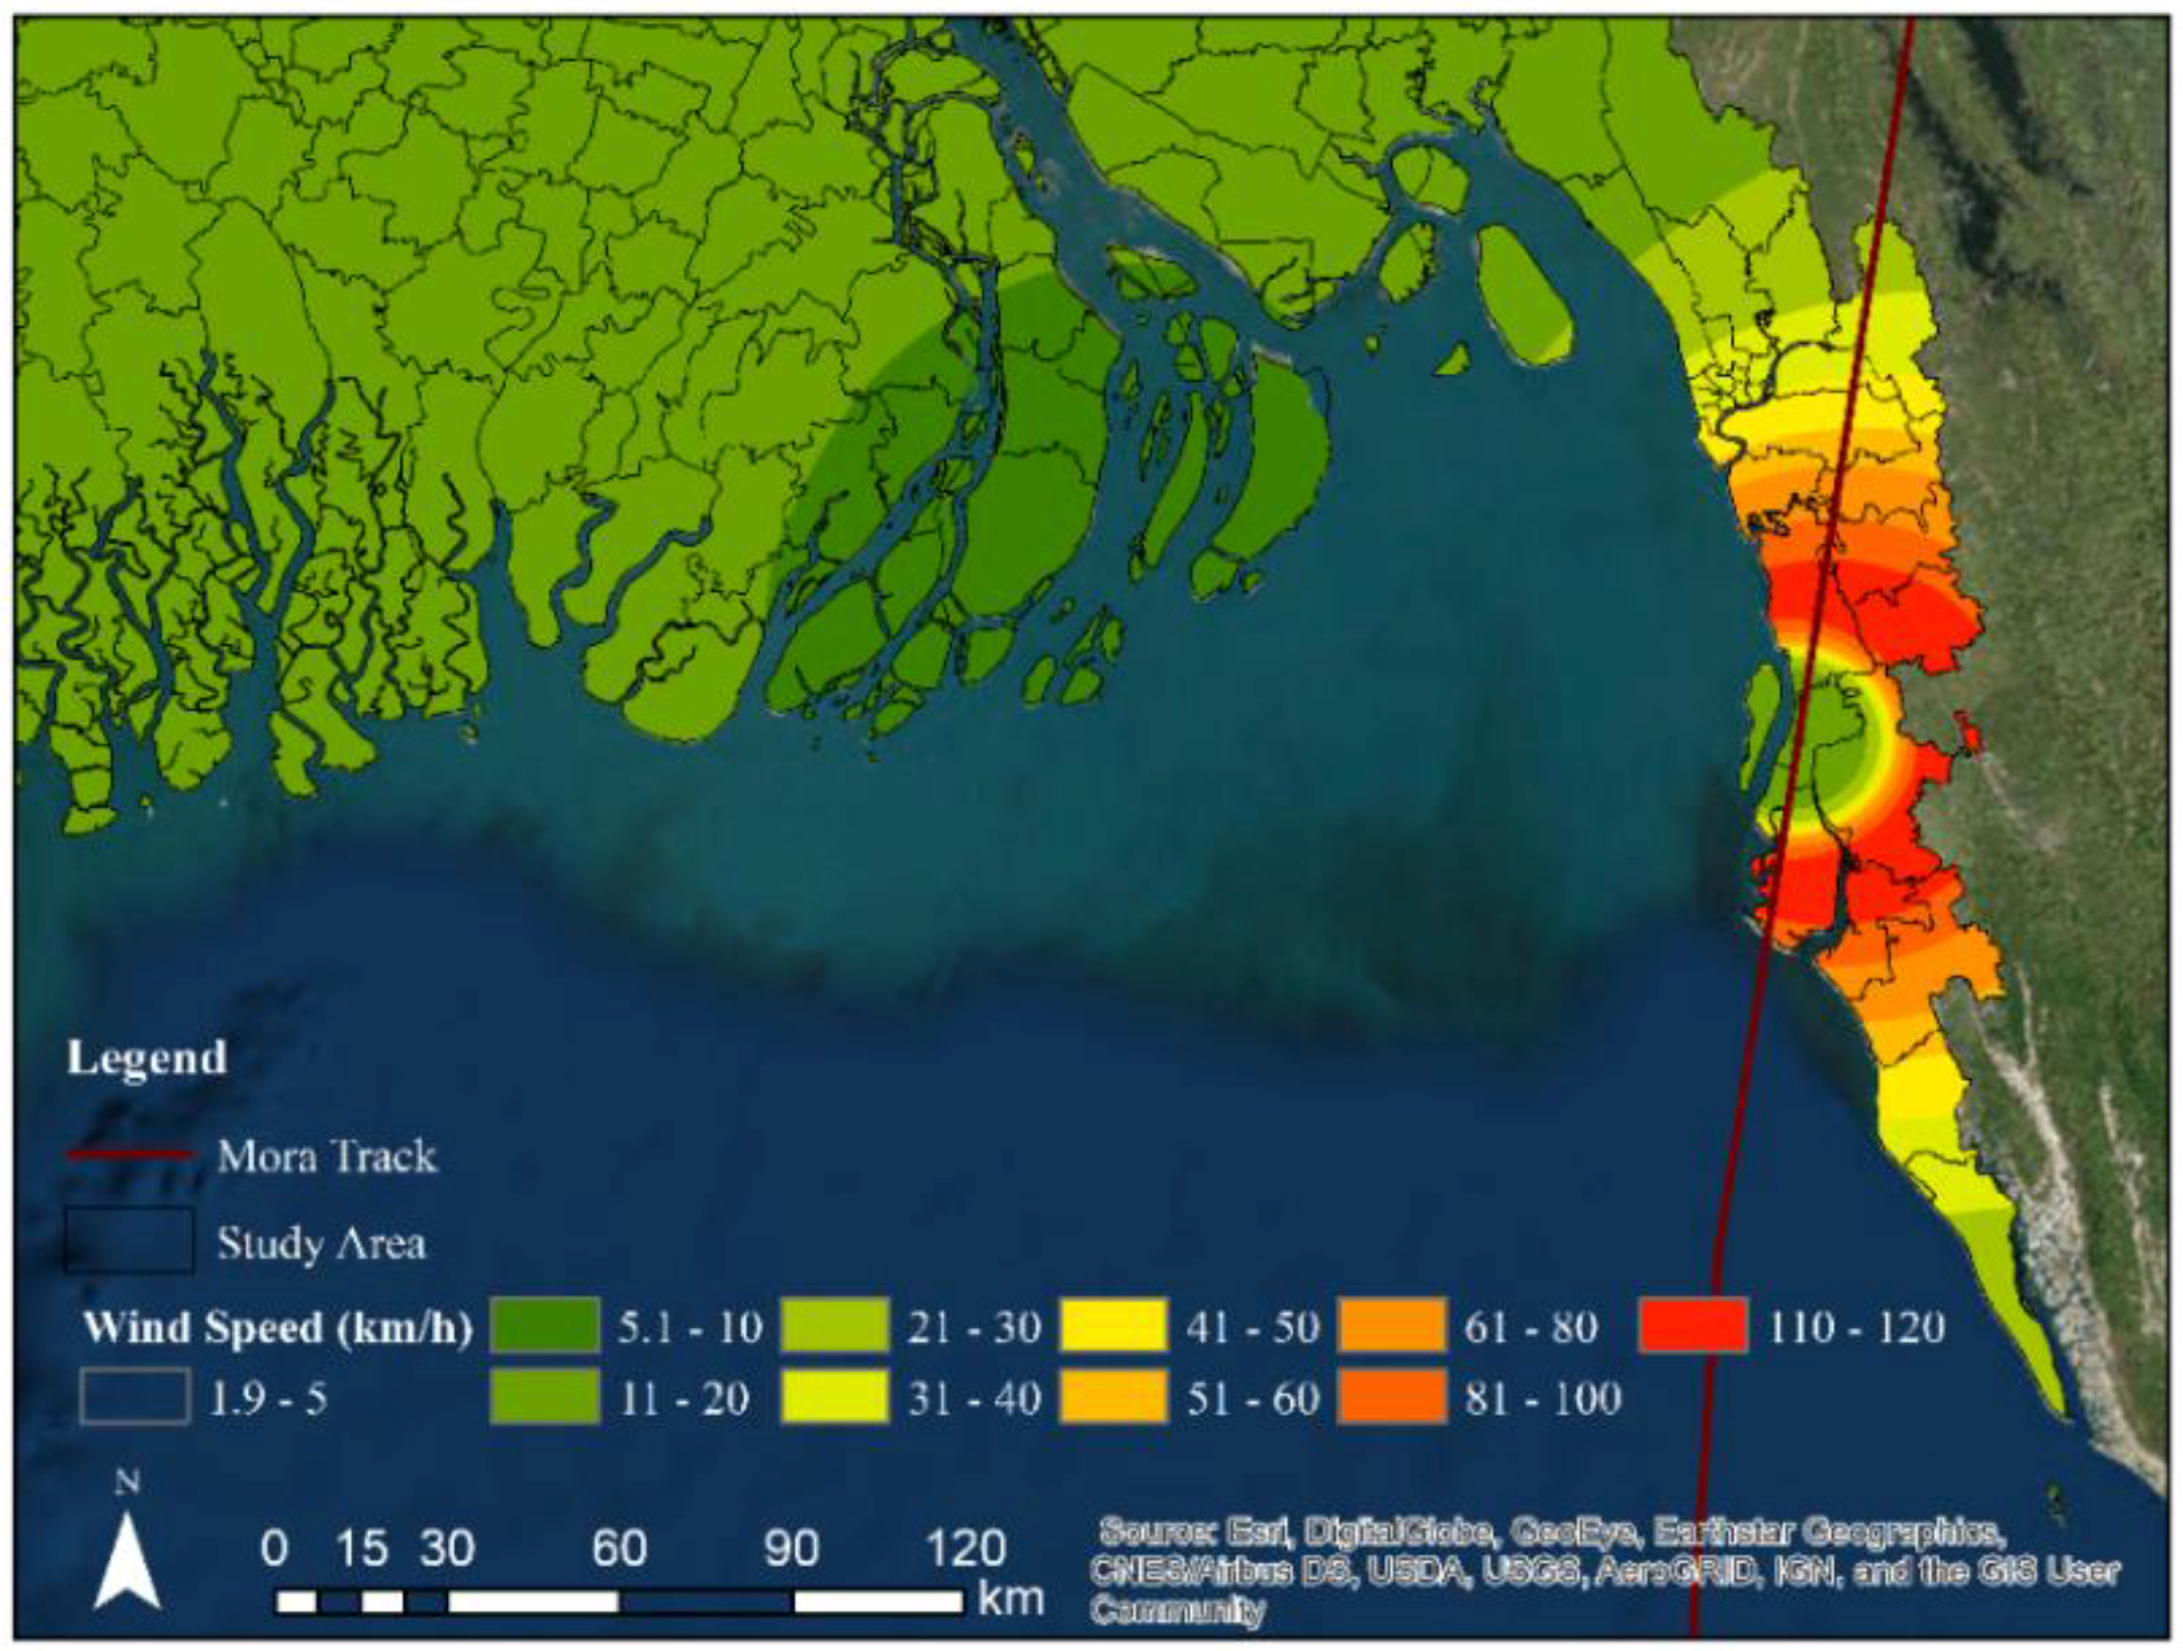
The selected area for this study is the coastal region of Bangladesh (
Figure 1). The area extends from 21°30′ N to 24°00′ N and 86° E to 94° E. The open sea is bounded parallel to latitude 20° N and the land domain considers all the 19 coastal districts of Bangladesh. The cyclone considered in this study is the TC Mora which made landfall during the time of low tide (by 0200–0300 UTC) in the southeastern coast (near 22.0° N/91.9° E) of Bangladesh on 30 May 2017 (
Figure 1). Mora’s maximum sustained winds were near 65 knots (75 mph/120 kph).
2. Methodology
To simulate inundation due to storm surge by cyclonic event, the Delft3D-FLOW (Delft Hydraulics, Delft, The Netherlands, 2006) which is a multidimensional (2D or 3D) open source hydrodynamic and transport model that simulates unsteady flow and transport phenomena resulting from tidal and meteorological forcing was applied. The Delft3D-FLOW model solves the unsteady shallow water equation in two dimensions (depth-averaged). The system of equations consists of the horizontal equations of motion and the continuity equation. The equations were formulated in orthogonal curvilinear co-ordinates or in spherical co-ordinates. The depth-averaged continuity equation was derived by integration the continuity equation and considered the kinematic boundary conditions at water surface and bed level:
with
and
V are the depth averaged velocities in
and
direction:
where
denotes water level above some horizontal plane of reference (m),
and
are flow velocity respectively in the
and
(horizontal, curvilinear co-ordinates) direction, Q representing the contributions per unit area due to the discharge or withdrawal of water,
and
both represent coefficient used to transform curvilinear to rectangular co-ordinates (m),
is the water depth below some horizontal plane of reference (m),
and
are horizontal curvilinear co-ordinates. The momentum equations in
and
directions are given below:
and
represent the hydrostatic pressure gradients,
signifies fluid velocity in z-direction. The forces
and
in the momentum equation represent the unbalance of horizontal Reynold’s stresses.
and
represent the contributions due to external sources or sinks of momentum. These external source and sinks are represented by bed and wind shear stresses.
is the vertical eddy viscosity coefficient and equal to
, where
characterizes the kinetic viscosity of water,
is background horizontal eddy viscosity, and
is computed by a 3D-turbulence closure model. Complete information about the numerical solution method to solve the above equations can be found in the Delft-3D-FLOW manual [
25]. Delft3D-FLOW model was coupled with the Delft-Dashboard which generates the cyclone inputs for the hydrodynamic simulation. In this study, Delft3D-FLOW model coupled with the Delft-Dashboard were utilized to simulate the storm surge due to TC Mora.
2.1. Grid and Bathymetry
Storm surge propagation is typically dependent on estuary bathymetry, land topography, and coastline configuration. In the present study, a spatially variable grid resolution was used which varies from 350 m to 1100 m. The finer grid was applied in the estuaries and over the land to capture the wetting and drying processes accurately whereas the coarser grid was applied in the ocean. Bathymetric data for rivers and estuaries were collected from the bathymetric survey under the ESPA Deltas Project [
26] and DEltas, vulnerability and Climate Change: Migration and Adaptation (DECCMA) project [
27] of Institute of Water and Flood Management (IWFM), BUET. Some of the cross-sectional data were collected from the Bangladesh Water Development Board (BWDB). The open access General Bathymetric chart of the oceans, GEBCO dataset was used to generate the bathymetry of the Bay of Bengal. Inland topographic data are accumulated from the Digital Elevation Model (DEM) of Bangladesh collected from Water Resources Planning Organization (WARPO). All the major rivers and estuaries flowing through the coastal regions to the Bay of Bengal have been taken into account for this study. For some of the rivers and estuaries, local bathymetry correction was required to accurately delineate the land and river/estuary interface.
2.2. Wind and Pressure Fields
To define
and
in Equation (3), wind and pressure fields need to be defined. A tropical cyclone is a rapidly-rotating storm system characterized by a low-pressure center, powerful winds, and a spiral arrangement of thunderstorms that produce massive rain. The track data for this study was captured from Indian Meteorological Department (IMD) [
28]. Surge height, particularly in Bangladesh, is strongly dependent on the cyclone track. Utilizing the wind speed and pressure drop values from the track files mean sea level pressure values along with surface winds were generated using the Delft-Dashboard, a standalone MATLAB based graphical user interface. Cyclone wind fields were generated around the center position of the storm, following Holland’s method in order to obtain the wind and pressure fields. According to the Holland’s equation, the geostrophic wind speed
of a cyclone is expressed as [
29]
Here,
r is the distance from the center of the cyclone, Coriolis parameter is represented by
,
is the density of air (assumed to constant equal to 1.10 kgm
−3),
is the difference of ambient pressure (
) and central pressure (
). Parameters A and B are determined empirically. Parameter A determines the relation of the pressure or wind profile relative to the origin, and parameter B defines the shape of the profile. Radius of maximum winds (
) is independent of the relative values of ambient and central pressure and it is defined entirely by the scaling parameters A and B. By equating
= 0, 𝑅𝑤 can be given as follows:
. Parameters
A and
B can be expressed as functions of measurable quantities as follows:
; where
is the maximum wind velocity. The data of
,
and
for tropical cyclone Mora was collected from Indian Meterological Department [
30].
2.3. Roughness and Wind Drag Coefficient
For bottom roughness, spatially varying Manning’s roughness value was specified for various locations along the domain. In selecting the roughness values, methods described in [
31] and [
32] was followed. Depending upon the vegetation types somewhat modified values were used. The shear-stress at the bed induced by turbulent flow was assumed to be given by:
, where
is the magnitude of the depth-averaged horizontal velocity and
is determined using Manning’s equation. The Manning’s coefficient values used in the model are: river (0.015), land (0.025), mangrove (0.08), ocean (0.01). The wind drag coefficient linearly varies with the wind speed and inserts increasing wind shear stress on the water surface with increasing wind speed. The magnitude of the wind shear-stress is defined as
, where
is the density of air,
is the wind speed at 10 meter above the water surface (time and space dependent) and
is the wind drag coefficient.
2.4. Boundary Conditions
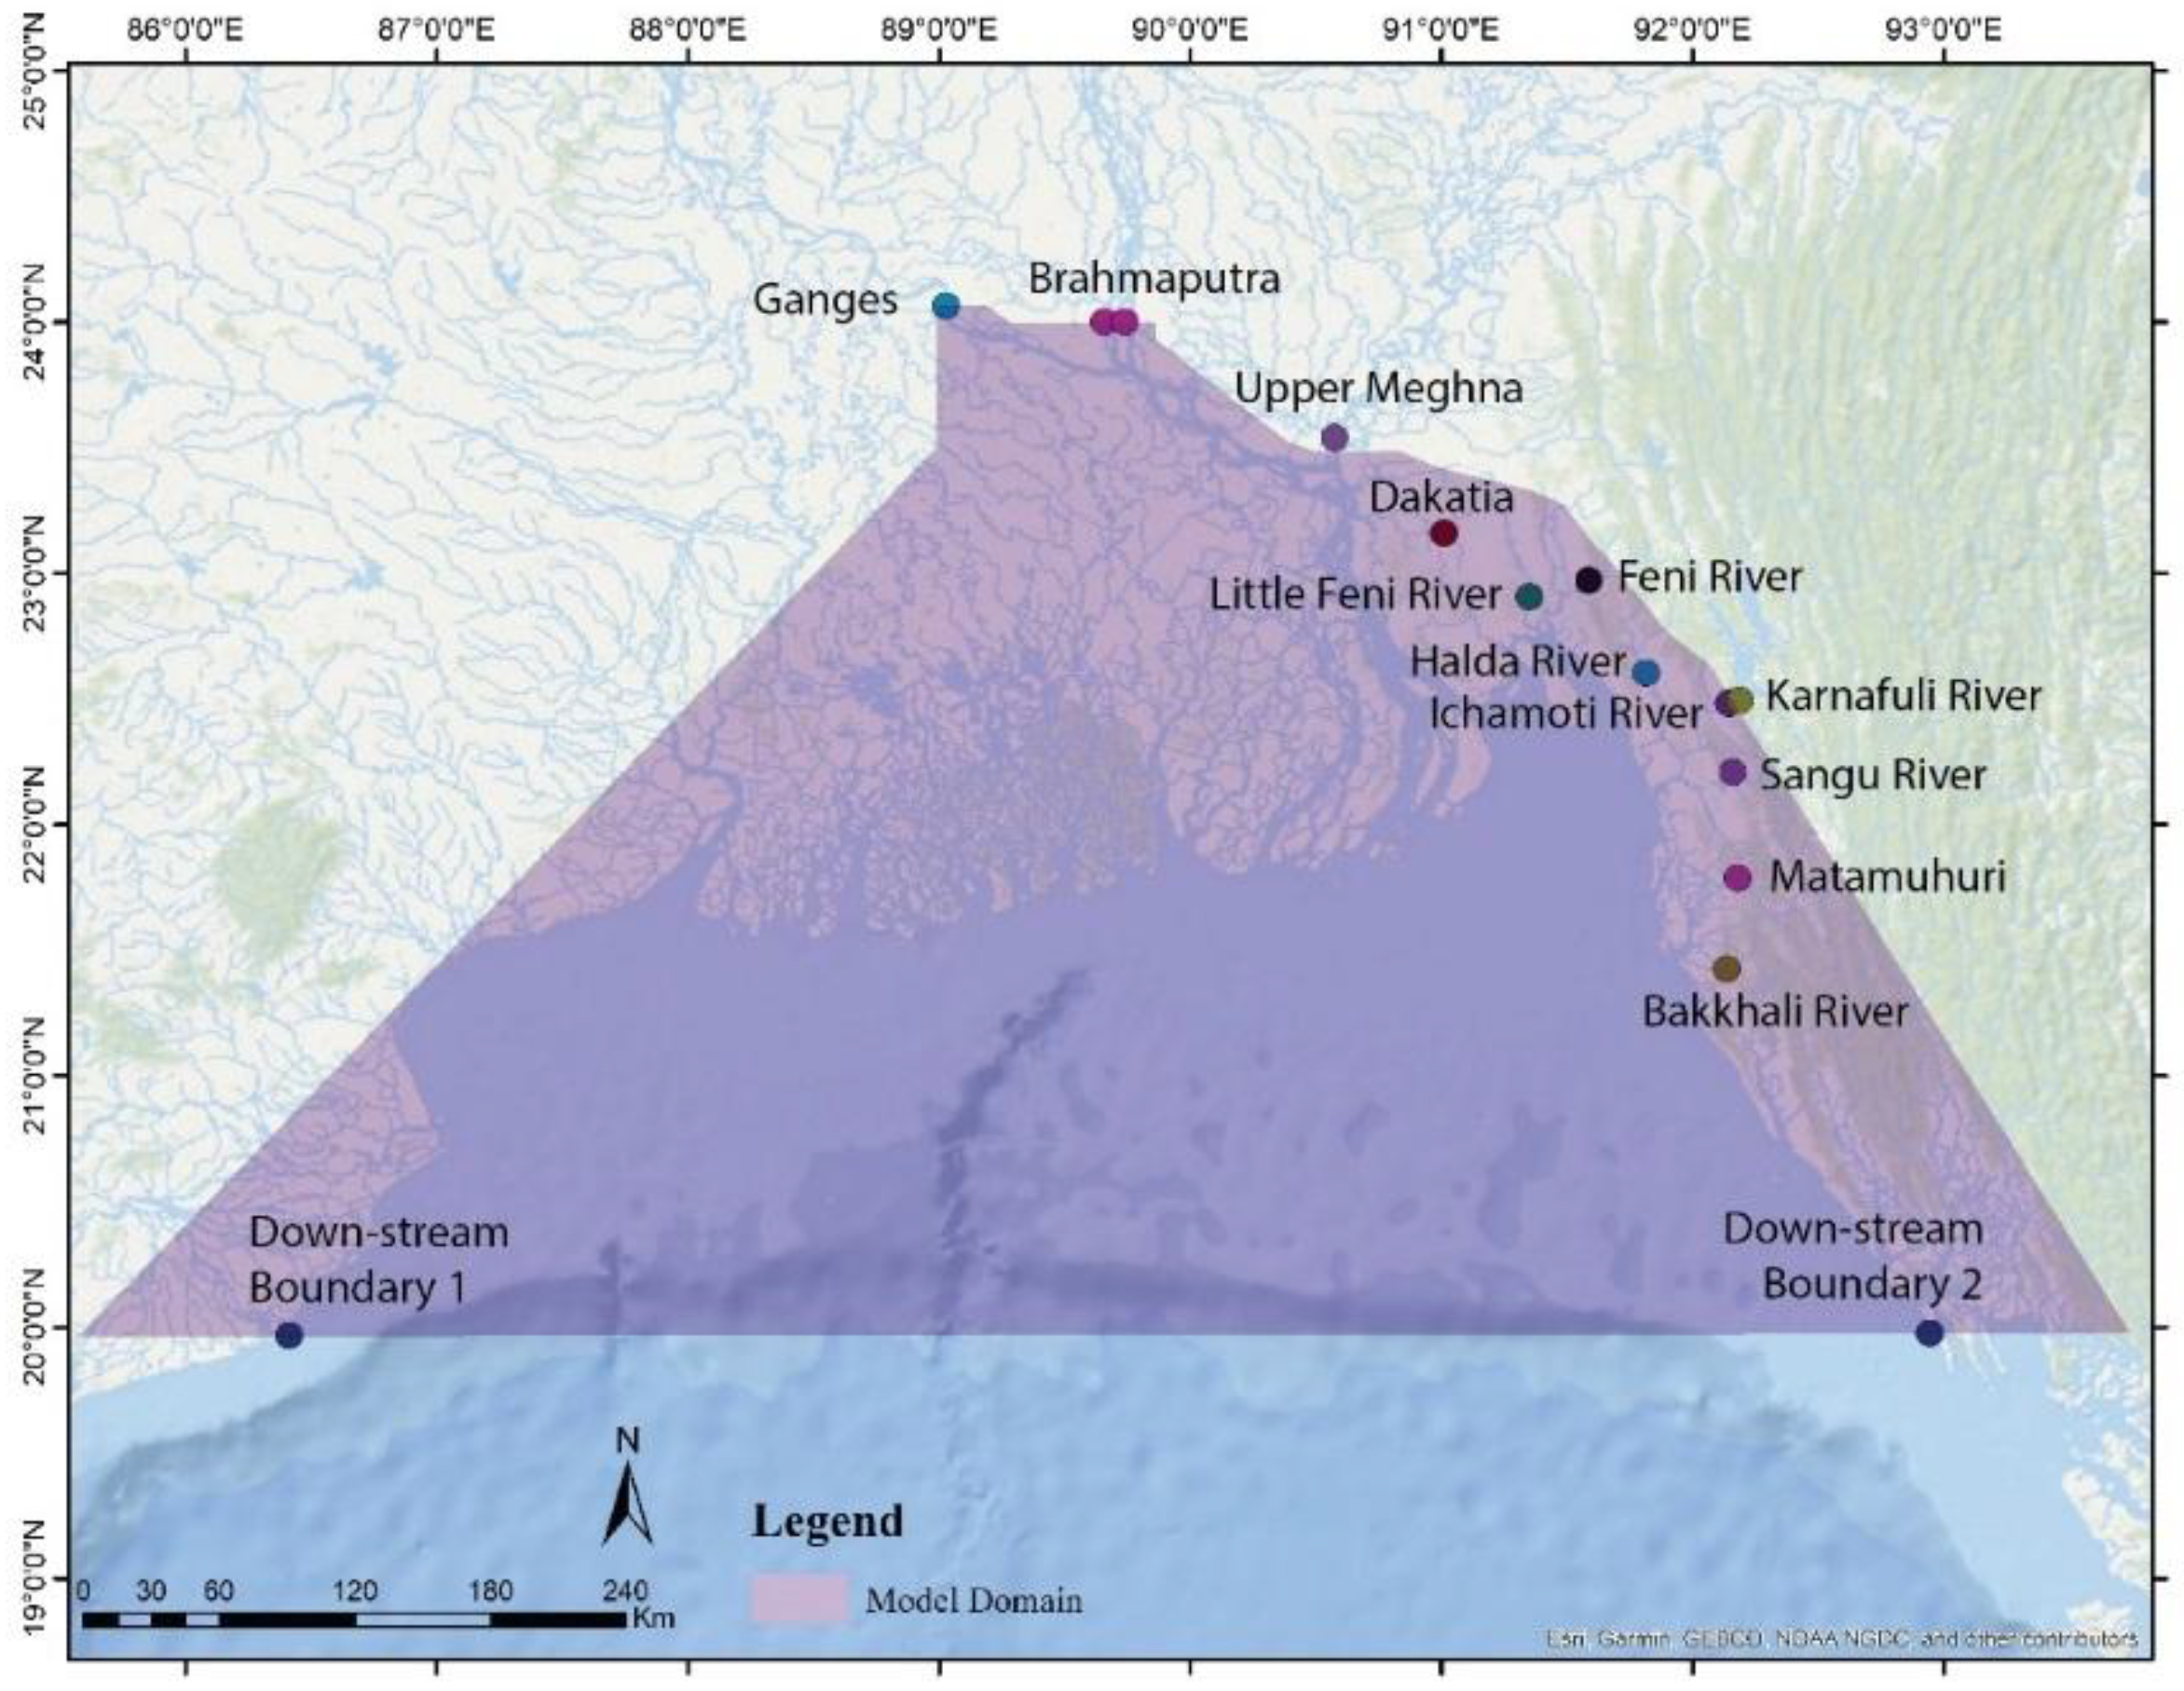
The model domain contains all the 19 districts of Bangladesh coastal zone and almost all the major rivers/estuaries (widths above 100 m) are included in the model domain. The model has three major upstream discharge boundaries that represent flow from the three rivers—the Ganges, Brahmaputra and Upper Meghna (
Figure 2). The specific locations of major upstream boundaries are Hardinge Bridge at the Ganges, Bahadurabad at Brahmaputra, and Bhairab Bazar at Upper Meghna.
Upstream discharge boundaries of the model are specified at the rivers Ganges, Brahmaputra, Upper Meghna, Dakatia, Halda, Ichamoti, Matamuhuri, Bakkhali, Karnafuli, Feni, and Little Feni (
Figure 2). Due to the unavailability of measured data, model data was used to set up boundary conditions. The upstream boundary condition for the storm surge model was discerned by daily discharge data, while hourly tidal water level data was ascertained as the downstream boundary. Time series model data of daily discharge was collected from the Integrated Catchment Model (INCA) [
33] at the mouths of major rivers: the Ganges, the Brahmaputra, and the Upper Meghna River for the year of 2017. Downstream, the model domain is extended towards the Bay of Bengal up to the coast of India at Bhubaneshwar in the south, Odisha in the west and Sittwe coast of Myanmar in the east. Downstream water level data for the Bay of Bengal was captured from the results of GCOMS ocean model for the year 2017 [
34]. The starting point for the downstream boundary situated at the latitude of 19.9665 and longitude of 86.4141 while the end at the latitude of 19.9751 and longitude of 92.9433.
2.5. Computation of the Thrust Force
For calculating thrust force, a semi-analytical model named the Dynamic Force Model (DFM) developed by Akter [
35] was used. In this model the force exerted by water mass generated from combined momentum of moving surge and cyclone wind is:
Here Rh represents the hydrolic radius, h is the surge depth, u signifies surge velocity, denotes the wind speed, Cw and Cd signify wind drag coefficient and water drag coefficient, respectively, and are the air density and water density repectively. S0 represents bed slope and n is Mannings coefficient.
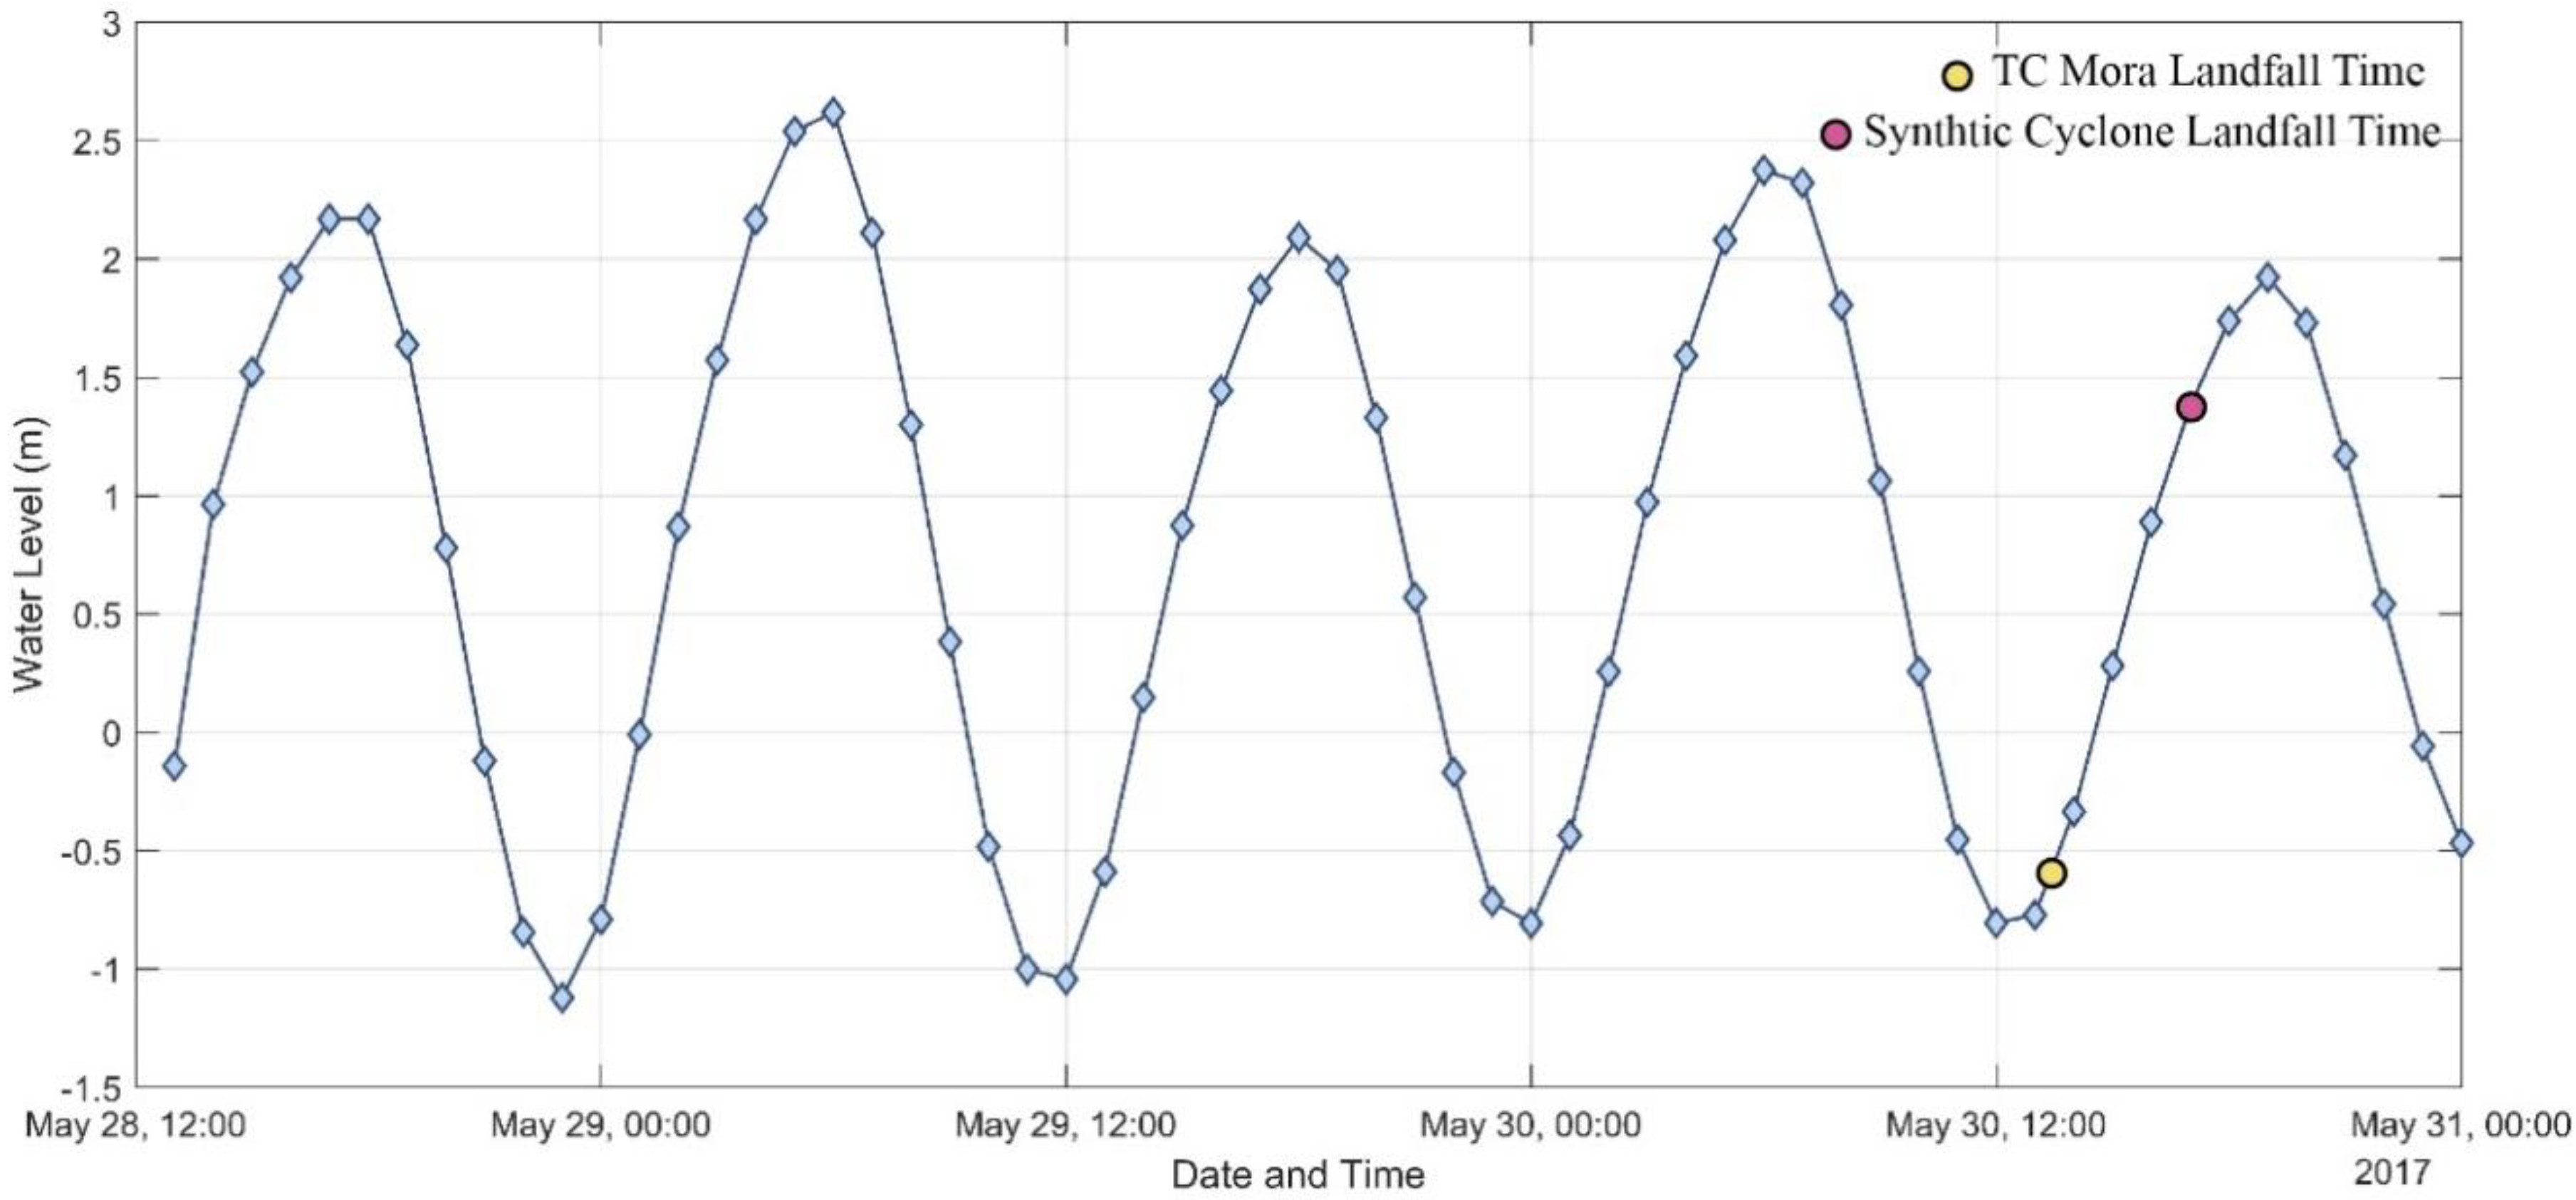
2.6. Selection of Landfall Time for “Synthetic Cyclone”
In the Bangladesh coast, the effect of tidal propagation and its interaction with storm surge is a matter of major concern because of the funneling effect of the Bay together with high tidal amplitude and presence of numerous tidal inlets. Astronomical tidal characteristics also shows spatial variability where tidal range decreases from west coast to central coast and again increases towards east coast [
36]. Present study attempts to investigate the variations in inundation depth, inundated area, wind speed, and thrust force for TC Mora (that made landfall during low tide) and its high tide scenario. In this study, we used TC Mora track to compare inundation of land and thrust force generated from cyclonic event during high tide and low tide. As TC Mora made landfall during low tide, keeping the landfall time (1:30:00 UTC) same for low tide scenario, we changed the landfall time to observe the change in phenomena during high tide (
Figure 3). As the cyclones that make landfall before local tidal peak produce higher surges [
24], to get the worst possible scenario we selected landfall time (5:00:00 UTC) during high tide (
Figure 3). The ‘generated’ cyclonic condition during high tide is termed as ‘synthetic cyclone’ in our study.
2.7. Model Validation
There is a paucity of measured data for past cyclonic events from the gauge stations [
37,
38]. Previous studies focused on past cyclones, such as the April 1991 and November 1970 cyclones [
23], and seven select cyclones from 1970–2000 [
39] also did not have water level data available to validate their results. The hydrographic department of Bangladesh Inland Water Transport Authority (BIWTA) collects tidal water level data at different coastal locations of Bangladesh. Some of the stations have well and float type gauges and others use Visual Tidal Staff (VTS). During extreme climatic event (for example cyclone event) often manual hourly measurement is not possible. Additionally, for low strength cyclone, during quantification of data from the recorded graph using auto gauge, there is high possibility of missing surge signal, as data is interpreted at one-hour interval. According to Chiu and Small measured data from BIWTA shows that observed residuals (considered as surge signal) are smaller than the reported surge heights and many cyclones (in measured data) show no obvious residual at all [
40]. Therefore, measured water level data for the cyclonic events are not reliable for model validation. Furthermore, there is paucity of published literature about the specific cyclone used in this study (TC Mora). Considering all these, for this study the model is validated from two different approaches. In the first approach, the simulated tide (not considering a storm surge) is compared with the tidal water level computed from tide predictor for a selected station. The time of comparison is same as the time of TC Mora landfall. In the second approach, the inundation extent during the landfall time of TC Mora is simulated and compared with the inundation extent of satellite image.
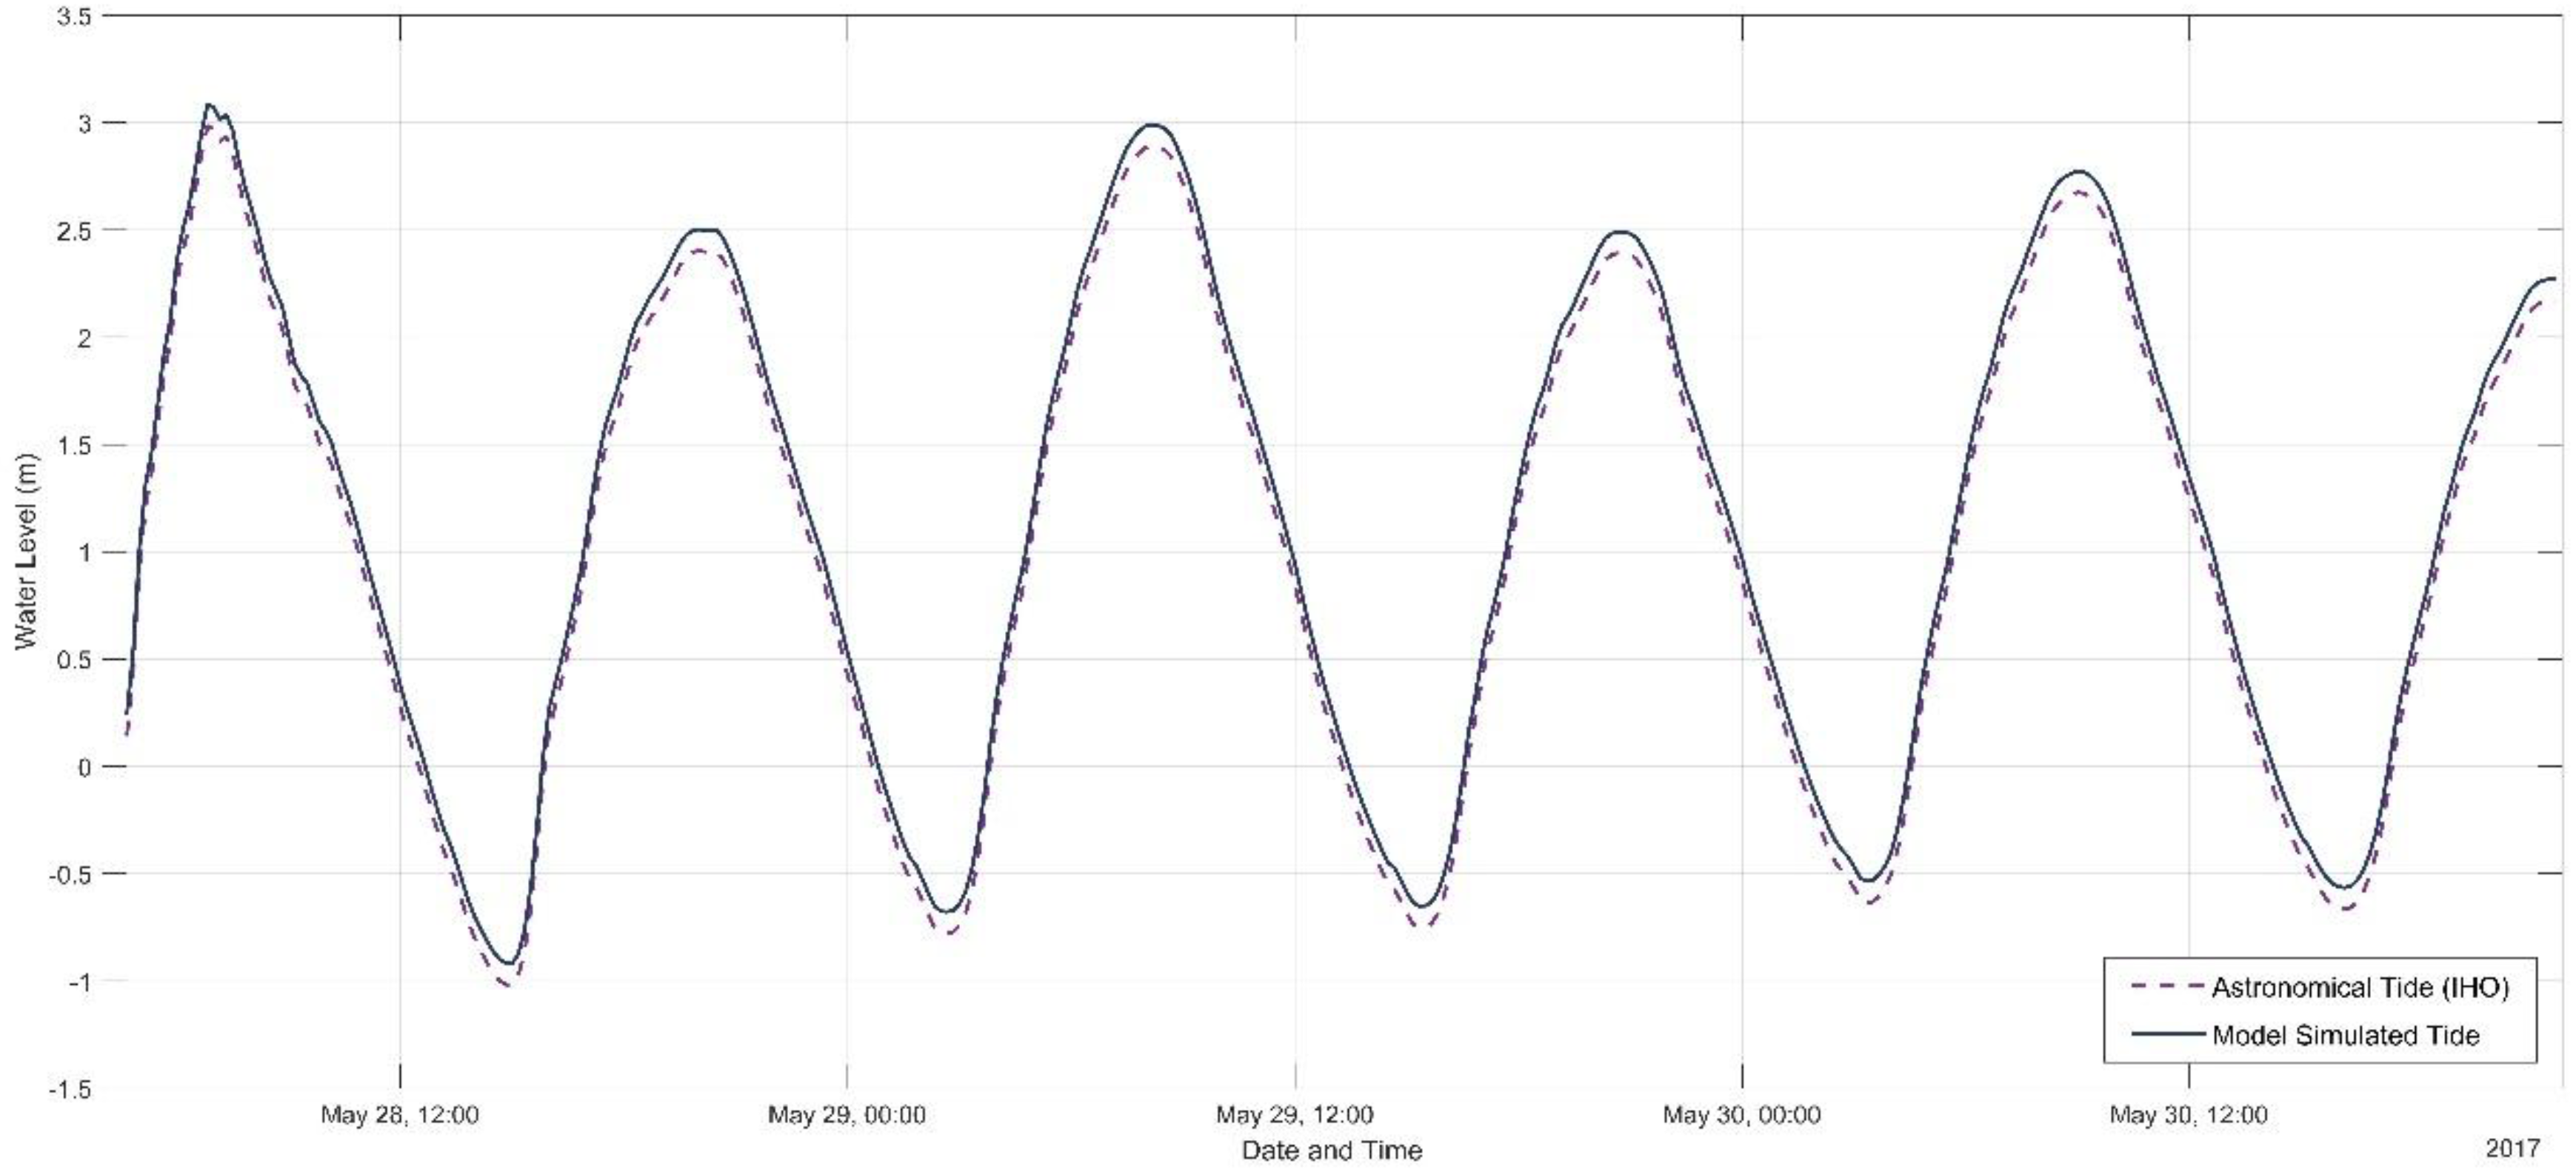
In the first approach of model validation, data source used for the tide predictor is the International Hydrographic Organization (IHO) [
41]. IHO uses 34 constituents to predict the astronomical tide at Chittagong station (see
Figure 1 for the location of Chittagong station). Model-simulated tide is compared with the astronomical tide from IHO during the landfall time of TC Mora (
Figure 4). The comparison shows a reasonable agreement between the model-simulated tide and astronomical tide predicted from the tide predictor with a R
2 value of 0.99.
In the second approach of model validation, satellite-detected flood waters over the affected region is analyzed by using MODIS satellite images acquired by the Terra instrument. The full title of this product is “MODIS/Terra Surface Reflectance Daily L2G Global 250 m SIN Grid V006“. These data are taken every day and delivered as a product called MOD09GQ [
42]. Due to heavy cloud coverage in the satellite image of 30 May 2017, when cyclone Mora made landfall, images of 31 May 2017 is used in this study instead. Red areas shown in
Figure 5a represent standing flood water (by both storm surge and rainfall caused by cyclone cloud) identified from MODIS satellite imagery at a spatial resolution of 250 m.
Figure 5b represents model simulated inundation extent of Chittagong coast on 30 May 2017. For a quantitative comparison between two maps, a one to one function has been defined. By comparing satellite imagery (
Figure 5a) with the simulated inundation extent (
Figure 5b), it is observed that there is 60% match of the inundated area in both images. Due to heavy cloud at isolated places over the study area, inundation condition in that area is not quite observable in the satellite imagery. Moreover, as mentioned before, inundation scenario in this imagery is for 31 May (compared to model simulation of 30 May) and includes rainfall flooding, which is not accounted in the model simulations.
3. Results and Discussion
In this paper, we used numerical models to understand the impact of TC Mora in the coastal region of Bangladesh and probable scenario of the same TC during high tide. As a consequence of changing inundation condition due to high tide, thrust force changes simultaneously which arise due to any cyclonic event.
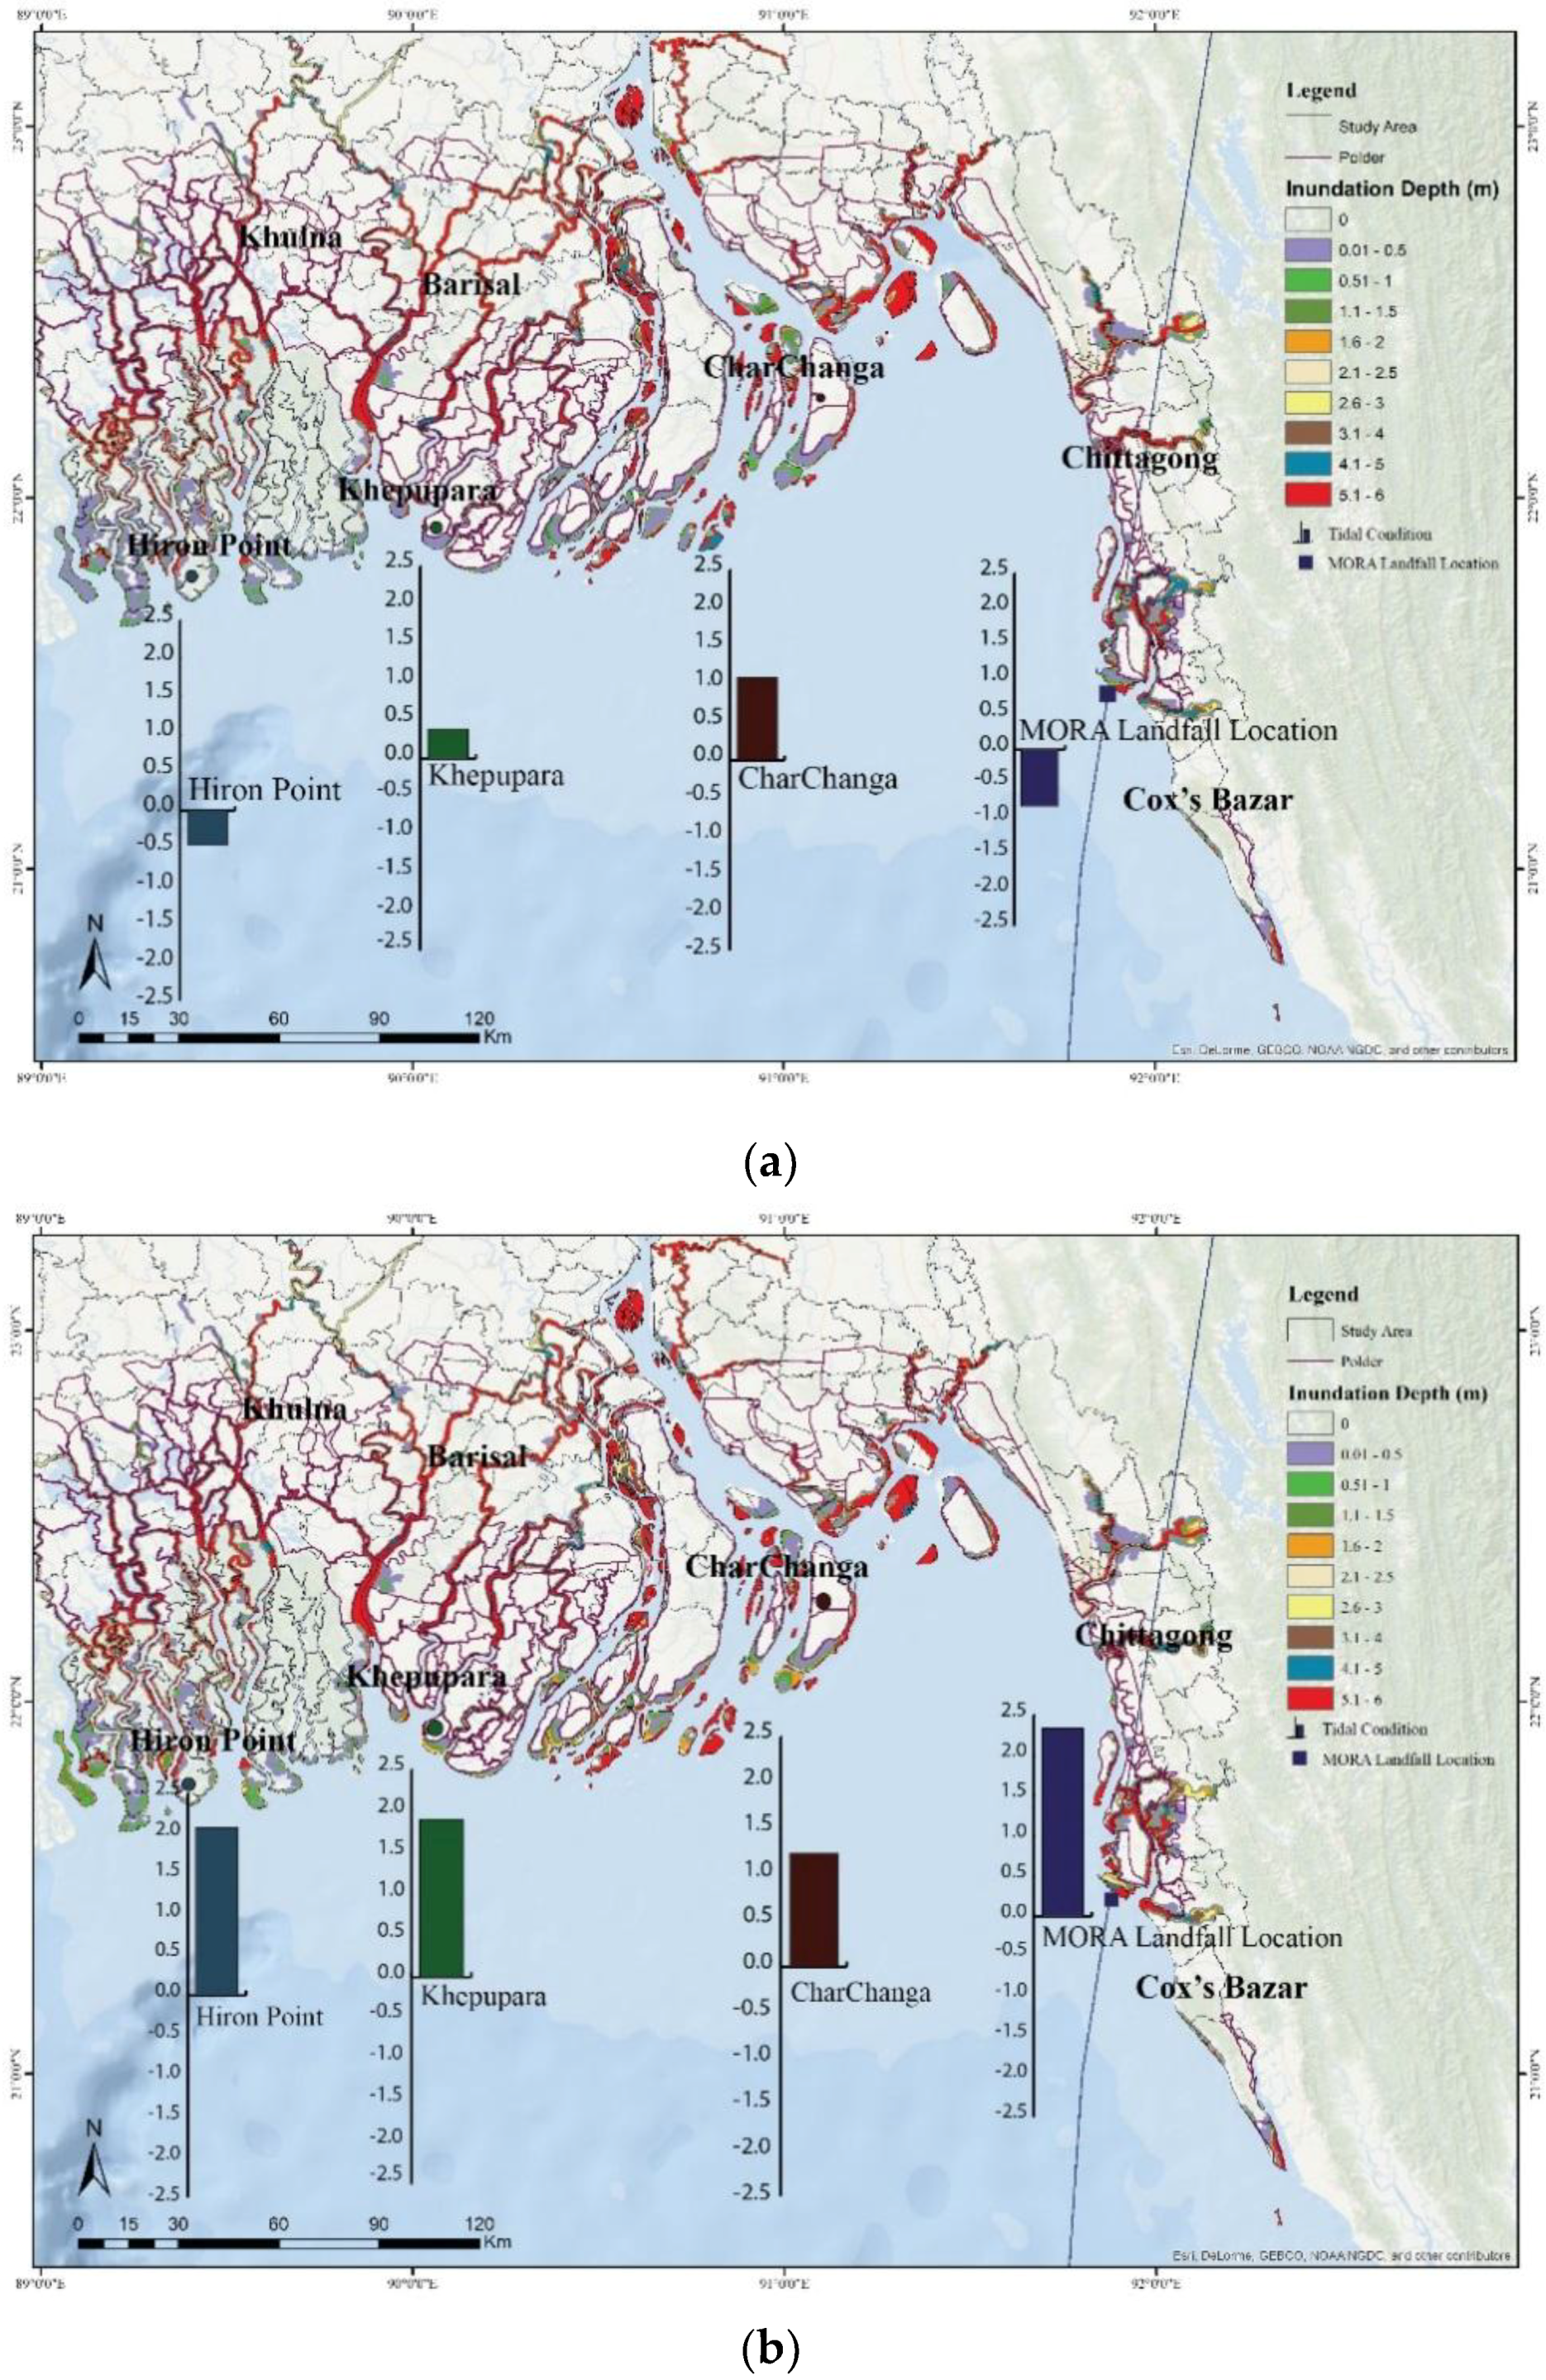
Initially, the model was set up without any cyclonic state to find the water level condition at the time of landfall and during high tide for the stations at Hiron Point, Khepupara, Charchanga, and Mora landfall location (
Figure 6). Our main concern is to know the water level at the Mora landfall location, which was found from the model that water level was about −0.81 m from the MSL at the time of landfall and water level could increase to 2.37 m from the MSL, about three hours later at the time of high tide. Water level also increased at other stations in Hiron Point, Khepupara, Charchanga due to change of tidal phase. The bar diagrams of
Figure 6a,b shows the comparison of water level condition for the non-cyclonic state at four different locations (Hiron Point, Khepupara, Charchanga, and Mora landfall location) with associated inundation extent and depth during Mora cyclone and the synthetic cyclone in the coast of Bangladesh at the time of landfall (
Figure 6a) and at the time of high tide (
Figure 6b), respectively. It is seen that from low tide to high tide, water level at selected stations rose by about 0.25 m to more than 3 m (bar diagrams of
Figure 6a,b). Variation in inundation extent and depth due to this change in tidal phase will be discussed more elaborately in the following sections.
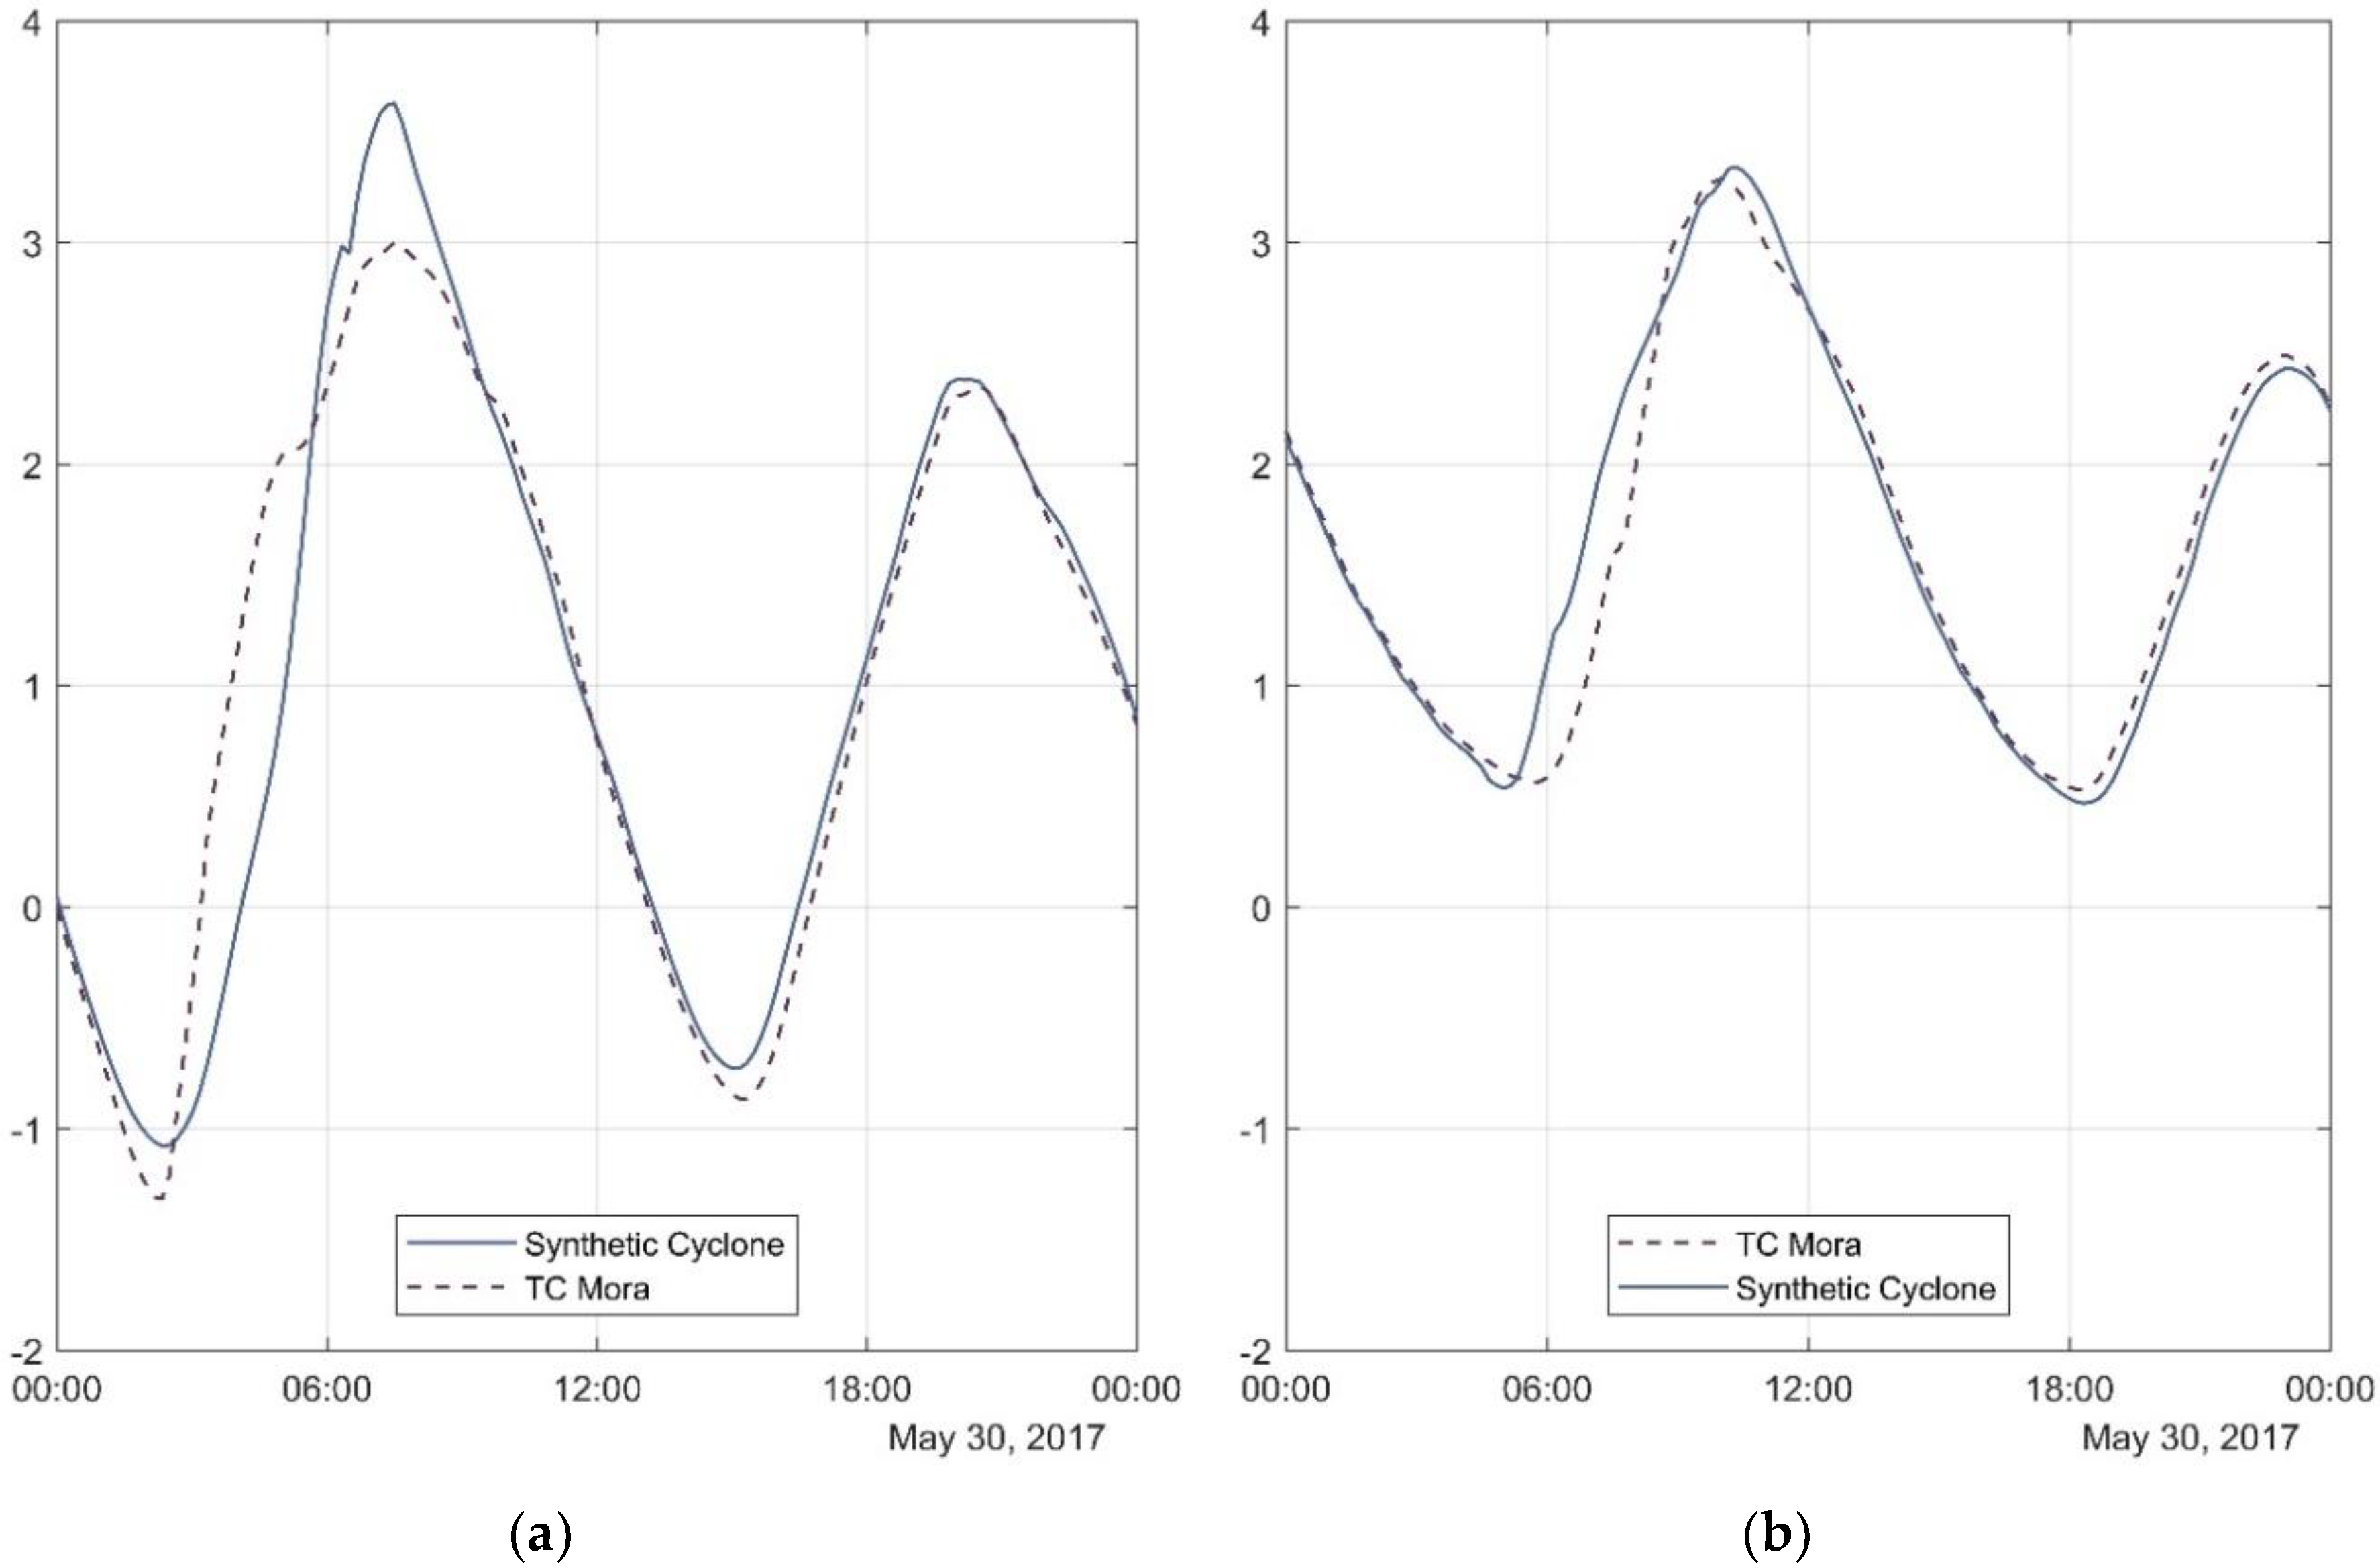
Figure 7 provides comparison of water level for TC Mora and the synthetic cyclone at Cox’s Bazar and Chittagong (see
Figure 1 for station location). These two locations are near shore and experienced higher surges (due to TC Mora) compared to other locations along the coast. When storm tides are propagated towards the coast, nonlinear effects result in the amplification of harmonics in shallow water [
43]. Difference in water level due to the synthetic cyclone and TC Mora is more in Cox’s Bazar compared to Chittagong mainly because of the forward motion of the storm where onshore winds are stronger to the right of the cyclone track in the northern hemisphere [
44] and close proximity of the location to cyclone landfall [
6].
Model simulation for TC Mora shows that the surge proliferated into most of the river systems and affected mostly the eastern regions of Bangladesh. The average inundation depth in the upazilas (administrative units of a district) of Chittagong and Cox’s Bazar districts are listed in
Appendix A. In most of the upazillas the inundation depth due to TC Mora was less than the inundation depth due to the synthetic cyclone. For the synthetic cyclone, average inundation depth increased at sixteen upazilas of Chittagong, and eight upazilas of Cox’s Bazar (
Appendix A). The model computed highest average inundation depth for both TC Mora and the synthetic cyclone is found to be about 2.01 m and 2.36 m respectively at the Kutubdia upazila (
Figure 1) of Cox’s Bazar during TC Mora. However, maximum rise in inundation depth is found to be near Teknaf upazila (
Figure 1) where water depth upsurged from 0.99 m during TC Mora to 1.91 m during the synthetic cyclone. Overall, upazilas in Cox’s Bazar have experienced more rise in average surge depth (
Appendix A). The change in inundation depth is related to the change in inundation extent. The relation is not truly linear. This depends on the local topography, surge propagation direction and surge velocity. The next section describes the impacts on inundated extent due to changed tidal phase.
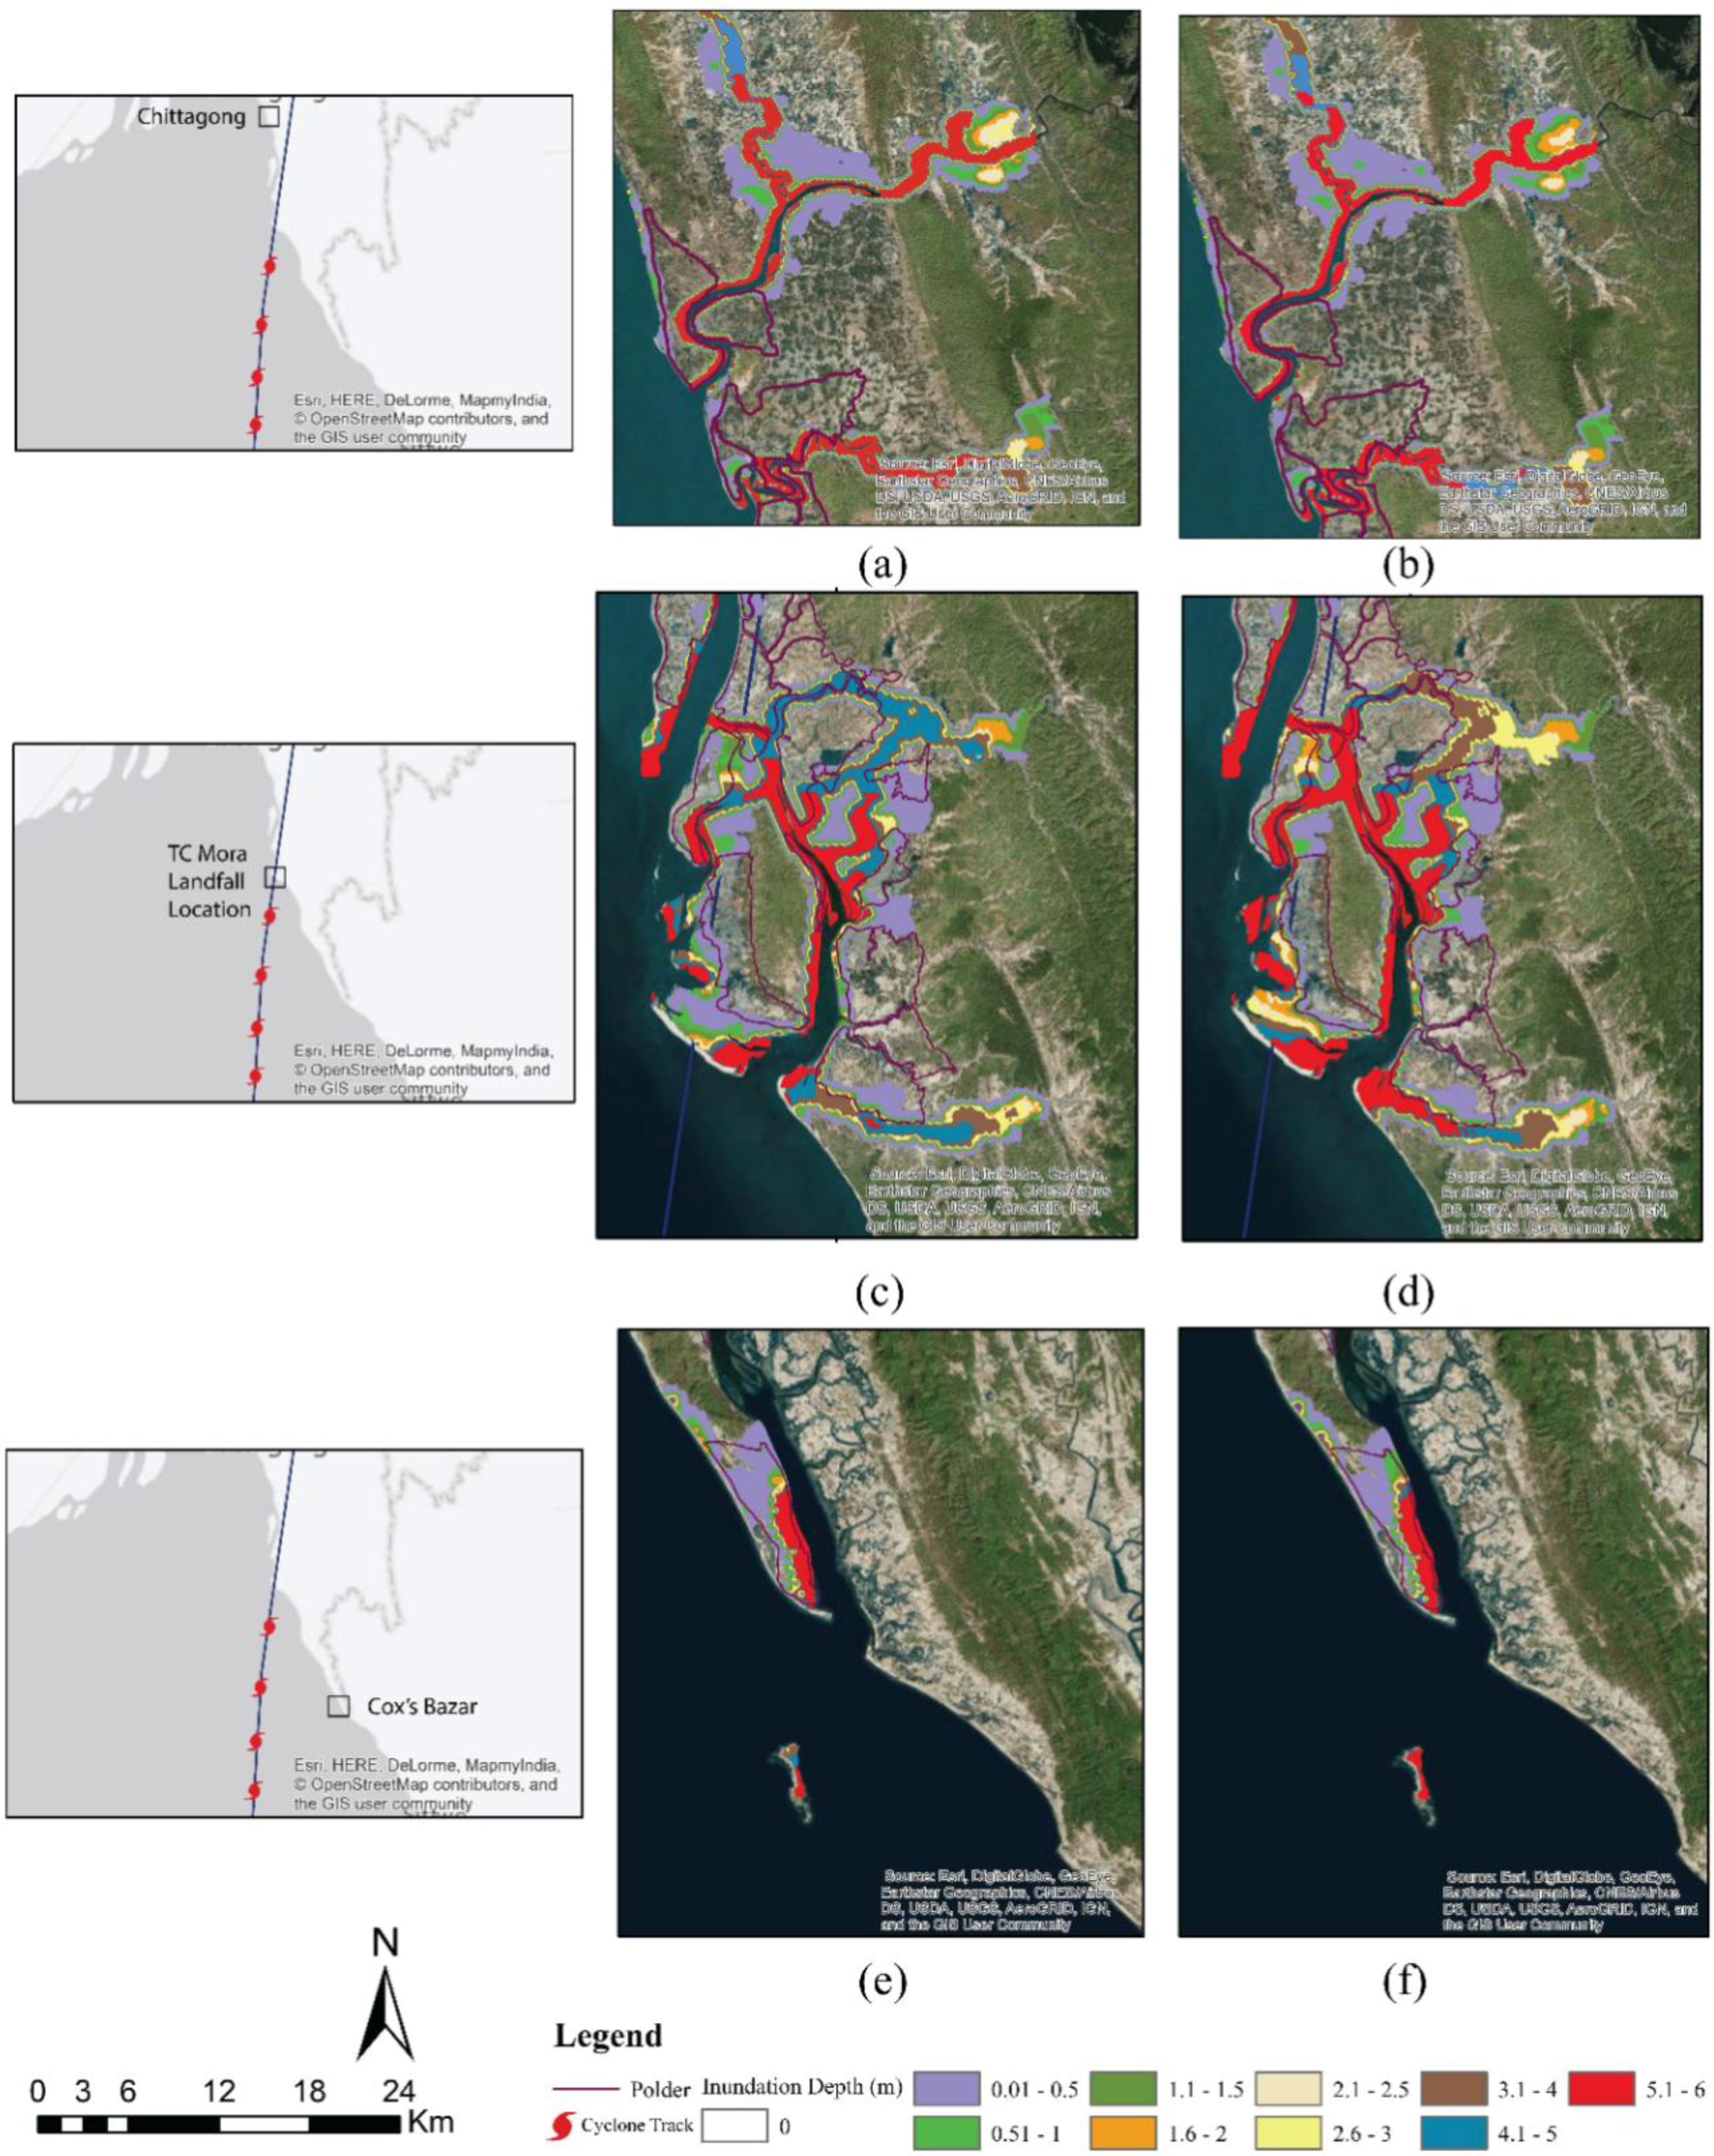
To study the difference in inundation extent due to TC Mora and the synthetic cyclone, three strategic locations in the study area are selected (Chittagong, Mora landfall location and Cox’s Bazar) and the result is shown in
Figure 8.
Table 1 represents inundated area in km
2 for Chittagong, Mora landfall location and Cox’s Bazar. In Chittagong, area under water depth of 0.51 m to 2 m increases due to the synthetic cyclone. For Mora landfall location, inundated area increases till water depth of 4.0. But in Cox’s Bazar, the inundated area shows small increase till water depth of 2 m. This result shows that the impact of tidal phase on inundated area and inundated depth due to storm surge is not linear and is location specific.
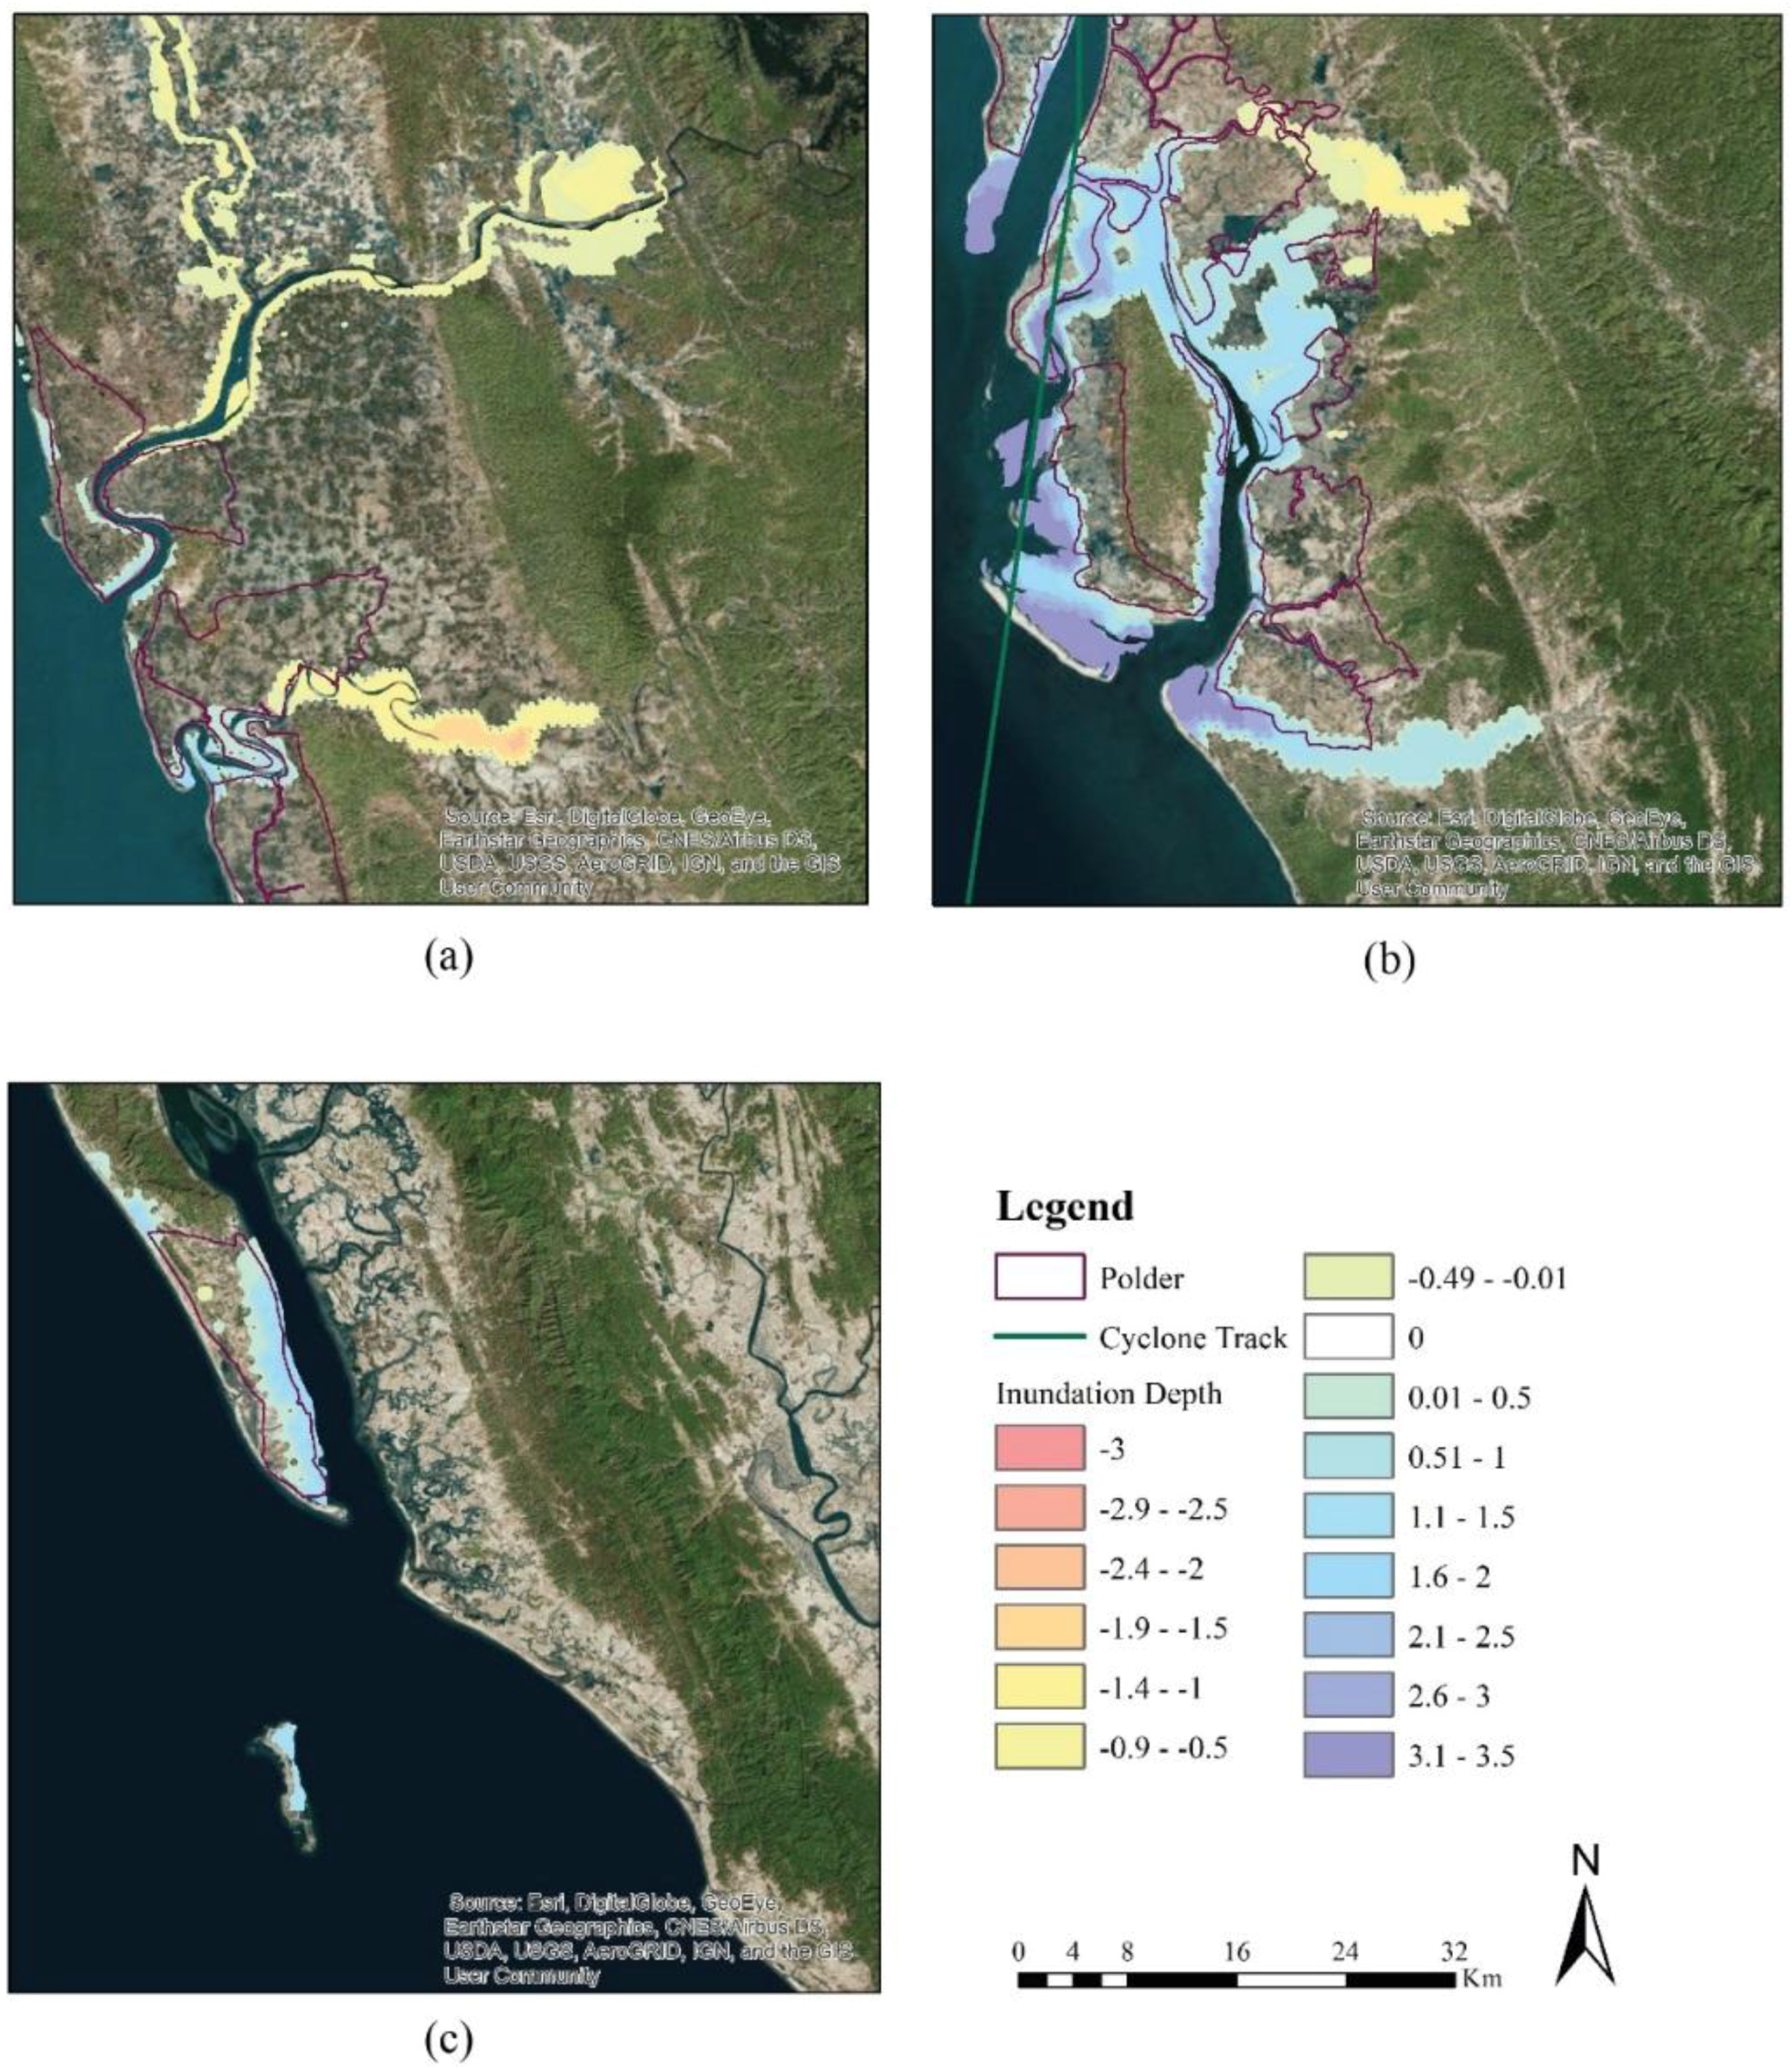
Figure 9 shows the changes in surge depth and inundation extent during high tide compared to low tide. For anti-clockwise rotational impact of cyclone in northern hemisphere and proximity to cyclone track, TC Mora landfall location (
Figure 9b) and Cox’s bazar (
Figure 9c) experience rise in surge depth during high tide. Chittagong which has a relatively higher land elevation compared to TC Mora landfall location and Cox’s bazar and, also located on the left side of Mora cyclone track, experiences slight decrease in surge depth (
Figure 9a). This again shows that impact of surge depth on tidal phase is not linear and largely depends on local topography and geographical position of the location with respect to the cyclone track.
According to NOAA, central pressure, cyclone wind speed, size, cyclone forward speed, angle of approach to coast, shape of the coastline, and width and slope of the ocean bottom are the main factors that contribute to the magnitude of surge a cyclone produces [
45]. Among them, the action of wind piling up the water comprises more than 85% of the surge height. With the increase of wind speed, more water piles up as the stress exerted by the wind on water underneath is proportional to the square of the wind speed. In
Figure 10, spatial distribution of wind speed due to TC Mora is shown. Mainly eastern coast experienced high wind speed. From simulation results, maximum wind speed is found to vary between 110–120 km/h in this region. Chakaria, Kutubdia, Moheshkhali, Pekua, Ramu, and Ukhia (
Figure 1) experienced the effect of maximum wind speed due to TC Mora. Maximum wind speed in the upazilas of Chittagong and Cox’s Bazar is listed in
Appendix A.
Tropical cyclones associated with storm surges produce force generated by the momentum of cyclone winds and water mass of moving surge waves. Thrust force was investigated for TC Mora and the synthetic cyclone. The thrust force is calculated from the Dynamic Force Model (DFM) [
35] which is described in the methodology section.
Figure 11a,b show the distribution of thrust force at the time of TC Mora and the synthetic cyclone respectively. As the tidal condition during cyclone landfall changes (low tide during TC Mora and high tide during the synthetic cyclone), area receiving maximum impact of thrust force also changes. During TC Mora, maximum thrust force is found to be 5.69 kN/m in Ukhia Upazila (
Figure 1) of Cox’s Bazar. During the synthetic cyclone, the location of maximum thrust force changes to Chakaria upazila of Chittagong district (see
Figure 1 for the location), which is more close to the cyclone landfall location. The magnitude of maximum thrust force in this location (Chakaria upazila) was 0.62 kN/m during the TC Mora which is now increased to 10.75 kN/m during the synthetic cyclone. This shows that location and magnitude of maximum thrust force change with the change in tidal phase.
Thrust force (Equation (5)) is a non-linear function of water surface slope
, direction and magnitude of water velcoity
u, and magnitude (
uw) and gradient of cyclone wind
. In general, magnitude of thrust force increases when water and wind velocities and gradient of cyclone wind is in the same direction (Equation (5)). At the same time, thrust force also depends on the slope of water surface and wind velocity gradients (increased or decreased).
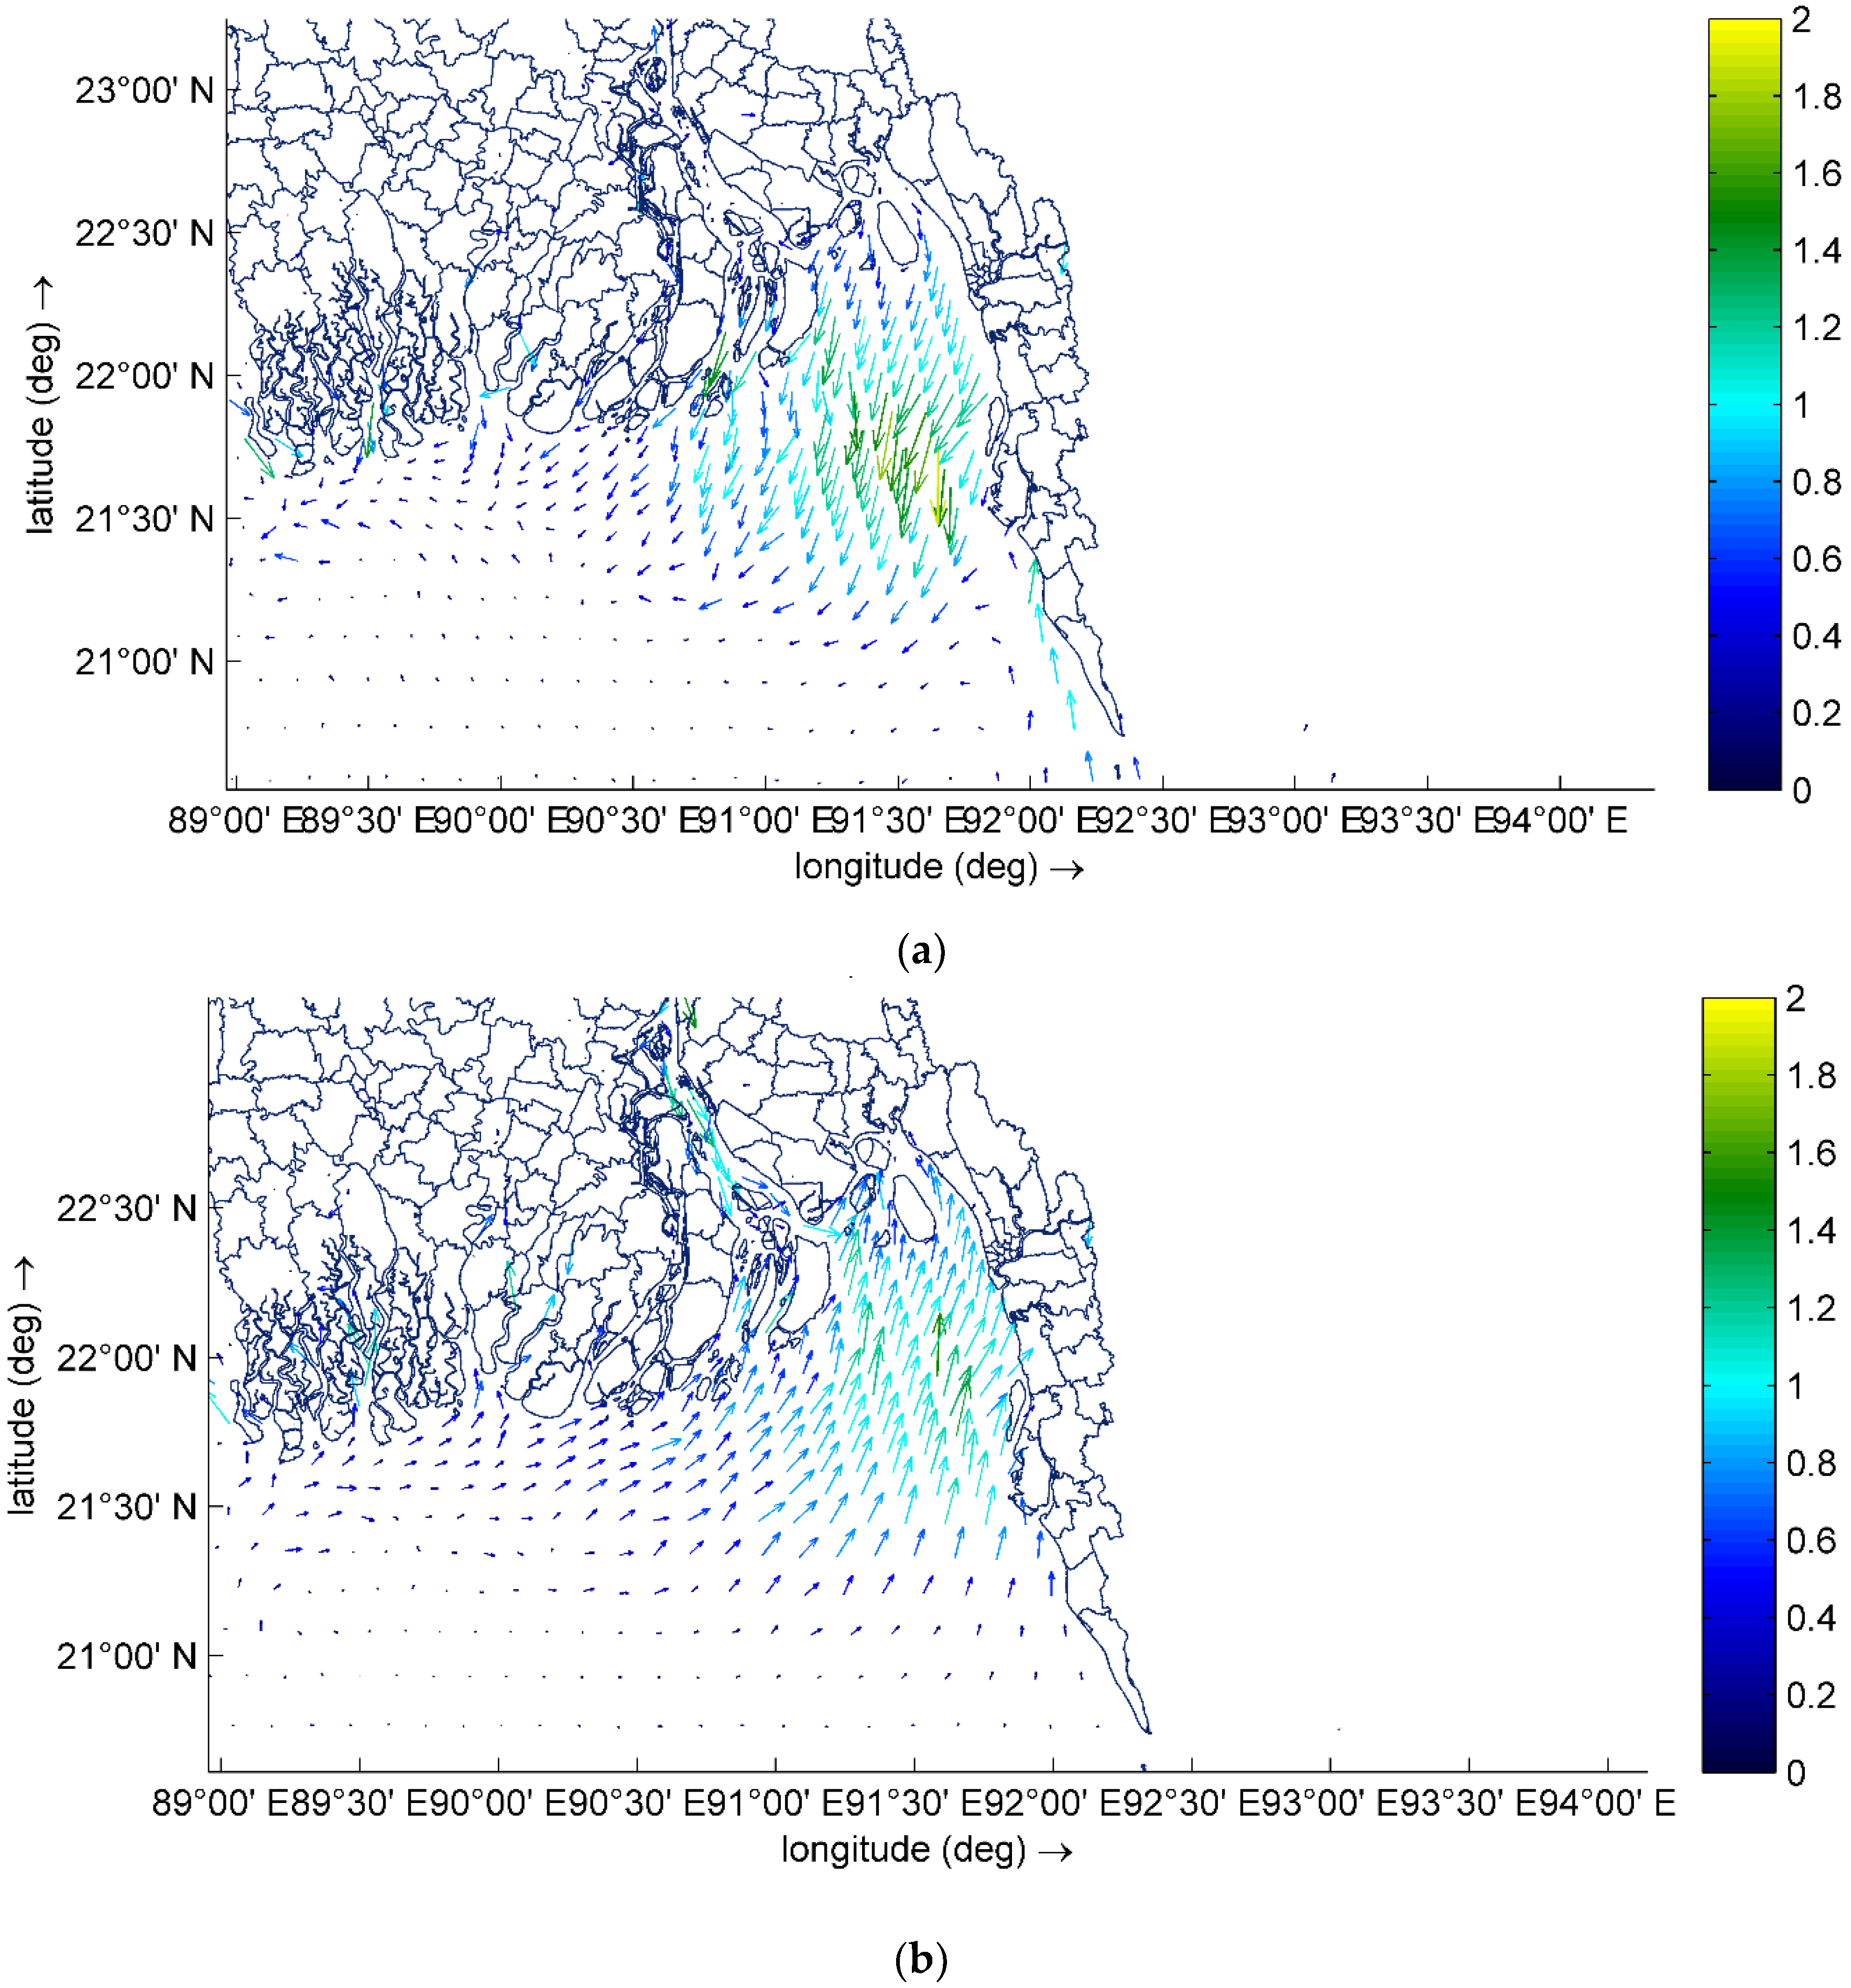
Figure 12 shows vectors of depth average velocity during the time of landfall for (a) TC Mora (1:30:00 UTC) and (b) synthetic cyclone (5:00:00 UTC). During low tide, velocity vectors are in the seaward direction (opposite to the cyclone wind direction) and during high tide, velocity vectors are directed to the landward (same direction of the cyclone wind). An exception is near the Ukhia upazila, where high tide is started when other locations in the cyclone impact zone are in low tidal phase (
Figure 12a). This causes thrust force in Ukhia higher than other parts of the region (
Figure 11a). During landfall of the synthetic cyclone, the entire region is in high tidal phase (
Figure 12b). Chakaria is closer to the cyclone track than Ukhia (both being on the right side of the cyclone track). Thus, wind velocity is higher in Chakaria compared to Ukhia. This, along with favorable water surface and cyclone wind gradients increases the thrust force in Chakaria. These conditions are opposite in Ukhia. Thus, thrust force reduces in Ukhia during synthetic cyclone landfall.

 ,
, 


