Using Argus Video Monitoring to Determine Limiting Factors of Aeolian Sand Transport on a Narrow Beach


Department of Physical geography, Faculty of Geosciences, Utrecht University, 3508TC Utrecht, The Netherlands
*
Author to whom correspondence should be addressed.
J. Mar. Sci. Eng. 2018, 6(4), 138; https://doi.org/10.3390/jmse6040138
Submission received: 21 September 2018
/
Revised: 2 November 2018
/
Accepted: 7 November 2018
/
Published: 13 November 2018
(This article belongs to the Special Issue Coastal Dune Dynamics and Management)
Abstract
:Aeolian sediment transport on beaches is responsible for dune growth and/or recovery. Models predicting potential aeolian sediment transport rates often overpredict the amount of deposition on the foredune when applied to narrow (<100 m) beaches, pointing to supply limitations. Our goal is to better understand these limitations, especially in the long-term (>years) in order to improve predicted transport volumes and the timing of transport. Here, we used 8 years of Argus video images at Egmond aan Zee, The Netherlands, in combination with routine weather data to delineate 241 limited from 467 unlimited sand transport events to explore supply-limiting factors. Our research shows that the wind is more oriented to the west (shore normal) and is generally stronger for limited transport events. This indicates that the available fetch distance is often less than the critical fetch needed for unlimited transport. This is further confirmed by the timing of the transport events, as limited events often became unlimited during low tide when the beach was the widest and fetch potentially the longest. Our results help understanding the nature of aeolian sediment transport on narrow beaches, which will hopefully lead to better predictions of annual aeolian sediment transport rates.
1. Introduction
The sand needed for coastal dune growth primarily comes from the intertidal and supratidal beach. Aeolian sand transport on beaches is, however, poorly understood. While aeolian models relating time-averaged transport to grain size [1] and wind shear velocity [2,3] do well for steady winds blowing over a horizontal surface with a uniform grain size [4,5,6,7], they often overestimate the amount of sand deposited on the foredune fronting beaches in more complicated settings [2,8,9].
Transport on a natural beach is affected by, for example, the moisture content of the sand, the beach slope and the bed roughness (e.g., [2,3,10,11,12,13,14,15,16,17]). These factors cause moments of strong aeolian activity to not always coincide with moments of high wind velocities, and the other way around; moments of high potential transport based on wind velocity do not necessarily lead to high actual transport [15,18]. Detailed field measurements concerning aeolian sediment transport on beaches have identified these influences [3,6,19,20,21,22,23,24,25], but tend to be short in duration, ranging from minutes to weeks. Therefore, the effect of limiting factors on long-term (months to years) transport and dune development is unknown [26] and not properly quantified. This would require long-term observations with high (hourly) temporal resolution to determine which wind events do induce high aeolian activity and which factors determine this.
Video monitoring with high temporal resolution can be used to observe the coast on long time scales. The method has successfully been used to research the nearshore on time periods of years [27,28,29], and has been used by [18,26,30] to study signs of aeolian sand transport on the beach. Aeolian sediment transport can be seen on video imagery as saltation streamers and sand strips. Streamers are elongated features of saltating grains with a strong spatial and temporal variability [7,31]. Sand strips are slipfaceless bedforms, and often appear when sand is blown over relatively moist beds [6,32,33,34,35], especially when roughness elements like vegetation [5,36] and frozen material [37] are present as well. Reference [26]’s temporary camera system at Greenwich Dunes, Canada, could pick up these traces of aeolian transport, as wind-blown sand usually is dryer and therefore lighter in colour than the moist bed, providing visual contrast. When undisturbed, sand strips can grow into ephemeral dunes, which have a slipface and a height in the range of decimetres to a metre [30,38,39]. Like the traces of aeolian transport in the work of [26], these features were visible on camera because of a difference in moisture content, and therefore colour, between the transported sand of the bedforms and the bed [40].
Reference [26]’s study further showed that video monitoring can be used to provide information about vegetation cover, the position of the shoreline, fetch distances, and surface moisture content. After monitoring the beach at Greenwich Dunes for 9 months, they found that the angle of the approaching wind, which affects the maximum fetch distance, might be more important than a strong wind. Very strong winds, onshore as well as oblique, even led to wave scarping and a loss of sediment. Other limitations that stopped or hindered aeolian transport were the duration of the event and, in winter, snow and ice cover.
The aim of this paper is to find how limiting factors affect transport on long time scales at the narrow beach of Egmond aan Zee, The Netherlands, with the use of long-term (>years) video monitoring data, together with concurrent meteorological data station operated by the Royal Dutch Meteorological Institute (KNMI). The methodology will be introduced in Section 2, including a description of the field site, the used video monitoring system and the weather station. Section 2 describes our methods, which is followed by our results, discussion, and conclusions in Section 3, Section 4 and Section 5, respectively.
2. Materials and Methods
2.1. Study Area
The study site lies between the towns of Egmond aan Zee and Castricum, The Netherlands (Figure 1). The coastline is straight, with an orientation of 7 east of north, and has a beach with moderate slope (1:30) containing sand with a median grain size of 240 m. The beach width depends on the tide and varies between 30 and 100 m. Usually, one or two slipface bars are present on the intertidal beach [41,42,43]. The established foredune has a height of 20 to 25 m and forms a uniform row parallel to the beach. Occasional erosion events have made its seaward front steep (40–50) [44]. European marram grass (Ammophila arenaria) grows on most parts of the foredune, especially at heights exceeding 10 m above beach level. Occassionally, embryo dunes develop at the transition between beach and foredune (e.g., [44]), typically at 3 to 5 m above mean sea level.
The site experiences a semidiurnal tide, which ranges from 1.4 m (neap tide) to 1.8 m (spring tide). The significant offshore (in 20 m depth) wave period and height for the Dutch coast are 5 s and 1.2 m, respectively, and do not show strong alongshore differences. The beach is exposed to waves from the southwest to the north [45]. The south-southwest (210–230 with respect to north, Figure 2) is the dominant wind direction at this beach. The offshore wave height can increase to over 5 m during storms. Especially storms from the northwest are associated with surges in excess of 1 m. As a result, the intertidal beach can be flooded for several days [46], which can destroy the intertidal bars and embryo dunes. On average, the foredune along this part of the coast gains 10 to 15 m/m/year, see [44,47]. The potential volume of sand transported towards the dunes based on hourly mean wind velocity from the weather station described below, as calculated with the equation based on [48], is substantially higher at 29 m/m/year.
2.2. Used Data
The study area lies in the field of view of an Argus video system [49], which is an optical remote sensing system pioneered by Holman and Sallenger [50] for sampling the nearshore environment. An Argus system consists of a suite of cameras at the top of a high structure in order to gain an unhindered view of the beach. A timing module is installed to ensure a synchronised collection of the images [51]. The Argus system at Egmond aan Zee consists of five RGB-colour cameras, which were mounted on a 45-m high tower on the supratidal beach. The Argus system was installed in April 1998 and removed in June 2017, although data collection already ceased in October 2015. The cameras provided a 180 view, from south-southwest to north-northeast with a resolution of 640 × 480 pixels from 1998 to February 2004, 1024 × 768 pixels from 2004 to August 2005 and 1392 × 1040 pixels since then. Three different oblique images were produced by each camera every 30 min: a snapshot, a time-exposure (timex) and a variance image. Only the first two types of images are used in this research. The timex images were created by averaging the snapshots that were taken with a frequency of 2 Hz over a 10-min period. This procedure blurs out all movement that occurred in that 10-min time frame, which includes individual waves breaking on the subtidal bars, people walking on the beach, and aeolian streamers. In the timex images aeolian activity is thus seen through sand strips (e.g., [18]). In order to make our research comparable to our previous study [18], we focus on the imagery available from January 2005 to December 2012.
The footprint dimensions of individual pixels give the theoretical accuracy of the images. This footprint is the projection of a square image pixel on the ground, which is close to rectangular with a larger alongshore than cross-shore side. The cross-shore footprint dimension is less than 0.2 m for the post-2005 system at this site, while the alongshore size increases from 0.2 m at 100 m from the tower alongshore to ≈1.5 m at 400 m.
This study used various meteorological characteristics collected by a weather station in the Kooy, roughly 40 km north of the field site (Figure 1). The weather data we made available by the Royal Netherlands Meteorological Institute (KNMI) and include the wind direction , hourly mean wind velocity U, ten-minute mean wind velocity, maximum wind gust per hour, temperature at the time of observation, minimum temperature in the preceding 6-h period, dew point temperature at the time of observation, sunshine duration, precipitation duration, hourly precipitation amount, air pressure, atmospheric humidity, cloud cover, and the presence of fog, snow, ice, and thunder. The time resolution for all meteorological variables is 1 h. The anemometer and wind vane are located at a height of 10 m above ground level.
2.3. Classification of Limited and Unlimited Events
Both the snapshot and timex images from the Argus monitoring system were used to find traces of aeolian sediment transport. A first selection of images was made based on U, as sand transport can only take place when the wind exceeds a certain threshold. In a previous study, we showed that this threshold was 8 m/s [18]. Furthermore, the threshold had to be surpassed for at least three hours to ignore short events that contribute little to the total potential transport, but which would otherwise strongly increase analysis time [52]. Part of this >3 h time period has to fall within daylight hours, which ranged from 8:00 to 16:00 (GMT) for January and December, 7:00 to 16:00 for February and November, 6:00 to 17:00 for March and October, 5:00 to 18:00 for April and September, 4:00 to 19:00 for May and August, and 6:00 to 17:00 for June and July. This resulted in 709 wind events between January 2005 and December 2012. Of those events, the hour with the highest hourly mean wind velocity during daylight hours was selected.
The Argus image corresponding to the hour with the highest hourly mean wind velocity of the event was visually inspected for traces of aeolian transport, for which both the snapshot and timex images were used. Active streamers cannot always be distinguished from remnant streamers or small patches of immobile sand on snapshot images, as they all appear as elongated streaks of dry sand. Since active streamers move quickly, they get blurred out in the timex images while the inactive ones remain visible, making it possible to distinguish the active ones when both image types are compared (Figure 3). Sand strips appear the same in snapshot and timex images because they move with only a few metres per hour, which is too slow for the timex images to pick up and blur out their movement. Images taken at subsequent hours were therefore checked to spot sand strip movement.
As no quantitative data concerning transport rates are available or can be assessed from the imagery, it is assumed that the presence and state of streamers and sand strips visible on the Argus images indicate how well developed aeolian sediment transport is. A transport event is considered to be unlimited when the beach is covered with sand strips, which are strong visual signs of transport. Likewise, an event that shows no signs of aeolian transport is considered limited, as the wind velocity was above the threshold for transport and should result in visible signs of transported sand. That, however, leaves situations where only small signs of aeolian sediment transport, like moving patches of sand or underdeveloped sand strips, are visible. Whether these situations are limited is presumably related to the duration of the wind event. Reference [53] found in their wind tunnel experiment that the time needed for aeolian ripples to form is inversely related to the wind velocity. Similar results were found in other environments, such as for current ripples in a flume [54,55]. Therefore, it is more likely to see better-developed bedforms after a wind event of a certain length when winds are strong. Reference [56] found that wind ripples disappear with high wind velocities, and that transport may turn to sheetflow. However, such a wipeout of sand strips has not been observed in a previous study using the present Argus images [18], even for 20 m/s.
The focus of this paper is on instantaneous limiting factors. To do so, the events were sorted into four different classes based on their maximum hourly mean wind velocity (Table 1) and five different classes according to their visual signs of transport (Figure 4). Class 0 of the visual classification shows no signs of transport (Figure 4A). Class 1 shows very small signs of transport (Figure 4B), like single moving patches of sand or a handful of streamers. Class 2 shows more of these sand patches, but they have not formed rows of sand strips (Figure 4C). This happens in class 3, but the beach area that the sand strips cover is patchy (Figure 4D). Class 4 is for images where most of the beach is covered by active sand strips, often in combination with high streamer activity (Figure 4E). Reference [18] have shown that the wavelength of the sand strips in this class is ≈12 m and their migration velocity is around a metre per hour. Neither sand strip length nor migration speed depends convincingly on wind speed.
All events that show strong signs of transport, i.e., fully developed, active sand strips (class 4 in Figure 4) are unlimited, no matter their wind velocity class. Likewise, events that show no visual signs of transport were considered limited. That leaves events with little to medium signs of aeolian transport (class 1 to 3 in Figure 4), of which it is harder to determine whether their bedform development is hindered by factors that limit aeolian transport or is still in the process of developing. For these events, the combination of classes based on wind velocity and visual transport determined whether or not a certain class combination was considered to be limited or unlimited, as the lag in bedform development will be more prominent for events with low wind velocities. The events with little to medium signs of aeolian transport were seen as unlimited when the class based on their wind velocity was lower than their class based on visual transport. It differs per transport class how much lower the wind velocity class has to be. For transport class 1, for example, both wind class 3 and 4 are considered limited. This is the same for transport class 2, even though it ranks higher. This difference is based on how often a higher transport class was encountered when studying other Argus images of the same day of a certain event. If more than 75% of the events of a certain wind and transport class combination contained a moment with stronger visual signs of aeolian transport a couple of hours before the hour with the maximum mean wind velocity, the class combination was considered limited, and not merely lagging behind with bedform development. This resulted in 241 limited and 467 unlimited transport events (Table 2). All meteorological characteristics measured by the weather station in de Kooy were studied for differences between the limited and unlimited events.
When studying the Argus images, it was noticed that 129 of the 241 limited events showed unlimited transport later or earlier on the same day. The conditions during limited part of the day were compared to the unlimited part. This was done for the weather characteristics mentioned above, but also for the relative beach width as a proxy for the relevance of fetch effects. The cross-shore distance between the tower and the waterline was determined with the Intertidal Beach Mapper (IBM), an application that uses Argus timex images to determine the intertidal bathymetry of a beach with the help of the shoreline. For this research, only the location of the shoreline was needed. IBM determines this location relative to the position of the Argus tower. A Region Of Interest (ROI) was defined in which the shoreline could be found, then the IBM identified the location of the shoreline by automated clustering of land and water pixels in Hue-Saturation-Value (HSV) colour space. The land and water pixels form two peaks in a histogram plot and are separated by a discriminator function. The pixels that correspond with the line of the function are exactly between water and land, i.e., the shoreline. A more detailed description of the IBM application can be found in [57]. IBM was applied to the shoreline 90 to 470 m south of the Argus tower, though the exact alongshore location of the waterline varied for each image, as the location with the optimal contrast between sand and water was chosen to determine the waterline. The results for each Argus image were averaged alongshore.
3. Results
An overview of the studied variables and significance between limited and unlimited transport events can be found in Table 3. More specifically, this table shows the result from two-sample Kolmogorov-Smirnov tests. The null hypothesis states that the data for limited and unlimited events are from the same continuous distribution, while the alternative hypothesis is that limited and unlimited events are from different continuous distributions. For many variables, the frequency distribution between limited and unlimited events did not differ as marked with 0 for (almost) all . Only the wind velocity and direction, monthly frequency, and temperature showed significantly different results at = 0.05. We focus on these variables in the remainder of this section.
The wind rose for the unlimited transport events (Figure 5A) features a narrow peak for winds coming from the southwest. Other wind directions are far less prominent. It must be noted that Argus observations of unlimited events then show aeolian transport in the alongshore direction, which was also observed in [18]. Westerly (onshore) winds were more prominent in the wind rose for limited transport events (Figure 5B). There no longer is a distinct peak, as the results cover all wind directions between the southwest and the west-northwest. It also has relatively more events with high wind velocities. The video imagery further showed that strong winds from the west to northwest could cause a surge high enough to flood parts of or even the entire beach. This was common for events with high wind classes (class 3 and 4), but with little to no visible traces of aeolian transport (class 0 or 1).
The wind roses also show that both limited and unlimited events happen under a wide range of wind velocities, though high wind velocities (>11 m/s) are more common for limited events. This is better illustrated in Figure 6. The wind velocity shows a peak at 8 m/s for both limited and unlimited events, which makes up 28% of all events. There is a second, smaller peak at 12 m/s for the limited events, and high wind velocities are relatively more common. The mean wind velocity for unlimited transport events is 10.3 m/s (standard deviation of 1.9 m/s) and 11.1 m/s (standard deviation of 2.3 m/s) for limited transport events.
All events with high visual transport classes resulted, as aforementioned, from shore-oblique winds. Precipitation sometimes interrupted transport during these events, which was visible as a darkening of the beach and rain drops on the camera lens. Sand strips often disappeared during precipitation, but streamers sometimes remained visible when relatively strong winds (>10 m/s, depending on the amount of rain drops visible on the camera lens) were present. Strong winds could also cause streamers and sand strips to reappear quickly (i.e., an hour later) when the precipitation stopped. Limited and unlimited events did not differ in the presence, duration, and amount of precipitation.
The frequency distribution of temperature differs between limited and unlimited events (Figure 7). The mean temperature for unlimited and limited events was 12.4 C (with a standard deviation of 5.1 C) and 10.5 C (with a standard deviation of 5.9 C), respectively. The difference in mean temperature and temperature distributions were not caused by a daily pattern, as unlimited events did not occur more often around the warmest part of the day than limited events did. Instead, there is a seasonal trend, with the amount of limited transport events being relatively low from May to September (Northern Hemisphere summer) compared to other times of the year (Figure 8). Furthermore, unlimited events in May, June and July, have relatively few class 4 events, unlike October, November, December, and January. Small unlimited events therefore seem to be common during summer conditions, while the winter features large unlimited events, but also numerous limited events.
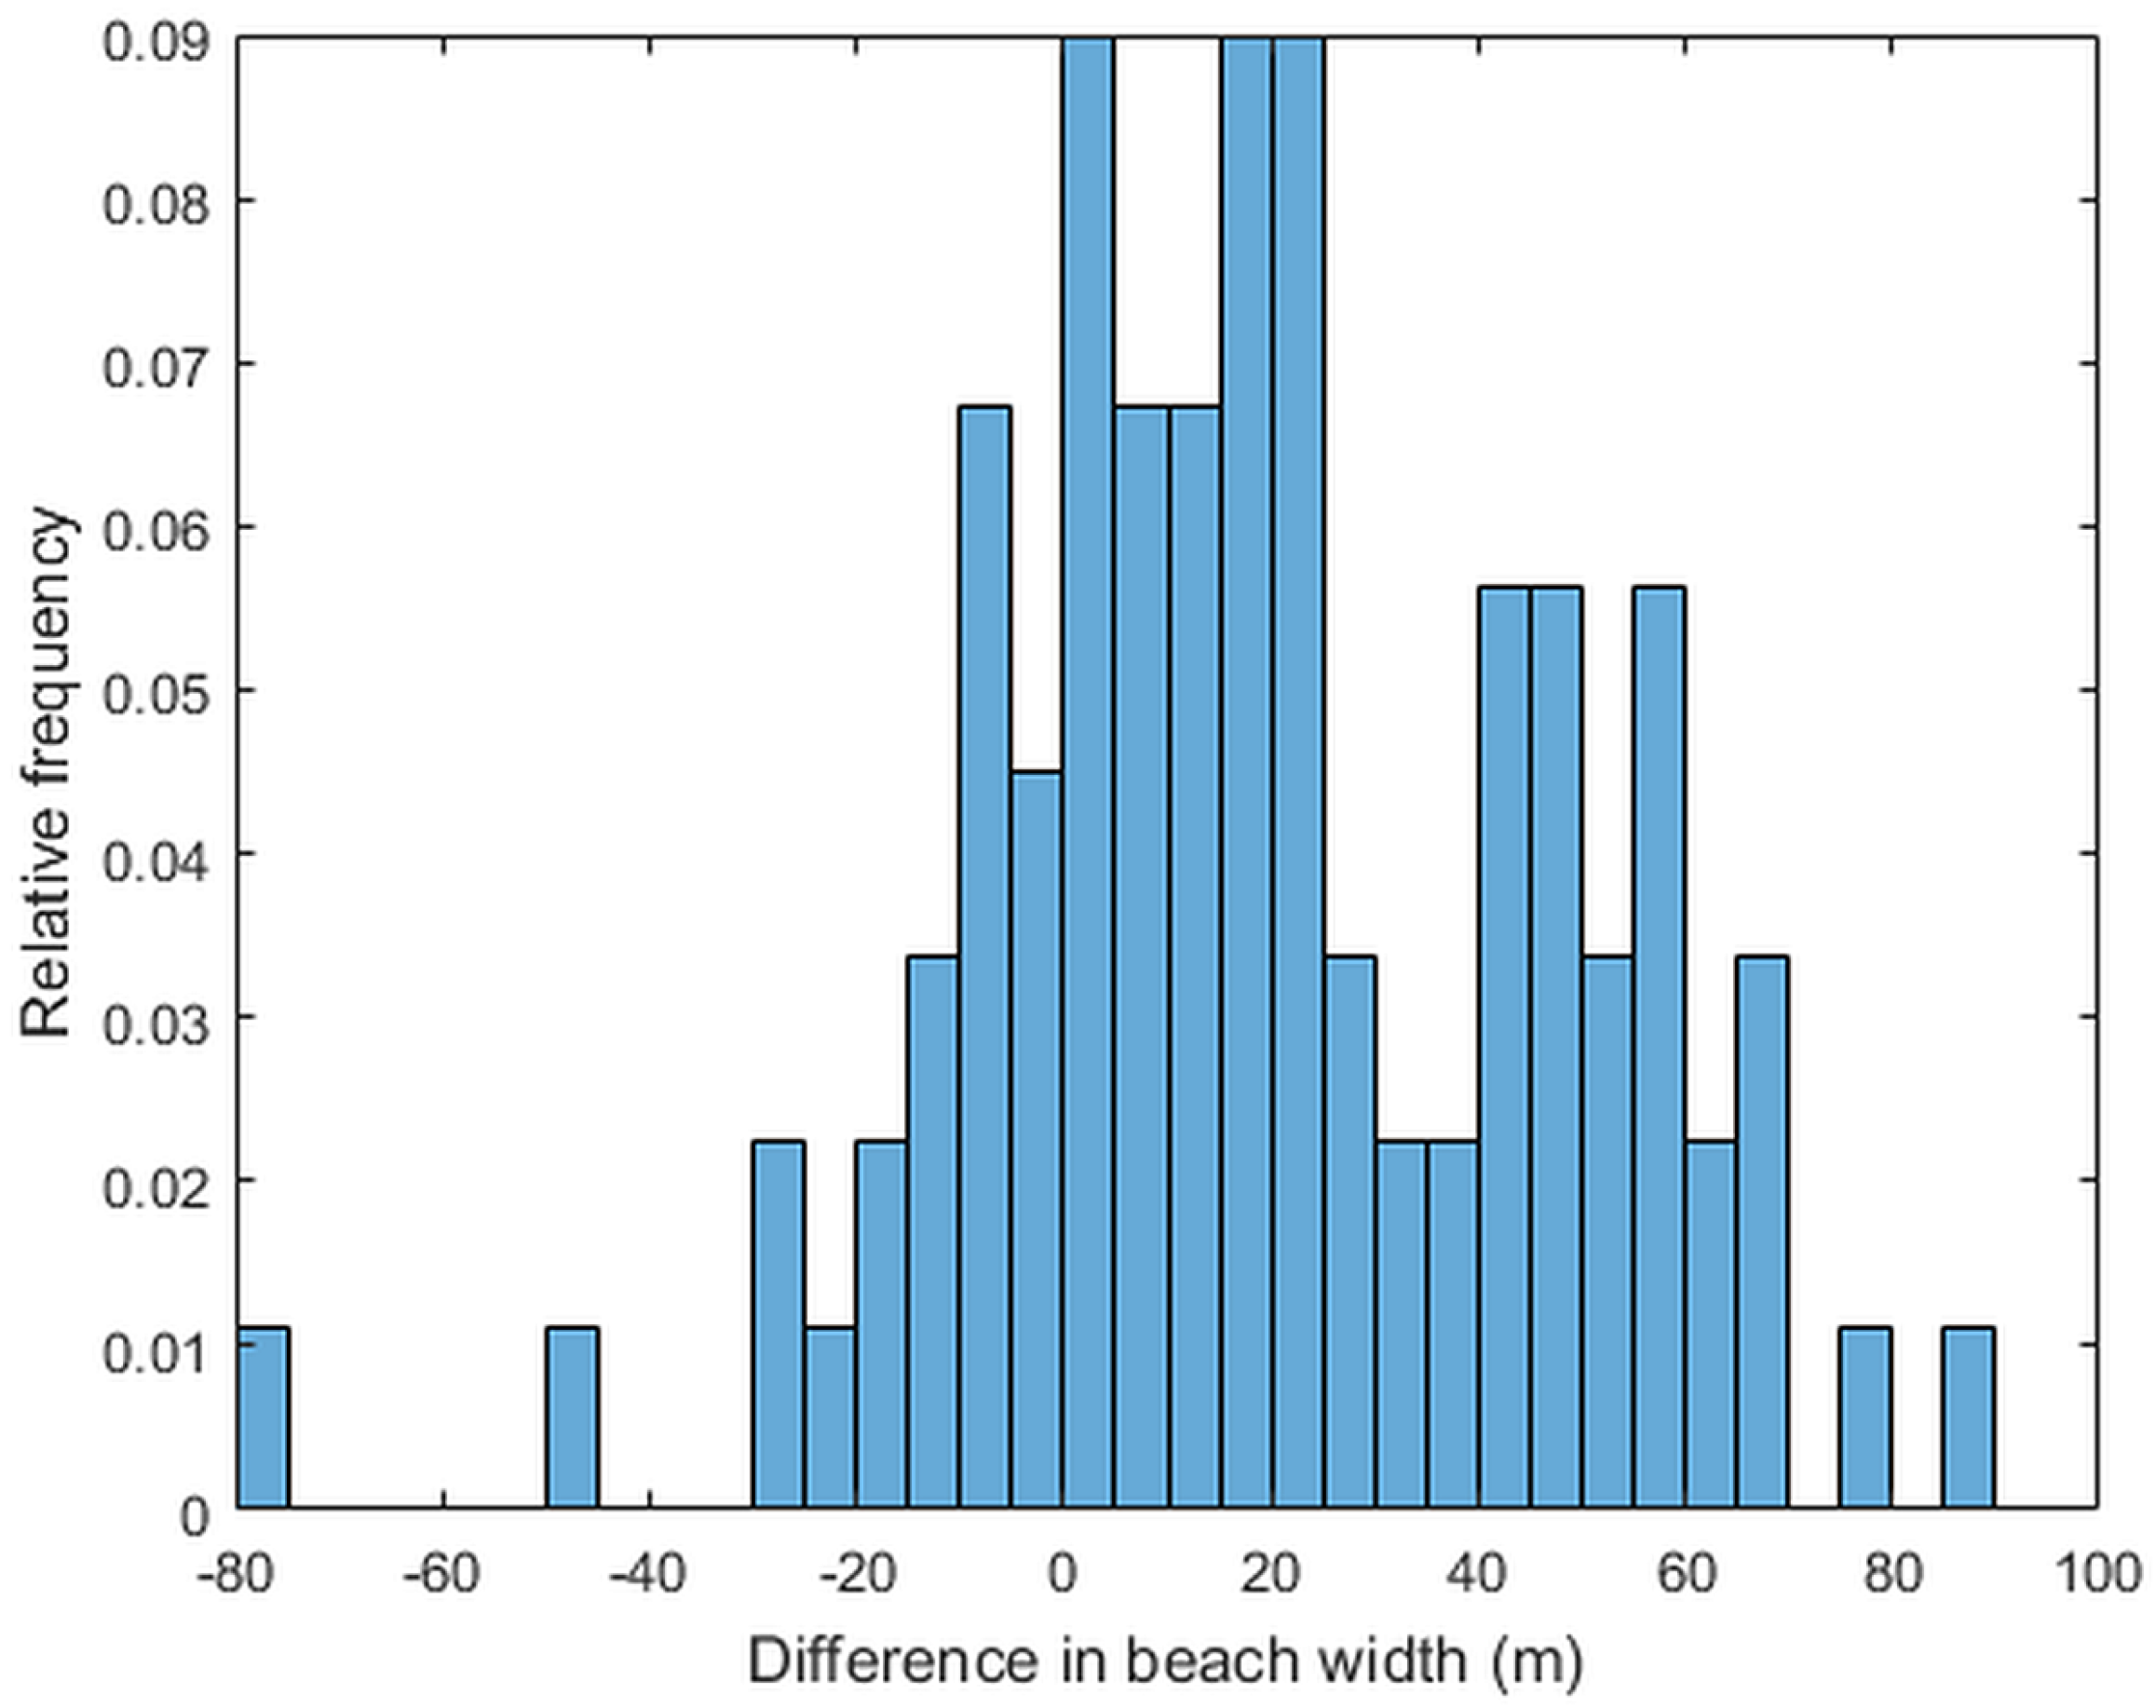
Some limited events show unlimited transport at an earlier/later moment of the day. There are no significant differences in weather between the hour with limited transport and the one with unlimited transport. However, the moment with unlimited transport has a much wider beach. Figure 9 shows the difference in beach width between the hour with limited transport and the hour earlier/later with unlimited transport. A positive value implies a broader beach during the moment with unlimited transport. Figure 9 shows the difference in beach width has a tendency to be positive, with a peak around 20 and 50 m and an average value of 19.6 m. In other words, the beach is usually broader during the moment of unlimited transport than at the hour with the highest hourly mean wind velocity of the transport event.
4. Discussion
The multi-year data set of the Egmond Argus video monitoring station gives visual signatures of aeolian transport events, which were employed here to investigate which factors affect aeolian sediment transport on long time scales (>years). The limited and unlimited events differed in dominant wind direction and velocity, temperature, and beach width, as well as in the frequency distribution of velocity, and temperature. Shore-perpendicular wind directions, higher wind speeds and lower temperatures all increase the likelihood of a limited transport event. The limited transport events occurred under a higher mean wind velocity (with a secondary peak around 12 m/s) and were relatively more common for even larger wind velocities than unlimited events (Figure 6). High wind velocities increase aeolian transport volumes according to models like [48], but high wind velocities cause a longer critical fetch distance as well, which can limit transport on a narrow beach. The critical fetch (that is, the fetch at which aeolian transport has saturated at its potential value) cannot be determined with the Argus images, but an equation based on field results by [58] exists, and even though its general application is not proven, it can give an indication of typical critical fetch distances for dry, sandy surfaces with a mean grain size of 200–300 m (see also [59]):
For our study site, where typical wind velocities for transport events are 8 to 15 m/s, the critical fetch distance will be 27 to 57 m under optimal circumstances; moist sand can increase the critical fetch distance with >50% or more. This would make the maximum fetch distance highly important for the study site, as the beach width is ≈100 m at most at low tide, but is more often substantially less wide. The maximum fetch will be less, as most parts of the beach remain too wet for sands to be picked up by the wind [60,61]. The importance of the maximum fetch distance disagrees with the findings of [62]. They found a decay in aeolian sediment transport after having reached the critical fetch distance, which strongly affected an accurate prediction of aeolian sediment transport rates. The critical fetch distance was short (just a few metres), making it relatively unimportant for fine sandy beaches [62]. The sand at Egmond aan Zee, however, is medium fine. The Egmond beach is therefore more likely to have a critical fetch distance of a few tens of metres, as was found in various experiments with medium grain sizes [63].
Winds from the southwest, which might rotate to a more alongshore direction due to topographic steering by the high and steep foredune [6,18,64], lead to an increase in maximum fetch distances. A method for calculating the maximum fetch distance has been described by [65]. During onshore westerly winds, the maximum fetch might be smaller than the critical fetch, so no full transport is reached. This is qualitatively consistent with findings in [66], who, for similar wind velocities, observed smaller aeolian transports under onshore rather than alongshore winds. Strong, stormy winds from the northwest can cause a storm surge which (partially) floods the beach, causing the beach to become very narrow. No significant difference could be found for the wind velocity and direction for different quarters of the year (divided as: December, January, February; March, April, May; June, July, August; and September, October, November), with the exception of the wind velocity in December, January, and February versus June, July, and August. A circular Kuiper test was used here to test if the wind directions were significantly different for the quarters of the year, while a Kolmogorov-Smirnov test was used to do the same for the quarters’ wind velocities ( = 0.05 for both tests). The wind velocity was higher during the Northern Hemisphere winter months than summer months (e.g., 11.1 m/s in January and 10.3 m/s in July). Lower wind velocities give shorter critical fetch distances, which favours unlimited transport.
High evaporation keeps the moisture content of the sand low, which favours transport [13,20]. Winter months generally have lower evaporation rates. This, together with the seasonal difference in velocity, might explain the relatively more numerous unlimited events in July. The role of evaporation on surface moisture dynamics is, however, unclear [67] and is mostly assumed small (e.g., [61]. A closer inspection reveals that the beach in July is narrower than in January for unlimited events (22.2 m and 27.9 m seawards of the Argus tower, respectively), which agrees with the results of [43], but contradicts the relatively more numerous unlimited events in July. The shorter critical fetch and/or higher evaporation therefore seem to exceed the effect of a narrower beach.
The maximum fetch distance, at least during rising tide, seems more important for aeolian transport than moisture content. During falling tide, sand from the intertidal beach becomes available for aeolian transport as the sand dries here below the moisture threshold that inhibits aeolian transport [60]. References [47,68] also pointed to the role of beach width in limiting aeolian supply to the dry upper beach. During rising tide the beach continues to dry until it inundates [60], but this does not seem to outweigh the effect of reducing beach width on aeolian transport.
It is possible that our results would have been slightly different when another nearby weather station had been used, as the local weather characteristics can differ from the regional characteristics [18]. The weather station at de Kooy is an inland station, which results in weaker onshore winds compared to a coastal station. Our research, however, mainly focused on patterns and relative differences between limited and unlimited events, so our main findings are not likely to be considerably different. Only weather characteristics that vary strongly within a distance of 40 km might have a different outcome, which can be the case for precipitation when the weather is characterised by local showers.
Most existing models to predict annual sand supply to the foredune rely on hourly mean wind characteristics alone, while this study shows that beach width should be incorporated as well. Following the work of [59], our next research step will be to extend the fetch model of [3] into a quantitatively predictive model. Our future plans therefore not only involve a test whether the model can reduce the 29 m/m/year wind-alone transport to fall within range of measured transport amounts (10–15 m/m/year), but also a check whether the timing of the predicted transport moments agrees with the visual signs of transport on Argus imagery. In other words, whether unlimited and limited events examined here are also predicted to be unlimited and limited.
5. Conclusions
This research focussed on the limitations of aeolian sediment transport on a narrow beach by studying the weather characteristics of limited and unlimited aeolian transport events. The limited and unlimited events were found after comparing wind velocities measured by a KNMI weather station with traces of aeolian transport on corresponding Argus images. Wind speed, direction and temperature were the most prominent weather characteristics that could explain the discrimination between limited (241) and unlimited (467) events. The wind had more often a cross-shore (westerly) direction and was generally stronger for limited transport events, while oblique winds (south westerly direction) were more common for unlimited transport events. Some limited events that took place during high tide showed unlimited transport during low tide. Furthermore, it was observed that strong westerly winds often caused a high surge, which flooded large parts of the beach. These results indicate that the maximum fetch distance strongly influences aeolian transport on a narrow beach. Finally, the unlimited events were relatively more common in the warmer summer months. It is unclear whether this points to evaporation as an important meteorological factor that determines annual onshore sand supply to the foredune.
Supplementary Materials
The following are available online at https://www.mdpi.com/2077-1312/6/4/138/s1.
Author Contributions
Conceptualization, P.H. and G.R.; methodology, P.H.; software, P.H.; validation, P.H., G.R. and J.D.; formal analysis, P.H.; investigation, P.H.; resources, G.R.; data curation, P.H.; writing—original draft preparation, P.H.; writing—review and editing, G.R. and J.D.; visualization, P.H.; supervision, G.R. and J.D.; project administration, G.R.; funding acquisition, G.R.
Funding
This study was funded by the Dutch Technology Foundation STW (Vici project 13709 to BGR), which is part of The Netherlands Organisation for Scientific Research (NWO), and which is partly funded by the Ministry of Economic Affairs.
Acknowledgments
We wish to thank Bas van Dam, the late Irv Elshoff, John Stanley and Rob Holman for Argus support.
Conflicts of Interest
The authors declare no conflict of interest. The founding sponsors had no role in the design of the study; in the collection, analyses, or interpretation of data; in the writing of the manuscript, or in the decision to publish the results.
References
- Sherman, D.J.; Houser, C.; Baas, A.C.W. Electronic Measurement Techniques for Field Experiments in Process Geomorphology; Elsevier Ltd.: Amsterdam, The Netherlands, 2013; Volume 14, pp. 195–221. [Google Scholar]
- Davidson-Arnott, R.G.D.; Law, M.N. Measurement and prediction of long-term sediment supply to coastal foredunes. J. Coast. Res. 1996, 12, 654–663. [Google Scholar]
- Bauer, B.O.; Davidson-Arnott, R.G.D. A general framework for modeling sediment supply to coastal dunes including wind angle, beach geometry, and fetch effects. Geomorphology 2003, 49, 89–108. [Google Scholar] [CrossRef]
- Gares, P.A. Factors affecting eolian sediment transport in beach and dune environments. J. Coast. Res. 1988, 121–126. Available online: https://www.jstor.org/stable/40928738?seq=1#page_scan_tab_contents (accessed on 13 November 2018).
- Sherman, D.J.; Hotta, S. Aeolian sediment transport: Theory and measurement. Coast. Dunes Form Process 1990, 17, 37. [Google Scholar]
- Bauer, B.O.; Davidson-Arnott, R.G.D.; Hesp, P.A.; Namikas, S.L.; Ollerhead, J.; Walker, I.J. Aeolian sediment transport on a beach: Surface moisture, wind fetch, and mean transport. Geomorphology 2009, 105, 106–116. [Google Scholar] [CrossRef]
- Sherman, D.J.; Li, B. Predicting aeolian sand transport rates: A reevaluation of models. Aeolian Res. 2012, 3, 371–378. [Google Scholar] [CrossRef]
- Miot da Silva, G.; Hesp, P.A. Coastline orientation, aeolian sediment transport and foredune and dunefield dynamics of Moçambique Beach, Southern Brazil. Geomorphology 2010, 120, 258–278. [Google Scholar] [CrossRef]
- Keijsers, J.G.S.; Poortinga, A.; Riksen, M.J.P.M.; Maroulis, J. Spatio-temporal variability in accretion and erosion of coastal foredunes in The Netherlands: Regional climate and local topography. PLoS ONE 2014, 9, e91115. [Google Scholar] [CrossRef] [PubMed]
- Svasek, J.N.; Terwindt, J.H.J. Measurements of sand transport by wind on a natural beach. Sedimentology 1974, 21, 311–322. [Google Scholar] [CrossRef]
- Jackson, N.L.; Nordstrom, K.F. Aeolian transport of sediment on a beach during and after rainfall, Wildwood, NJ, USA. Geomorphology 1998, 22, 151–157. [Google Scholar] [CrossRef]
- Sherman, D.J.; Jackson, D.W.; Namikas, S.L.; Wang, J. Wind-blown sand on beaches: An evaluation of models. Geomorphology 1998, 22, 113–133. [Google Scholar] [CrossRef]
- Wiggs, G.F.S.; Atherton, R.J.; Baird, A.J. Thresholds of aeolian sand transport: Establishing suitable values. Sedimentology 2004, 51, 95–108. [Google Scholar] [CrossRef]
- Edwards, B.L.; Namikas, S.L. Small-scale variability in surface moisture on a fine-grained beach: Implications for modeling aeolian transport. Earth Surf. Process. Landf. 2009, 34, 1333–1338. [Google Scholar] [CrossRef]
- Delgado-Fernandez, I.; Davidson-Arnott, R.G.D. Meso-scale aeolian sediment input to coastal dunes: The nature of aeolian transport events. Geomorphology 2011, 126, 217–232. [Google Scholar] [CrossRef] [Green Version]
- Nield, J.M.; King, J.; Wiggs, G.F.S.; Leyland, J.; Bryant, R.G.; Chiverrell, R.C.; Darby, S.E.; Eckardt, F.D.; Thomas, D.S.G.; Vircavs, L.H.; et al. Estimating aerodynamic roughness over complex surface terrain. J. Geophys. Res. Atmos. 2013, 118, 12948–12961. [Google Scholar] [CrossRef]
- Nield, J.M.; King, J.; Jacobs, B. Detecting surface moisture in aeolian environments using terrestrial laser scanning. Aeolian Res. 2014, 12, 9–17. [Google Scholar] [CrossRef]
- Hage, P.M.; Ruessink, B.G.; Donker, J.J.A. Determining sand strip characteristics using Argus video monitoring. Aeolian Res. 2018, 33, 1–11. [Google Scholar] [CrossRef]
- Jackson, N.L.; Nordstrom, K.F. Effects of Time-dependent Moisture Content of Surface Sediments on Aeolian Transport Rates Across a Beach, Wildwood, New Jersey, USA. Earth Surf. Process. Landf. 1997, 22, 611–621. [Google Scholar] [CrossRef]
- Davidson-Arnott, R.G.D.; MacQuarrie, K.; Aagaard, T. The effect of wind gusts, moisture content and fetch length on sand transport on a beach. Geomorphology 2005, 68, 115–129. [Google Scholar] [CrossRef]
- Baas, A.C.W.; Sherman, D.J. Spatiotemporal variability of aeolian sand transport in a coastal dune environment. J. Coast. Res. 2006, 22, 1198–1205. [Google Scholar] [CrossRef]
- Udo, K.; Kuriyama, Y.; Jackson, D.W.T. Observations of wind-blown sand under various meteorological conditions at a beach. J. Geophys. Res. Earth Surf. 2008, 113. [Google Scholar] [CrossRef] [Green Version]
- Davidson-Arnott, R.G.D.; Bauer, B.O. Aeolian sediment transport on a beach: Thresholds, intermittency, and high frequency variability. Geomorphology 2009, 105, 117–126. [Google Scholar] [CrossRef]
- Sherman, D.J.; Li, B.; Farrell, E.J.; Ellis, J.T.; Cox, W.D.; Maia, L.P.; Sousa, P.H.G.O. Measuring Aeolian Saltation: A Comparison of Sensors. J. Coast. Res. 2011, 59, 280–290. [Google Scholar] [CrossRef]
- Sherman, D.J.; Houser, C.; Ellis, J.T.; Farrell, E.J.; Li, B.; Davidson-Arnott, R.G.; Baas, A.C.; Maia, L.P. Characterization of aeolian streamers using time-average videography. J. Coast. Res. 2013, 165, 1331–1336. [Google Scholar] [CrossRef]
- Delgado-Fernandez, I.; Davidson-Arnott, R.G.D.; Ollerhead, J. Application of a Remote Sensing Technique to the Study of Coastal Dunes. J. Coast. Res. 2009, 255, 1160–1167. [Google Scholar] [CrossRef]
- Van Enckevort, I.M.J.; Ruessink, B.G.; Coco, G.; Suzuki, K.; Turner, I.L.; Plant, N.G.; Holman, R.A. Observations of nearshore crescentic sandbars. J. Geophys. Res. C Oceans 2004, 109, 1–17. [Google Scholar] [CrossRef]
- Ruessink, B.G.; Pape, L.; Turner, I.L. Daily to interannual cross-shore sandbar migration: Observations from a multiple sandbar system. Cont. Shelf Res. 2009, 29, 1663–1677. [Google Scholar] [CrossRef]
- Pianca, C.; Holman, R.A.; Siegle, E. Shoreline variability from days to decades: Results of long-term video imaging. J. Geophys. Res. C Oceans 2015, 120, 2159–2178. [Google Scholar] [CrossRef] [Green Version]
- Guimarães, P.V.; Pereira, P.S.; Calliari, L.J.; Ellis, J.T. Behavior and identification of ephemeral sand dunes at the backshore zone using video images. Anais da Academia Brasileira de Ciências 2016, 88, 1357–1369. [Google Scholar] [CrossRef] [PubMed] [Green Version]
- Baas, A.C.W.; Sherman, D. Formation and behavior of aeolian streamers. J. Geophys. Res. Earth Surf. 2005, 110. [Google Scholar] [CrossRef] [Green Version]
- Jackson, N.L.; Sherman, D.J.; Hesp, P.A.; Klein, A.H.F.; Ballasteros, F., Jr.; Nordstrom, K.F. Small-scale spatial variations in aeolian sediment transport on a fine-sand beach. J. Coast. Res. 2006, 1, 379–383. [Google Scholar]
- Davidson-Arnott, R.G.D.; Yang, Y.; Ollerhead, J.; Hesp, P.A.; Walker, I.J. The effects of surface moisture on aeolian sediment transport threshold and mass flux on a beach. Earth Surf. Process. Landf. 2008, 33, 55–74. [Google Scholar] [CrossRef]
- Nield, J.M.; Wiggs, G.F.S.; Squirrell, R.S. Aeolian sand strip mobility and protodune development on a drying beach: Examining surface moisture and surface roughness patterns measured by terrestrial laser scanning. Earth Surf. Process. Landf. 2011, 36, 513–522. [Google Scholar] [CrossRef]
- Nield, J.M. Surface moisture-induced feedback in aeolian environments. Geology 2011, 39, 915–918. [Google Scholar] [CrossRef]
- Eamer, J.B.R.; Walker, I.J. Quantifying sand storage capacity of large woody debris on beaches using LiDAR. Geomorphology 2010, 118, 33–47. [Google Scholar] [CrossRef]
- Hesp, P.A.; Arens, S.M. Crescentic dunes at Schiermonnikoog, The Netherlands. Earth Surf. Process. Landf. 1997, 22, 785–788. [Google Scholar] [CrossRef] [Green Version]
- Kocurek, G.; Townsley, M.; Yeh, E.; Havholm, K.G.; Sweet, M.L. Dune and Dune-Field Development on Padre Island, Texas, with Implications for Interdune Deposition and Water-Table-Controlled Accumulation. J. Sediment. Res. 1992, 62, 622–635. [Google Scholar] [CrossRef]
- Elbelrhiti, H. Initiation and early development of barchan dunes: A case study of the Moroccan Atlantic Sahara desert. Geomorphology 2012, 138, 181–188. [Google Scholar] [CrossRef]
- McKenna Neuman, C.; Langston, G. Measurement of water content as a control of particle entrainment by wind. Earth Surf. Process. Landf. 2006, 31, 303–317. [Google Scholar] [CrossRef]
- Masselink, G.; Kroon, A.; Davidson-Arnott, R.G.D. Morphodynamics of intertidal bars in wave-dominated coastal settings—A review. Geomorphology 2006, 73, 33–49. [Google Scholar] [CrossRef]
- Aagaard, T.; Kroon, A.; Andersen, S.; Sørensen, R.M.; Quartel, S.; Vinther, N. Intertidal beach change during storm conditions; Egmond, The Netherlands. Mar. Geol. 2005, 218, 65–80. [Google Scholar] [CrossRef]
- Quartel, S.; Grasmeijer, B.T. Dynamiek van het strand bij Noordwijk aan Zee en Egmond aan Zee en het effect van suppleties. In Rijksinstituut voor Kust en Zee (RIKZ). Opdracht RKZ-1667; Universiteit Utrecht: Utrecht, The Netherlands, 2007. [Google Scholar]
- De Winter, R.C.; Gongriep, F.; Ruessink, B.G. Observations and modeling of alongshore variability in dune erosion at Egmond aan Zee, The Netherlands. Coast. Eng. 2015, 99, 167–175. [Google Scholar] [CrossRef]
- Wijnberg, K.M.; Terwindt, J.H.J. Extracting decadal morphological behaviour from high-resolution, long-term bathymetric surveys along the Holland coast using eigenfunction analysis. Mar. Geol. 1995, 126, 301–330. [Google Scholar] [CrossRef]
- Quartel, S.; Ruessink, B.G.; Kroon, A. Daily to seasonal cross-shore behaviour of quasi-persistent intertidal beach morphology. Earth Surf. Process. Landf. 2007, 32, 1293–1307. [Google Scholar] [CrossRef]
- De Vries, S.; Arens, S.M.; de Schipper, M.A.; Ranasinghe, R. Aeolian sediment transport on a beach with a varying sediment supply. Aeolian Res. 2014, 15, 235–244. [Google Scholar] [CrossRef]
- Hsu, S.A. Computing eolian sand transport from routine weather data. In Proceedings of the 14th International Conference on Coastal Engineering, Copenhagen, Denmark, 24–28 June 1974; pp. 1619–1626. [Google Scholar]
- Van Enckevort, I.M.J.; Ruessink, B.G. Effect of hydrodynamics and bathymetry on video estimates of nearshore sandbar position. J. Geophys. Res. C Oceans 2001, 106, 16969–16979. [Google Scholar] [CrossRef] [Green Version]
- Holman, R.A.; Sallenger, A.H. High-energy nearshore processes. Eos Trans. Am. Geophys. Union 1986, 67, 1369. [Google Scholar] [CrossRef]
- Holman, R.A.; Stanley, J. The history and technical capabilities of Argus. Coast. Eng. 2007, 54, 477–491. [Google Scholar] [CrossRef]
- Hage, P.M. Video Monitoring of Meso-Scale Aeolian Activity on a Narrow Beach. Master’s Thesis, Utrecht University, Utrecht, The Netherlands, 2014. Available online: https://dspace.library.uu.nl/handle/1874/301331 (accessed on 9 November 2018).
- Seppälä, M.; Lindé, K. Wind Tunnel Studies of Ripple Formation. Geogr. Ann. Ser. A Phys. Geogr. 1978, 60, 29–42. [Google Scholar] [CrossRef]
- Baas, J.H.; Oost, A.P.; Sztano, O.K.; Boer, P.L.; Postma, G. Time as an independent variable for current ripples developing towards linguoid equilibrium morphology. Terra Nova 1993, 5, 29–35. [Google Scholar] [CrossRef]
- Baas, J.H. A flume study on the development and equilibrium morphology of current ripples in very fine sand. Sedimentology 1994, 41, 185–209. [Google Scholar] [CrossRef]
- Bagnold, R.A. The Physics of Blown Sand and Desert Dunes; Dover Publications, Inc.: Mineola, NY, USA, 1941. [Google Scholar]
- Aarninkhof, S.G.J.; Turner, I.L.; Dronkers, T.D.T.; Caljouw, M.; Nipius, L. A video-based technique for mapping intertidal beach bathymetry. Coast. Eng. 2003, 49, 275–289. [Google Scholar] [CrossRef]
- Davidson-Arnott, R.G.D.; Law, M.N. Seasonal patterns and controls on sediment supply to coastal foredunes, Long Point, Lake Erie. In Coast Dunes: Form Process; John Wiley & Sons Inc.: Hoboken, NJ, USA, 1990; pp. 177–200. [Google Scholar]
- Delgado-Fernandez, I. Meso-scale modelling of aeolian sediment input to coastal dunes. Geomorphology 2011, 130, 230–243. [Google Scholar] [CrossRef] [Green Version]
- Smit, Y.; Ruessink, G.; Brakenhoff, L.B.; Donker, J.J.A. Measuring spatial and temporal variation in surface moisture on a coastal beach with a near-infrared terrestrial laser scanner. Aeolian Res. 2018, 31, 19–27. [Google Scholar] [CrossRef]
- Brakenhoff, L.B.; Smit, Y.; Donker, J.J.; Ruessink, G. Tide-Induced Variability in Beach Surface Moisture: Observations and Modelling. Earth Surf. Process. Landf. 2018. [Google Scholar] [CrossRef]
- Lynch, K.; Jackson, D.; Cooper, J.A.G. The fetch effect on aeolian sediment transport on a sandy beach: A case study from Magilligan Strand, Northern Ireland. Earth Surf. Process. Landf. 2016, 41, 1129–1135. [Google Scholar] [CrossRef]
- Delgado-Fernandez, I. A review of the application of the fetch effect to modelling sand supply to coastal foredunes. Aeolian Res. 2010, 2, 61–70. [Google Scholar] [CrossRef] [Green Version]
- Walker, I.J.; Hesp, P.A.; Davidson-Arnott, R.G.D.; Ollerhead, J. Topographic Steering of Alongshore Airflow over a Vegetated Foredune: Greenwich Dunes, Prince Edward Island, Canada. J. Coast. Res. 2006, 225, 1278–1291. [Google Scholar] [CrossRef]
- Lynch, K.; Jackson, D.W.; Cooper, J.A.G. A remote-sensing technique for the identification of aeolian fetch distance. Sedimentology 2006, 53, 1381–1390. [Google Scholar] [CrossRef]
- Nordstrom, K.F.; Jackson, N.L. The role of wind direction in eolian transport on a narrow sandy beach. Earth Surf. Process. Landf. 1993, 18, 675–685. [Google Scholar] [CrossRef]
- Namikas, S.L.; Edwards, B.L.; Bitton, M.C.A.; Booth, J.L.; Zhu, Y. Temporal and spatial variabilities in the surface moisture content of a fine-grained beach. Geomorphology 2010, 114, 303–310. [Google Scholar] [CrossRef]
- Nordstrom, K.F.; Jackson, N.L. Effect of source width and tidal elevation changes on aeolian transport on an estuarine beach. Sedimentology 1992, 39, 769–778. [Google Scholar] [CrossRef]
Figure 1.
Map of the field site and weather station.

Figure 2.
Wind rose based on hourly wind speed U and direction data collected between 2005 and 2012 at de Kooy, approximately 40 km north of our study site. The dashed line indicates the orientation of the coast. The data are made available with a resolution of 1 m/s for U and 10 for . The anemometer and wind vane are located at a height of 10 m above ground level.

Figure 3.
Example of a snapshot (A) and timex image (B). Streamers and waves are visible in the snapshot, but they are blurred out in the timex image. The images were taken on 25-09-2012 around 6.00 h (GMT). The hourly mean wind velocity U was 8 m/s and the wind direction was 97. = 0 is cross-shore from the west, = −90 is the alongshore wind coming from the north, and = 90 is alongshore from the south.

Figure 4.
Examples of snapshots made by the north-facing camera and classified according to their visual signs of aeolian activity, where class 0 shows no signs of transport (A); class 1 shows very small signs of transport, like single moving patches of sand or a handful of streamers (B); class 2 has more of these sand patches, but they have not formed rows of sand strips; class 3 does have rows of sand strips, but they cover a patchy area; and class 4 features sand strips that cover most of the beach, often in combination with high streamer activity The date of the image and wind conditions were: 08-02-2006, U = 7 m/s, = −23 (A); 05-03-2006, U = 8 m/s, = −23 (B); 02-03-2006, U = 9 m/s, = 17 (C); 25-03-2006, U = 10 m/s, = 47 (D); 10-11-2005, U = 12 m/s, = 57 (E); where = 0 is cross-shore, = −90 is the alongshore wind coming from the north, and = 90 is alongshore from the south.

Figure 5.
Wind rose for (A) unlimited and (B) limited transport events. Mind the different scales of the two wind roses. The dashed line indicates the orientation of the coast.
Figure 5.
Wind rose for (A) unlimited and (B) limited transport events. Mind the different scales of the two wind roses. The dashed line indicates the orientation of the coast.

Figure 6.
Relative frequency of the wind velocity for limited and unlimited events. The mean wind velocity for unlimited events is 10.3 m/s (standard deviation of 1.9 m/s) and 11.1 m/s (standard deviation of 2.3 m/s) limited transport events.
Figure 6.
Relative frequency of the wind velocity for limited and unlimited events. The mean wind velocity for unlimited events is 10.3 m/s (standard deviation of 1.9 m/s) and 11.1 m/s (standard deviation of 2.3 m/s) limited transport events.

Figure 7.
Relative frequency of the temperature at the time of observation (1 observation per hour) during the limited and unlimited transport events. The mean temperature for unlimited and limited events was 12.4 C (with a standard deviation of 5.1 C) and 10.5 C (with a standard deviation of 5.9 C), respectively.

Figure 8.
Relative monthly occurrence of limited and unlimited events. The unlimited events shown are separated in the visible transport classes given in Figure 4.
Figure 8.
Relative monthly occurrence of limited and unlimited events. The unlimited events shown are separated in the visible transport classes given in Figure 4.

Figure 9.
The difference in beach width during the part of the day with limited and unlimited transport. A positive difference implies a larger width during unlimited transport than during limited transport.
Figure 9.
The difference in beach width during the part of the day with limited and unlimited transport. A positive difference implies a larger width during unlimited transport than during limited transport.


Table 1.
Wind classes.
| Wind Class | Wind Velocity (m/s) |
|---|---|
| 1 | 8 |
| 2 | 9–11 |
| 3 | 12 |
| 4 | ≥13 |
Table 2.
Number of events sorted according to their wind class (Table 1) and transport class (Figure 4). The limited events are coloured in grey.
| Transport Class | |||||
|---|---|---|---|---|---|
| Wind Class | 0 | 1 | 2 | 3 | 4 |
| 1 | 82 | 99 | 32 | 27 | 21 |
| 2 | 46 | 87 | 27 | 38 | 53 |
| 3 | 9 | 23 | 16 | 11 | 23 |
| 4 | 18 | 25 | 17 | 5 | 49 |
Table 3.
Two-sample Kolmogorov-Smirnov test between limited and unlimited data for various variables and alpha values. Acceptance of the null hypothesis are marked with 0, a rejection (i.e., the data comes from different distributions) it with 1.
Table 3.
Two-sample Kolmogorov-Smirnov test between limited and unlimited data for various variables and alpha values. Acceptance of the null hypothesis are marked with 0, a rejection (i.e., the data comes from different distributions) it with 1.
| 0.001 | 0.005 | 0.01 | 0.02 | 0.05 | 0.1 | 0.15 | |
|---|---|---|---|---|---|---|---|
| hour of occurence | 0 | 0 | 0 | 0 | 0 | 0 | 1 |
| month of occurence | 1 | 1 | 1 | 1 | 1 | 1 | 1 |
| wind velocity (mean) | 1 | 1 | 1 | 1 | 1 | 1 | 1 |
| wind velocity (last 10 min of each hour) | 1 | 1 | 1 | 1 | 1 | 1 | 1 |
| wind velocity (highest gust of each hour) | 1 | 1 | 1 | 1 | 1 | 1 | 1 |
| temperature (at time of observation at 1.5 m) | 1 | 1 | 1 | 1 | 1 | 1 | 1 |
| temperature (minimum for preceding 6 h at 0.1 m) | 0 | 0 | 0 | 0 | 0 | 0 | 0 |
| temperature (dew point at 1.5 m) | 1 | 1 | 1 | 1 | 1 | 1 | 1 |
| sunshine duration | 0 | 0 | 0 | 0 | 0 | 0 | 0 |
| global radiation | 0 | 0 | 0 | 0 | 0 | 1 | 1 |
| precipitation duration | 0 | 0 | 0 | 0 | 0 | 0 | 0 |
| hourly precipitation amount | 0 | 0 | 0 | 0 | 0 | 0 | 0 |
| air pressure | 0 | 0 | 0 | 0 | 0 | 1 | 1 |
| cloud cover | 0 | 0 | 0 | 0 | 0 | 0 | 0 |
| relative atmospheric humidity (at time of observation at 1.5 m) | 0 | 0 | 0 | 0 | 0 | 0 | 0 |
| fog occurence | 0 | 0 | 0 | 0 | 0 | 0 | 0 |
| rain occurence | 0 | 0 | 0 | 0 | 0 | 0 | 0 |
| snow occurence | 0 | 0 | 0 | 0 | 0 | 0 | 0 |
| thunder occurence | 0 | 0 | 0 | 0 | 0 | 0 | 0 |
| ice occurence | 0 | 0 | 0 | 0 | 0 | 0 | 0 |
© 2018 by the authors. Licensee MDPI, Basel, Switzerland. This article is an open access article distributed under the terms and conditions of the Creative Commons Attribution (CC BY) license (http://creativecommons.org/licenses/by/4.0/).
Share and Cite
MDPI and ACS Style
Hage, P.; Ruessink, G.; Donker, J. Using Argus Video Monitoring to Determine Limiting Factors of Aeolian Sand Transport on a Narrow Beach. J. Mar. Sci. Eng. 2018, 6, 138. https://doi.org/10.3390/jmse6040138
AMA Style
Hage P, Ruessink G, Donker J. Using Argus Video Monitoring to Determine Limiting Factors of Aeolian Sand Transport on a Narrow Beach. Journal of Marine Science and Engineering. 2018; 6(4):138. https://doi.org/10.3390/jmse6040138
Chicago/Turabian StyleHage, Pam, Gerben Ruessink, and Jasper Donker. 2018. "Using Argus Video Monitoring to Determine Limiting Factors of Aeolian Sand Transport on a Narrow Beach" Journal of Marine Science and Engineering 6, no. 4: 138. https://doi.org/10.3390/jmse6040138
Note that from the first issue of 2016, this journal uses article numbers instead of page numbers. See further details here.