Abstract
Plasma Electrolytic Oxidation (PEO) is a surface treatment, similar to anodizing, that produces thick oxide films on the surface of metals. In the present work, PEO coatings were obtained on zinc-aluminized (ZA) carbon steel using a solution containing sodium silicate and potassium hydroxide as electrolyte, and working with high current densities and short treatment times in Direct Current (DC) mode. The thickness of the coating, as well as the surface morphology, were strongly influenced by the process parameters, with different dissolution grades of the ZA layer depending on the current density and treatment time. A compromise between thickness and porosity of the coating was found with low current density/long treatment time or high current density/short treatment time. The PEO layer was mainly composed of aluminum oxides and silicon compounds. The corrosion resistance increased remarkably in the samples with the PEO coating. These PEO coated samples are suitable for sealing treatments that further increase their corrosion properties or will be also an ideal substrate for commercial painting, assuring improved mechanical adhesion and protection even in the presence of damages.
1. Introduction
Steel is often employed in engineering applications due to its good mechanical properties, good machinability, and low cost. Carbon steels are often used in structural applications. Corrosion problems often affect carbon steels and the substitution with stainless steels is often not possible due to their higher cost. In order to overcome this problem, a possible approach is a proper surface treatment on the metal. Plasma electrolytic oxidation (PEO) of metals is an electrochemical process that produces an oxide ceramic layer on the surface. PEO is similar to traditional anodic oxidation but works with higher voltages and current densities. The high voltage (that has to be above the dielectric breakdown potential of the oxide layer) forms anodic micro-discharges that moving randomly over the processed surface produce the growth of the coating [1,2]. The corrosion and wear properties depend on current density, voltage, treatment time, and electrolyte composition employed during PEO treatment [3]. The process has been widely studied on aluminum and magnesium alloys and many results are reported in the literature, especially about the increased corrosion and wear performances of light alloys after PEO treatment. A lot of studies have been performed also on Ti, Zr, Nb, Ta and alloys obtaining very interesting results, especially in the biomaterials field [4,5,6,7]. Moreover, PEO offers the possibility to proper functionalize the surface by adding particles or specific compounds in the electrolyte [8,9,10]. In comparison to PEO on light alloys, the number of works regarding the application of this treatment on steels is quite low, and, in detail, some works on carbon steel and only one on low alloyed steel can be found [11,12,13,14,15]. These research works showed that the quality of the coatings produced directly on steels, in terms of adhesion, homogeneity, and corrosion properties, resulted lower than the ones obtained on light alloys. One of the possibilities studied in literature to overcome this problem and to produce PEO coatings with good quality on ferrous metals is to perform, before the PEO, a pre-treatment. In particular, some works can be found regarding the realization of PEO coatings on aluminized steels [16,17,18]. The main problem regarding this approach is that the aluminizing of steels is not such a common treatment. In order to use as a pre-treatment an economic and common treatment, zinc-based pre-treatments could be used as possible substrates for PEO coatings. However, preliminary research in the literature showed that PEO coatings formed on pure zinc have a high level of defects, as evidenced by Stojanovic et al. [19]. and are slightly protective against corrosion, as stated Rocca et al. [20]. In the literature, promising results were found for PEO coatings produced on zinc-aluminum alloys. In detail, Guangdong Bian et al. [21]. found that the PEO method can produce a continuous and dense coating on the ZA27 alloy using silicate, aluminate, and aluminate/borate electrolytes; and Guangyin Li et al. [22] showed that PEO coatings can effectively protect the ZA27 alloy from abrasive and adhesive wear and corrosion. Zinc-Aluminum coatings (ZA) are quite common in industrial applications to provide corrosion protection on steels. Considering this, the aim of this work was to study PEO process on steels with a ZA pre-treatment and to test the corrosion resistance of the obtained samples. This research represents an innovative use of PEO process, since no works in literature reported the obtainment of PEO coatings on zinc-aluminized steels. Based on the obtained results, it will be possible to obtain PEO coatings with low defect level, adherent to the substrate and characterized by a porous surface on steels, employing as pre-treatment a common treatment as ZA. The presence of pores and micro-cracks is typical of PEO coatings as extensively studied in the literature and as stated for example by Curran et al. [2]. This porosity is a characteristic of these coatings and can be technologically employed with proper post-treatments to functionalize the surface.
The PEO-coated steels, obtained in this work, could be suitable for other treatments that can further increase their corrosion properties such as sealing treatments or painting treatments. In fact, sealing treatments are commonly employed to improve corrosion protection of PEO-coated specimens [8,9]. Moreover, the presence of a PEO layer will increase mechanical adhesion of eventual commercial painting and will assure protection in case of scratches or other kind of damages, improving significantly the corrosion properties [23]. The obtained PEO coated steels can be employed, after proper post treatments, in applications where both corrosion and abrasion resistance are required.
2. Materials and Methods
The samples of carbon steel (0.16% C, 1.06% Mn, 0.09% Al, 0.03% Cr, 0.07% Cu) coated with commercial ZA coating (75% Al and 25% Zn) were used for the experiments. PEO treatments were performed using as electrolyte an aqueous alkaline solution with 20 g/L of Na2SiO3 and 10 g/L of KOH.
The PEO process was performed with a DC power supply of 400 V/8 A capacity (TDK-Lambda, Achem, Germany). During the treatment, the substrate was the anode and a carbon steel mesh was the cathode. The electrolyte was maintained at ambient temperature with a thermostatic bath. The treatments were performed in DC galvanostatic mode, letting the potential free to vary until a limit of 350 V, working at high current densities for short treatment times. Different current densities and different treatment times were tested. In detail, current densities of 1.1, 1.7 and 2.3 A/cm2 were employed. For each current density, two different treatment times were used; 2 and 3 min. The samples, after the treatment, were washed with deionized water and ethanol, then dried with compressed air. The choice of the electrical parameters was performed on the base of preliminary tests and with the objective to work at high current densities and short treatment times. From the preliminary tests for high current densities and treatment times over 3 min, the coating resulted too porous. For treatment times lower than 2 min, the coating does not have the time to form (because it takes some time to start at the micro-arc stage, which is the stage where PEO coating grow). Therefore, in this work was analyzed the above reported combination of current densities and treatment times.
For all the samples, morphology, composition, thickness, and corrosion resistance of the coatings were evaluated. The samples were compared with the ones with only the ZA coating. All the samples were produced in triplicate in order to assure reproducibility.
The treated samples were cut in a cross-section and mounted in epoxy resin, then polished with standard metallographic technique (grinding with abrasive papers from 320 to 1200 grit and polishing with clothes and diamond suspension of 6 and 1 µm). Both the surface and the cross-section of treated samples were examined with a Cambridge Stereoscan 440 scanning electron microscope (Leica Microsystem S.r.l., Milan, Italy), equipped with a Philips PV9800 Energy Dispersive X-Ray Spectroscopy (EDS), (Leica Microsystem S.r.l., Milan, Italy), in order to evaluate morphology, thickness, and elemental composition of the coating. To better evaluate the distribution of the elements along the cross-section EDS elemental mapping was also performed. The phase composition of the most significant sample was performed with X-ray diffraction (XRD) using a Siemens D500 X-ray diffractometer, (Siemens, Munich, Germany) using Cu Kα radiation with a step scan of 0.05 and a counting time of 5 s in an angular range between 20° and 80°.
The corrosion performance of the coatings was determined firstly by potentiodynamic polarization tests (PDP), and then by electrochemical impedance spectroscopy (EIS) at ambient temperature.
The PDP tests were performed in a solution containing 0.1 M Na2SO4 with an AMEL 2549 Potentiostat (Amel Electrochemistry S.r.l., Milan, Italy). A saturated calomel electrode was employed as a reference electrode (SCE) and platinum as a counter electrode, with a scan rate of 0.5 mV s−1. Considering the insulating nature of the PEO layer PDP was employed only for qualitative evaluation of the corrosion performances, whereas quantitative considerations were performed with EIS measurements [9]. The electrolyte was chosen in order to simulate atmospheric corrosion conditions in a middle aggressive environment as reported in [24].
The EIS measurements were carried out with the same cell and electrolyte employed in potentiodynamic polarization, at the value of the open circuit potential and in a frequency range between 105 and 10−2 Hz, with a perturbation amplitude of 10 mV. A Materials Instrument Spectrometer coupled with the 2549 Potentiostat was used to record EIS measurements (Amel Electrochemistry S.r.l., Milan, Italy). and the Z-View software (version 3.3) was employed for the fitting of impedance data. All the electrochemical measurements were performed in triplicate, in order to assure the reproducibility of the results.
3. Results and Discussion
3.1. Microstructural Characterization
The surfaces and the cross sections of the samples were analyzed at scanning electron microscopy (SEM) and the results are presented in Figure 1 (surfaces) and Figure 2 (cross sections).
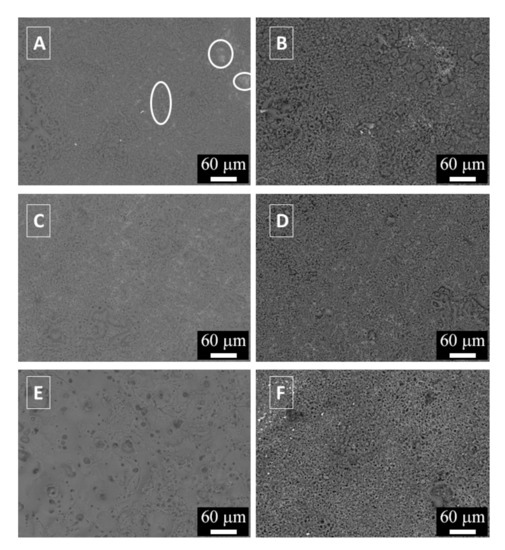
Figure 1.
SEM images (backscattered electrons mode) of the surfaces of the samples: (A) Sample treated at 1.1 A/cm2 for 2 min; (B) sample treated at 1.1 A/cm2 for 3 min; (C) Sample treated at 1.7 A/cm2 for 2 min; (D) Sample treated at 1.7 A/cm2 for 3 min; (E) Sample treated at 2.3 A/cm2 for 2 min; (F) Sample treated at 2.3 A/cm2 for 3 min.
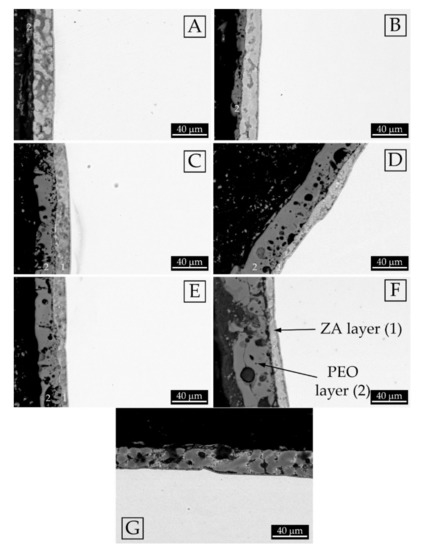
Figure 2.
SEM images (backscattered electrons mode) of the cross sections of the different samples: (A) Sample treated at 1.1 A/cm2 for 2 min; (B) Sample treated at 1.1 A/cm2 for 3 min; (C) Sample treated at 1.7 A/cm2 for 2 min; (D) Sample treated at 1.7 A/cm2 for 3 min; (E) Sample treated at 2.3 A/cm2 for 2 min; (F) Sample treated at 2.3 A/cm2 for 3 min; (G) Sample with only the ZA layer In the micrographs the number (1) indicates the inner ZA layer and the number (2) the external PEO layer.
The surface analysis showed the typical morphology of PEO coatings with the presence of nodular structures and with the evidence of a lot of pores and micro-cracks of different dimensions, coming from the discharge phenomena. In the sample treated at 1.1 A/cm2 for 2 min (Figure 1A) are present some uncoated zones, highlighted by white circles, indicating that the PEO layer was not completely formed on the surface. In detail, these uncoated zones are the lighter in the SEM micrographs. Increasing the treatment time up to 3 min a more uniform coating was produced, characterized by the presence of nodular structures as observable in (Figure 1B). Some pores of little dimension can be also observed. Considering the samples treated at 1.7 A/cm2 (Figure 1C,D), in both samples the coating covered the entire surface. Comparing the two samples, an increase in the treatment time produced an increase of the nodular structures on the surface (see the right side of Figure 1D). The porosity in the sample observed in Figure 1D appear higher than the one in the sample observed in Figure 1B. The sample treated at 2.3 A/cm2 for 2 min (Figure 1E) was characterized by a smoother surface with the presence of less but larger volcano-like pores, in comparison with the other samples. The coating seemed also more compact that the one obtained on other samples. The sample treated at 2.3 A/cm2 for 3 min (Figure 1F) was instead characterized by the presence of many small pores and a low number of nodular structures, even if the surface was not as smooth as the one obtained at 2 min. Clearly, the sample reported in Figure 1F is the one with the highest number of pores.
The cross sections of the samples (Figure 2), resulted in increasing current density, with a progressive thinning of the thickness of the ZA layer (the internal grey one, named 1 in the figures) and a thickening of the PEO layer (the dark and porous layer on the top, named 2). The ZA layer was about 30 µm thick in the sample without PEO layer (Figure 2G) and was about 7 µm thick in the sample treated at the higher current density and for longer treatment time (Figure 2F). This can be correlated with the oxidation of the ZA layer during PEO process and, consequently, an increase in the current density induced a higher oxidation rate. From the reported micrographs the presence of some dark grey zones in the ZA layer was observed, both in the samples before, and after, the PEO treatment. In the sample treated at 1.1 A/cm2 for 2 min (Figure 2A) the formation of the PEO layer was not complete, whereas after the treatment for 3 min (Figure 2B) the PEO coating formed above all the surface. The samples treated at 1.7 and 2.2 A/cm2 showed a remarkable reduction in the thickness of the ZA layer if compared with the samples obtained at 1.1 A/cm2. Moreover, longer treatment times, at these current densities, induced the formation of thicker layers with a higher porosity in the upper layer. A summary of the thickness of the PEO layers and of the ZA layers for the various samples is reported in Table 1. A possible problem, already found in literature with PEO coatings on metallized steel [25], could be the detachment between the ZA layer and the PEO layer. In order to avoid this, a careful control of the process parameters must be performed because the problem occurs when a too thick PEO layer is present. In this case, some problems of detachment can be found in Figure 2F for the sample treated at high current density for long treatment time.

Table 1.
Thickness of ZA and PEO layers of the different samples. Data coming from three different measurements.
In order to study the composition of the different layers, EDS micro-analysis was performed on the cross section of the samples treated at the higher and the lower current density. The semi-quantitative results are reported in Table 2.
Table 2.
EDS semi-quantitative results (wt %) on the various samples.
Considering the results reported in Table 2, it can be noticed that the light grey areas in the inner layer were composed of only Zn and Al that is the ZA layer. The dark grey zones in the inner layer were constituted by Al, Zn and O, suggesting that oxidation phenomena occurred. In all the samples the external layer represented the actual PEO layer, with the main presence of silicon and aluminum oxides, in accordance with the composition of the electrolyte and substrate.
To further investigate the distribution of the elements in the layers, also EDS elemental mapping was performed on the sample that seemed to exhibit the lower porosity and higher uniformity of the coating, that is the one obtained at 2.3 A/cm2 for 2 min. The results are reported in Figure 3. From the analysis of the elemental mapping, it can be observed that the PEO layer (the outer layer) was mainly composed of silicon and aluminum oxides, whereas the inner layer (the ZA layer) was composed by aluminum and zinc.
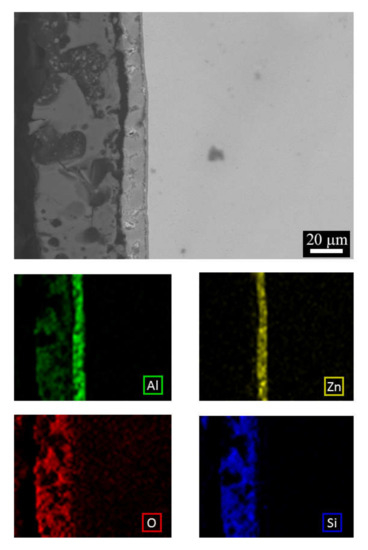
Figure 3.
SEM-EDS elemental mapping performed on the cross section of the sample obtained at 2.3 A/cm2 for 2 min.
XRD analysis was also performed on the sample obtained at 2.3 A/cm2 for 2 min. The XRD pattern is reported in Figure 4. It can be noticed the presence of the peaks of aluminum (PDF-2 database, reference N°000040787) and zinc (PDF-2 database, reference N°000040831) coming from the ZA layer, due to the penetration of X-rays under the PEO layer. From the observation of the XRD pattern, amorphous phases were present in the PEO layer, as typical for this kind of coatings [26]. Considering the crystalline part, the PEO layer resulted mainly composed by SiO2 (PDF-2 database, reference N°000821573), in accordance with the composition of the electrolyte that was a silicate-based one. Comparing the results of EDS elemental mapping (Figure 3) and XRD (Figure 4), it is reasonable to think that the amorphous part is mainly composed by an [Al–Si–O] phase. The presence of this kind of phase, like mullite but amorphous, is also in accordance with what found by Guan et al. [27].
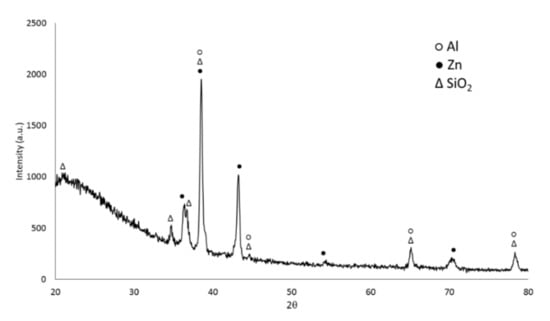
Figure 4.
XRD analysis of the sample obtained at 2.3 A/cm2 for 2 min.
Summarizing the results of the characterization of the samples, the morphology of the coatings was rich in pores, pancake, and nodular structures, in accordance with the results of other authors regarding PEO coatings produced on bulk ZA alloys [21,22]. As reported by Clyne et al. [25], most of PEO coatings present porosity, which is deleterious for the durability of the coating but, at the same time, increases stiffness and biocompatibility of the coating and, moreover, can be sealed with proper post treatments. The porosity forms because of oxygen entrapment in molten alumina in the vicinity of localized electrical discharges, which occur during PEO coating formation [2]. The discharges occurring during PEO have a strong tendency to take place in extended sequences (cascades) at fixed locations [28]. Increasing the current density generally induces a higher number of discharges location, and, consequently, of the porosity [29], and higher growth rate of the coating [30]. Also extending the treatment time produces an increase in the volcano-like pore population, at least until a critical value, as evidenced by Al Bosta et al. [31]. Treatment time also influences the thickness of the coating, as it becomes thicker with time. This is in accordance with the results reported in this work, where the increase in the current density employed in the treatment, as well as in the treatment time, produced a thinning of the ZA layer and a thickening of the PEO layer. Considering this, a compromise must be found in order to obtain a thick but not too porous coating. In detail, the samples obtained at 1.1 A/cm2 for 3 min and the one obtained at 2.3 A/cm2 for 2 min seemed the most promising. The PEO coating resulted composed of crystalline SiO2 and of amorphous [Al-Si-O] phase. The presence of both the phases is in accordance with Clyne et al. [25], that showed that the composition of PEO layers is determined both by the composition of the substrate (so by the oxidation of the ZA layer in our case) and by the incorporation of compounds from the electrolyte (Silicon compounds from the silicate-based electrolyte).
3.2. Corrosion Resistance
The corrosion resistance of the samples was preliminarily evaluated by potentiodynamic polarization tests, in a solution containing sulphates. The results are reported in Figure 5. Considering that the three different curves for each sample were very similar, only one was reported for each sample.
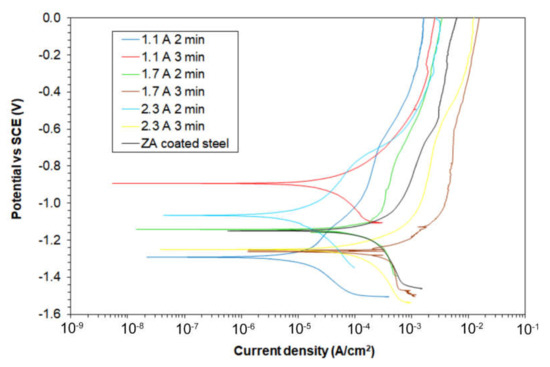
Figure 5.
Potentiodynamic polarization curves for the different samples (test solution: 0.1 M Na2SO4).
Firstly, it is possible to see that the samples treated at 1.7 and 2.3 A/cm2 for 3 min were characterized by a lower corrosion resistance if compared with the ZA sample, in accordance with the SEM observation that showed high porosity on these samples. The sample characterized by the higher corrosion resistance was the sample treated at 1.1 A/cm2 for 3 min. Moreover, also the samples 1.1 A/cm2 for 2 min and 2.3 A/cm2 for 2 min showed better corrosion performances if compared with the ZA sample. However, considering the insulating nature of the PEO coating, no quantitative considerations can be performed from potentiodynamic polarization.
In order to deeply study the corrosion behavior of the samples also EIS tests were performed and the results in terms of Nyquist plot are reported in Figure 6. The experimental data coming from EIS were fitted with the software Z-view, using the equivalent circuits reported in Figure 7. In detail, the circuit in Figure 7A was used for the sample with only the ZA coating, with the circuit that represents the natural oxide film formed on the surface of the sample, whereas the circuit in Figure 7B was employed for the PEO treated samples. This circuit is the typical one used to fit data of PEO-treated samples, where are present an inner barrier layer, that gives the major protection against corrosion, and an external porous layer [15]. The ZA layer under the PEO coating was not considered in the equivalent circuit, since this layer, for its conductive nature, acts with the substrate as one unique electrochemical unit, under the PEO layer. Considering more in detail the meaning of the different elements in this circuit (Figure 7B): R1 represents the resistance of the electrolyte, whereas the two parallels R2-CPE1 and R3-CPE2 consider the two different interfaces formed between the electrolyte and the two layers of the PEO coatings. The R2-CPE1 circuit represents the interface between the electrolyte and the external porous layer, and the R3-CPE2 the interface between the electrolyte into the pores and the inner barrier layer of PEO coating. As the measured capacitance is not ideal, CPEi instead of capacitances were used in the equivalent circuits. The fitting results of the experimental data are reported in Table 3. Good fitting quality was obtained considering the low reported values of chi squared.
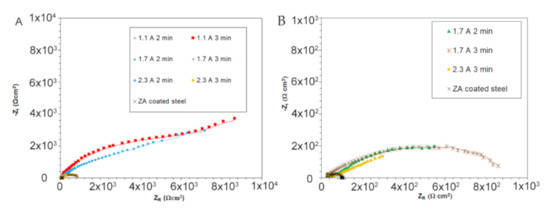
Figure 6.
Nyquist plot coming from EIS tests, global results (A) and detail of the samples with low resistance (B) (test electrolyte: 0.1 M Na2SO4). In the graphs, dots represent the experimental data, lines the result of the fitting.
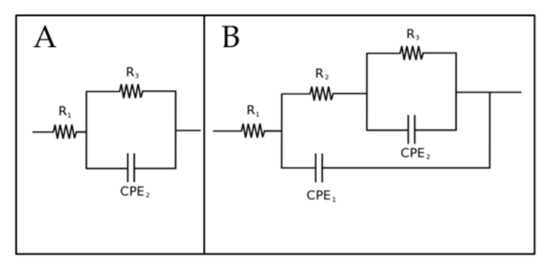
Figure 7.
Equivalent circuits employed to fit EIS data for the ZA coated sample, with the circuit that represents the natural oxide film on the surface (A) and for the PEO treated samples, with the two circuits that represent the inner and external layers of PEO coating (B).
Table 3.
Results of the fitting of experimental data. Standard deviation range of the single data are between 1% and 5%.
In analyzing the Nyquist plots, reported in Figure 6A, it resulted that the samples treated at 1.1 A/cm2 for 3 min and the one treated at 2.3 A/cm2 for 2 min were characterized by improved corrosion resistance in comparison with all the other samples. In fact, considering the width of the semicircle and the intersection with the X-axis as qualitative evaluation of the polarization resistance Rp, an increase of more than one order of magnitude in the polarization resistance of these two samples in comparison with the others can be observed. Observing the Nyquist plots of all the other samples (Figure 6B), an increase in the polarization resistance of all the PEO-treated samples in comparison with the only ZA one was recorded. The quality of the fitting was positive, as can be observed from the good agreement between experimental and fitting data and from the low chi-squared values.
From the analysis of the fitting results (Table 3), it was confirmed that all the PEO-treated samples were characterized by improved corrosion performances compared to the ZA sample, as evidenced by the increased values of polarization resistance (R2 and R3) that were one or two orders of magnitude higher in the PEO treated samples. Considering the different PEO-treated samples and comparing the values of R2 and R3, it can be noticed that the samples treated at 1.1 A/cm2 for 3 min and treated at 2.3 A/cm2 for 2 min showed values of R3 one order of magnitude higher than the other PEO-treated samples. This can be correlated with the higher homogeneity and lower porosity of these samples, as resulted by SEM observations. In particular, large differences among the various samples were found in the R3 value and these can be linked with the porosity: R3 represents the resistance of the inner barrier layer of PEO coatings, when the porosity is low (samples treated at 1.1 A/cm2 for 3 min and treated at 2.3 A/cm2 for 2 min) only small quantity of electrolyte can penetrate and attack this layer. When instead a high number of pores is recorded also the inner layer is clearly more prone to corrosion, and the R3 value strongly decreases.
In general, thickness and porosity are the main factors that can influence the corrosion properties of PEO coated samples. The increase in coating thickness played an important role in the corrosion behavior due to the barrier effect given by the coating. However, high current density, applied for long treatment times resulted detrimental for corrosion protection due to the coarse and very porous microstructure, as already found in literature on another substrate such as ZK60 alloy [32]. Also, Bala Srinivasan et al. [33] found that high current density increased the number of defects and micro-cracks and that a compromise between growth rate and quality of the microstructure must be found. The results of the present work agreed with these considerations. In fact, it was found that the better results in terms of corrosion resistance were obtained either with low current density and long treatment time (sample treated at 1.1 A/cm2 for 3 min) or with high current density and short treatment time (sample treated at 2.3 A/cm2 for 2 min) that were the samples that exhibited good compromise in term of thickness and porosity.
4. Conclusions
The present work demonstrated the possibility of producing PEO coatings on zinc-aluminized steels. PEO coatings produced on pure zinc, from the literature, were characterized by a high level of defects and are not protective against corrosion. The acceptable homogeneity and low defect level, obtained in this work, have to be ascribed to the presence of aluminum in the ZA layer, which dissolves and builds up the PEO structure. The better conditions in order to maximize the corrosion resistance resulted 1.1 A/cm2 for 3 min and 2.3 A/cm2 for 2 min. In this way, a homogeneous coating, mainly composed of amorphous [Al–Si–O] phase and crystalline silicon oxide, was formed on the top of the ZA layer. The improved corrosion performances of these two samples, in comparison with the others, can be ascribed to the good compromise between coating thickness and porosity. Considering that ZA treatment is a common treatment on carbon steel, the use of ZA layer as pre-treatment layer may represent a promising way to produce PEO coating of good quality on steels. Eventual problems could be the adhesion between the ZA layer and the PEO layer, and the high economic cost of PEO process.
Author Contributions
Conceptualization, L.P. and P.C.; methodology, L.P.; software, A.G.S.; validation, L.P. and A.G.S.; formal analysis, L.P. and A.G.S.; investigation, L.P. and A.G.S.; resources, M.D. and K.B.; data curation, A.G.S. and C.G.; writing—original draft preparation, L.P. and A.G.S.; writing—review and editing, L.P., K.B.; visualization, C.G.; supervision, M.D. and K.B.; project administration, M.D. and K.B.; funding acquisition, M.D. and K.B. All authors have read and agreed to the published version of the manuscript.
Funding
This research received no external funding.
Conflicts of Interest
The authors declare no conflict of interest.
References
- Martin, J.; Melhem, A.; Shchedrina, I.; Duchanoy, T.; Nominé, A.; Henrion, G.; Czerwiec, T.; Belmonte, T. Effects of electrical parameters on plasma electrolytic oxidation of aluminium. Surf. Coat. Technol. 2013, 221, 70–76. [Google Scholar] [CrossRef]
- Curran, J.A.; Clyne, T.W. Porosity in plasma electrolytic oxide coatings. Acta Mater. 2006, 54, 1985–1993. [Google Scholar] [CrossRef]
- Pezzato, L.; Coelho, L.B.; Bertolini, R.; Settimi, A.G.; Brunelli, K.; Olivier, M.; Dabalà, M. Corrosion and mechanical properties of plasma electrolytic oxidation-coated AZ80 magnesium alloy. Mater. Corros. 2019, 70, 2103–2112. [Google Scholar] [CrossRef]
- Fattah-Alhosseini, A.; Keshavarz, M.K.; Molaei, M.; Gashti, S.O. Plasma Electrolytic Oxidation (PEO) Process on Commercially Pure Ti Surface: Effects of Electrolyte on the Microstructure and Corrosion Behavior of Coatings. Met. Mater. Trans. A 2018, 49, 4966–4979. [Google Scholar] [CrossRef]
- Sowa, M.; Simka, W. Effect of DC Plasma Electrolytic Oxidation on Surface Characteristics and Corrosion Resistance of Zirconium. Materials 2018, 11, 723. [Google Scholar] [CrossRef]
- Sowa, M.; Kazek-Kęsik, A.; Krząkała, A.; Socha, R.; Dercz, G.; Michalska, J.; Simka, W. Modification of niobium surfaces using plasma electrolytic oxidation in silicate solutions. J. Solid State Electrochem. 2018, 18, 3129–3142. [Google Scholar] [CrossRef]
- Sowa, M.; Simka, W. Electrochemical Impedance and Polarization Corrosion Studies of Tantalum Surface Modified by DC Plasma Electrolytic Oxidation. Materials 2018, 11, 545. [Google Scholar] [CrossRef]
- Mingo, B.; Arrabal, R.; Mohedano, M.; Llamazares, Y.; Matykina, E.; Yerokhin, A.; Pardo, A. Influence of sealing post-treatments on the corrosion resistance of PEO coated AZ91 magnesium alloy. Appl. Surf. Sci. 2018, 433, 653–667. [Google Scholar] [CrossRef]
- Pezzato, L.; Rigon, M.; Martucci, A.; Brunelli, K.; Dabalà, M. Plasma Electrolytic Oxidation (PEO) as pre-treatment for sol-gel coating on aluminum and magnesium alloys. Surf. Coatings Technol. 2019, 366, 114–123. [Google Scholar] [CrossRef]
- Pezzato, L.; Cerchier, P.; Brunelli, K.; Bartolozzi, A.; Bertani, R.; Dabalà, M. Plasma electrolytic oxidation coatings with fungicidal properties. Surf. Eng. 2019, 35, 325–333. [Google Scholar] [CrossRef]
- Saikiran, A.; Hariprasad, S.; Arun, S.; Rama Krishna, L.; Rameshbabu, N. Effect of electrolyte composition on morphology and corrosion resistance of plasma electrolytic oxidation coatings on aluminized steel. Surf. Coatings Technol. 2019, 372, 239–251. [Google Scholar]
- Wang, Y.; Jiang, Z.; Yao, Z.; Tang, H. Microstructure and corrosion resistance of ceramic coating on carbon steel prepared by plasma electrolytic oxidation. Surf. Coatings Technol. 2010, 204, 1685–1688. [Google Scholar] [CrossRef]
- Wang, Y.; Jiang, Z.; Yao, Z. Preparation and properties of ceramic coating on Q235 carbon steel by plasma electrolytic oxidation. Curr. Appl. Phys. 2009, 9, 1067–1071. [Google Scholar] [CrossRef]
- Wang, Y.; Jiang, Z.; Yao, Z. Microstructure, bonding strength and thermal shock resistance of ceramic coatings on steels prepared by plasma electrolytic oxidation. Appl. Surf. Sci. 2009, 253, 650–656. [Google Scholar] [CrossRef]
- Pezzato, L.; Brunelli, K.; Dolcet, P.; Dabalà, M. Plasma electrolytic oxidation coating produced on 39NiCrMo3 steel. Surf. Coatings Technol. 2016, 307, 73–80. [Google Scholar] [CrossRef]
- Wu, Z.; Xia, Y.; Li, G.; Xu, F. Structure and mechanical properties of ceramic coatings fabricated by plasma electrolytic oxidation on aluminized steel. Appl. Surf. Sci. 2007, 253, 8398–8403. [Google Scholar] [CrossRef]
- Karpushenkov, S.A.; Shchukin, G.L.; Belanovich, A.L.; Savenko, V.P.; Kulak, A.I. Plasma electrolytic ceramic-like aluminum oxide coatings on iron. J. Appl. Electrochem. 2010, 40, 365–374. [Google Scholar] [CrossRef]
- Gu, W.C.; Lv, G.H.; Chen, H.; Chen, G.L.; Feng, W.R.; Zhang, G.L.; Yang, S.Z. Preparation of ceramic coatings on inner surface of steel tubes using a combined technique of hot-dipping and plasma electrolytic oxidation. J. Alloys Compd. 2007, 430, 308–312. [Google Scholar] [CrossRef]
- Stojadinović, S.; Tadić, N.; Vasilić, R. Formation and characterization of ZnO films on zinc substrate by plasma electrolytic oxidation. Surf. Coatings Technol. 2016, 307, 650–657. [Google Scholar] [CrossRef]
- Rocca, E.; Veys-Renaux, D.; Guessoum, K. Electrochemical behavior of zinc in KOH media at high voltage: Micro-arc oxidation of zinc. J. Electroanal. Chem. 2015, 754, 125–132. [Google Scholar] [CrossRef]
- Bian, G.; Wang, L.; Wu, J.; Zheng, J.; Sun, H.; DaCosta, H. Effects of electrolytes on the growth behavior, microstructure and tribological properties of plasma electrolytic oxidation coatings on a ZA27 alloy. Surf. Coatings Technol. 2015, 277, 251–257. [Google Scholar] [CrossRef]
- Li, G.; Mao, Y.; Li, Z.; Wang, L.; DaCosta, H. Tribological and Corrosion Properties of Coatings Produced by Plasma Electrolytic Oxidation on the ZA27 Alloy. J. Mater. Eng. Perform. 2018, 27, 2298–2305. [Google Scholar] [CrossRef]
- Cerchier, P.; Pezzato, L.; Gennari, C.; Moschin, E.; Moro, I.; Dabalà, M. PEO coating containing copper: A promising anticorrosive and antifouling coating for seawater application of AA 7075. Surf. Coat. Technol. 2020, 393, 125774. [Google Scholar] [CrossRef]
- Saha, J.K. Corrosion of Constructional Steels in Marine and Industrial Environment; Springer: New Delhi, India, 2013; pp. 129–143. ISBN 978-81-322-0720-7. [Google Scholar]
- Clyne, T.W.; Troughton, S.C. A review of recent work on discharge characteristics during plasma electrolytic oxidation of various metals. Int. Mater. Rev. 2019, 64, 127–162. [Google Scholar] [CrossRef]
- Blawert, C.; Bala Srinivasan, P. Plasma Electrolytic Oxidation Treatment of Magnesium Alloys. In Surface Engineering of Light Alloys; Dong, H., Ed.; Woodhead Publishing Limited: Cambridge, UK, 2010. [Google Scholar]
- Guan, Y.; Xia, Y. Amorphus coatings deposited on aluminum alloy by plasma electrolytic oxidation. Trans. Nonferrous Met. Soc. China 2005, 15, 565–570. [Google Scholar]
- Troughton, S.C.; Nominé, A.; Dean, J.; Clyne, T.W. Effect of individual discharge cascades on the microstructure of plasma electrolytic oxidation coatings. Appl. Surf. Sci. 2016, 389, 260–269. [Google Scholar] [CrossRef]
- Erfanifar, E.; Aliofkhazraei, M.; Nabavi, H.F.; Sharifi, H.; Rouhaghdam, A.S. Growth kinetics and morphology of plasma electrolytic oxidation coating on aluminum. Mater. Chem. Phys. 2017, 185, 162–175. [Google Scholar] [CrossRef]
- Hussein, R.O.; Nie, X.; Northwood, D.O. An investigation of ceramic coating growth mechanisms in plasma electrolytic oxidation (PEO) processing. Electrochim. Acta 2013, 112, 111–119. [Google Scholar] [CrossRef]
- Al Bosta, M.M.S.; Ma, K.-J.; Chien, H.-H. The effect of MAO processing time on surface properties and low temperature infrared emissivity of ceramic coating on aluminium 6061 alloy. Infrared Phys. Technol. 2013, 60, 323–334. [Google Scholar] [CrossRef]
- Wu, H.L.; Cheng, Y.L.; Li, L.L.; Chen, Z.H.; Wang, H.M.; Zhang, Z. The anodization of ZK60 magnesium alloy in alkaline solution containing silicate and the corrosion properties of the anodized films. Appl. Surf. Sci. 2007, 253, 9387–9394. [Google Scholar] [CrossRef]
- Bala Srinivasan, P.; Liang, J.; Blawert, C.; Störmer, M.; Dietzel, W. Effect of current density on the microstructure and corrosion behaviour of plasma electrolytic oxidation treated AM50 magnesium alloy. Appl. Surf. Sci. 2009, 255, 4212–4218. [Google Scholar] [CrossRef]
© 2020 by the authors. Licensee MDPI, Basel, Switzerland. This article is an open access article distributed under the terms and conditions of the Creative Commons Attribution (CC BY) license (http://creativecommons.org/licenses/by/4.0/).