Article

Laser Cleaning Combined with Cladding Improves Cladding Quality for Repairing Steel Plates in Pressure Vessels

College of Mechanical and Electronic Engineering, China University of Petroleum, Qingdao 266580, China
*
Author to whom correspondence should be addressed.
Coatings 2024, 14(4), 508; https://doi.org/10.3390/coatings14040508
Submission received: 27 March 2024 / Revised: 13 April 2024 / Accepted: 16 April 2024 / Published: 19 April 2024
(This article belongs to the Special Issue Laser Surface Engineering: Technologies and Applications)

Abstract

:
Good-quality metallurgical bonding and a high degree of automation are critical for using laser cladding technology in on-site repairs. At present, most of the on-site repairs are carried out manually, which can bring about problems such as complicated operation procedures, uneven repair quality, and personnel injuries. In this study, a surface repair method that combined laser cleaning with cladding (LCC) was proposed. First, the plates were scanned with a high-frequency pulsed laser to remove the surface impurity layer. The surface was then coated with Inconel 625 powder while irradiated with a continuous laser for the cladding. Both the macro-morphology and microstructure of the surface were examined, and mechanical property tests were also conducted. The metallographic and scanning electron microscope images indicated that, compared to the manual polishing and laser cladding process, the LCC specimens had a better metallurgical bonding quality and a thicker clad layer. The average hardness of the clad layer on the LCC specimens was high at 256.47 HV, 36.2% higher than that of the Q345R substrate. Compared to the Q345R specimens of the same size, the LCC specimens showed an increased impact on the energy absorption, yield strength, and tensile strength. This study provides a new approach for improving the automation and cladding quality of on-site repairs.

1. Introduction

Q345R (GB713-2014) steel is the material most widely used for manufacturing pressure vessels in China [1]. Some pressure vessels made of Q345R, such as cyclone separators in natural gas yards, experience prolonged internal pulsating stress during use, leading to the formation of cracks on the surface of the entrance. Owing to the large volume of cyclone separators and their high replacement costs, these cracks need to be repaired during the production process to prolong the service life. Otherwise, permanent damage or even serious accidents can occur.
There is growing research on laser cladding technology for restoring metallic materials, because of its flexibility and ability to precisely control the energy input. Thanks to the high energy density and small spot diameter of the high-energy laser beam, the molten pool cools very quickly to enable small dendrites to form in the moulded material, resulting in a fine-grained and tough cladding layer with excellent mechanical properties on the surface of the workpiece [2]. Clare et al. [3] used laser cladding technology to repair worn railway materials and explored the optimal parameters in the repair process. Rashid et al. [4] studied the effect of different scanning paths on the mechanical properties of ultra-high strength 300 M steel laser claddings. They found that the tensile strength and plasticity of the specimens stretched longitudinally along the cladding direction were stronger than those stretched in other directions. In addition, Zhu et al. [5] constructed a mathematical model for the laser repair of the Invar alloy and verified it experimentally, revealing the mechanism by which the laser energy is partly reflected by the substrate and partly absorbed to melt the material and form a metallurgical bonding process.
Before the cladding experiments on the base material, the substrate surface needs to be treated to remove impurities. The most common method is polishing with sandpaper and then rinsing with anhydrous ethanol [6]. For more demanding specimens, the substrate was cleaned using ultrasound or other equipment. However, a study at the Yangqu Natural Gas Field Station (Shanxi Province, China) revealed that when repairing cracks at the operation site, the size of the repair target was too large. As shown in Figure 1, the shape of the repair surface was too complex to allow the pretreatments that are more suitable in a laboratory setting. In the common grinding method used by workers, the part to be repaired is polished using an angle grinder equipped with a grinding disc. However, the subsequent manual welding process is time-consuming and requires a high degree of expertise to achieve acceptable precision. Furthermore, the complex restoration process involves power and heat sources that pose safety hazards to the operator [7].
Laser cleaning is a non-contact surface treatment technology employing a high-energy laser beam to instantly vaporise rust and other impurities on metal surfaces [8]. It has been widely used in the industry to replace manual derusting. As early as the 1990s, Ashidate et al. [9] used an Nd:YAG laser to remove rust and paint from power transmission towers. Recently, Wang et al. [10] attempted to use laser cleaning to remove corrosive substances from severely corroded steel components, and proved that wet laser cleaning is feasible for such components. In built heritage conservation, laser cleaning can remove surface impurities [11]. Researchers have identified the suitable process parameters for the laser cleaning of different materials such as A3 steel [12] and aviation aluminium [13]. Laser cleaning has also been shown to improve the performance of the original workpiece. Wang et al. [14] explored the influence of a picosecond laser on the cleaning quality of 316L stainless steel and proved that the surface quality of the laser-cleaned samples was higher and the process was more effective compared with the traditional cleaning process.
Laser cladding is a promising strengthening and repair technique, but it can result in a low bond strength [15], high residual stress [16], and low toughness [17] due to the large difference in the material properties between the coating and substrate, as well as the use of a high-energy density heat source. An enhanced metallurgical bonding quality between the fused cladding layer and substrate has been achieved by preheating the substrate. Through numerical simulations and laser deposition experiments, Zhang et al. [18] revealed that preheating the substrate can regulate the laser deposition process. Ding et al. [19] prepared 12CrNi2 coatings on preheated Q460E substrates using laser cladding technology. Their experiments showed that an appropriate preheating temperature leads to specimens with good mechanical properties. He et al. [20] found that preheating the substrate can reduce the residual stress of clad specimens. Through numerical simulations and experiments, Qiu et al. [21] found that preheating an H13 steel substrate inhibited the development of cracks in the cladding layer.
Multiscale textures on the substrate surface may also improve the bond strength between the coating and substrate. Wang et al. [22] prepared isosceles trapezoidal grooves on 1045 substrates to improve the impact resistance and ultimate tensile strength after laser cladding. Zhan et al. [23] investigated the effect of different substrate surface textures on the bonding of the welded material to the substrate and found that the sinusoidal weave texture improved the coating adhesion. However, such multiscale textures are generally created using machine tools such as wire cutters, which makes their practical application complicated. Note that during laser cleaning to remove the surface rust layer, the high-energy pulsed laser also ablates and vaporises a small amount of the substrate to leave shallow thin grooves on the surface [24]. Zhu et al. [25] performed laser cleaning before welding a steel plate and found that laser cleaning significantly improved the tensile strength of the weld head location. Zhou et al. [26] performed the welding experiment and showed that the laser cleaning pre-treatment can effectively improve the welding quality.
Current laser cladding or other repair processes use equipment with a different energy source than the laser during the pretreatment of the plate. Changing equipment can complicate the process and increase the workload. By using the same equipment for the cleaning and cladding, the efficiency of on-site repairing can be greatly improved. Based on the information above, a surface repair method that combines laser cleaning with cladding (LCC) was used to repair rusted Q345R plates in this study. Experiments and simulations were carried out to investigate changes in the microstructure and mechanical properties of the material after the LCC process. The results were compared with those of the manual polishing and laser cladding (MPLC) process. Laser cleaning changed the surface morphology and tissue properties of the substrate, which, in turn, affected the mechanical properties of the clad specimens. Notably, the steps of laser cleaning and cladding can employ the same energy source, eliminating the need to switch equipment and simplifying the process flow. The laser cleaning process increases the temperature and roughness of the substrate plate and improves the bonding quality between the substrate and the cladding layer. At the same time, there is no manual pre-treatment in the operation of the LCC, which ensures the safety of workers. This LCC technology provides a basis for developing an automated laser cladding operation to repair pressure vessel plates in the field.

2. Materials and Methods

2.1. Materials

Painted Q345R steel plates for pressure vessels (10 mm in thickness) were exposed to an outdoor environment for three months. The rusted steel plates were then cut into two samples of different dimensions. One was 10 × 15 mm, which was used to determine the optimal laser cleaning process parameters, and the other was 60 × 60 mm for the cladding experiments. As shown in Figure 2a, the specimens consisted of an outer rust layer, an intermediate grey paint layer, and a steel substrate. Figure 2b shows the scanning electron microscopy (SEM) images of the cross section, indicating that the average thickness of the impurity layer was 30 μm. As can be seen from Figure 2c,d, the oxide layer on the surface of the specimen was loose and continuous.
Inconel 625 spherical powder was used as the cladding material in this study, because this nickel-based alloy is widely used in additives owing to its excellent corrosion resistance and mechanical properties. Table 1 and Table 2 list the chemical compositions of Q345R and Inconel 625.
The clad specimens were cut from the plates using electrical discharge machining (EDM). The dimensions of the specimens are shown in Figure 3. Prior to the test, a V-shaped slot was cut from the side where the impact was applied. Three tensile and three impact specimens were prepared for each experimental condition and cutting direction (LCC-X, LCC-Y, MPLC-X, and MPLC-Y).

2.2. Methods

The laser cleaning and cladding platform consists of six parts: a laser generation and transmission system, a coaxial powder feeding laser cladding head, a metal powder conveyor, a protective gas transmission system, a water cooling system, and a mechanical arm. The mechanisms of energy absorption and target ablation are completely different under different laser emission modes. The cooling system consisting of a cooler and pipes continuously circulates distilled water in the cooling line of the laser cladding head and re-cools the water to ensure a proper temperature range for the cladding head. The experimental platform is shown in Figure 4.

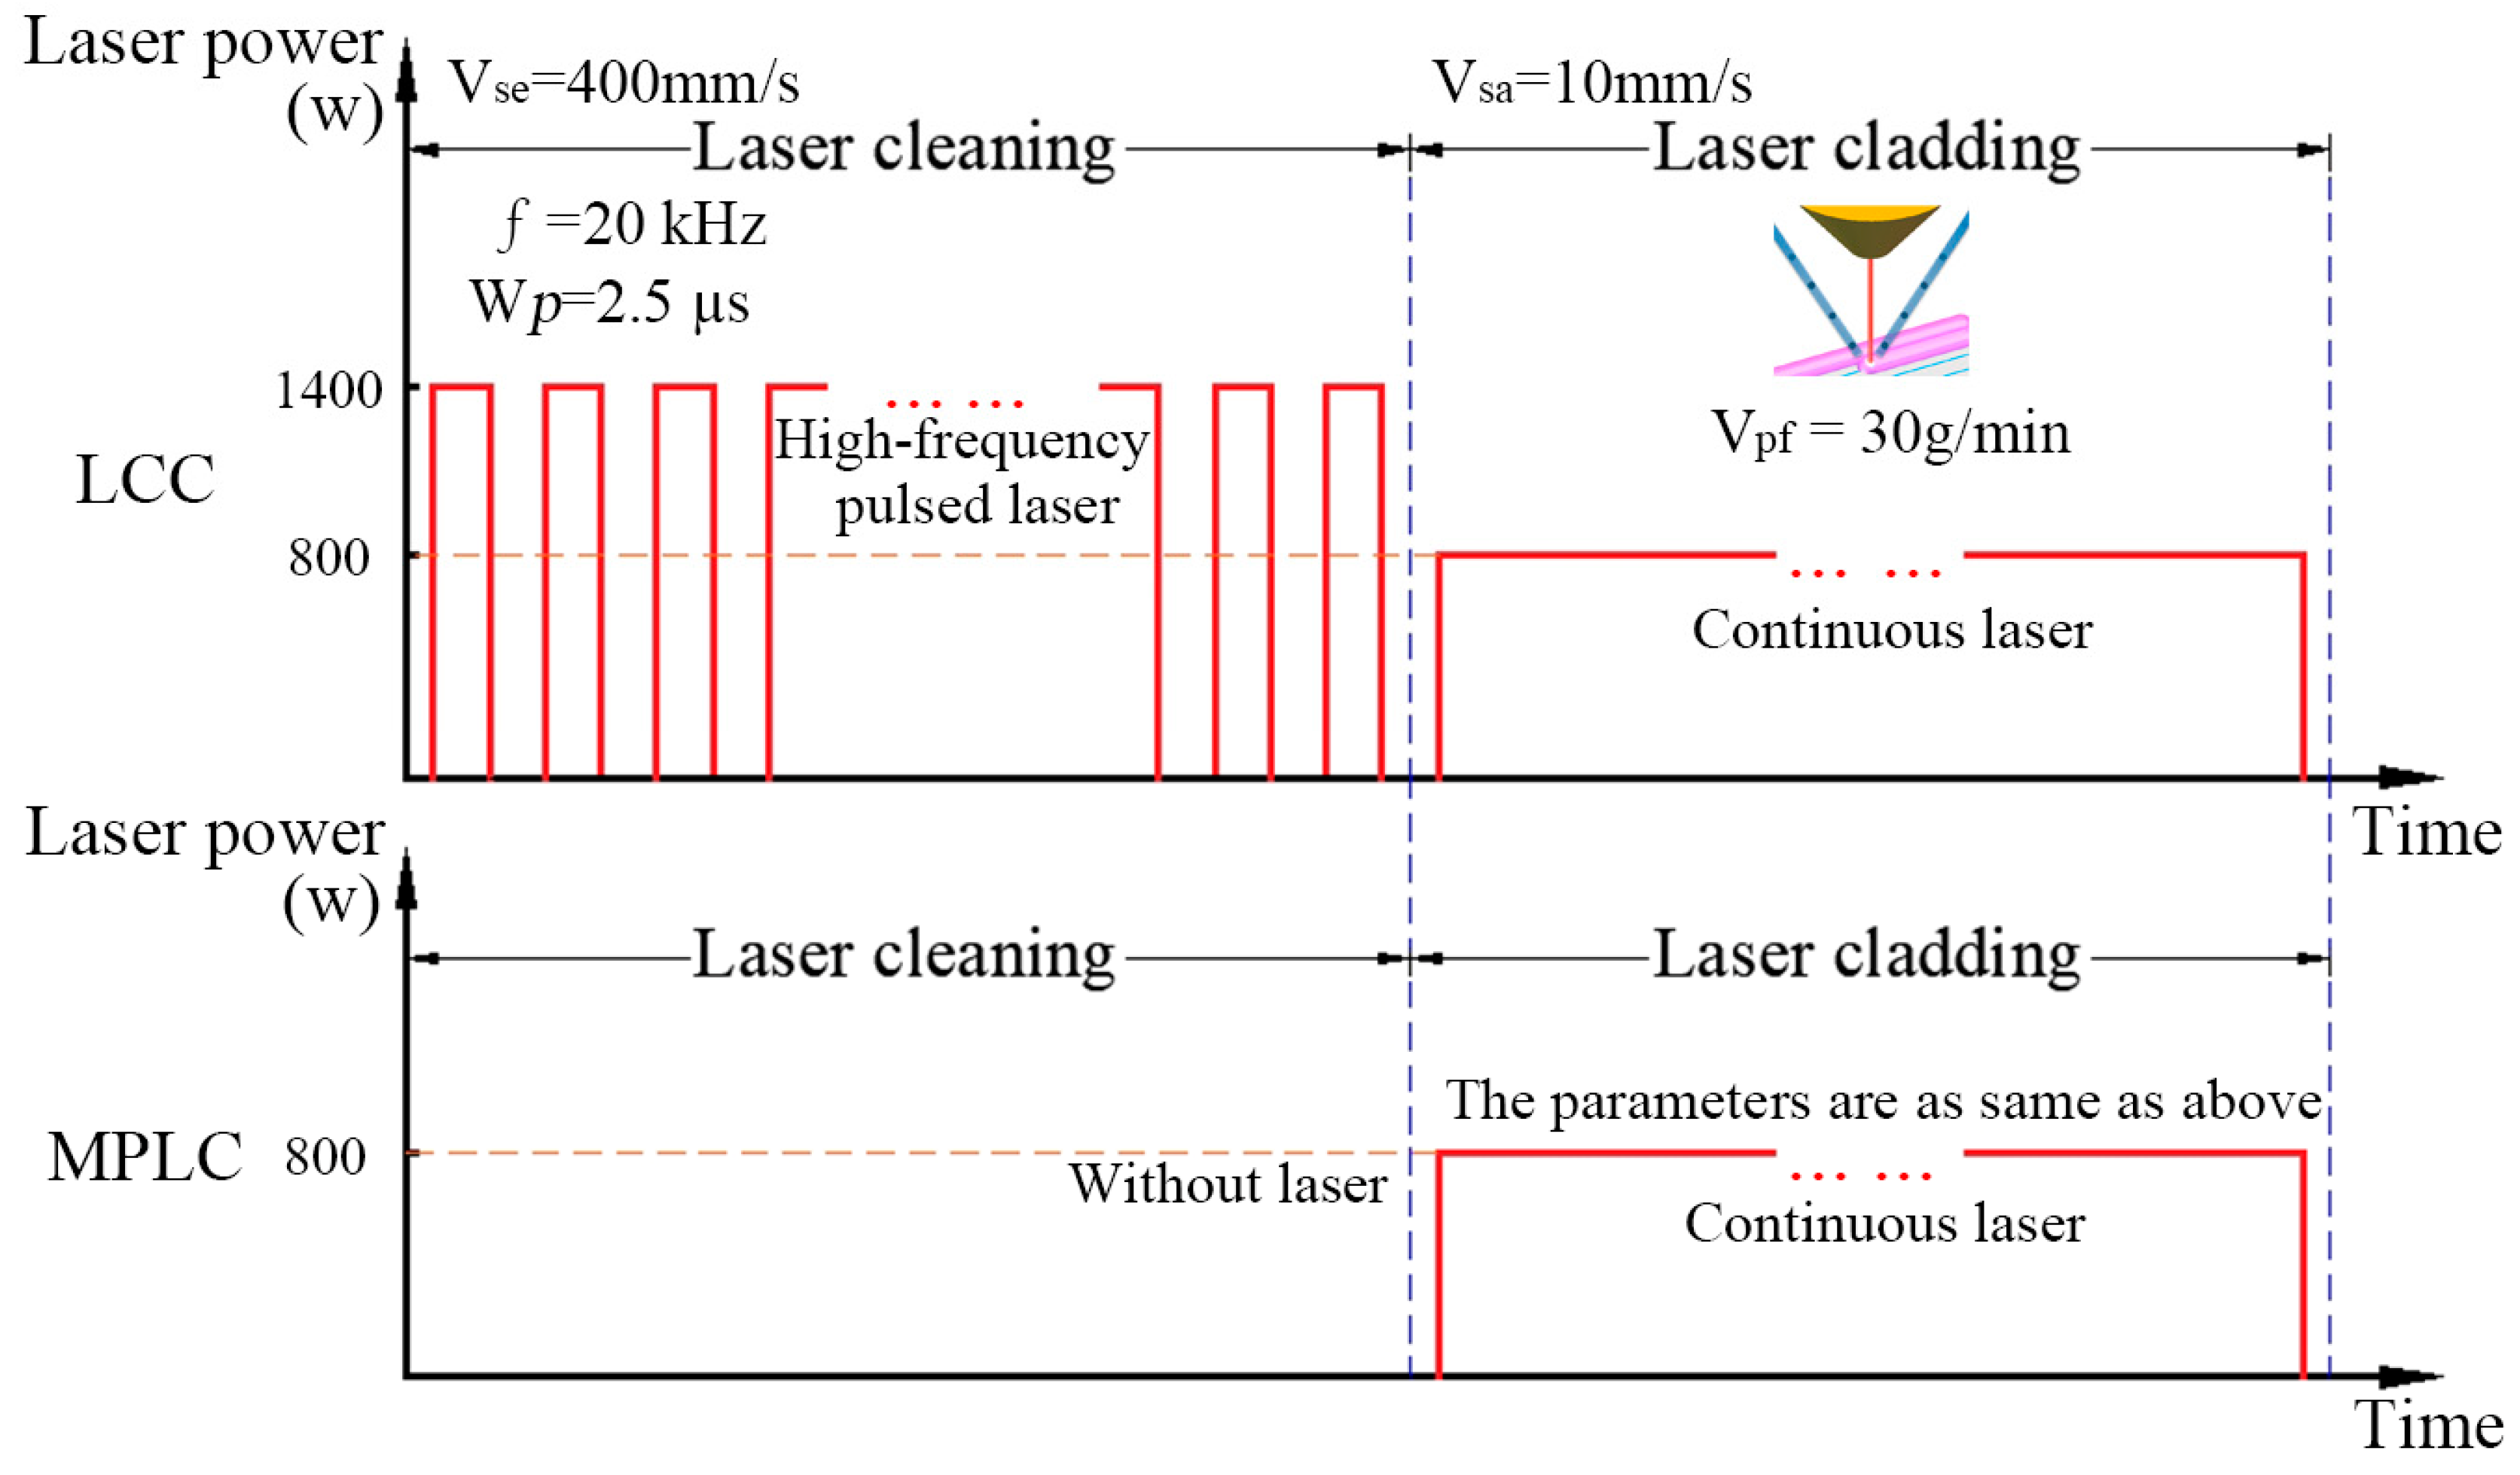
2.2.1. Optimisation of Laser Cleaning Parameters

Laser cleaning can be divided into dry and wet types. During the laser dry cleaning, the surface of the workpiece absorbs the laser energy and heats up quickly. Upon reaching its vaporisation temperature, the rust layer becomes volatile. Furthermore, rapid thermal expansion and the vaporisation process free the rust particles and a small amount of substrate from the surface. During the laser wet cleaning, a liquid or media film with a thickness of a few microns is deposited on the surface before the laser irradiation. Because the liquid has a low vaporisation temperature, it instantly gasifies at the solid–liquid junction to generate a large number of bubbles. The explosion of bubbles on the rust particles produces a strong impact that removes the particles from the substrate to achieve the removal of rust. Unfortunately, because most vessel plates are installed at an inclined or vertical orientation, it is difficult to deposit a liquid film on their surface. Therefore, in this study we used laser dry cleaning to remove rust from the surface of the steel plates.
As shown in Figure 5a, the laser cleaning was performed by moving a single laser spot progressively in alternating directions. The high-frequency pulsed laser could efficiently remove the impurity layer while minimising damage to the substrate. Specifically, the high-energy laser beam instantly ablates the rust layer, and the pulsed mode reduces the amount of irradiation received at a given point and, therefore, avoids excessive substrate removal. The optimal combination of the parameters was determined by designing an orthogonal experiment. The main factors, such as the laser power, laser scanning speed (Vse), and number of scans, were selected for the L25 (55) orthogonal experiments. The specific parameters are listed in Table 3. To minimise the laser damage to the metal beneath the impurity layer and to simultaneously increase the cleaning efficiency, the frequency of the laser cleaning process was set to 20 kHz and the pulse width was set to 2.5 μs. In addition, to ensure that the vaporised impurities were removed in time, the protective gas pressure was set to 0.5 MPa. Regarding the laser scanning path, a lap rate of 30% and a column offset of δ = 1.4 mm were used together with the fixed laser spot size in order to overlap adjacent irradiated areas and completely remove the impurity layer.
The three-dimensional morphologies and surface roughnesses of the samples were measured using a laser scanning confocal microscope (KC-X1000, Najing Kathmatic Co. Ltd., Najing, China). Three regions on each sample were randomly selected for testing, and the average of the three regions was used as the surface roughness value. The SEM (MERLIN Compart, ZEISS, Jena, Germany) with energy-dispersive X-ray spectrometry was used to analyse the microscopic morphology and surface elements of the samples and to determine the cleaning effect by comparing the oxygen contents of the samples. The parameters producing the best surface morphology (on the premise of minimizing the surface oxygen content, the roughness should be as high as possible) were used in the subsequent cladding experiments.

2.2.2. Characterisation of Material Properties

During the cladding process, the laser beam continuously irradiates the substrate to form a melt pool. A conveyor transports metal powder to the coaxial powder feeder in the cladding head, where the powder is metallurgically bonded to the substrate under the action of the high-energy laser. A protective gas is delivered to the melt area to prevent material oxidation at high temperatures and to apply a pressure to the powder feeder to ensure a continuous and uniform powder delivery. The pressure from the protective gas also helps to improve keyhole stability and thus minimises pore defects during the laser cladding process [27]. However, an excessive protective gas pressure can cause irregularities in the cladding profile. Similar to the cleaning process, the robotic arm drives the cladding head to scan the area to be repaired and completely covers it with the cladding material. A schematic of the cladding process is shown in Figure 5b.
Two groups of four substrates were prepared for the cladding experiments, with one substrate not subjected to cladding treatment for comparison. The first group of substrates was cleaned with a laser using the optimum parameters described in Section 2.2.1. The second group was sanded by skilled workers using an angle grinder equipped with a grinding disc, rinsed, and dried with anhydrous ethanol prior to the laser cladding. As shown in Figure 6, a K-type thermocouple was used during the laser cleaning and manual polishing with a data recorder (HIOKI, Nagano, Japan, LR8431-30) to obtain the substrate temperature. The cleaned substrate was then laser-clad.
The cladding experiments were performed using preselected process parameters suitable for cladding Inconel 625 powder on a Q345R substrate: a scanning speed of Vsa = 10 mm/s, a powder feeding rate of Vpf = 30 g/min, a laser power of 800 W, and a protective gas pressure of 0.2 MPa. Figure 7 shows a comparison of the laser parameters used in the cleaning and cladding steps.
Metallographic, impact and tensile specimens were prepared after cladding as shown in Figure 3. The metallographic specimens were then sanded and polished. One piece was chemically etched with aqua regia to observe the cladding layer, and the other piece was etched with nitric acid in alcohol to observe the heat-affected zone (HAZ) and substrate. A metallographic microscope (Imager.M2m, ZEISS) was used for the microstructural observations. The SEM (MERLIN Compart, ZEISS) was used for the microstructural observations and elemental analysis with an acceleration voltage of 15 kV in the secondary electron mode. The microhardness of the samples was measured using a microhardness tester (HV-1000) at an interval of 0.2 mm, a loading force of 300 g, and a loading time of 10 s. A universal material testing machine (WDW-50) was used to study the tensile properties at room temperature (25 °C) and a loading rate of 1 mm/min. In the tensile experiment, the original size was 4 mm × 3 mm, and the cross-sectional area was 12 mm2. A Charpy pendulum impact test was conducted to determine the impact resistance of the specimens at 25 °C. The average yield strength, ultimate tensile strength, elongation, and impact energy of the three specimens were considered. As shown in Appendix A, the influence of electric discharge wire cutting on the performance of the specimen was not considered.

3. Results and Discussion

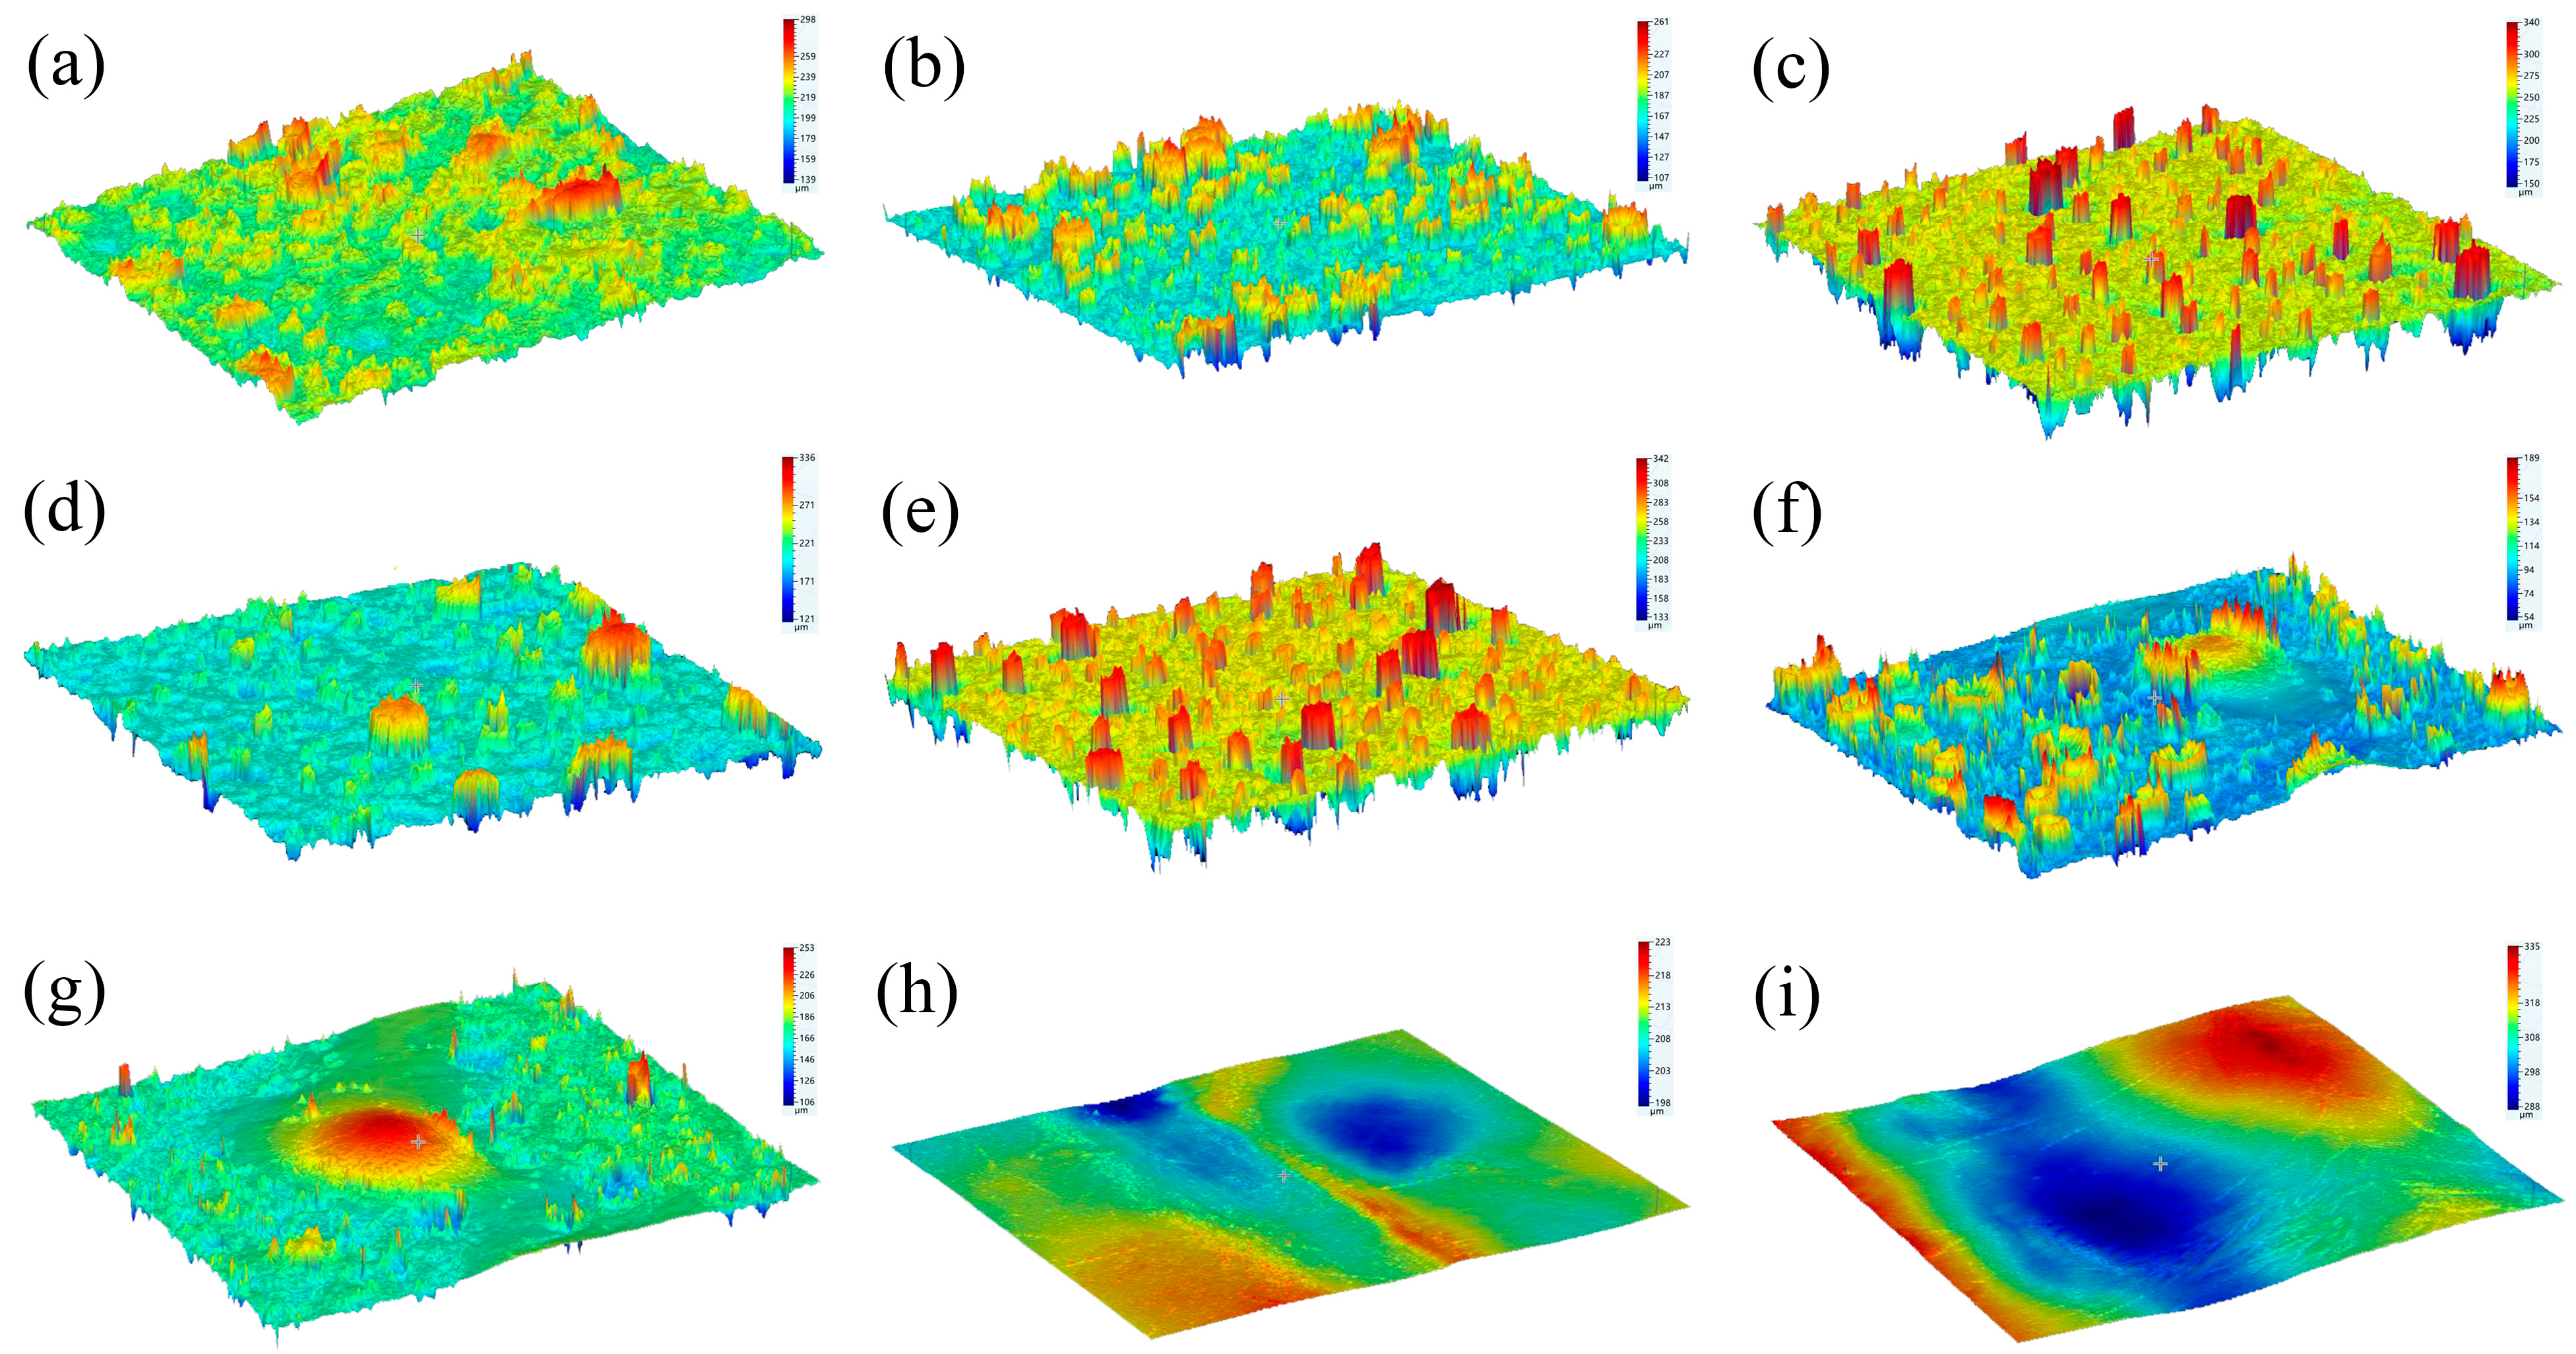
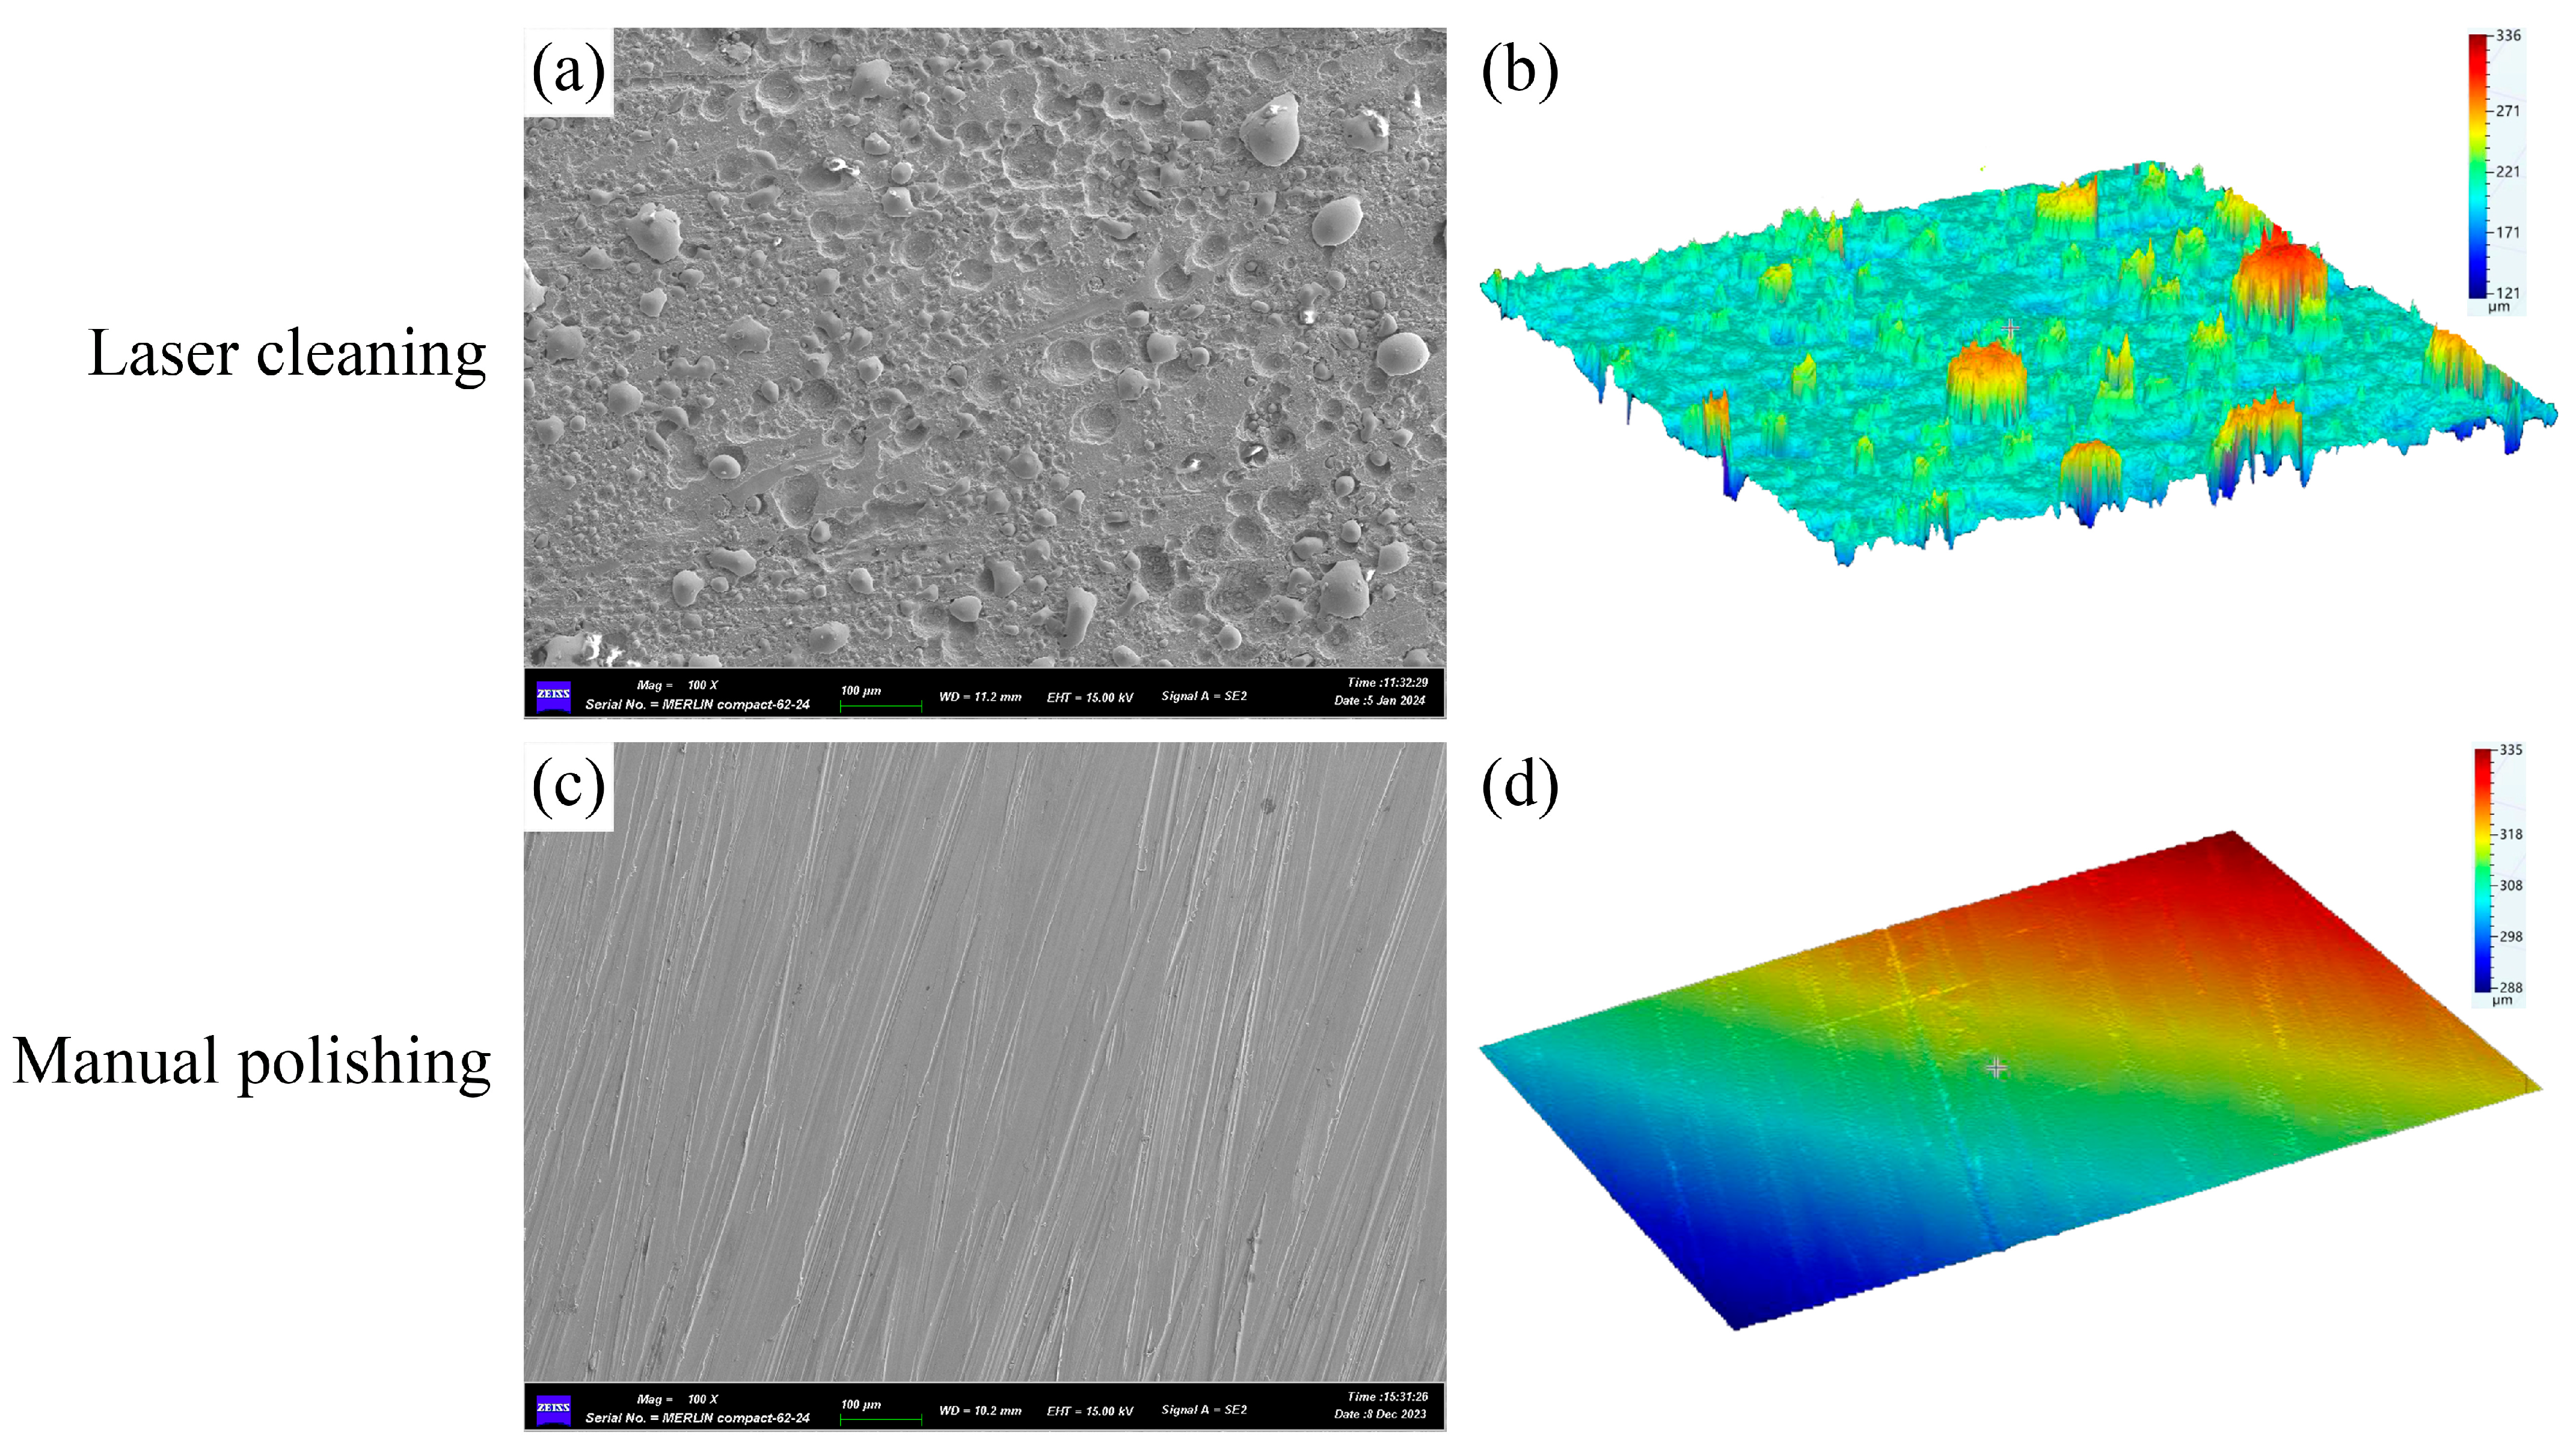
3.1. Surface Morphology after Cleaning

Figure 8 shows the macroscopic morphologies of the specimens after the laser cleaning at different laser powers, scanning speeds, and times. The cleaned specimens exhibited four rough surface states. (1) The surface morphology was flat with fewer residual impurities, as shown in Figure 8d,e,g,l. (2) The surface morphology was uneven, and black or white particles with laser scanning traces could be clearly observed, as shown in Figure 8a,b,h,m,r,x. (3) A partial remelting of the surface occurred, with many bright white particles remaining and a darker colour in some areas, as shown in Figure 8c,n,o,s,y. (4) The surface was remelted and oxidised, becoming darker in colour, as shown in Figure 8f,k,p,q,u,v.
Figure 9a shows that, with a laser power of 1400 W, under a single scan, the cleaning depth was insufficient, and some thicker impurities could not be removed. As the power and scanning frequency increased, the surface smoothness improved; however, some small particles remained on the surface, as shown in Figure 9b–e. Sample 7 contained fewer residual particles. Figure 9f,g show that, as the power was further increased, remelted particles appeared on the surface of the sample. When the sample reached 2000 W, a large area of remelting formed on the surface and the morphology became smoother.
Table 4 lists the results of the orthogonal experiments. The oxygen content was determined based on the percentage of the oxygen atoms. In the table, Ro and Rs represent the mean range of the oxygen contents and roughness obtained from the three factors: ro and rs represent the oxygen contents and the roughness was ranked according to the influence of these three factors. The influence of the factors on the oxygen content decreased in the following order: the scanning speed, laser power, and number of scans. The number of scans had a smaller effect on the oxygen content. The influence of the factors on the roughness decreased in the following order: the scanning speed, number of scans, and laser power. The flatter specimens had a lower oxygen content and a higher surface roughness (e.g., sample 7), because the laser removed the oxides from the surface of the metal and left uneven ablation marks. The larger remelted area had an elevated oxygen content and a low surface roughness (e.g., sample 21), because the substrate surface absorbed too much laser energy and melted; the laser position was moved and solidified; and the scanned area brightened, while the high energy caused the iron on the surface to oxidise again. As shown in Table 4, the percentage of the oxygen atoms in the specimens with severe remelting was close to that of Fe3O4 (57.1%).
As shown in Figure 10, the surface oxygen content decreased, increased, and finally stabilised with an increasing laser power over the range of experimental factors. At lower laser powers, the impurity layers could not be sufficiently ablated, because the laser ablation was weaker and thicker. As the laser power increased, remelting occurred on the surface, generating new oxides. When the scanning speed was low, the laser acted on each area for a long time, and the substrate remelted under the action of the laser energy for a long period of time, resulting in a high oxygen content. As the scanning speed increased, the laser irradiation time of the substrate decreased, the ablation of the impurity layer gradually became insufficient, and the oxygen content gradually increased.
The surface roughness of the cleaned substrate influenced the laser action on the subsequent cladding. The relationship between the reflectivity under laser irradiation (R) and the surface roughness (Sa) can be described by Equation (1) [25]:
R = R i exp [ ( 4 π S a λ ) 2 ]
where R i is the reflectivity of the ideal smooth Q345R surface for the laser and λ is the laser wavelength, which is a fixed value. According to Equation (1), a larger Sa value leads to a lower laser reflectance. The roughness of the specimen surface could be improved by fully absorbing the cladding laser. Combining this with Figure 10 and Figure 11 of the orthogonal experimental analysis, to ensure that the oxygen content of the cleaning of the specimen’s surface was as low as possible, a laser power of 1400 W and a scanning speed of 400 mm/s should be selected, and to ensure a high degree of roughness, the number of scans should be 2.
Figure 12 compares the surface morphologies of the samples after the laser cleaning and manual polishing using the optimal process conditions. Compared with laser cleaning, the surface after manual polishing is smoother, with residual scratches caused by particle cutting. The measured roughness of the laser-cleaned specimen was 14.22, and the roughness of the manually polished specimen was 7.09.

3.2. Microstructural Analysis

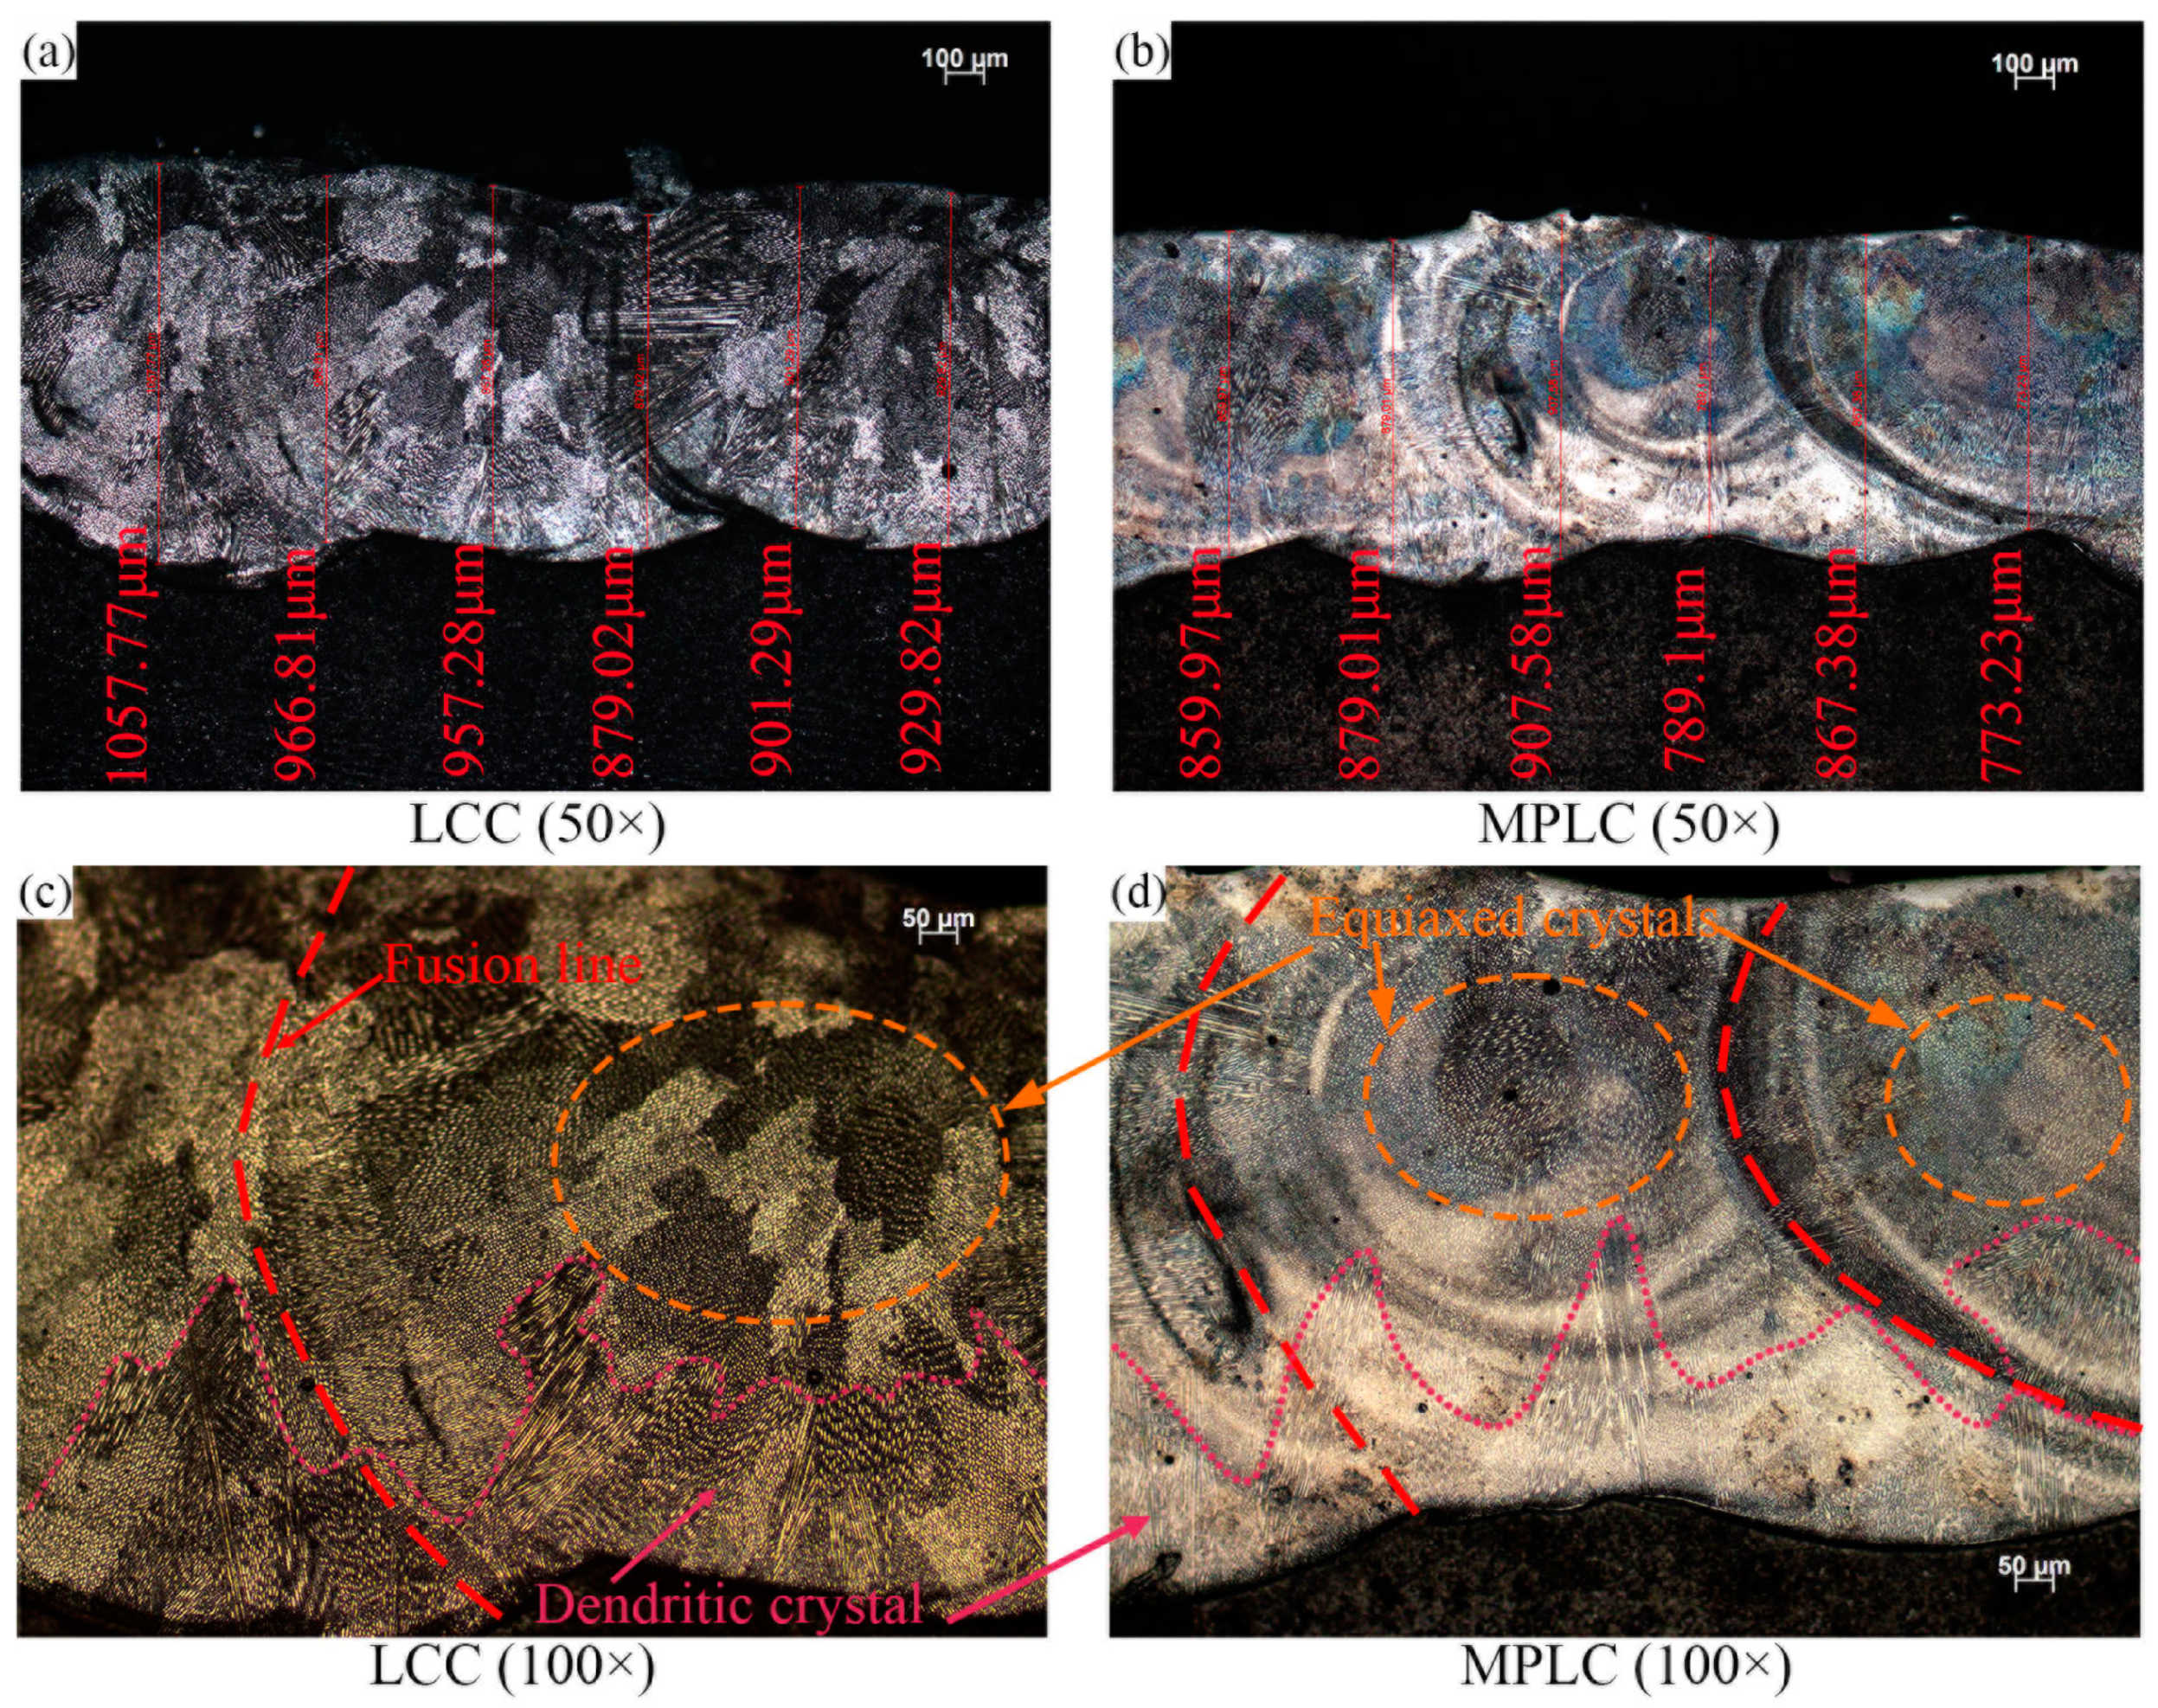
3.2.1. Microstructure of Cladding Layer

Figure 13 shows metallographic images of the LCC and MPLC specimens (Image acquisition: Axio Vision, Zeiss, Jena, Germany). Six positions were randomly selected to measure the thickness of the cladding layer to calculate the average thickness. The average thickness of the cladding layer was 948.7 μm for the LCC specimen and 846 μm for the MPLC specimen, as determined by the measurement software. This indicates that, compared to manual polishing, cleaning with a pulsed laser can allow more Inconel 625 powder to melt during the subsequent laser cladding step. As shown in Figure 13c,d, the bottom of the clad layer is a dendritic crystal growing upward in the direction of the heat flow, whereas the middle of the layer is a cellular structure consisting of small grains of equiaxed crystals. In addition, columnar crystal growth occurred at the lap of two cladding layers, because this is where the cladding material was thermally remelted and the grains grew again in the direction of the new cladding heat flow.
Figure 14a–e show SEM cross-sectional images of the specimens cut along the Y-direction. The cladding layer prepared using the LCC was less porous than that prepared using the MPLC. The former exhibited a clear white bright band at the gap between the clad layer and the substrate, suggesting a better bonding effect. In contrast, the MPLC process produced larger voids in some gaps. Such voids tend to develop into larger cracks under practical conditions and decrease the cladding layer performance [28].
Figure 14f,g show the SEM images of the specimens cut in the laser scanning direction (the X-direction). The fusion line in the MPLC specimen was wavy and contained more unfused voids, whereas that in the LCC specimen was flatter and exhibited a higher bonding quality. After the laser cleaning and preheating, the cracks at the fusion line along the X-direction almost disappeared [29]. The manually cleaned substrate had a low temperature, and the laser beam heated both the powder and part of the substrate to melt it. The substrate was heated from very cold to very hot during the cladding. The powder formed a melt pool that progressively advanced in the direction of the laser scan, with wavy fusion lines observed in Figure 14g in the longitudinal section. Small holes were present in the lower part of the clad layer, which was due to the keyhole effect during the laser cladding [30]. The presence of voids at the bottom of the clad layer indicated that the new melt pool was not fully fused with the old pool before laser irradiation. The resultant voids in the clad layer were observed in the SEM images of the cross sections, both perpendicular and parallel to the laser scanning direction.
During the laser cladding, some of the generated heat was used to melt the Inconel 625 powder to form a metallurgical bond with the substrate, whereas some of the laser energy was reflected. Therefore, the rough surface created by the laser cleaning absorbed significantly more laser energy and melted the substrate and powder more effectively than the smooth surface created by the manual polishing, resulting in a denser cladding layer.
In addition, the temperature rise curve of the substrate obtained during the laser cleaning, using the data recorder in Figure 15a, indicated that the substrate was preheated at the end of the cleaning process, and the substrate temperature reached 136 °C before the cladding.
During the laser cleaning, a high-energy laser beam ablated and vaporised the rust layer. Simultaneously, the substrate absorbed the excess laser energy and was thus preheated. Such preheating is known to change the defect type in specimens from a mixture of microcracks and small holes to a single type of small holes [31]. In contrast, the temperature of the manual polishing process only slightly increased. As shown in Figure 15b, the substrate temperature after polishing is about 46.4 °C, which is not sufficient to affect the subsequent cladding.
The quality of the cladding layer and the bonding effect with the substrate were better after the LCC process than those after the MPLC process, with fewer pores and voids in the cladding layer. This is mainly due to two reasons. (1) Laser cleaning makes the surface rougher and therefore increases the absorption rate of the laser irradiation by the substrate. (2) Laser cleaning also preheats the substrate and reduces the temperature gradient and cooling rate of the composite coating [32], which inhibits the formation of pores and cracks and reduces defects in the cladding layer.

3.2.2. Microstructure of HAZ

Figure 16 shows micrographs of the HAZ for the LCC and MPLC specimens cut in the X-direction. Figure 16a shows the clad layer, HAZ, and substrate from the top to the bottom. Six positions were randomly selected to measure the depth of the HAZ to calculate the average depth. The average depth of the HAZ is approximately 675 μm for the LCC specimen and 629 μm for the MPLC specimen. Because the LCC specimen underwent an additional laser scanning step compared to the MPLC specimen, the HAZ of the substrate increased in thickness. Figure 16d shows that white streaks of ferrite and black pearlite were observed in the substrate area. Figure 16c shows that streaks of ferrite and a transformation to a Widmanstätten structure by heat treatment were observed at the bottom of the HAZ. Figure 16b–e illustrate that the material was completely transformed into an acicular Widmanstätten structure at the top of the HAZ. The laser scanning caused quenching in the substrate, which increased its hardness. The presence of the Widmanstätten structure also led to a reduction in toughness.
During the laser cladding, some of the generated heat was used to melt the Inconel 625 powder to form a metallurgical bond with the substrate, whereas some of the laser energy was reflected. Therefore, the rough surface created by the laser cleaning absorbed significantly more laser energy and melted the substrate and powder more effectively than the smooth surface created by the manual polishing, resulting in a denser cladding layer.

3.3. Microstructural Analysis

3.3.1. Microhardness Distributions

Microhardness tests were performed on sections of the metallographic specimens to determine the effects of the LCC process on the hardness distribution. As shown in Figure 17a, two paths were selected for each specimen for microhardness testing. Path L1 passes through the area where the two cladding layers overlap, whereas Path L2 is parallel to L1 but passes through the middle of a single cladding layer. Test points were taken along each path at 0.2 mm intervals. Figure 17b shows the microhardness values of the specimens in the Z-direction from the substrate to the surface of the cladding layer. Using the fusion line between the cladding and substrate as a reference, the points above and below it are indicated by positive and negative distances, respectively. The hardness of each specimen tends to first increase and then decrease along the upward test path. The Q345R substrate has a hardness ranging from 185 to 192 HV, and it exceeded 230 HV in the HAZ. The hardness of the clad layer ranges from 240 to 286 HV. Overall, the hardness of the Inconel 625 clad layer is more than 30% higher than that of the Q345R substrate.
This gradual increase in hardness from the substrate to the HAZ is due to the rapid increase and decrease in the substrate temperature during the laser scanning, which causes quenching of the substrate tissue near the upper part. The tissue was transformed from the original pearlite ferrite to a Widmanstätten structure with a high hardness. Figure 17b shows that the HAZ of the LCC specimen has a significantly higher microhardness than that of the MPLC specimen. In addition, the increase in the hardness from the substrate to the HAZ is faster compared to the MPLC, because, during the LCC, the substrate undergoes an additional laser scan, resulting in a larger HAZ and the generation of more of a Widmanstätten structure. In the same specimen, the hardness of the HAZ was higher on path L1 than that on path L2, because the former area was affected by two laser scans while the latter area was subjected to an additional quenching treatment. When moving from the HAZ into the cladding layer, all specimens showed a significant drop in hardness, although this value remained significantly higher than that of the substrate.

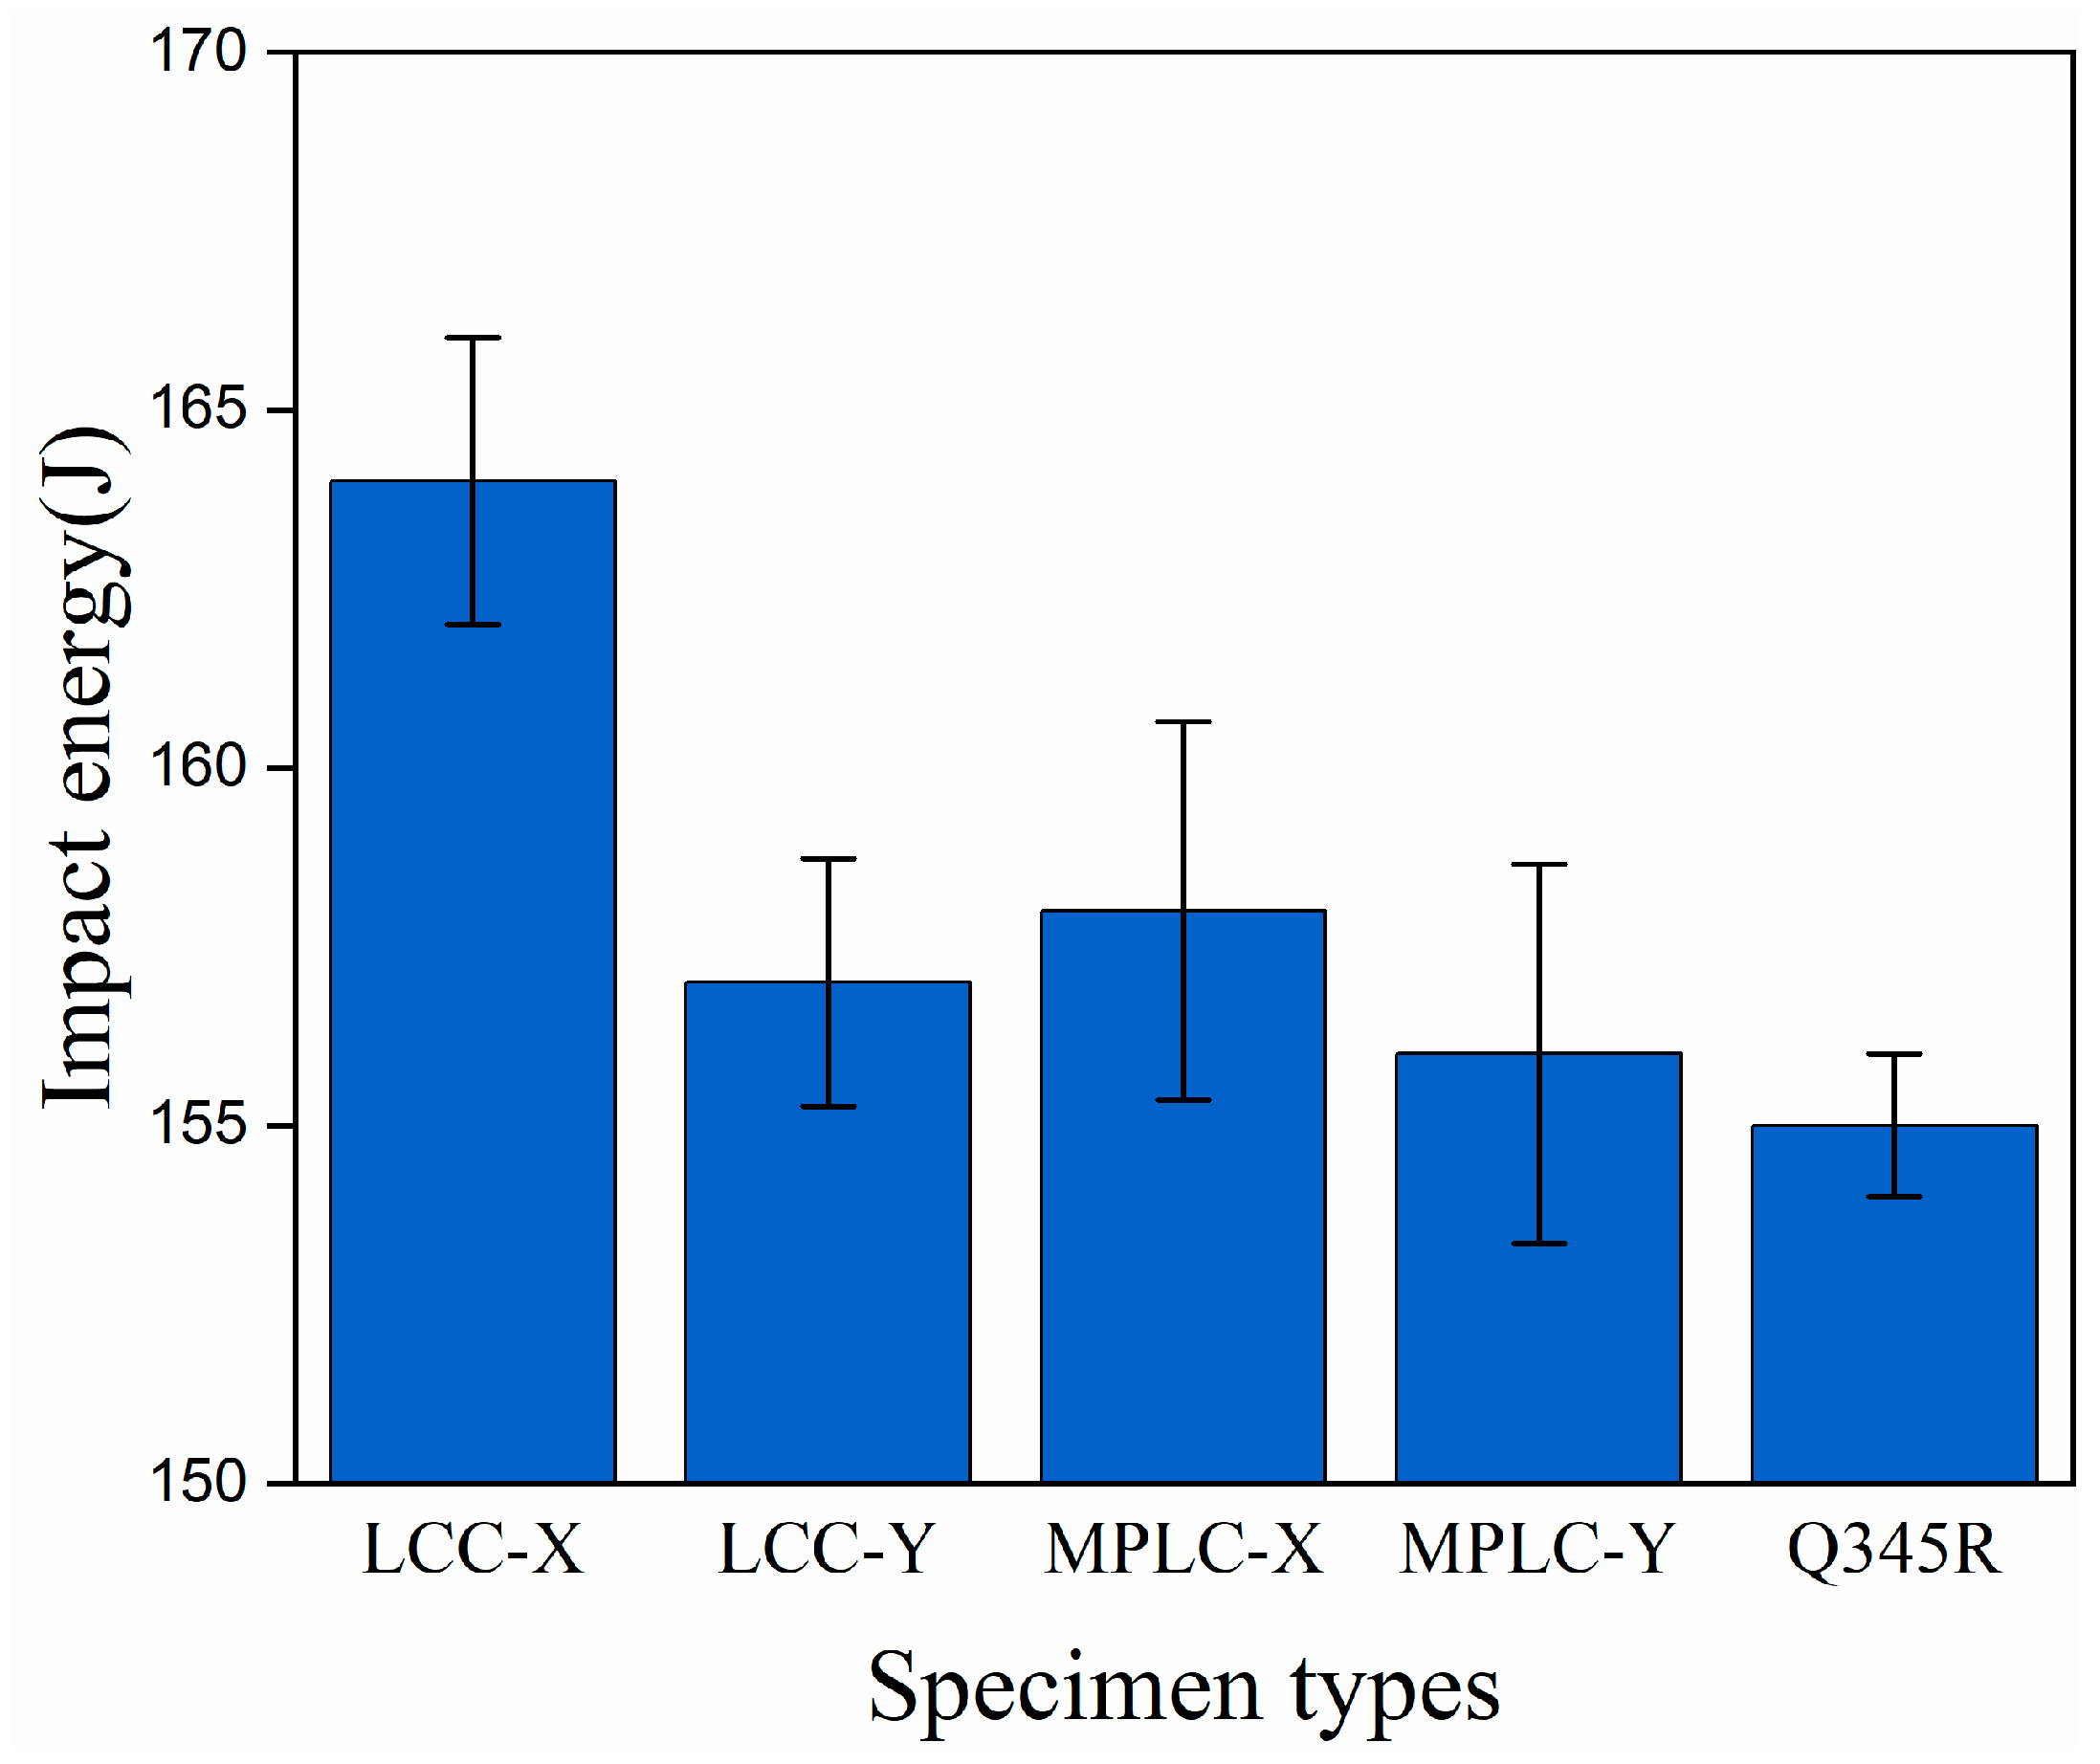
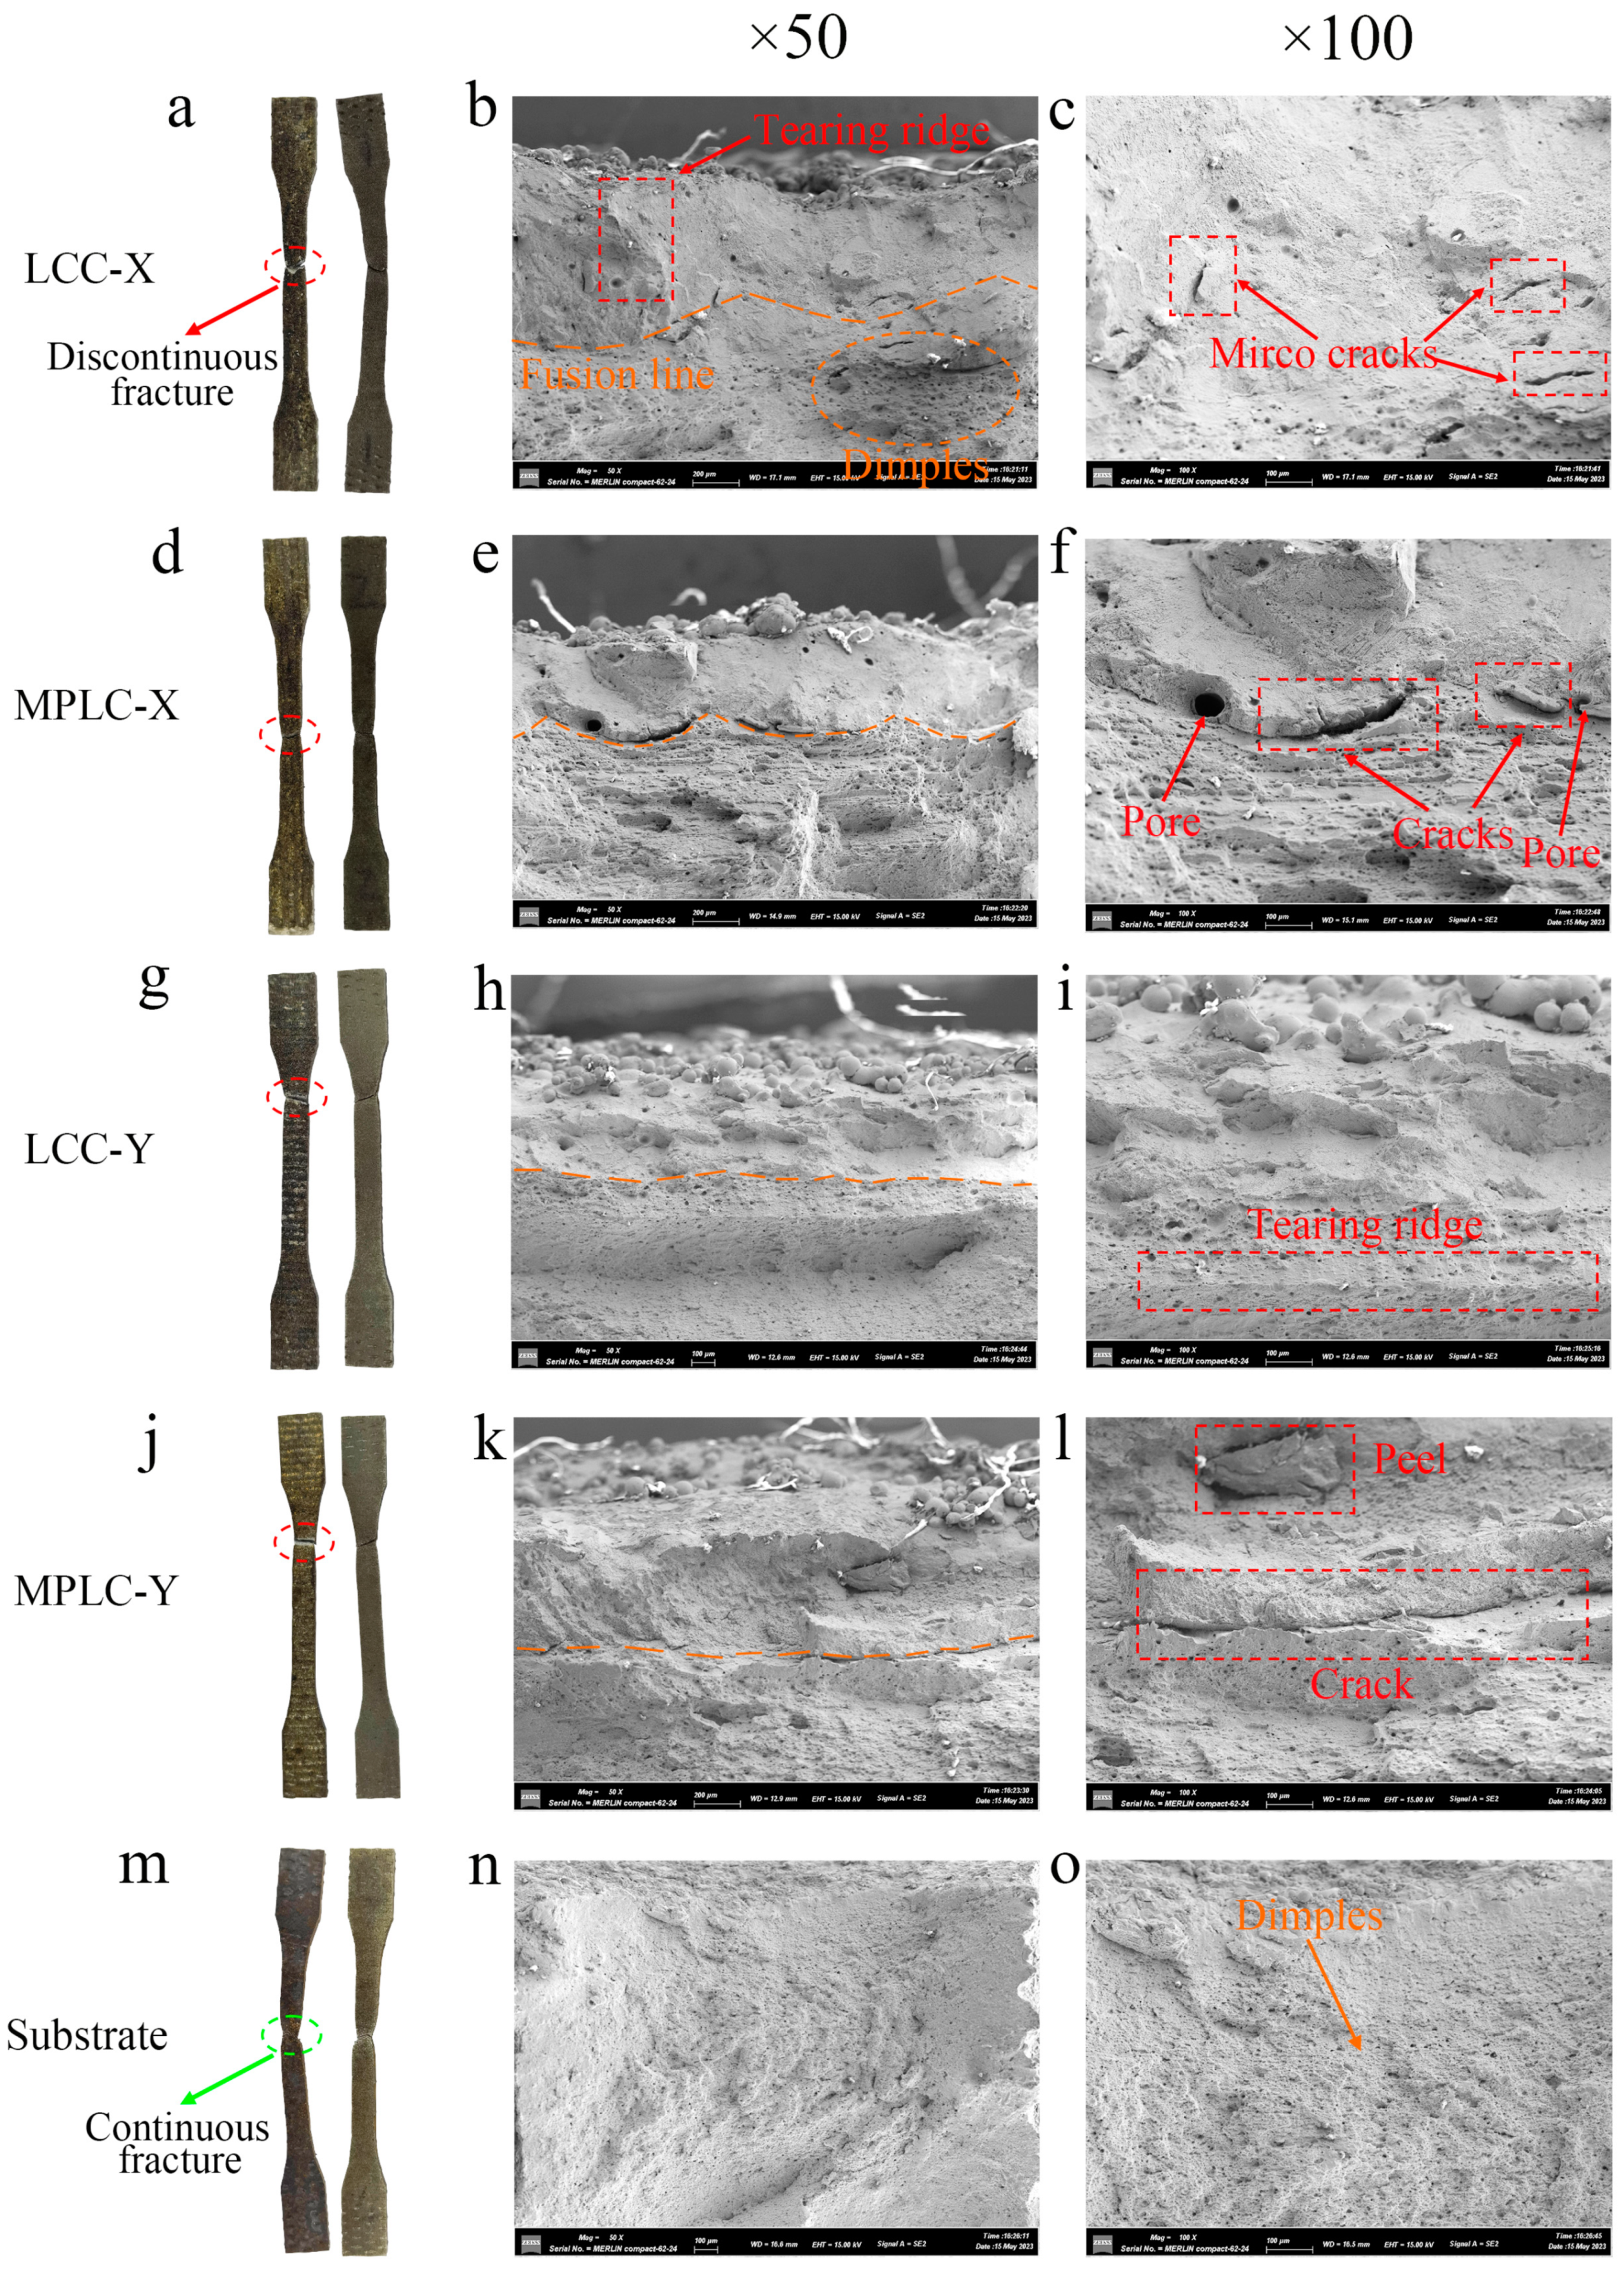
3.3.2. Charpy Impact Tests

As shown in Figure 7, specimens cut along the X-direction (LCC-X and MPLC-X), and the Y-direction (LCC-Y and MPLC-Y) were prepared for Charpy pendulum impact tests. The experimental results are shown in Table 5 and Figure 18.
According to the results in Figure 18, the LCC process achieved a maximum impact on the energy absorption of 164 J when the impact was applied perpendicular to the direction of the laser scans during the cladding. This value is 5.8% higher than that of the rusted Q345R substrate. Moreover, all other clad specimens showed a slightly higher impact on the energy absorption than the substrate. Specifically, the LCC-Y specimen cut along the Y-direction absorbed 157 J of impact energy, merely 2 J higher than that of the substrate. This can be attributed to the following factors.
(1)
The LCC process left fewer defects in the microstructure of the clad layer than the MPLC process (Figure 14), thereby enhancing the resistance to impact loads. Consequently, the LCC specimen demonstrated a superior impact on the energy absorption compared to other specimens cut in the same direction.
(2)
The cracks tend to propagate parallel to the Y-direction (i.e., the scanning direction during the laser cladding). The location of the cladding overlap acted as a stress concentration area, and the residual stresses were parallel to the Y-direction. Therefore, among the specimens processed under the same conditions, those cut along the X-direction exhibited a higher impact on the energy absorption.
(3)
Due to the use of two laser scans, the LCC specimens should exhibit enhanced hardness and reduced plasticity at overlapping locations within the HAZ of the clad layer.
Figure 19 shows the morphology of the impact fracture observed using the SEM. From Figure 19a,d,g,j,m, all specimens exhibited a significant deformation at the top and bottom of the fracture, indicating that there was an overall ductile fracture characteristic due to extrusion deformation during impact. The fracture mechanism of the fused layer is significantly different from that of the substrate. As shown in Figure 19b, high-density dimples were clearly observed on the substrate, indicating that the substrate had a ductile fracture mechanism. In contrast, Figure 19c shows the cladding layers had rougher cross sections and multiple fold-like tearing edges, indicating a brittle fracture mechanism. At the same laser power, the temperature gradient created in the Inconel 625 powder was less in the LCC specimen than that in the MPLC specimen, which reduced the poles and cracks in the cladding layer [33] and enhanced the impact toughness of the LCC specimen.
The HAZ of the specimens cut along the Y-direction exhibited a fracture shape significantly different from that of the substrate. Figure 19g,j show that the fracture of the specimens cut in the Y-direction occurred along the lap line of the cladding layer. Figure 19i reveals a significant tearing ridge in the HAZ of LCC-Y, indicating a lower toughness of the HAZ. Figure 19l shows the MPLC-Y specimen with many peels at the fusion site of the clad layer and substrate, as well as a step-like tear in the HAZ. Owing to the presence of the fusion line cracks along the Y-axis of the clad specimen, the cracks did not have sufficient time to gradually expand under a rapid impact, and many peels were generated instantaneously as a result. The specimens containing a clad layer absorbed more impact energy than the substrate. However, considering the high hardness of the HAZ at the lap position and the reduced plasticity, the overall impact performance of the LCC specimens cut along the Y-direction was not significantly better than that of the substrate.

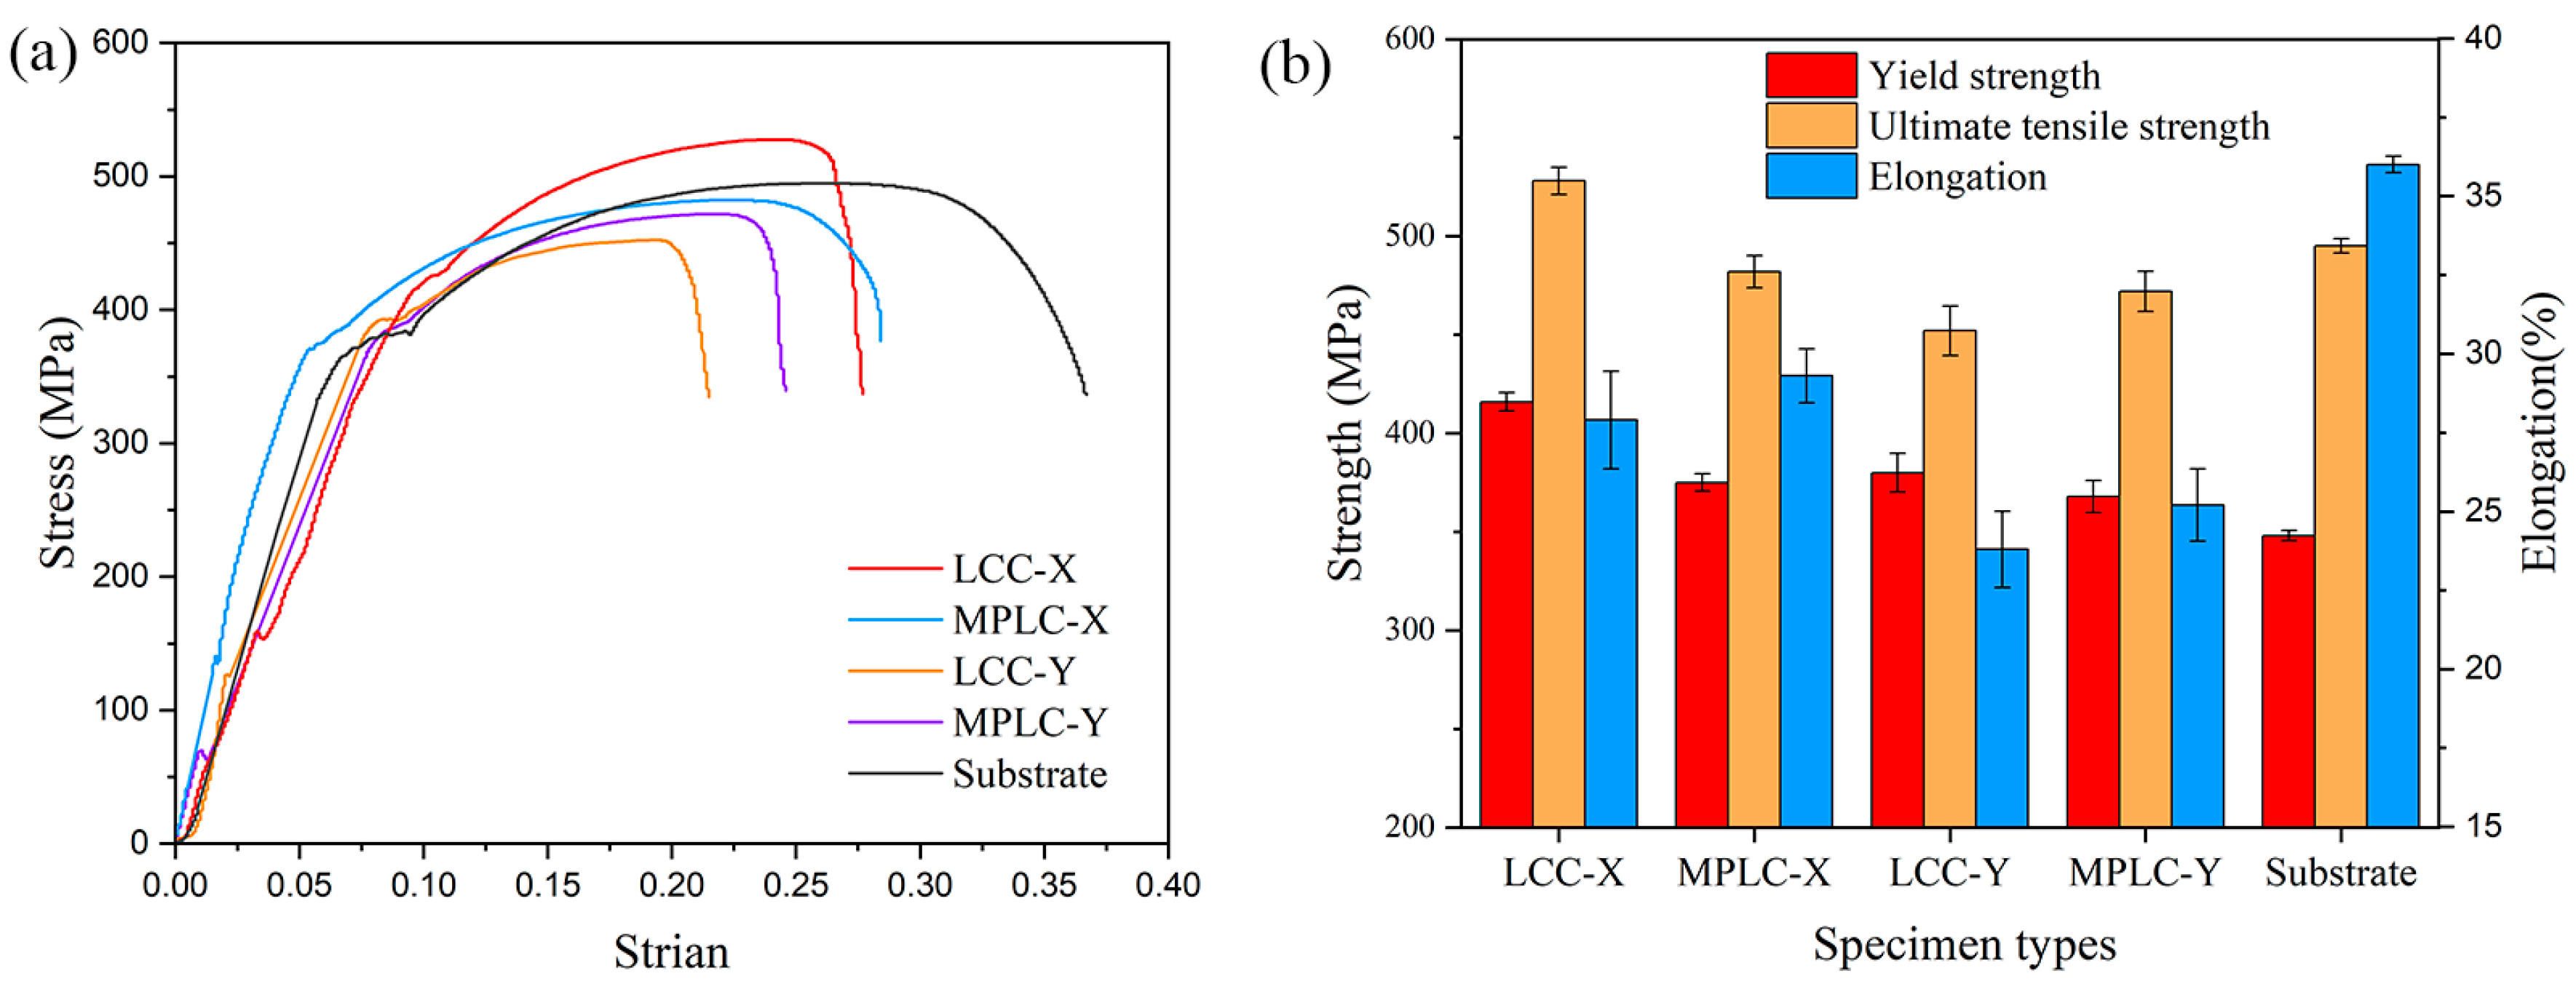
3.3.3. Tensile Testing Results

Table 6 and Figure 20 show the results of the tensile tests. The yield strength of the substrate was 348 MPa, and its tensile strength was 495 MPa. When the tensile direction was parallel to the cladding direction, the yield strength of the MPLC specimens was 375 MPa and their tensile strength was 482 MPa. The corresponding values for the LCC specimens were 416 and 528 MPa. The LCC specimens exhibited a superior performance compared to the MPLC ones, with a 19.5% increase in the yield strength and 6.6% increase in the tensile strength compared to the substrate. When the tensile direction was perpendicular to the cladding direction, the yield strength of the MPLC specimens was 368 MPa and their tensile strength was 472 MPa, while the corresponding values for the LCC specimens were 380 and 452 MPa. The yield strengths of the specimens containing a cladding layer were higher than that of the substrate, indicating a protective effect of the cladding layer on the substrate material.
Figure 20a reveals three stages during the tensile tests for the specimens containing a cladding layer. In the early elastic phase, the harder Inconel 625 cladding layer deforms elastically with the Q345R substrate and accommodates the same strain. However, the harder cladding layer carries a large portion of the load. Because the cladding layer is thinner than the substrate, the yield point at the beginning of the tensile phase indicates that the cladding layer enters the yielding phase, and the cladding layer starts to deform plastically. Meanwhile, the Q345R remains in the elastic deformation phase until the cladding layer fractures. In the second stage, the substrate continues to be stressed after the cladding layer fractures and reaches its own yield limit. In the third stage, the substrate material begins to deform plastically until it also fractures. Because the harder cladding layer shares a part of the load with the substrate, the final yield strength of the specimen with a cladding layer is higher than that of the substrate specimen.
According to Figure 20b, all specimens with a cladding layer have a lower elongation than the substrate, which displays the largest elongation of 36%. Because the fracture of the cladding layer occurred after the pre-yield point, the clad specimens actually bore the subsequent load using a thinner substrate than the pure substrate specimens, and, thus, the fracture occurred earlier. Among the specimens cut along different directions, the LCC specimens showed a lower elongation than the MPLC specimens, because the cladding layer was thicker in the former. The fracture of the specimens cut in the Y-direction occurred at the lap position of the two cladding layers, which were harder and less plastic than the specimens cut in the X-direction, resulting in an earlier fracture and a lower elongation.
Figure 21 shows the macroscopic and SEM images of the tensile fractures. When the broken specimen was spliced together, a discontinuous fracture appeared in the cladding layer but no such discontinuity was observed in the fractured substrate specimen. This indicates that fracture of the cladding layer and substrate is not continuous, and it corresponds to the phenomenon of pre-yielding in the curve of Figure 19a. The SEM images show that the fractured substrate contained high-density dimples, which exhibited evident ductile fracture characteristics. In contrast to the fractured substrate, Figure 15b shows many tearing ridges were observed in the fractured cladding layer, indicating partial brittle fracture characteristics.
Figure 21c,f show that many cracks developed at the bond between the cladding layer and substrate in the tensile specimen cut along the X-direction. The cracks in the MPLC specimens were significantly larger than those in the LCC specimens. In addition, larger holes were observed in the MPLC specimens. This is due to some original cracks at the bond between the cladding layer and substrate in those specimens, which gradually expanded into larger cracks, as well as due to pores that developed into larger holes under slow tensile action. In contrast, the LCC specimens were preheated after the laser cleaning step, and the cladding layer formed a better metallurgical bond with the substrate during melting with fewer original cracks; thus, no larger cracks appeared. As shown in Figure 19, the LCC-X has a higher yield and tensile strength than the MPLC-X.
Figure 21i,l show that brittle fracture characteristics appeared below the fusion line of the tensile specimens cut along the Y-direction. As shown in Figure 21i, the apparent tearing ridge below the fusion line of the LCC specimen was caused by the formation of numerous Widmanstätten structures in the HAZ, resulting in decreased hardness and toughness. Figure 21l shows that the MPLC specimen exhibited original cracks at the bond, which gradually expanded into long cracks under slow tension. The MPLC specimens contained more pores in the cladding layer and were more likely to produce peel when the impact cracking occurred.

3.4. Analysis of Process Flow

As shown in Figure 22, the MPLC process requires six steps from the entry of the worker to the completion of the final laser cladding, whereas the LCC process requires only three steps. During the manual polishing, the worker faces potential electric shocks, falls, and mechanical injuries. Because the rapidly rotating shuttering wheels will leave some SiO2 particles on the substrate surface, rinsing with anhydrous ethanol is necessary after the grinding to minimise the impurities in the cladding layer. Although the polishing process also preheated the substrate to a small extent, this is partially cancelled by the rinsing step. Moreover, halfway through the MPLC process, one has to switch from manual polishing to laser cladding, while the LCC process can use the laser throughout. After the substrate surface was heated by the pulsed laser cleaning, the laser was immediately switched to the continuous mode for the cladding. The laser cladding head is driven by a manipulator throughout the entire LCC process, without the need for manual intervention. Compared to the MPLC, the LCC effectively reduces the process flow, makes full use of the laser energy, eliminates the need to manually change equipment, and enhances personnel safety.

4. Conclusions

A method for repairing the surface of pressure vessel plates was developed by combining a high-frequency pulsed laser to remove impurities and a continuous laser to melt the metal powder for the cladding. The experiments were performed on Q345R steel plates to identify the optimal laser process parameters. The specimens treated using the proposed LCC and MPLC processes were compared. The main results are as follows:
(1)
During laser cleaning, a high-frequency pulsed laser impinged on the substrate surface to remove impurities, and the liberated particles were removed by the protective gas. Under fixed laser conditions, a laser power of 1400 W, a scanning speed of 400 mm/s, and a scanning number of 2 produced the optimal surface profile after cleaning. The oxygen content on the surface of the specimen was the lowest under these process parameters, and the surface roughness reached 14.22 μm.
(2)
Under the same laser cladding parameters, the LCC process produced better metallurgical bonding between the cladding layer and substrate than the MPLC process. Specifically, the LCC specimens contained fewer pores and cracks in the bond area. The HAZ in the LCC specimen was also deeper (675.67 μm) and contained more of a Widmanstätten structure than the HAZ in the MPLC specimen.
(3)
The average hardness of the LCC clad layer was 256.47 HV, whereas that of the MPLC clad layer was only 222 HV. The impact on the energy absorption and yield strength of the LCC specimens cut in the X-direction reached 164 J and 416 MPa, respectively, which were higher than those of the MPLC specimens and the substrate. The SEM images of the fractured impact and tensile specimens showed brittle fracture characteristics in the HAZ, indicating that the Widmanstätten structure generated in the HAZ increased the hardness and decreased the toughness. The specimens cut in the X-direction absorbed more impact energy than those cut in the Y-direction, suggesting that the in situ repairment should adopt a fusion path perpendicular to the direction of the crack growth to improve the impact resistance of the repaired area.
(4)
Compared with the MPLC, the LCC involves fewer steps, requires less manual work, improves the cladding quality, and provides a new opportunity for applying laser cladding technology to on-site repair.

Author Contributions

Conceptualization, K.F. and Y.S.; methodology, Y.X.; software, S.W.; formal analysis, Z.L.; investigation, Q.W.; resources, Y.L.; data curation, C.Z.; writing—original draft preparation, K.F.; writing—review and editing, K.F. and Y.X.; project administration, Y.S.; and funding acquisition, Y.S. All authors have read and agreed to the published version of the manuscript.

Funding

This research was financially supported by the Shandong Province Natural Science Foundation (Grant ZR2020ME162).

Institutional Review Board Statement

Not applicable.

Informed Consent Statement

Not applicable.

Data Availability Statement

Data available on request from the authors.

Conflicts of Interest

The authors declare no conflicts of interest.

Appendix A

As shown in Figure A1, there is no obvious difference observed in the metallographic structure before and after the electrical discharge wire cutting. In this study, the influence of electric discharge wire cutting on the performance of the specimen was not considered.
Figure A1. Comparison of metallographic structure before and after cutting.
Coatings 14 00508 g0a1

References

  1. Cui, Q.F.; Hui, H.P.; Li, N. Applicability of the ASME exemption curve for Chinese pressure vessel steel Q345R. ASME J. Press. Vessel Technol. 2015, 137, 061602. [Google Scholar] [CrossRef]
  2. Zhu, L.D.; Xue, P.S.; Lan, Q.; Meng, G.R.; Ren, Y.; Yang, Z.C.; Xu, P.H.; Liu, Z. Recent research and development status of laser cladding: A review. Opt. Laser Technol. 2021, 138, 106915. [Google Scholar] [CrossRef]
  3. Clare, A.; Oyelola, O.; Folkes, J.; Farayibi, P. Laser cladding for railway repair and preventative maintenance. J. Laser Appl. 2012, 20, 140. [Google Scholar] [CrossRef]
  4. Rahman Rashid, R.A.; Nazari, K.A.; Barr, C.; Palanisamy, S.; Orchowski, N.; Matthews, N.; Dargusch, M.S. Effect of laser reheat post-treatment on the microstructural characteristics of laser-cladded ultra-high strength steel. Surf. Coat. Technol. 2019, 372, 93–102. [Google Scholar] [CrossRef]
  5. Zhu, S.C.; Chen, W.L.; Zhan, X.H.; Ding, L.P.; Zhou, J.J. Parameter optimisation of laser cladding repair for an Invar alloy mould. Proc. Inst. Mech. Eng. Part B J. Eng. Manuf. 2019, 233, 8. [Google Scholar] [CrossRef]
  6. Duan, X.M.; Li, Q.; Xie, W.R.; Yang, X.D. Wire arc metal additive manufacturing using pulsed arc plasma (PAP-WAAM) for effective heat management. J. Mater. Process. Technol 2023, 311, 117806. [Google Scholar] [CrossRef]
  7. van der Mee, V. Welding exposure scenarios. Weld World 2021, 65, 2397–2401. [Google Scholar] [CrossRef]
  8. Zhu, G.D.; Xu, Z.H.; Jin, Y.; Chen, X.; Yang, L.J.; Xu, J.; Shan, D.B.; Chen, Y.B.; Guo, B. Mechanism and application of laser cleaning: A review. Opt. Laser. Eng. 2022, 157, 107130. [Google Scholar] [CrossRef]
  9. Ashidate, S.; Obara, M. Rust and paint stripping from power transmission towers with a pulsed Nd:YAG laser. SPIE 1997, 3092, 740–743. [Google Scholar] [CrossRef]
  10. Wang, Q.D.; Kainuma, S.; Zhuang, S.; Shimizu, K.; Haraguchi, M. Laser cleaning on severely corroded steel members: Engineering attempt and cleanliness assessment. J. Clean. Prod. 2022, 376, 134224. [Google Scholar] [CrossRef]
  11. Brand, J.; Wain, A.; Rode, A.V.; Madden, S.; Rapp, L. Towards safe and effective femtosecond laser cleaning for the preservation of historic monuments. Appl. Phys. A 2023, 129, 246. [Google Scholar] [CrossRef]
  12. Wang, Z.; Zeng, X.; Huang, W. Parameters and surface performance of laser removal of rust layer on A3 steel. Surf. Coat. Technol. 2003, 166, 10–16. [Google Scholar] [CrossRef]
  13. Song, Y.H.; Zhang, T.F.; Fan, W.J.; Zhang, Y.; Yang, W.F.; Wang, A.D. Effect of the overlap ratio on surface properties of 7B04 aluminum alloy for aviation during laser derusting. J. Mater. Res. Technol. 2022, 20, 1495–1511. [Google Scholar] [CrossRef]
  14. Wang, A.M.; Feng, A.X.; Gu, X.H.; Pan, X.M.; Yu, J.H.; Jiang, Z.H. Effect of picosecond laser cleaning on surface morphology and properties of stainless steel. Opt. Laser Technol. 2023, 159, 106041. [Google Scholar] [CrossRef]
  15. Wang, Y.F.; Li, Z.X.; Wang, H.N.; Du, J.H.; Zhang, C.W. Effect of multilayered structure on properties of Ti/TiN coating. Rare Met. Mater. Eng. 2017, 46, 1219–1224. [Google Scholar] [CrossRef]
  16. Ali, R.; Renzelli, M.; Khan, M.I.; Sebastiani, M.; Bemporad, E. Effects of residual stress distribution on interfacial adhesion of magnetron sputtered AlN and AlN/Al nanostructured coatings on a (100) silicon substrate. Nanomaterials 2018, 8, 896. [Google Scholar] [CrossRef] [PubMed]
  17. Guo, H.; Wu, N.C.; Zhang, Y.L.; Zhang, S.D.; Sun, W.H.; Wang, J.Q. Influence of coating thickness on the impact damage mode in Fe-based amorphous coatings. Surf. Coat. Technol. 2020, 390, 125650. [Google Scholar] [CrossRef]
  18. Zhang, K.; Wang, S.J.; Liu, W.J.; Long, R. Effects of substrate preheating on the thin-wall part built by laser metal deposition shaping. Appl. Surf. Sci. 2014, 317, 839–855. [Google Scholar] [CrossRef]
  19. Ding, C.G.; Cui, X.; Jiao, J.Q.; Zhu, P. Effects of substrate preheating temperatures on the microstructure, properties, and residual stress of 12CrNi2 prepared by laser cladding deposition technique. Materials 2018, 11, 2401–2403. [Google Scholar] [CrossRef] [PubMed]
  20. He, B.; Wang, C.; Sun, C.Q.; Yang, G.; Wang, X.M.; Su, Y.D. Effect of substrate preheating on microstructure and properties of laser-deposited TA15/GH4169 composite structure. Chn. J. Lasers (Zhongguo Jiguang) 2020, 47, 0102002. [Google Scholar] [CrossRef]
  21. Qiu, H.X.; Yu, W.B.; Song, J.L.; Deng, J.; Li, Y.Y.; Deng, Q.L. Numerical simulation of laser cladding 316L/H13+20% WC composite coating on H13 steel surface. Laser Optoelectron. Prog. 2022, 59, 0314002. [Google Scholar] [CrossRef]
  22. Wang, H.P.; Mo, J.L.; Mu, S.; Zhang, M.Q.; Duan, W.J.; Li, J.B.; Zhou, Z.R. Effects of interfacial trapezoidal grooves on the mechanical properties of coatings by laser cladding. Surf. Coat. Technol. 2021, 421, 127425. [Google Scholar] [CrossRef]
  23. Zhan, X.H.; Liu, Y.C.; Yi, P.; Feng, W.L.; Feng, Z.H.; Jin, Y.C. Effect of substrate surface texture shapes on the adhesion of plasma-sprayed Ni-based coatings. J. Therm. Spray Technol. 2020, 30, 270–284. [Google Scholar] [CrossRef]
  24. Ma, Y.Z.; Zhao, W.; Zhang, H.T.; Ma, L.; Fan, C.X.; Zhang, X.; Li, D. A new method for laser grooving titanium alloy with the assist of a hybrid of gas jet and waterjet. J. Mater. Process. Technol. 2023, 315, 117906. [Google Scholar] [CrossRef]
  25. Zhu, L.X.; Sun, B.T.; Li, Z.; Pan, X.M.; Chen, Y.F.; Cao, Y. The weld quality improvement via laser cleaning pre-treatment for laser butt welding of the HSLA steel plates. Weld. World 2020, 64, 1715–1723. [Google Scholar] [CrossRef]
  26. Zhou, C.; Li, H.G.; Chen, G.Y.; Wang, G.; Shan, Z.Z. Effect of single pulsed picosecond and 100 nanosecond laser cleaning on surface morphology and welding quality of aluminium alloy. Opt. Laser Technol. 2020, 127, 106197. [Google Scholar] [CrossRef]
  27. Tan, P.F.; Kiran, R.; Zhou, K. Effects of sub-atmospheric pressure on keyhole dynamics and porosity in products fabricated by selective laser melting. J. Manuf. Proc. 2021, 64, 816–827. [Google Scholar] [CrossRef]
  28. Korsmik, R.; Zadykyan, G.; Tyukov, S.; Klimova-Korsmik, O.; Dmitrieva, A. Prediction of Occurrence of Hot Cracks in Laser Cladding Heat Resistant Nickel Alloys. Metals 2023, 13, 10. [Google Scholar] [CrossRef]
  29. Ma, W.; Ning, J.; Zhang, L.J.; Na, S.J. Regulation of microstructures and properties of molybdenum-silicon-boron alloy subjected to selective laser melting. J. Manuf. Proc. 2021, 69, 593–601. [Google Scholar] [CrossRef]
  30. Zhang, D.B.; Wang, M.; Shu, C.S.; Zhang, Y.F.; Wu, D.S.; Ye, Y.X. Dynamic keyhole behavior and keyhole instability in high power fiber laser welding of stainless steel. Optics Laser Technol. 2019, 144, 1–9. [Google Scholar] [CrossRef]
  31. Zhou, L.B.; Sun, J.S.; Chen, J.; Chen, W.; Ren, Y.J.; Yan, Y.; Li, C.; Qiu, W. Study of substrate preheating on the microstructure and mechanical performance of Ti-15Mo alloy processed by selective laser melting. J. Alloys Compds. 2022, 928, 167130. [Google Scholar] [CrossRef]
  32. Bidron, G.; Doghri, A.; Malot, T.; Fournier-dit-Chabert, F.; Thomas, M.; Peyre, P. Reduction of the hot cracking sensitivity of CM-247LC superalloy processed by laser cladding using induction preheating. J. Mater. Process. Technol. 2019, 277, 116461. [Google Scholar] [CrossRef]
  33. Luo, X.P.; Zhao, M.H.; Li, J.Y.; Duan, C.H. Numerical study on thermodynamic behavior during selective laser melting of 24CrNiMo alloy steel. Materials 2020, 13, 45. [Google Scholar] [CrossRef] [PubMed]
Figure 1. A large cyclone separator in a natural gas station.
Coatings 14 00508 g001
Figure 2. The rusted Q345R plate surface: (a) surface; (b) cross section; (c) 3D morphology; and (d) microscopic morphology.
Coatings 14 00508 g002
Figure 3. Manufacturing of specimens: (a) dimensions; (b) cutting directions; and (c) tensile, impact, and metallography specimens.
Coatings 14 00508 g003
Figure 4. Laser cleaning and cladding platform.
Coatings 14 00508 g004
Figure 5. Principle of laser working: (a) laser cleaning; and (b) laser cladding.
Coatings 14 00508 g005
Figure 6. Temperature data acquisition system.
Coatings 14 00508 g006
Figure 7. Comparison of process parameters between LCC and MPLC.
Coatings 14 00508 g007
Figure 8. Macro-morphology of samples (ay) 1–25, respectively, under different laser process parameters.
Coatings 14 00508 g008
Figure 9. Three-dimensional morphology of sample (a) 1, (b) 2, (c) 4, (d) 7, (e) 12, (f) 14, (g) 19, (h) 21, and (i) 22.
Coatings 14 00508 g009
Figure 10. Responses of three factors to oxygen content.
Coatings 14 00508 g010
Figure 11. Responses of three factors to surface roughness.
Coatings 14 00508 g011
Figure 12. Comparison of surface morphology between laser cleaning and manual polishing: (a) microscopic morphology of laser cleaning; (b) 3D morphology of laser cleaning; (c) microscopic morphology of manual polishing; and (d) 3D morphology of manual polishing.
Coatings 14 00508 g012
Figure 13. Cross-sectional microstructures: (a,b) 50× metallographic images; and (c,d) 100× metallographic images.
Coatings 14 00508 g013
Figure 14. SEM micrographs of specimens: (ae) cross sections along the Y-direction; and (f,g) cross sections along the X-direction.
Coatings 14 00508 g014
Figure 15. Temperature curve of the substrate: (a) during laser cleaning process; and (b) during manual polishing process.
Coatings 14 00508 g015
Figure 16. Microstructure of the HAZ: (ae) LCC specimens; and (f,g) MPLC specimens.
Coatings 14 00508 g016
Figure 17. Microhardness test: (a) two test paths; and (b) microhardness distribution for each specimen.
Coatings 14 00508 g017
Figure 18. Results of the impact test.
Coatings 14 00508 g018
Figure 19. Macro-morphology and SEM micro-morphology of impact fracture specimens: (ac) LCC-X; (df) MPLC-X; (gi) LCC-Y; (jl) MPLC-Y; and (mo) substrate.
Coatings 14 00508 g019
Figure 20. Results of the tensile test: (a) stress–strain curves; and (b) tensile strength and elongation of different specimens.
Coatings 14 00508 g020
Figure 21. Macro-morphology and SEM micro-morphology of tensile fracture specimens: (ac) LCC-X; (df) MPLC-X; (gi) LCC-Y; (jl) MPLC-Y; and (mo) substrate.
Coatings 14 00508 g021
Figure 22. Comparison of the process flows of MPLC and LCC.
Coatings 14 00508 g022
Table 1. Chemical composition of Q345R.
ElementsC SiMnCrNiMoCuFe
wt%0.20.2471.50.0520.0610.0060.25Bal.
Table 2. Chemical composition of Inconel625 powder.
ElementsC SiMnCrAlFeCoMoNbNi
wt%0.040.120.2821.660.060.660.018.673.43Bal.
Table 3. Orthogonal experimental design table.
LevelFactor
Laser Power (W)Vse (mm/s)Number of Scans
112002001
214004002
316006003
418008004
5200010005
Table 4. Orthogonal test table and cladding layer parameters.
No.Laser Power (W)Vs (mm/s)Scanning TimesOxygen Content (AT%)Sa (μm)
11200200133.59.03
21200400543.515.53
31200600446.212.05
41200800325.749.67
512001000229.7211.84
61400200355.86.74
71400400214.5814.22
81400600137.6318.56
91400800516.3111.8
1014001000433.7414.92
111600200559.526.22
121600400415.247.12
131600600332.515.53
141600800260.518.56
1516001000145.6313.2
161800200259.88.22
171800400150.88.74
181800600540.512.74
191800800448.29.51
2018001000337.911.9
212000200455.87.02
222000400352.88.22
232000600233.4216.41
242000800143.514.53
2520001000552.29.88
R O −15.93−17.5−2.8
r O 213
R S 3.037.613.73
r S 312
Table 5. Results of the impact test.
Specimen TypeImpact Energy (J)Standard Deviation
No. 1No. 2No. 3Average
LCC-X1641621661642
LCC-Y1561561591571.73
MPLC-C1551591601582.65
MPLC-Y1531571581562.65
Substrate1551541561551
Table 6. Results of the tensile test.
Specimen TypeNo. 1No. 2No. 3AverageStandard Deviation
Yield strength
(Mpa)
LCC-X4214154124164.58
LCC-Y3703783773754.36
MPLC-C3723913773809.85
MPLC-Y3593753703688.19
Substrate3463473513482.65
Ultimate tensile strength
(Mpa)
LCC-X5205335315287
LCC-Y4804914754828.19
MPLC-C44844246645212.49
MPLC-Y46147448147210.15
Substrate4924994944953.61
Elongation
(%)
LCC-X26.427.829.527.91.55
LCC-Y30.128.429.429.30.85
MPLC-C22.723.625.123.81.21
MPLC-Y24.126.425.125.21.15
Substrate35.736.136.2360.26
Disclaimer/Publisher’s Note: The statements, opinions and data contained in all publications are solely those of the individual author(s) and contributor(s) and not of MDPI and/or the editor(s). MDPI and/or the editor(s) disclaim responsibility for any injury to people or property resulting from any ideas, methods, instructions or products referred to in the content.

