1. Introduction
With the objective of building a new mechanical heart valve design [
1], the Ti-6Al-4V alloy coated with titanium dioxide (TiO
2) has been selected as the building material [
2]. TiO
2 coatings have demonstrated hemocompatibility properties appropriate for use in this type of prosthesis [
3,
4,
5].
Ti-6Al-4V alloy (grade 5 in ASTM B367) is an α/β Ti alloy widely used in biomedical applications due to its corrosion resistance and high bio- and hemocompatibility [
6,
7]. In general, the recognized properties of Ti alloys are mainly due to the formation of a natural TiO
2 oxide at room temperature, which can reach a thickness of 2–10 nm [
6,
7]. This native thin film oxide often has a high density of defects (mainly cracks), which reduce mechanical properties such as wear resistance or chemical properties such as corrosion resistance [
8]. Therefore, it becomes necessary to add thicker and more protective coatings than the TiO
2 natural oxide to improve the properties. Anodic oxidation is a viable technique due to its low cost, simplicity of application, and control of the coatings’ characteristics. This electrochemical process allows coatings of oxides to be obtained that have greater thickness and density than those that are naturally grown [
9,
10]. Among the variables of this technique that most affect the characteristics of the oxide (thickness, color, homogeneity, roughness, crystalline structure, etc.) are current density, applied voltage, anodizing time, temperature, conductivity, and pH of the electrolyte [
9,
10,
11].
Two characteristics required for coatings that will be in contact with blood are homogeneity and a low level of roughness (
Ra ≤ 50 nm) to avoid the promotion of blood clots (thrombosis) [
2,
12]. Another property that influences the bio- and hemocompatibility of TiO
2 coatings is their crystalline structure. At low pressure, TiO
2 can present three crystalline phases: Anatase, rutile, or brookite. According to the literature, both amorphous phases and crystalline phases such as anatase and rutile would be bio-compatible [
12].
The anodic oxidation technique—with oxidation voltages below the production of spark discharge phenomenon—can be used to obtain homogeneous TiO
2 coatings with low roughness. Spark discharge produces porous and crystalline oxides and a rougher surface than desired due to the formation of sparks or electric arcs [
9,
13]. This phenomenon leads to a variation of the technique known as Anodic Spark Deposition [
14]. The voltage at which the spark starts varies with the nature and concentration of the electrolyte employed [
13,
15,
16,
17]. This effect limited the oxidation voltage used in the present work, because (as previously mentioned) homogeneous and low roughness coatings are necessary for hemocompatible applications.
From the above, the primary objective of the present work was to define appropriate conditions (concentration of electrolyte and applied voltage) to obtain smooth and uniform coatings of TiO2 by anodic oxidation of Ti-6Al-4V alloy in sulfuric acid as electrolyte, to be used in the construction of a cardiovascular device.
2. Materials and Methods
2.1. Synthesis of the Coatings
2.1.1. Preparation of the Substrates
The substrates used for oxidation were flat samples of Ti-6Al-4V alloy with a surface area of 1 × 2 cm2 and thickness of 0.2 cm. They were polished with abrasive SiC papers with decreasing granulometry (from # 120 up to # 1500), with diamond paste of 1 μm (Prazis, Argentina) lubricated with ethylene glycol (Cicarelli, Santa Fe, Argentina), finishing with 4:1 mix of colloidal silica (Mastermet-Buehler, Lake Bluff, IL, USA) and hydrogen peroxide. The mirror surfaces were then cleaned with water and detergent, rinsed with alcohol, and hot air dried. One of the tested substrates was not coated (TiG5).
2.1.2. Anodic Oxidation
Oxidation of the samples was carried out at room temperature (25 °C) applying a DC electric current between the Pt cathode and Ti-6Al-4V anode, separated from each other by 5 cm in a beaker glass containing the electrolyte. The electrolytes were sulphuric acid (H2SO4) solutions, and the concentration was varied from 0.1 to 4 M (0.1 M, 0.5 M, 1 M, 2 M, and 4 M). The applied voltages were 20 V, 40 V, 60 V, and 70 V. Anodization time was 1 min. Immediately after oxidation, the oxidized samples were rinsed with demineralized water and dried with hot air. Evolution of voltage and current density was recorded during the oxidation. Anodization of the sample made with 4 M H2SO4 at 70 V had some problems due to drawbacks in cell contacts as a result of the severe anodization conditions, as evidenced by the occurrence of spark discharge and melting of the sample holder due to the high temperature achieved during spark.
The samples were labeled as follows: A letter S corresponding to the electrolyte (H2SO4), followed by the concentration (in M), the letter V and the corresponding voltage (in V)—e.g., S0.1-V20, S1-V40, etc.
2.2. Coatings Characterization
The surface of the oxides was observed by optical microscopy and scanning electron microscopy SEM, using and Arcano and Carl Zeiss Supra 40 equipment (Germany), respectively. The difference between the colors observed in the macrographs and in the micrographs is explained by the fact that in the first case it was illuminated with a white (fluorescent) light, and in the second with an incandescent light with a predominant yellow spectrum. All micrographs were taken under the same conditions of illumination, because it is extremely important to standardize the illumination to be able to compare the effects in the color, especially when the changes are very subtle.
The roughness of the coatings was measured using the Time Group (China) TR200 profilometer with a cut-off length of 0.8 mm, a sampling length of 0.8 mm, and a number of sampling of 5 in 4 mm. Ra is the average roughness and Rz is the distance between the highest peak and the lowest valley in each sampling length. Four measurements were performed on each sample, and the results were averaged, with relative error smaller than 10%.
The crystalline phases present in the coatings were analyzed by X-ray diffraction (XRD) using a Philips (Netherlands) PW 3710 diffractometer with a CuKα wavelength (λ CuKα = 1.5418 Å), using a Philips thin-film accessory allowing operation with a ground-beam geometry with incident angle of 1°. The crystallite size (L) of the crystalline anatase phase was estimated by Scherrer’s formula, L = Kλ/(wcosθ), using the XRD profile. λ is the X-ray wavelength in nm and w (in radians) is the peak width of the diffraction peak profile at half maximum height. θ is the Bragg diffraction angle of the anatase (101) peak. K is a constant related to crystallite shape, normally taken as 0.9, assuming that the crystallites are spherical.
3. Results and Discussion
3.1. Influence of the Electrolyte Concentration (H2SO4) on the Characteristics of the Coatings
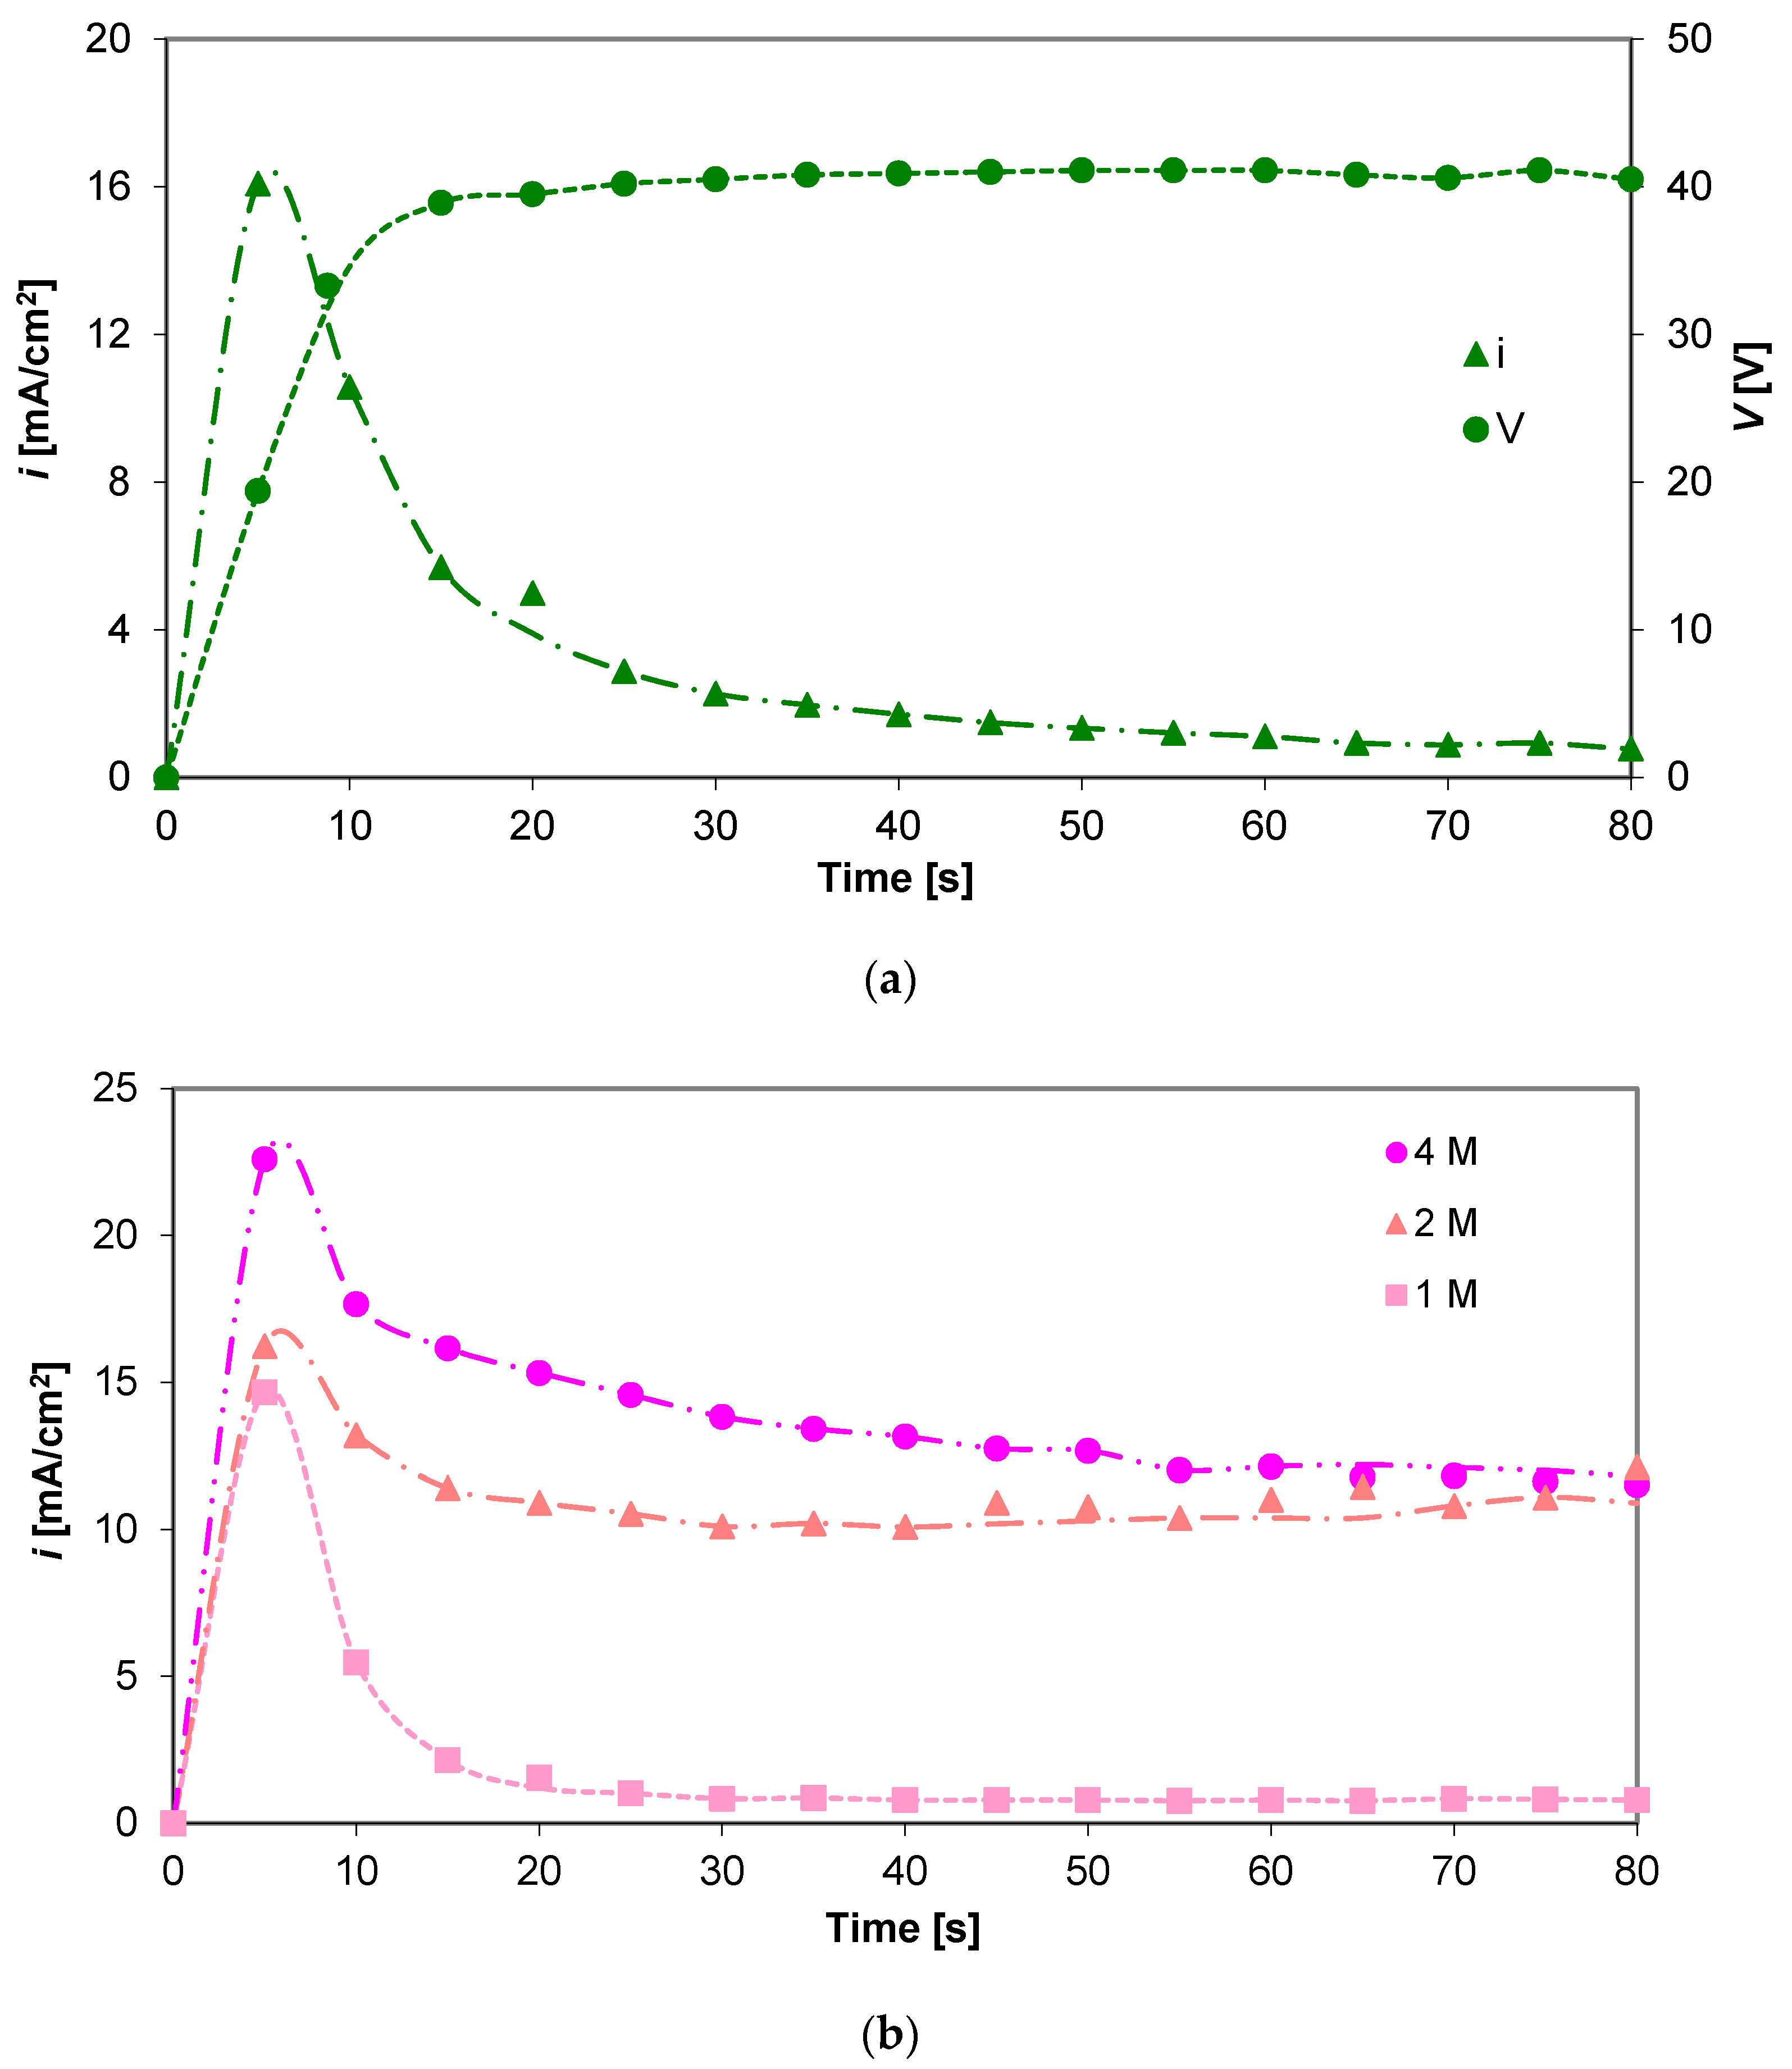
3.1.1. Variation of Voltage and Current Density with Oxidation Time
Figure 1a shows the current density (
i) and voltage (
V) characteristic behaviors of a potentiostatic anodization process at low voltages [
17]. When
V increases,
i also increases up to a maximum, indicating the formation of the TiO
2 barrier layer; then,
i rapidly decreases because the oxide increases its electrical resistance. When the voltage was established on 40 V,
i became gradually stable due to the equilibrium between the oxide growth and dissolution rates [
9,
14,
18]. The reduction of the oxide growth rate was probably due to titanium or oxygen diffusion through the coating becoming the controlling step. As this rate becomes small, for practical purposes, the oxide thickness reaches a limiting value, indicating that it depends on the applied voltage [
17,
18,
19,
20].
The temporal evolutions of current density in anodizations at 60 V with different electrolyte concentrations are shown in
Figure 1b. The maximum and stabilization
i values increased with the H
2SO
4 concentration due to the increase of conductivity from 47.2 mS/cm of 0.1 M to 778.5 mS/cm of 4 M [
18,
21] that should induce breakdown and spark at 60 V, less than the 70 V reported for 1 M on Ti-6Al-4V anodization [
13,
22]. Therefore, the stabilization of
i values at 2 M and 4 M curves are ten times higher than the corresponding value for 1 M.
3.1.2. Color of the Coatings
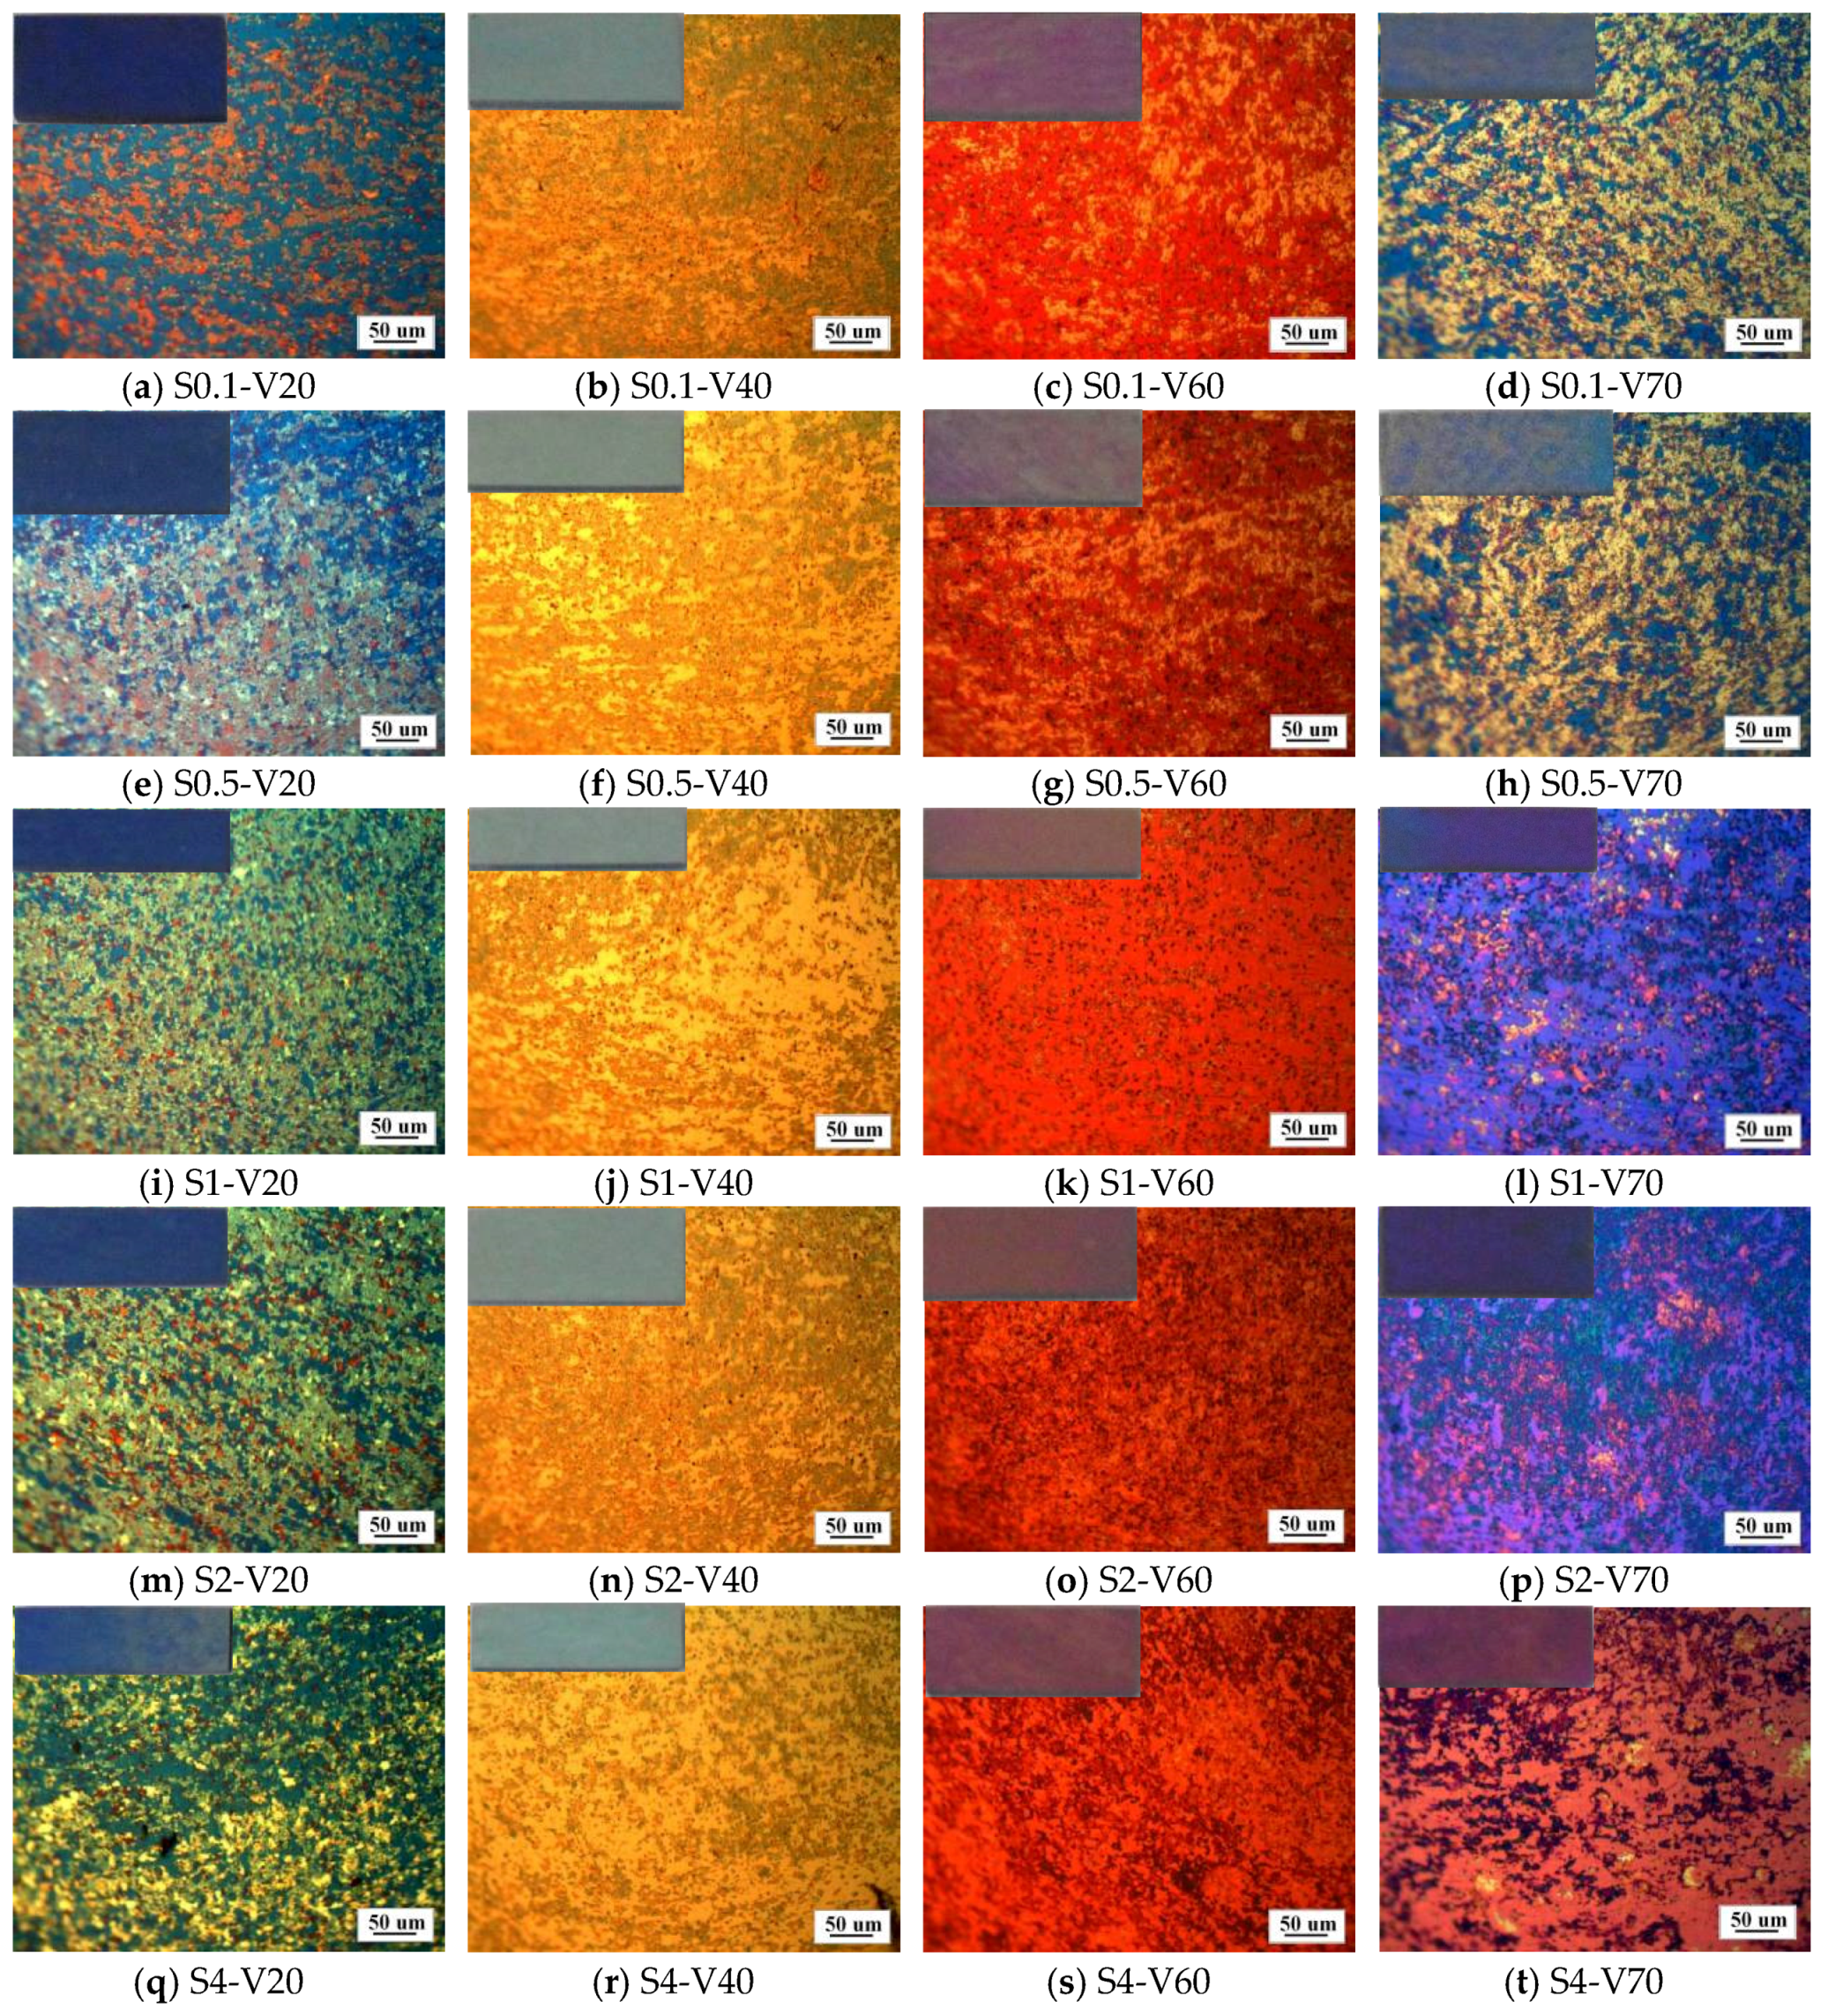
In
Figure 2, optical micrographs and macrographs (in the corner insets of each micrograph) of the samples are presented. In the macrograph, the color of the coatings obtained with different electrolyte concentration and voltage are observed. These colors are the same as observed with the naked eye.
The inset of
Figure 2a shows a uniform blue color of sample S0.1-V20. When the acid concentration increased from 0.1 M to 4 M, a decrease in the tonality of this color was observed (see
Figure 2a,e,i,m,q). On the other hand, the corresponding micrographs of 20 V samples show higher and clearer streaks with hue variations when the concentration increases.
Macrographs and micrographs of samples obtained at 40 V (
Figure 2b,f,j,n,r) show uniform light green color and yellow color, respectively, independent of acid concentration.
Macrographs of samples obtained at 60 V (
Figure 2c,g,k,o,s) show two colors: Pink and yellow. In micrographs, the colors are red and orange. In both cases, variations in tonality are observed as the concentration increases up to 1 M (
Figure 2k) when more uniformity is observed and pink or red predominated.
We mentioned previously that color depends on the thickness of the coatings, but color also changed with acid concentration, probably due to different oxide growth rate given different oxide stoichiometry [
15]. Another explanation for this phenomenon could be that different fractions of crystalline structures can be formed which cause changes in the density and refractive index of the oxide films [
15].
In the optical micrographs of each sample, two different color tonalities are observed, homogeneously distributed on the surface. These portions with different tonalities are of a size similar to the grain size, corresponding to the microstructure of the Ti-6Al-4V substrate, so this pattern of coloration can be attributed to a different growth rate of the oxide on the different crystal orientations of the phases of the Ti-6Al-4V substrate grains, which gives rise to oxides with slightly different thicknesses [
13,
23].
As observed in
Figure 2, when the concentration of the H
2SO
4 increases (mainly from 1 M), the color of the coatings changed and became more intense, diminishing the difference between colors in the previously described pattern. This could be because the increase in concentration and conductivity of the electrolyte diminishes the differences in the growth rate of the oxides on the different phases or crystal orientations of the phases of the substrate.
Despite the small differences observed in the colors obtained using different concentrations of the electrolyte, the oxide colors can be used to make a quick qualitative identification of the thickness, from an established scale for each electrolyte. With 1 M H
2SO
4 in pre-spark conditions, a relationship between color, voltage, and thickness (2.4 nm/V) was previously established [
13,
24].
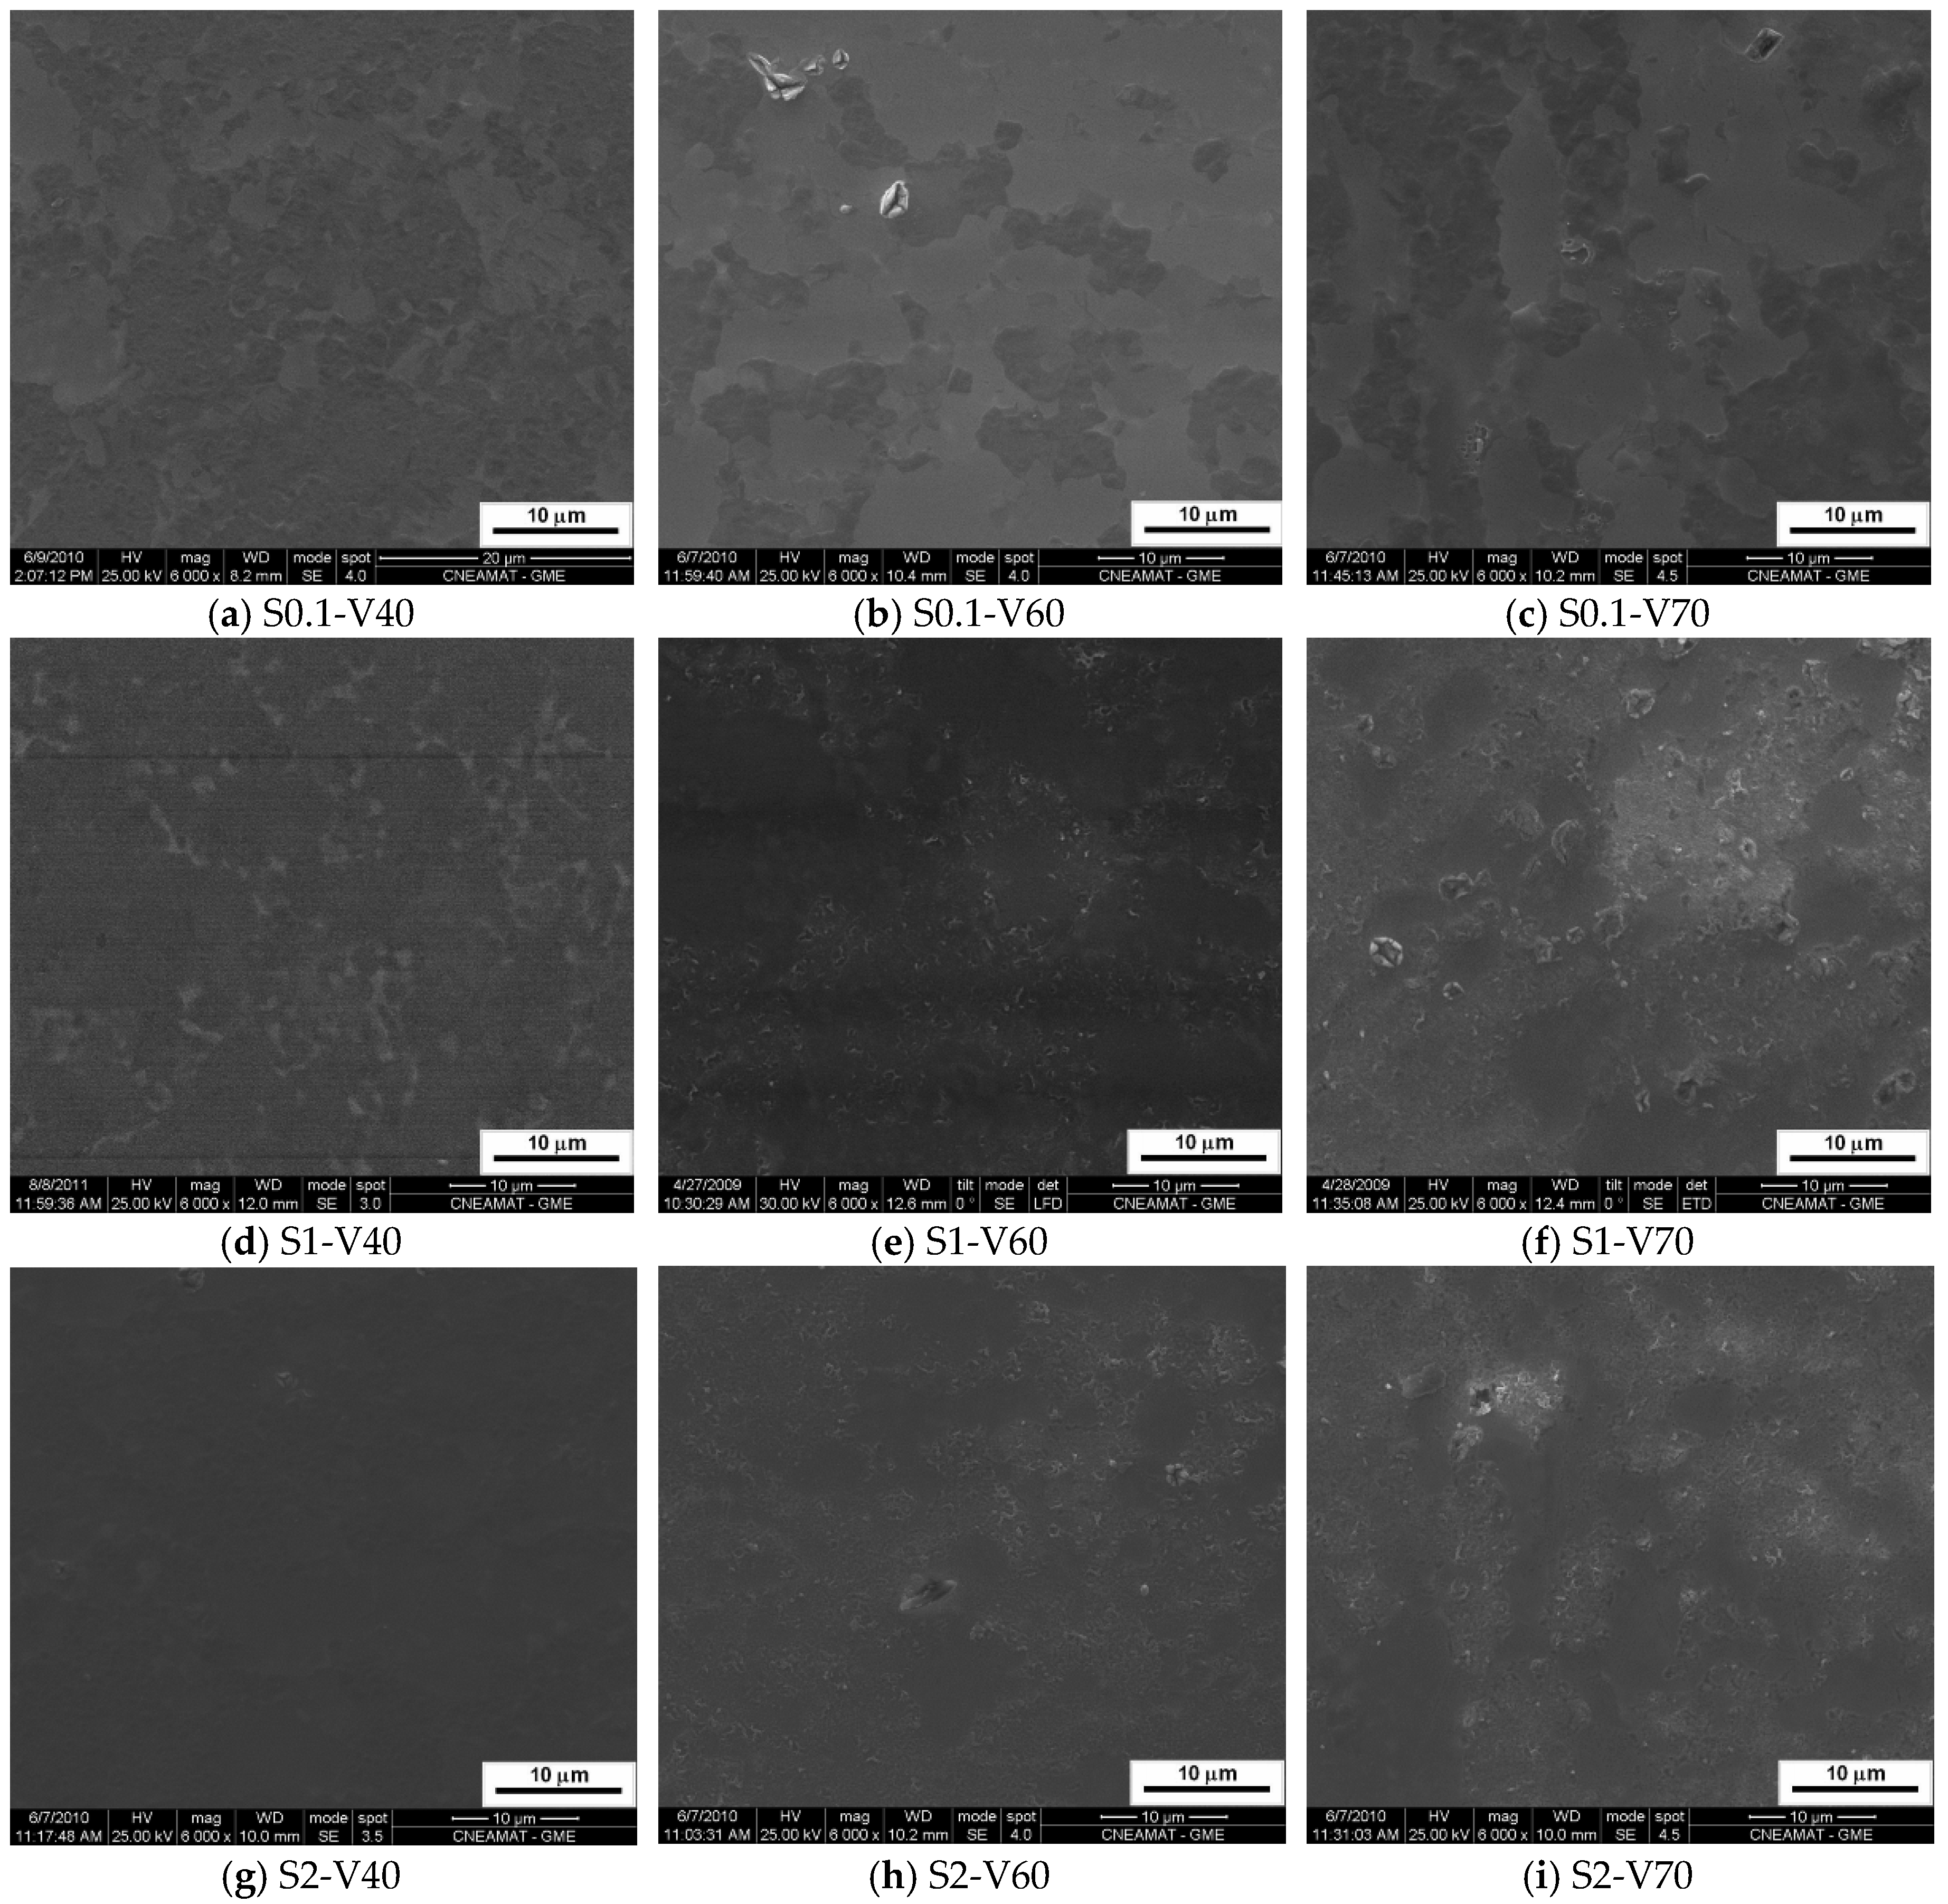
3.1.3. Morphology of the Coatings
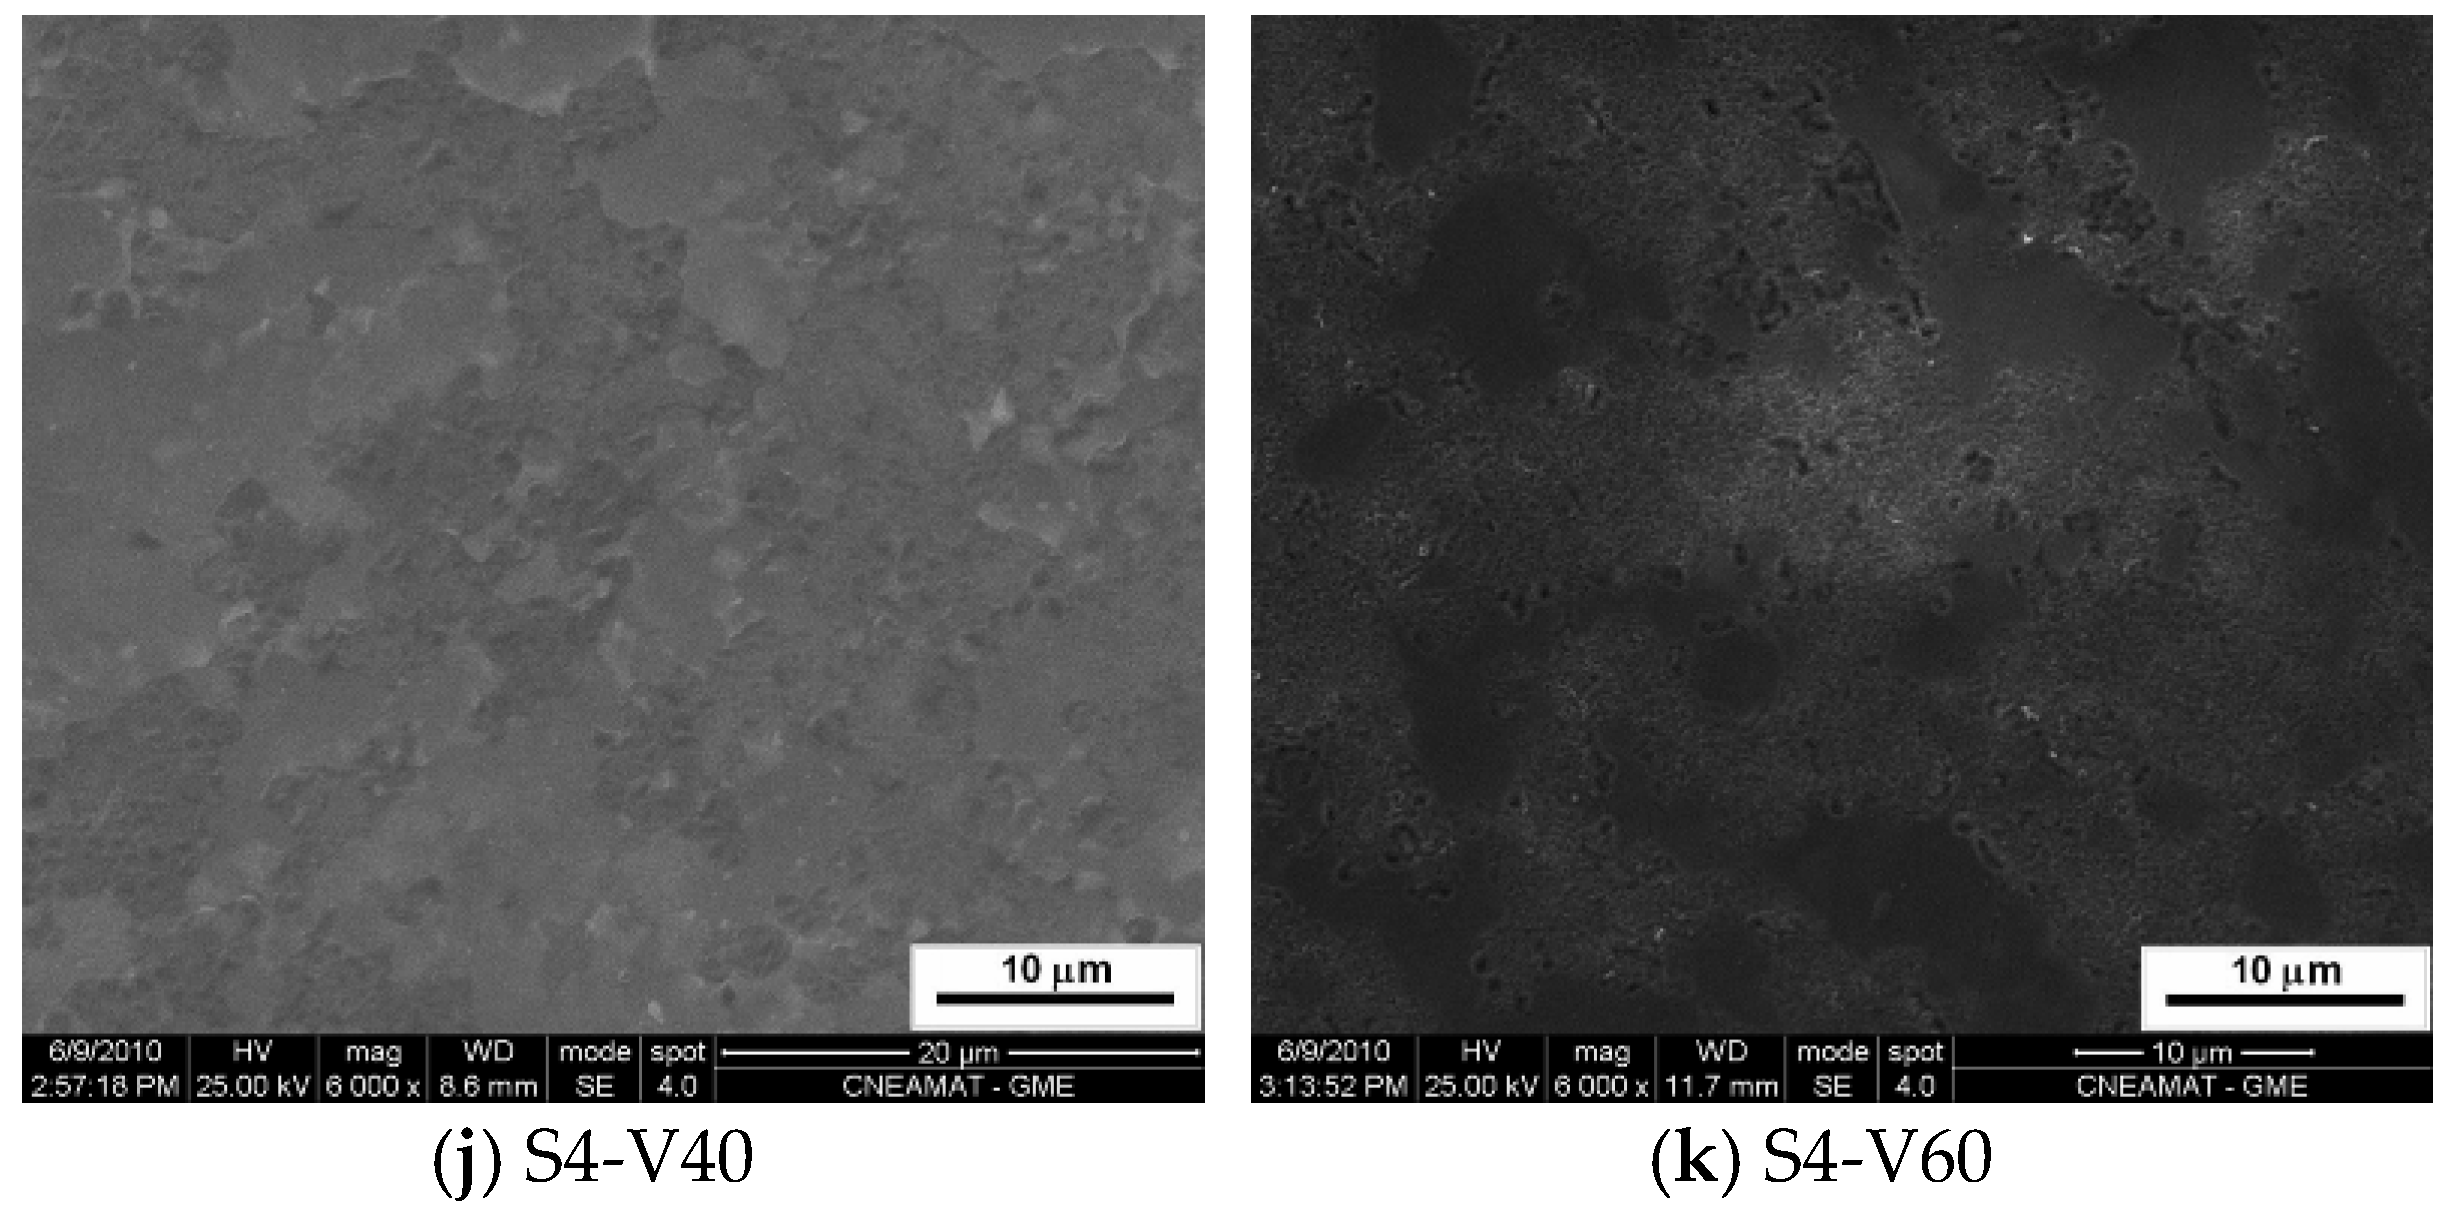
Figure 3 shows SEM images of anodized samples with different voltages and concentration of electrolyte. Anodized samples at 20 V (not shown) and 40 V (
Figure 3a,d,g,j) showed different surface morphologies but none of them presented porous surfaces. In SEM images of samples anodized at 60 V (
Figure 3b,e,h,k), different isolated pore structures are observed. In S0.1-V70 and S0.5-V70 samples, irregular surfaces are observed, and in S1-V70 and S2-V70 samples, pores are larger and agglomerated.
As previously mentioned, many factors influence the morphology; Masahashi et al. [
25] found that both roughness and surface area increase with the concentration of sulfuric acid. On the other hand, Kim and Ramaswamy [
26] observed the appearance of microcracks in the oxides with the increase of the electrolyte concentration. However, in the present research, the most significant changes in morphology were observed with the increase of the voltage with each concentration of H
2SO
4 used, but not with the increase of the concentration independent of the voltage.
With respect to roughness, coatings have values of average roughness (
Ra) in the range of 6 nm and 32 nm (
Table 1), reproducing the surface roughness of the polished substrate (20 nm) and not changing appreciably with the concentration of H
2SO
4. That range of values complies with the desired values for the application of the manufacture of cardiovascular devices (
Ra ≤ 50 nm) [
2,
11]. The lower roughness values (
Ra and
Rz) were obtained for samples anodized at 20 V and 40 V. However, the increase of the roughness and porosity with the oxidation voltage was observed mainly in the values of
Rz in the samples obtained at 60 V and 70 V with the solutions of H
2SO
4 of concentrations of 0.5 M, 1 M, and 2 M (
Table 1). As the presence of porosity in samples made with voltages up to 60 V could promote clot formation, voltages lower than 60 V have to be used to obtain homogeneous and low roughness coating suitable for hemocompatibility.
3.1.4. Structure of the Coatings
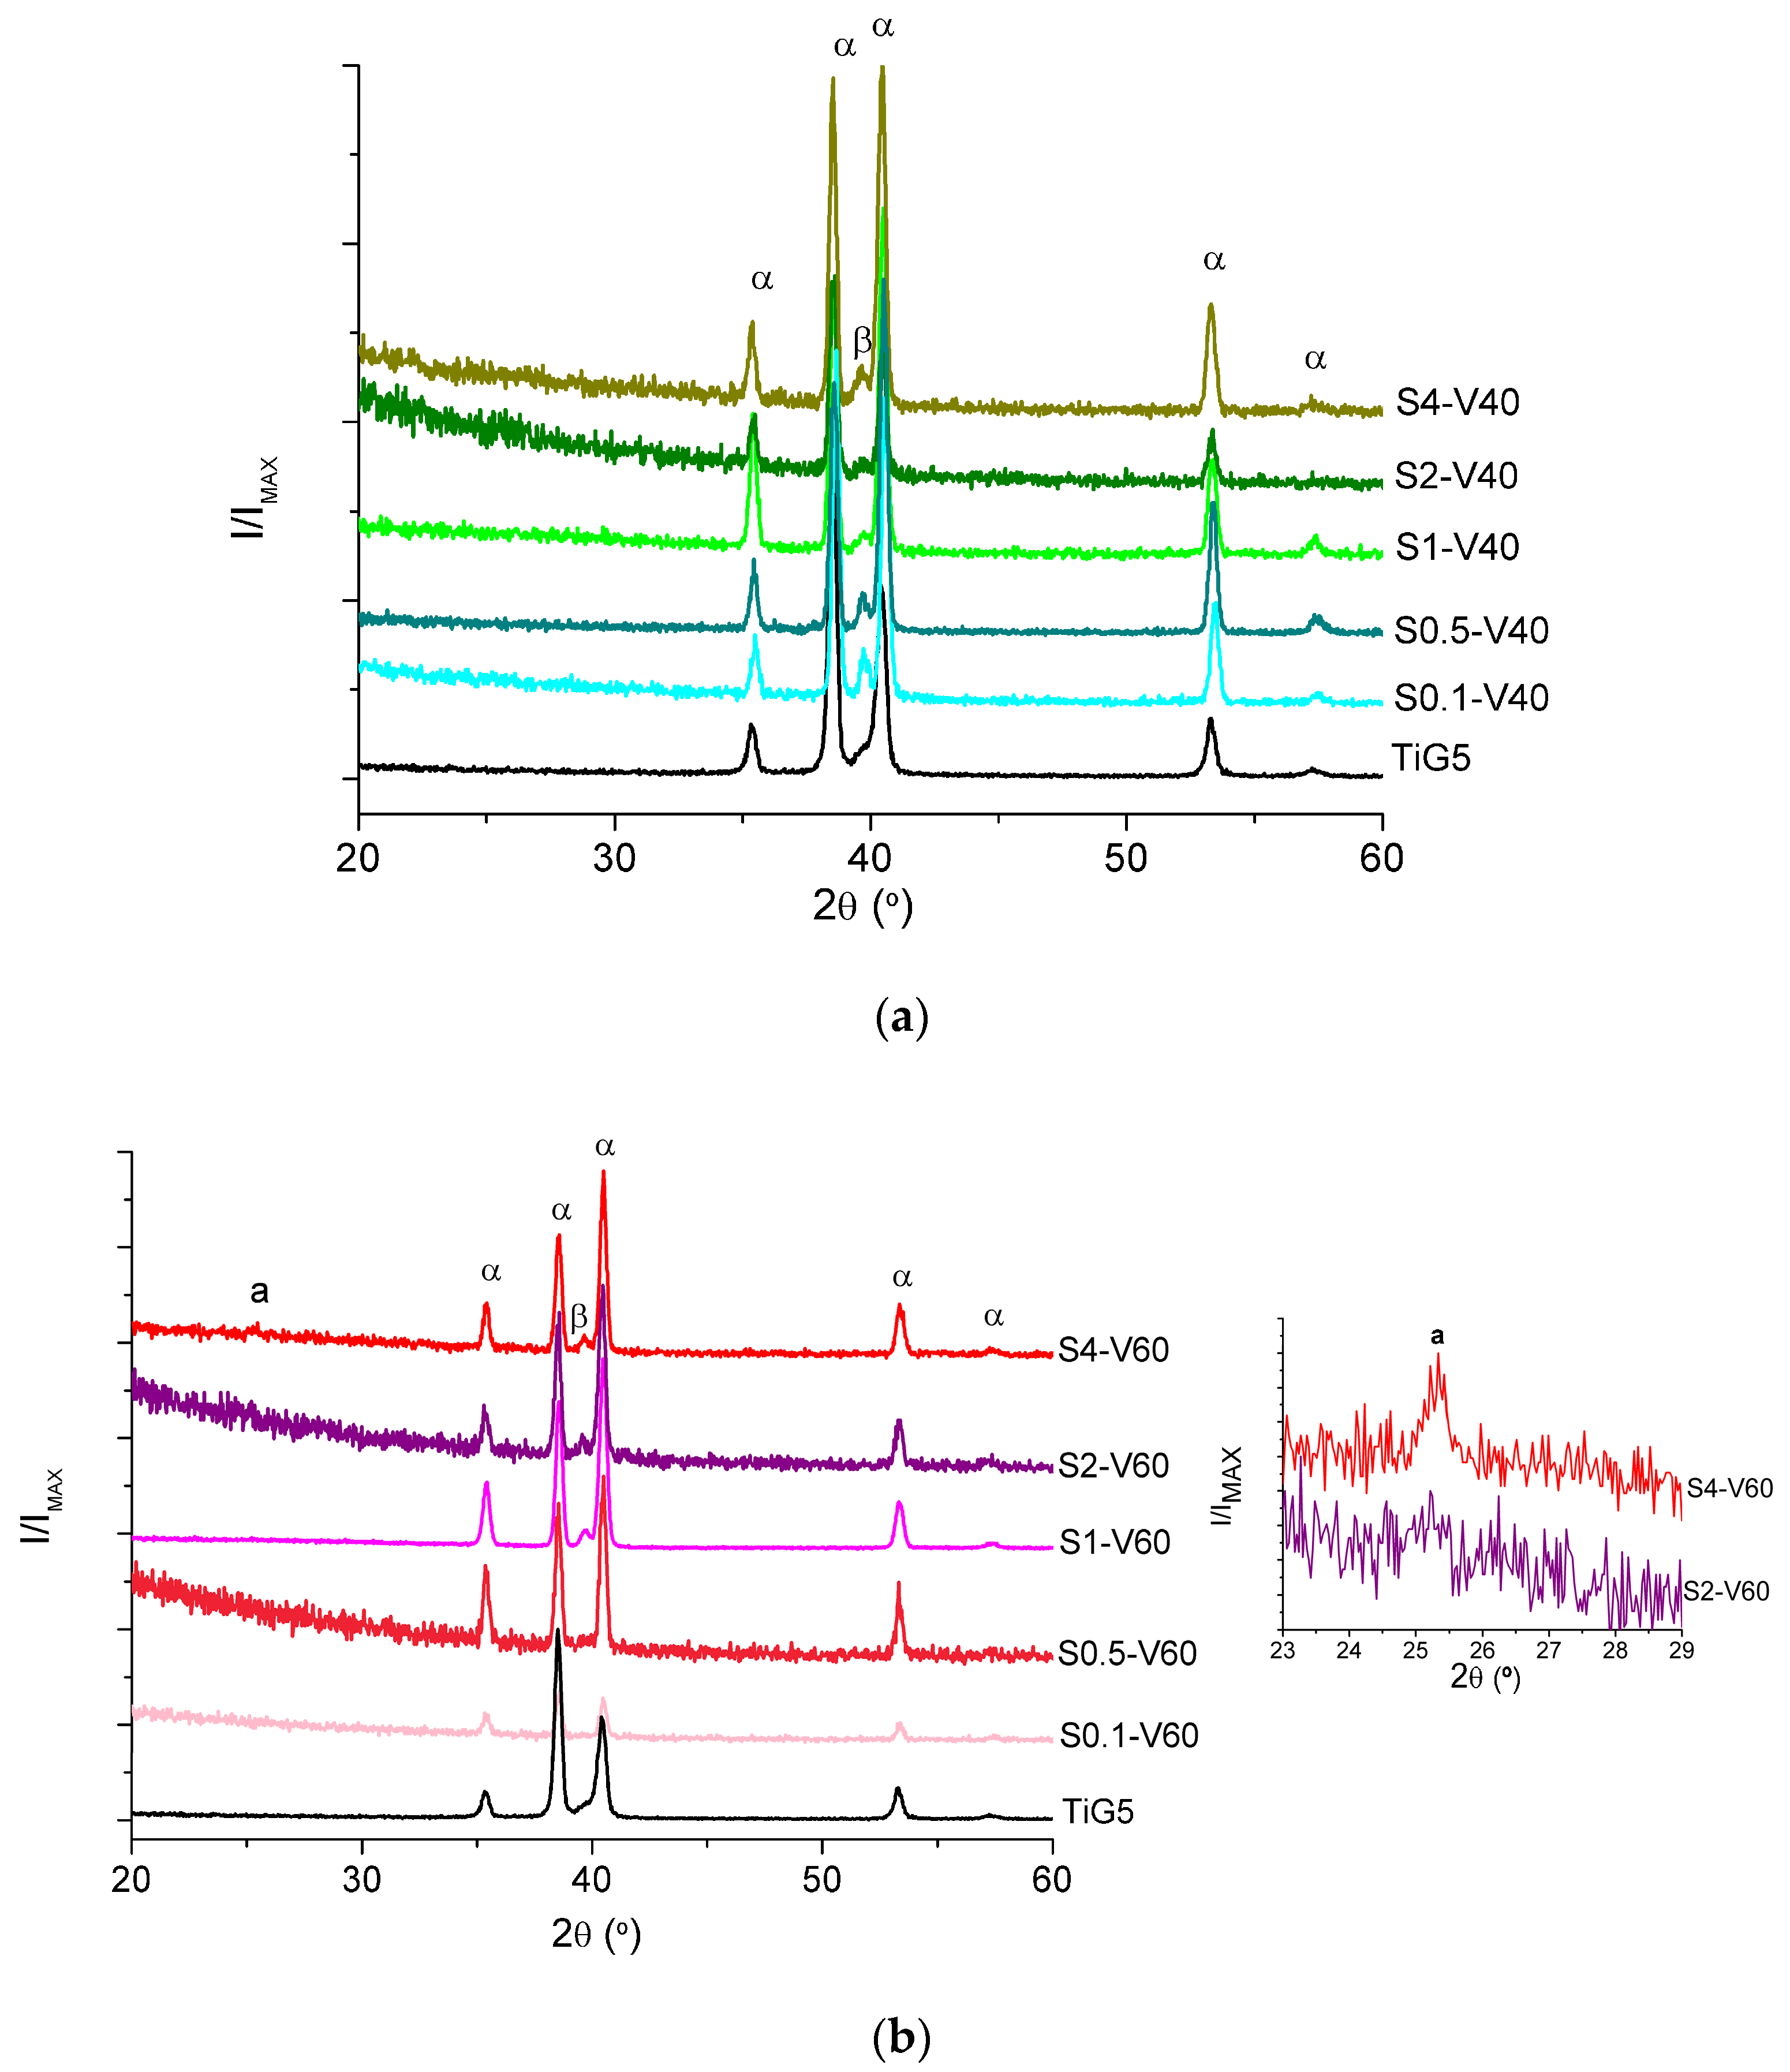
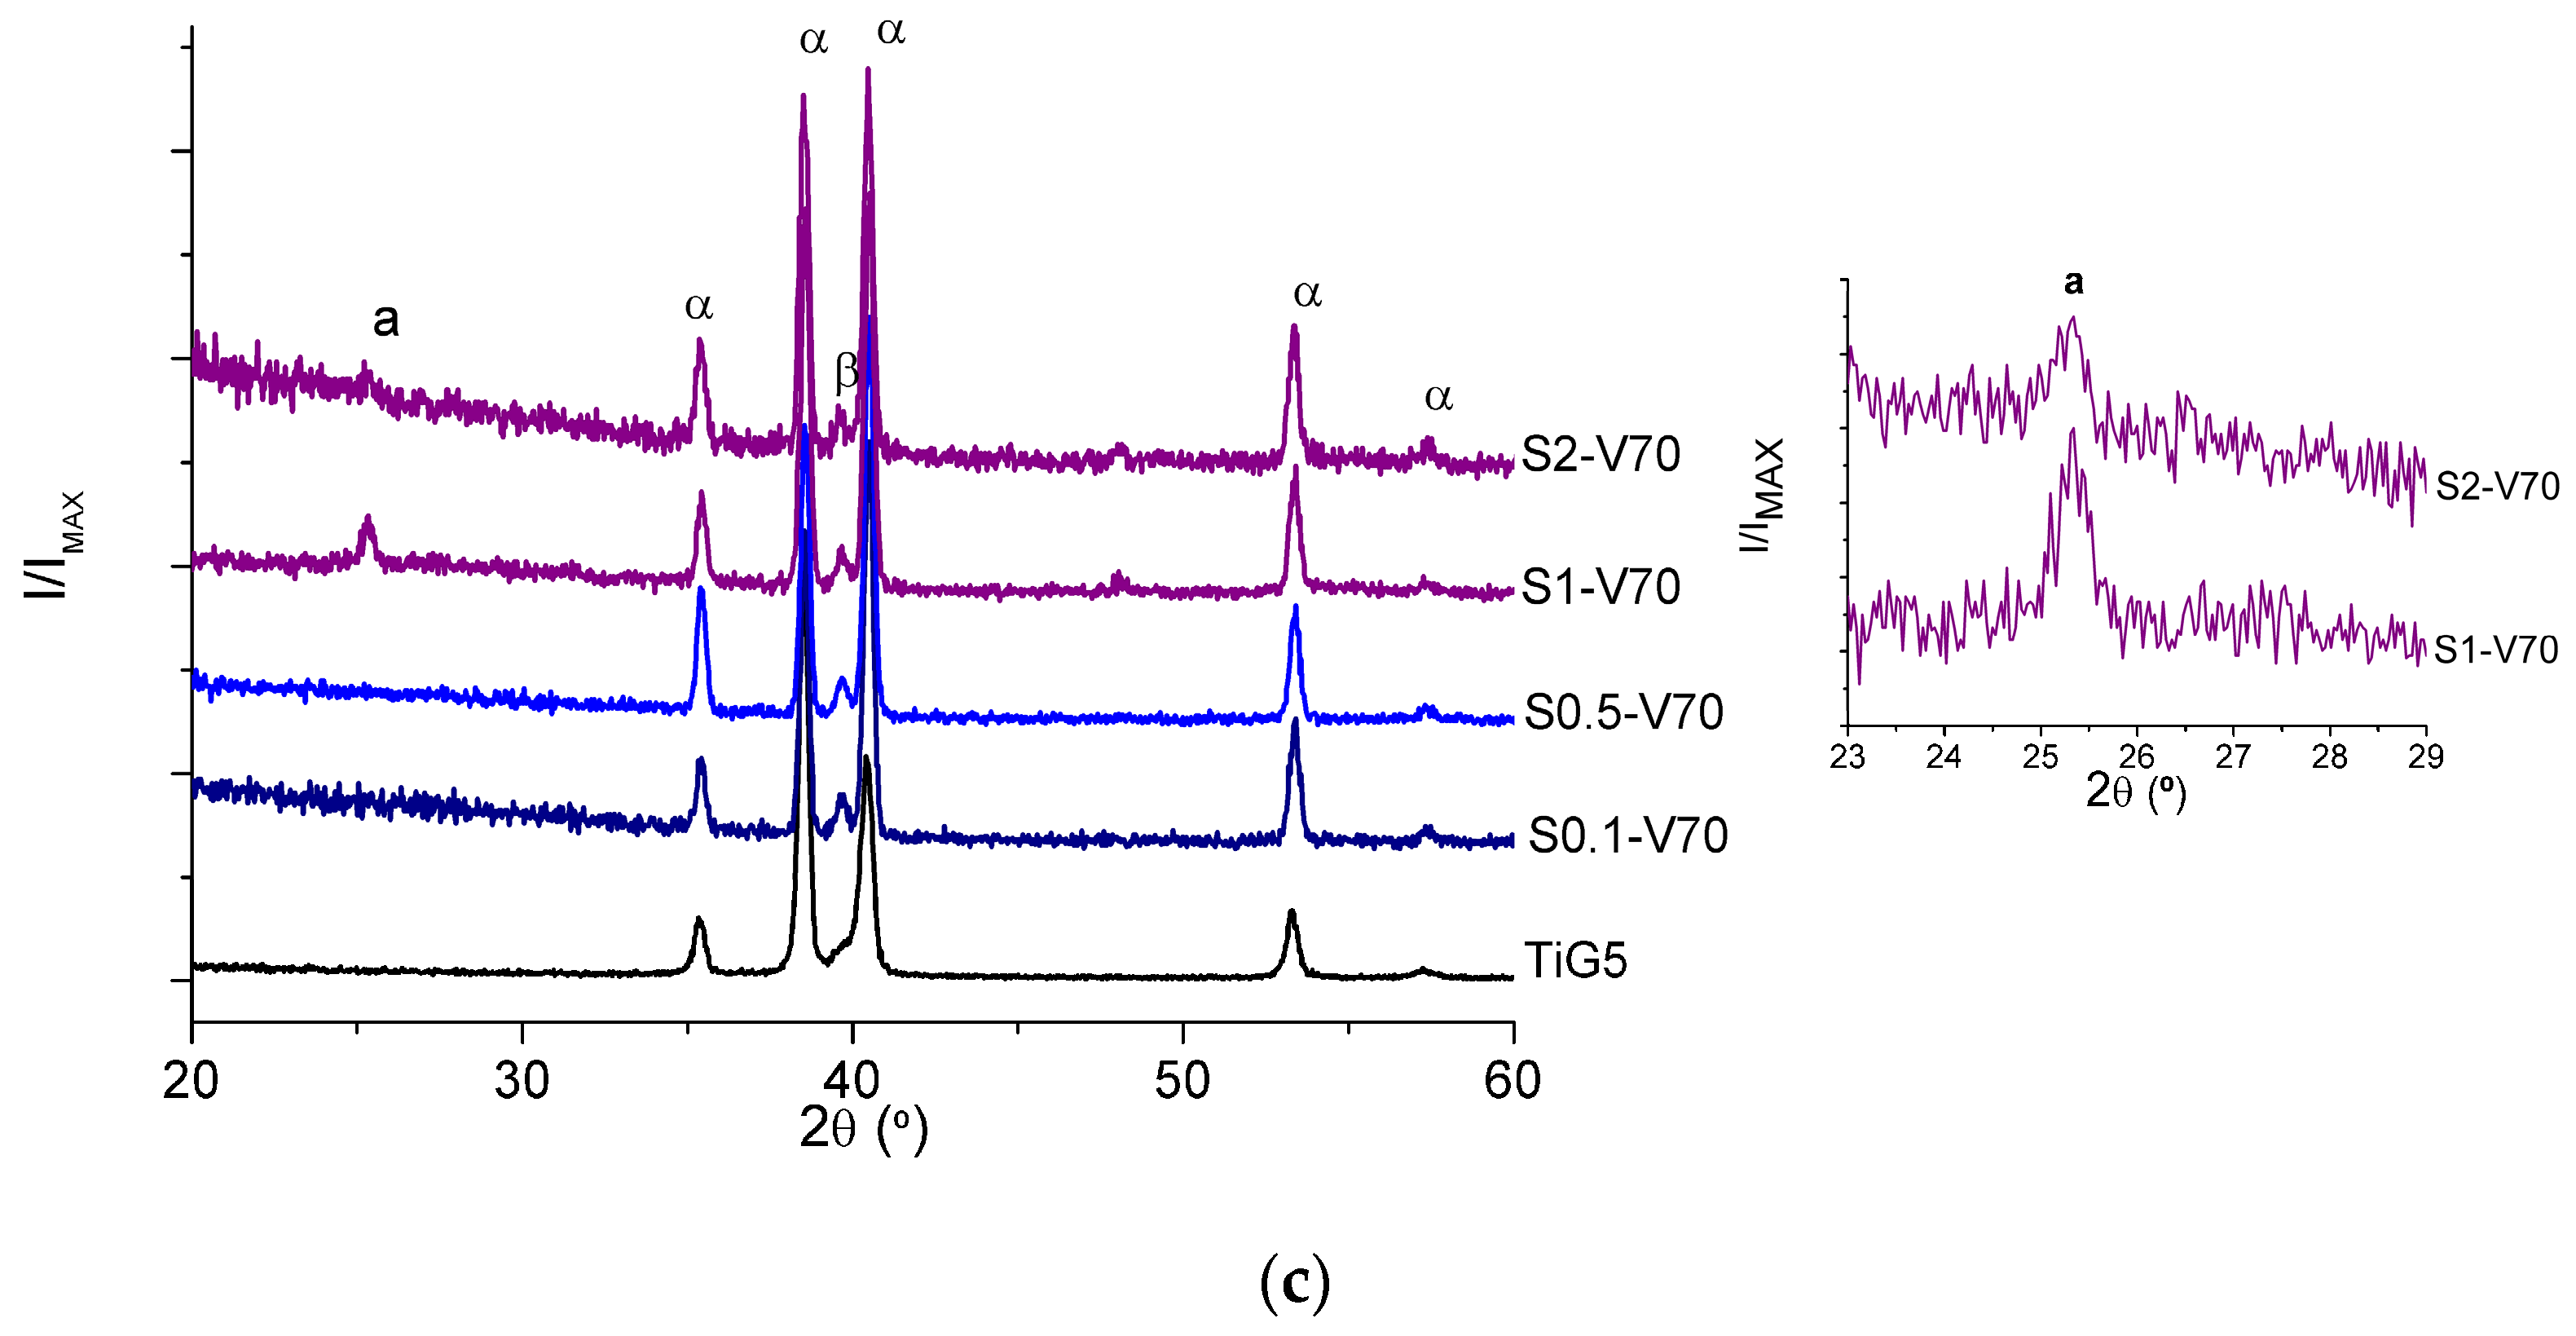
The diffractograms of the samples obtained under glancing incidence of 1° are shown in
Figure 4, grouped by voltages. In
Figure 4a, it can be seen that the diffractograms of the samples obtained at 40 V do not show any anatase or rutile peak. Only the corresponding peaks of the alpha (α) and beta (β) phases of Ti-6Al-4V alloy were observed. The absences of the peaks of crystalline oxide phases may be due to the coatings being completely amorphous or to crystallite sizes being too small to be detected by XRD. The diffractograms of samples obtained at 60 V are shown in
Figure 4b, where in the spectra of S4-V60 sample, anatase peak (101) at 2θ 25.29° is observed. This peak is clearer in the inset, where it is also observed that the anatase peak is not present in the S2-V60 sample. In
Figure 4c, diffractograms of samples obtained at 70 V are shown, where the anatase peak appeared in samples obtained with 1 M and 2 M H
2SO
4 (S1-V70 and S2-V70).
Briefly, with 0.1 M and 0.5 M H2SO4, no crystalline coatings over the entire range of analyzed voltages (20–70 V) were obtained. With 1 M and 2 M H2SO4, crystalline coatings from 70 V were obtained; with 4 M, anatase appeared from 60 V. These results indicate that with an increase in the concentration of sulfuric acid, the voltage at which the transformation of the amorphous coatings to anatase occurs decreases, due to the increase of the conductivity with the concentration, which could favor the crystallization at lower voltage.
Thermal treatments will be necessary to crystallize amorphous coatings obtaining up to 60 V for 4 M H
2SO
4 and 70 V for lower H
2SO
4 concentrations [
27].
Regarding the size of the anatase crystallites in the crystalline coatings (
Table 1), it is known that anatase is a metastable phase whose thermodynamic stability is dependent on the size of the crystallite; the anatase is more stable than rutile when its crystallites are smaller than a critical size, which in this case seems to be larger than 21 nm [
28,
29].
4. Conclusions
The study of the anodic oxidation of Ti-6Al-4V alloy in sulfuric acid in different concentrations as electrolytes at constant voltages of 20 V to 70 V yielded the following conclusions:
Different interference colors of the coatings were obtained according to the applied voltage and the electrolyte used. Despite the differences observed in the colors obtained using different concentrations of the electrolyte, for all cases, the color of the oxides became more intense and tonality differences diminished with the increase of the concentration of H2SO4, especially from 1 M. Additionally, tonality differences diminished at 40 V and 60 V.
With respect to morphology, with all concentrations, porosity was observed in samples surfaces at 60 V, limiting the usable voltage. The lower roughness values (Ra and Rz) were obtained for samples anodizing at 20 V and 40 V.
Regarding the crystalline structure of the oxides, up to 60 V the coating was amorphous, and then starting at 70 V, it began to crystallize to the anatase phase in coatings obtained with 1 M and 2 M H2SO4. An increase in the concentration of H2SO4 decreased the voltage at which the transformation of amorphous to crystalline coatings occurred, and with 4 M H2SO4, the anatase phase appeared at 60 V.
To obtain non-porous, homogeneous, and low roughness coatings to avoid the promotion of blood clots, the voltage to work with is 40 V at a concentration of 1 M sulphuric acid. Those anodizing conditions produce coatings with the most appropriate characteristics for the manufacture of cardiovascular devices.
Acknowledgments
The authors wish to thank the financial support of Consejo Nacional de Investigaciones Científicas y Técnicas (CONICET) and Agencia Nacional de Promoción Científica y Tecnológica (ANPCyT) of Argentina; to Diego Lamas (CITEDEF) for DRX spectras. Ángeles Colaccio thanks to Comité Ejecutivo de Desarrollo e Innovación Tecnológica (CEDIT) of Misiones, Argentina for the scholarship.
Author Contributions
María Laura Vera and Ángeles Colaccio designed and performed the experiments; María Laura Vera, Mario Roberto Rosenberger and Carlos Enrique Schvezov analyzed the data; Mario Roberto Rosenberger, Carlos Enrique Schvezov and Alicia Esther Ares contributed reagents/materials/analysis tools; María Laura Vera and Alicia Esther Ares wrote the paper.
Conflicts of Interest
The authors declare no conflict of interest.
References
- Rosenberger, M.R.; Amerio, O.; Schvezov, C. Optimizing of the Design of a Prosthetic Heart Valve with Three Leaves. In Proceedings of the Forth International Congress of Cardiology on the Internet, Paraná, Argentina, 1 September 2005.
- Amerio, O.N.; Rosenberger, M.R.; Favilla, P.C.; Alterach, M.A.; Schvezov, C.E. Prótesis valvular cardiaca trivalva asociada a última generación de materiales hemocompatibles. Rev. Argent. Cir. Cardiovasc. 2006, 4, 70–76. (In Spanish) [Google Scholar]
- Huang, N.; Yang, P.; Leng, Y.X.; Chen, J.Y.; Sun, H.; Wang, J.; Wang, G.J.; Ding, P.D.; Xi, T.F.; Leng, Y. Hemocompatibility of titanium oxide films. Biomaterials 2003, 24, 2177–2187. [Google Scholar] [CrossRef]
- Schvezov, C.E.; Alterach, M.A.; Vera, M.L.; Rosenberger, M.R.; Ares, A.E. Characteristics of haemocompatible TiO2 nano-films produced by the sol-gel and anodic oxidation techniques. JOM 2010, 62, 84–87. [Google Scholar] [CrossRef]
- Vera, M.L.; Schuster, J.; Rosenberger, M.R.; Bernard, H.; Schvezov, C.E.; Ares, A.E. Evaluation of the haemocompatibility of TiO2 coatings obtained by anodic oxidation of Ti-6Al-4V. Procedia Mater. Sci. 2015, 8, 366–374. [Google Scholar] [CrossRef]
- Leyens, C.; Manfres, P. Titanium and Titanium Alloys: Fundamentals and Applications; Wiley-VCH: Weinheim, Germany, 2003. [Google Scholar]
- Lutjering, G.; Williams, J.C. Titanium; Springer: Berlin, Germany, 2007. [Google Scholar]
- Khan, M.A.; Williams, R.L.; Williams, D.F. Conjoint corrosion and wear in titanium alloys. Biomaterials 1999, 20, 765–772. [Google Scholar] [CrossRef]
- Diamanti, M.V.; Pedeferri, M.P. Effect of anodic oxidation parameters on the titanium oxides formation. Corros. Sci. 2007, 49, 939–948. [Google Scholar] [CrossRef]
- Alajdem, A. Review—Anodic oxidation of titanium and its alloys. J. Mater. Sci. 1973, 8, 688–704. [Google Scholar]
- Vera, M.L.; Ares, A.E.; Lamas, D.G.; Schvezov, C.E. Preparación y caracterización de recubrimientos de dióxido de titanio obtenidos por oxidación anodica de la aleación Ti-6Al-4V. Primeros resultados. Anal. AFA 2008, 20, 178–183. (In Spanish) [Google Scholar]
- Maitz, M.F.; Pham, M.-T.; Wieser, E. Blood compatibility of titanium oxides with various crystal structure and element doping. J. Biomater. Appl. 2003, 17, 303–319. [Google Scholar] [CrossRef] [PubMed]
- Vera, M.L. Obtención y Caracterización de Películas Hemocompatibles de TiO2. Ph.D. Thesis, Universidad Nacional de General San Martín, Buenos Aires, Argentina, March 2013. [Google Scholar]
- Song, H.J.; Park, S.H.; Jeong, S.H.; Park, Y.J. Surface characteristics and bioactivity of oxide films formed by anodic spark oxidation on titanium in different electrolytes. J. Mater. Process. Technol. 2009, 209, 864–870. [Google Scholar] [CrossRef]
- Sul, Y.-T.; Johansson, C.B.; Jeong, Y.; Albrektsson, T. The electrochemical oxide growth behaviour on titanium in acid and alkaline electrolytes. Med. Eng. Phys. 2001, 23, 329–346. [Google Scholar] [CrossRef]
- Liu, X.; Chu, P.K.; Ding, C. Surface modification of titanium, titanium alloys, and related materials for biomedical applications. Mater. Sci. Eng. R 2004, 47, 49–121. [Google Scholar] [CrossRef]
- Kuromoto, N.K.; Simao, R.A.; Soares, G.A. Titanium oxide films produced on commercially pure titanium by anodic oxidation with different voltages. Mater. Charact. 2007, 58, 114–121. [Google Scholar] [CrossRef]
- Sharma, A.K. Anodizing titanium for space applications. Thin Solid Films 1992, 208, 48–54. [Google Scholar] [CrossRef]
- Macdonald, D.D. The history of the point defect model for the passive state: A brief review of film growth aspects. Electrochim. Acta 2011, 56, 1761–1772. [Google Scholar] [CrossRef]
- Capek, D.; Gigandet, M.-P.; Masmoudi, M.; Wery, M.; Banakh, O. Long-time anodisation of titanium in sulphuric acid. Surf. Coat. Technol. 2008, 202, 1379–1384. [Google Scholar] [CrossRef]
- Darling, H.E. Conductivity of sulfuric acid solutions. J. Chem. Eng. 1964, 9, 421–426. [Google Scholar] [CrossRef]
- Yang, B.; Uchida, M.; Kim, H.-M.; Zhang, X.; Kokubo, T. Preparation of bioactive titanium metal via anodic oxidation treatment. Biomaterials 2004, 25, 1003–1010. [Google Scholar] [CrossRef]
- Vera, M.L.; Ares, A.E.; Lamas, D.G.; Rosenberger, M.R.; Schvezov, C.E. Influencia de la Textura y de la Microestructura de la Aleación Ti-6Al-4V en los Óxidos Obtenidos por Oxidación Anódica. In Proceedings of the Anales 9° Congreso Internacional de Metalurgia y Materiales SAM-CONAMET, Buenos Aires, Argentina, 19 October 2009; pp. 1951–1956. (In Spanish)
- Vera, M.L.; Alterach, M.A.; Rosenberger, M.R.; Lamas, D.G.; Schvezov, C.E.; Ares, A.E. Characterization of TiO2 nanofilms obtained by sol-gel and anodic oxidation. Nanomaterials 2014, 4, 1–11. [Google Scholar] [CrossRef]
- Masahashi, N.; Mizukoshi, Y.; Semboshi, S.; Ohtsu, N. Enhanced photocatalytic activity of rutile TiO2 prepared by anodic oxidation in a high concentration sulfuric acid electrolyte. Appl. Catal. B 2009, 9, 255–261. [Google Scholar] [CrossRef]
- Kim, K.-H.; Ramaswamy, N. Electrochemical surface modification of titanium in dentistry. Dent. Mater. J. 2009, 28, 20–36. [Google Scholar] [CrossRef] [PubMed]
- Vera, M.L.; Rosenberger, M.R.; Schvezov, C.E.; Ares, A.E. Fabrication of TiO2 crystalline coatings by combining Ti-6Al-4V anodic oxidation and heat treatments. Int. J. Biomater. 2015, 2015, 395657. [Google Scholar] [CrossRef] [PubMed]
- Chen, Y.; Kang, K.S.; Yoo, K.H.; Jyoti, N.; Kim, J. Cause of slow phase transformation of TiO2 nanorods. J. Phys. Chem. C 2009, 113, 19753–19755. [Google Scholar] [CrossRef]
- Li, W.; Ni, C.; Lin, H.; Huang, C.P.; Shah, S.I. Size dependence of thermal stability of TiO2 nanoparticles. J. Appl. Phys. 2004, 96, 6663–6668. [Google Scholar] [CrossRef]
© 2017 by the authors. Licensee MDPI, Basel, Switzerland. This article is an open access article distributed under the terms and conditions of the Creative Commons Attribution (CC BY) license ( http://creativecommons.org/licenses/by/4.0/).


