Development of Algae Guard Façade Paint with Statistical Modeling under Natural Phenomena


Abstract
1. Introduction
2. Material and Methods
2.1. Chemicals Used
- Reverse Osmosis Treated Water, TDS 0.01, Hardness 4;
- Dispex A-40, Dispersant, solution of an ammonium salt of an acrylic polymer in water, BASF, Ludwigshafen, Germany;
- Magnesium Silicate, 65-micron particle size, Shaheen grinding mills, Lahore, Pakistan;
- Acrysol TT 615, Hydrophobically Modified Anionic Thickener, Rohm and Haas, Philadelphia, PA, USA;
- Zinc Oxide, Bruggemann chemical, Heilbronn, Germany;
- KA-100, Anatase Titanium Dioxide, Kimix, Hangzhou, China;
- TiO2 2310, Rutile Titanium Dioxide, Kronos titanium, Dallas, TX, USA;
- Propylene Glycol, Dow, Horgen, Switzerland;
- Wacker 1306, Emulsion of a Polysiloxane Modified with functional Silicone Resin, Wacker, Munich, Germany;
- DisplairCF-245, Mineral Hydrocarbons Defoamer, Whitebirk Ind. Estate, Blackburn, UK;
- AMP-95, 95%, 2-Amino-2-Methyl-1-Propanol Solution, Angus Chemie, GmbH, Ibbenbüren, Germany;
- PST-50A, Styrene Acrylic Copolymer Emulsion, Organic Kimya, Istanbul, Turkey.
2.2. Preparation of Paint Sample
2.3. Experimental Observations
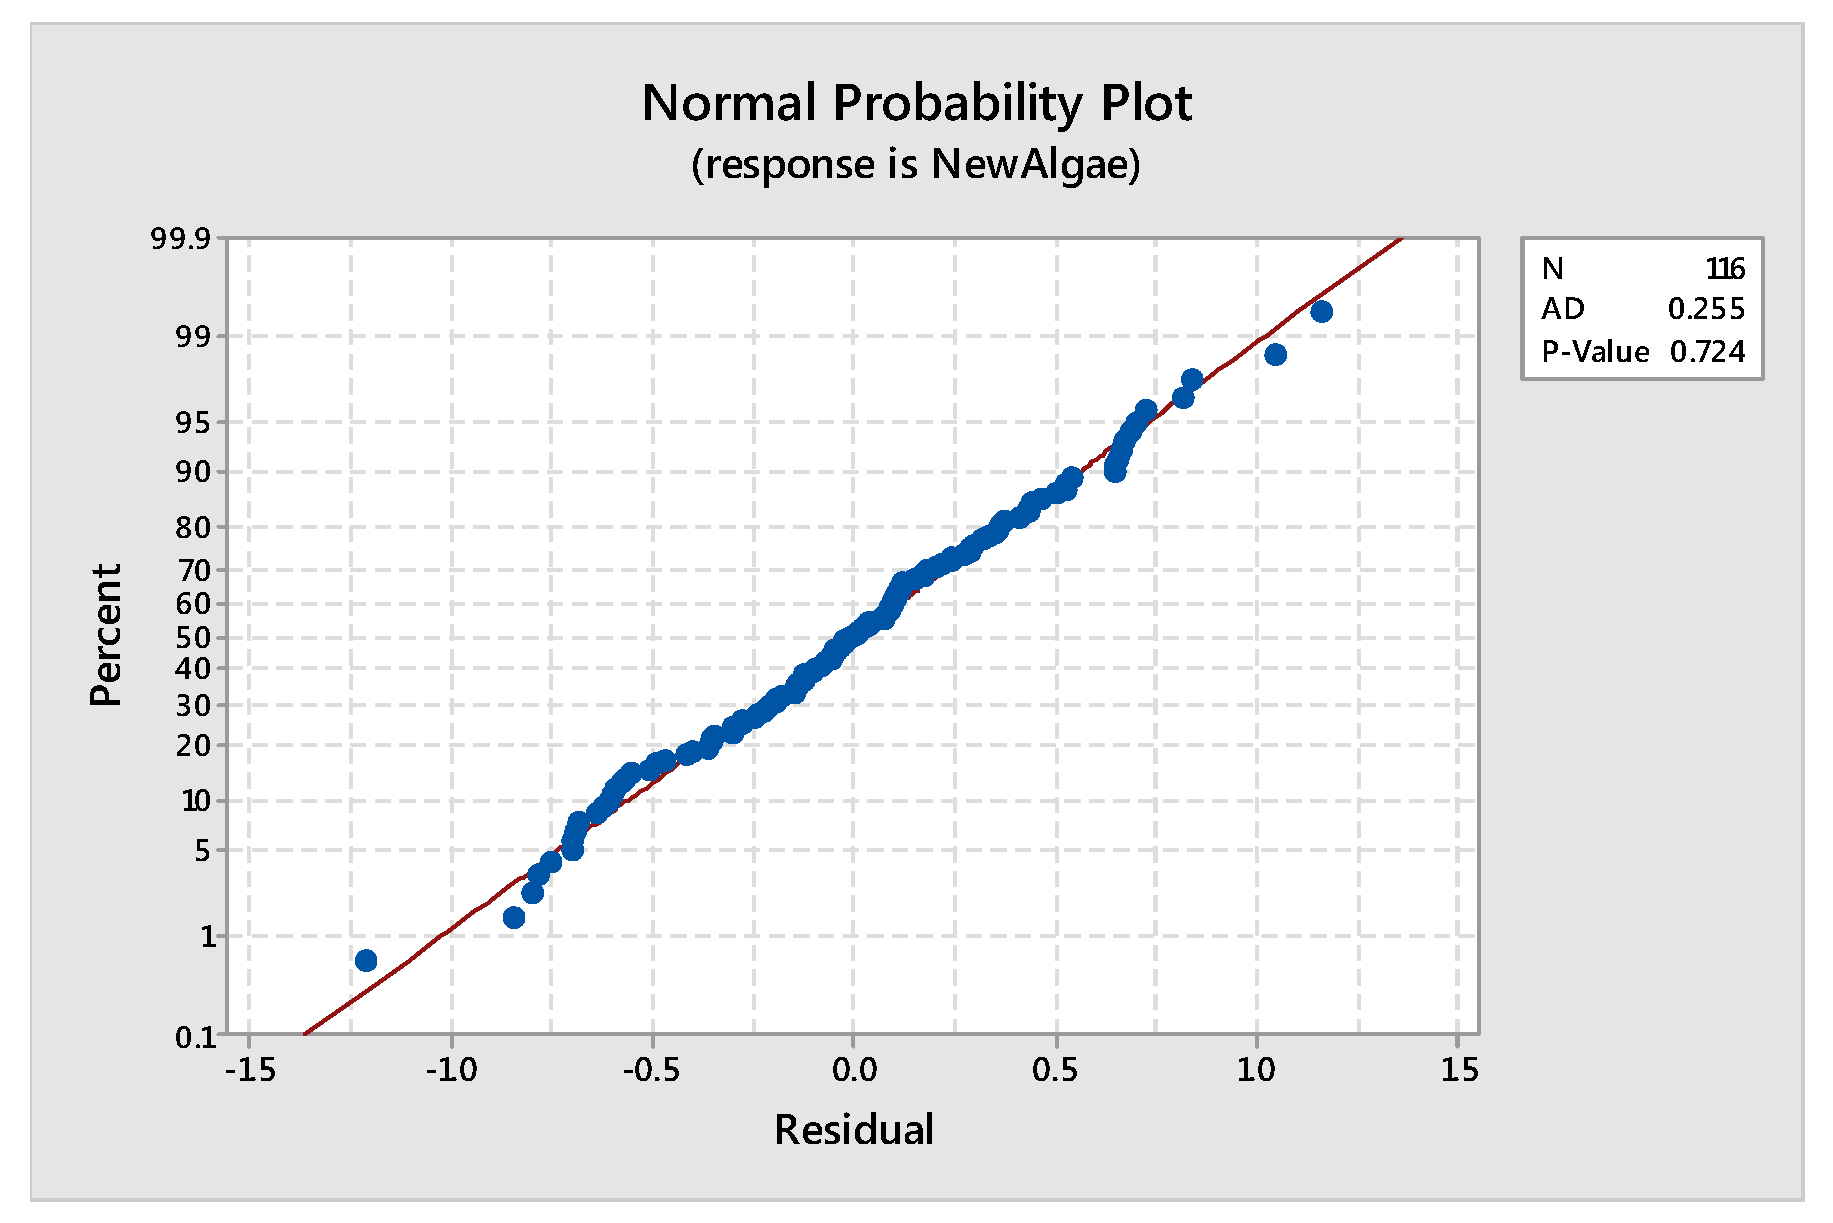
2.3.1. Anderson Darling’s test for Normality
2.3.2. The Coefficient of Determination
2.3.3. The Adjusted R-square (R2-Adj)
2.3.4. Mallows (1973) Cp-values
2.3.5. The Standard Error of Regression
2.3.6. Akaike Information Criteria (AIC)
2.3.7. The Model
3. Results, Analysis and Discussion
Algae growth = anti log (−2.7997) = 0.002%
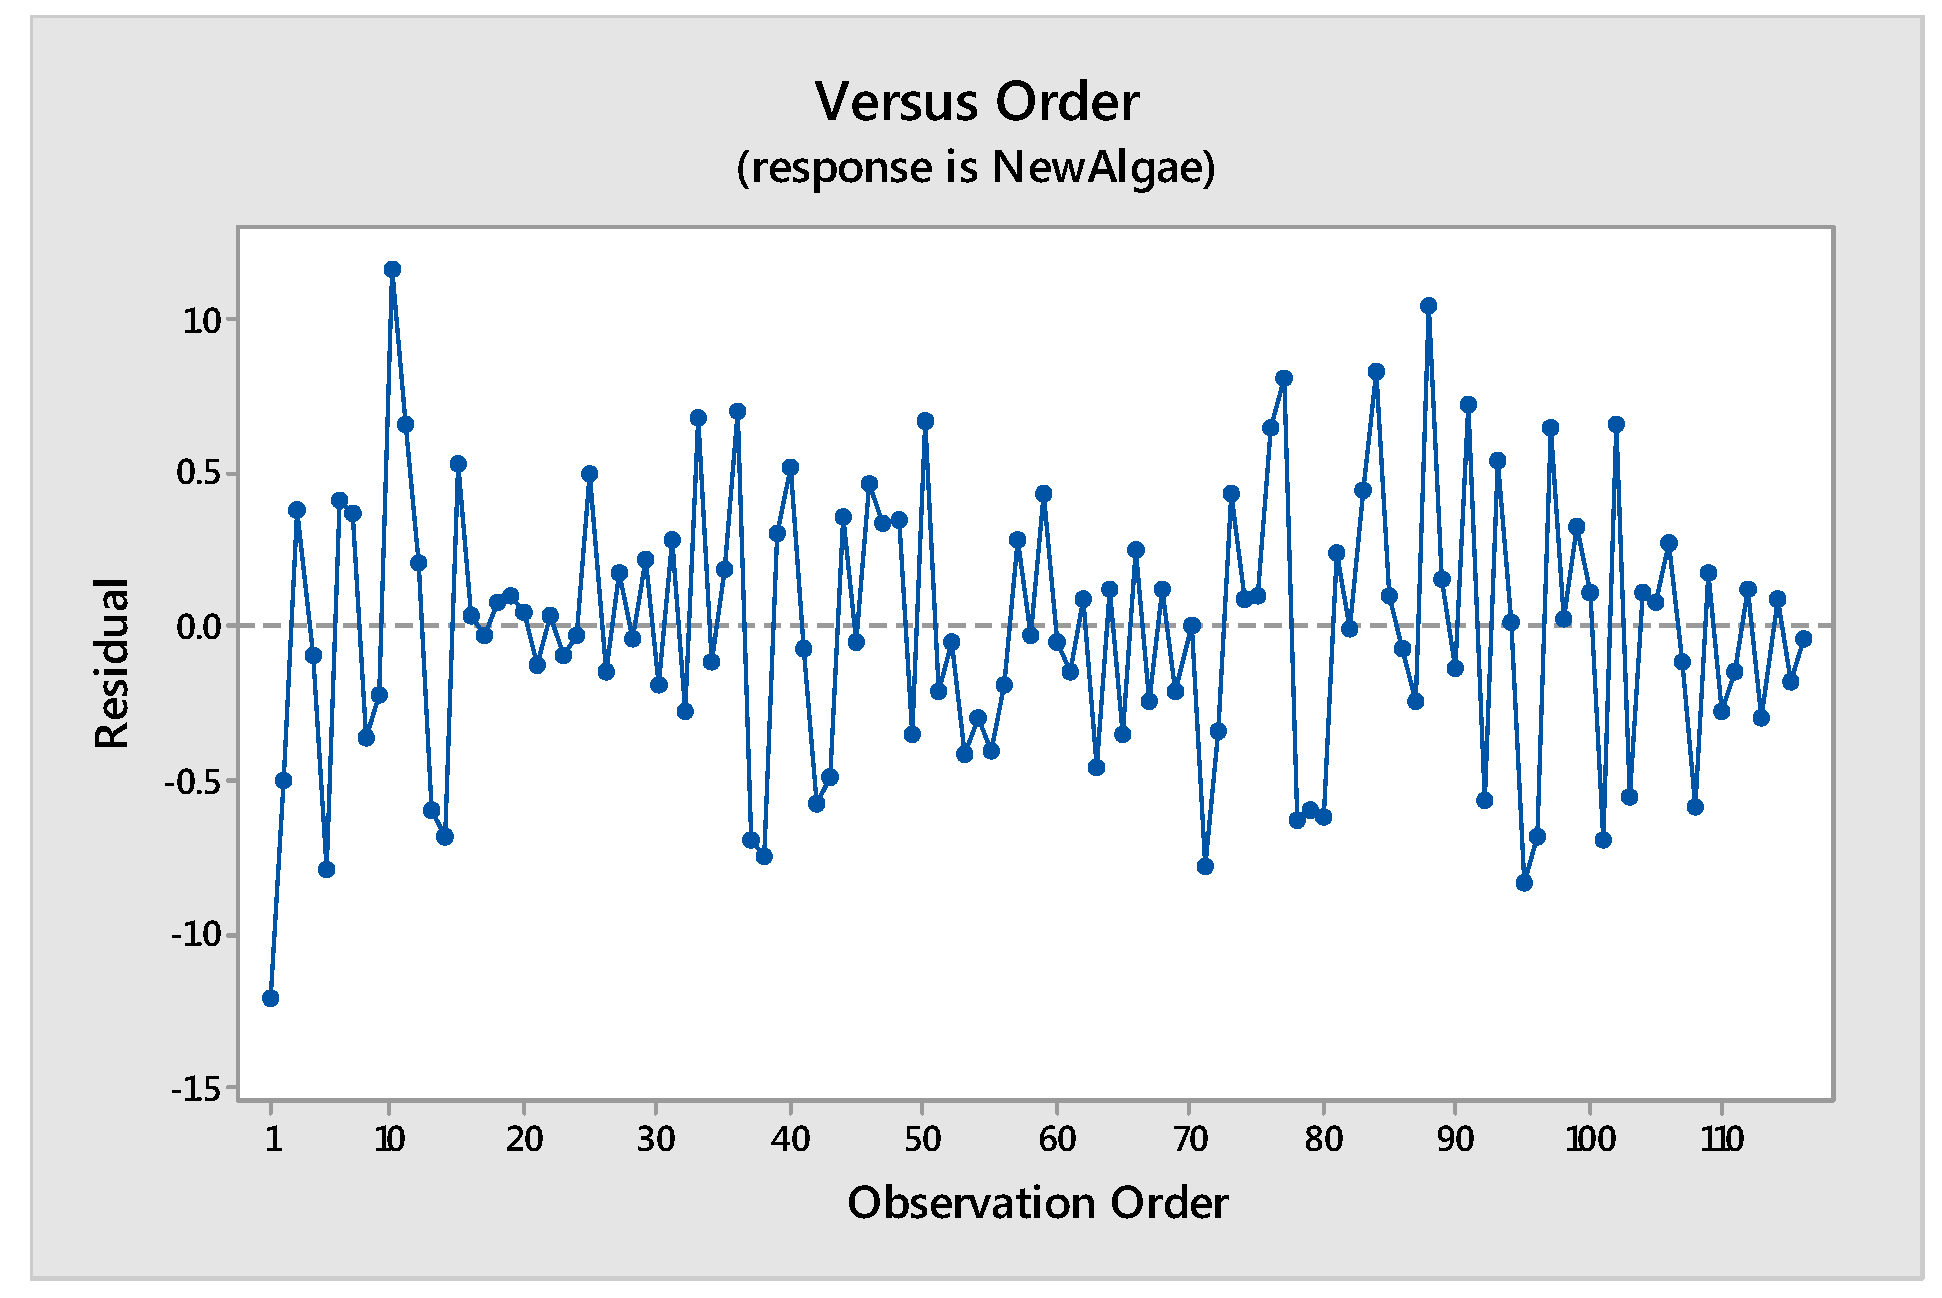
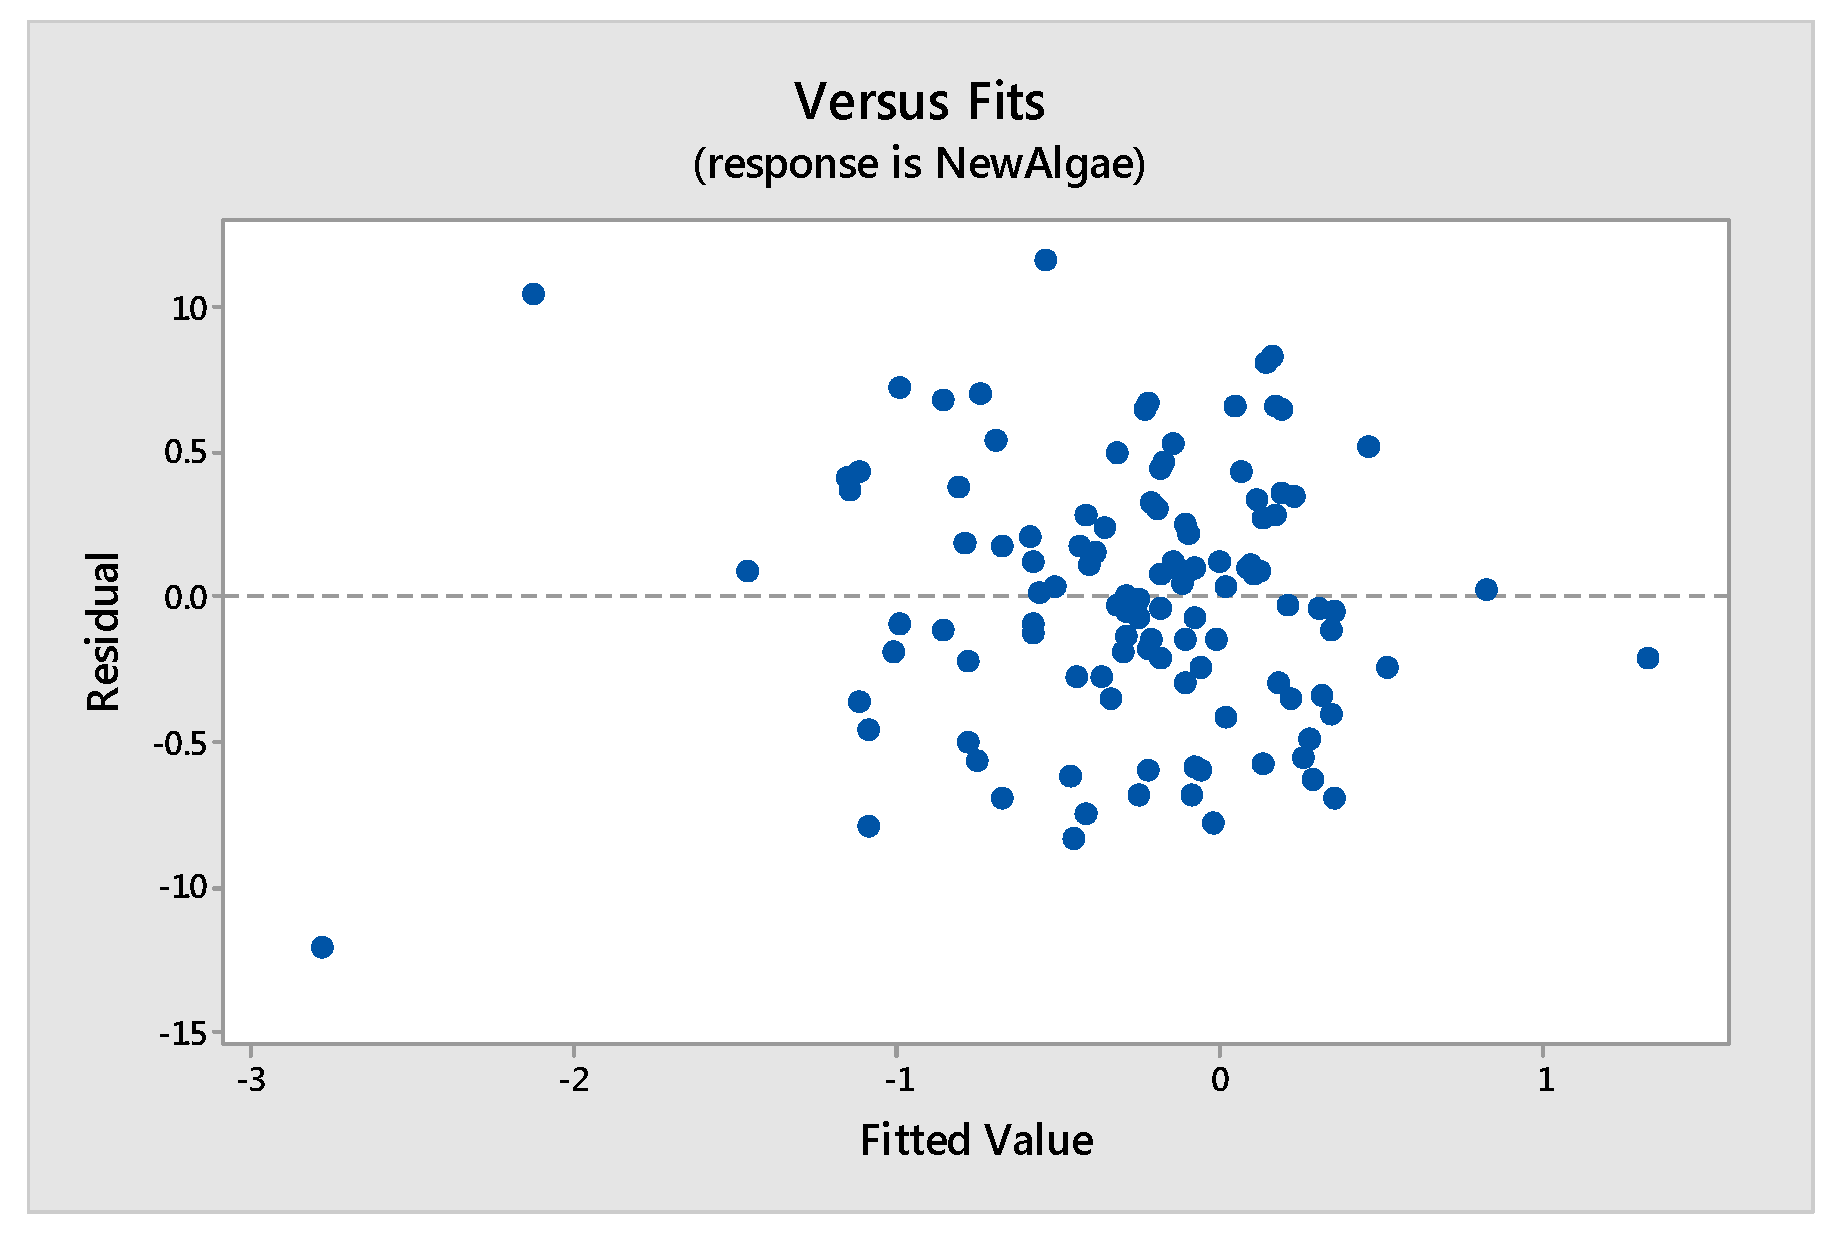
Tools to Test the Validity of the Model: Assumptions of the Model
4. Conclusions
5. Future Work
Author Contributions
Funding
Acknowledgment
Conflicts of Interest
Acronyms
| ROW | Reverse Osmosis Treated Water |
| DIS | Dispex A-40, Dispersant, solution of an ammonium salt of an acrylic polymer in water |
| MS | Magnesium Silicate |
| HAT | Acrysol TT 615, Hydrophobically Modified Anionic Thickener |
| ZO | Zinc oxide |
| ATD | KA-100, Anatase Titanium Dioxide |
| RTD | TiO2 2310, Rutile Titanium Dioxide |
| PG | Propylene Glycol |
| PMS | Wacker 1306, Emulsion of a Polysiloxane Modified with functional Silicone Resin |
| MHD | DisplairCF-245, Mineral Hydrocarbons Defoamer |
| AMP | AMP-95, 95%, 2-Amino-2-Methyl-1-Propanol Solution |
| SAC | PST-50A, Styrene Acrylic Copolymer Emulsion |
References
- Morgans, W.M. Outlines of Paint Technology, 3rd ed.; Griffin: London, UK, 1990. [Google Scholar]
- Gaylarde, C.C.; Morton, L.G. Deteriogenic biofilms on buildings and their control. Biofouling 1999, 14, 59–74. [Google Scholar] [CrossRef]
- Lakna. Difference between Algae and Fungi. Available online: http://pediaa.com/difference-between-algae-and-fungi (accessed on 26 November 2018).
- Barsanti, L.; Gualtieri, P. Algae: Anatomy, Biochemistry, and Biotechnology, 2nd ed.; CRC Press: Boca Raton, FL, USA, 2006. [Google Scholar]
- Leavitt, P.R.; Findlay, D.L.; Hall, R.I.; Smol, J.P. Algal responses to dissolved organic carbon loss and pH decline during whole-lake acidification: Evidence from paleolimnology. Limnol. Oceanogr. 1999, 44, 757–773. [Google Scholar] [CrossRef]
- Pendersen, M.F.; Hensen, P.J. Effects of high pH on the growth and survival of six marine heterotrophic protests. Mar. Ecol. Prog. Ser. 2003, 260, 33–41. [Google Scholar] [CrossRef]
- Nakajima, M.; Hokoi, S.; Ogura, D.; Iba, C. Relationship between environmental conditions and algal growth on the exterior walls of the ninna-ji temple, Kyoto. Energy Procedia 2015, 78, 1329–1334. [Google Scholar] [CrossRef]
- Banov, A. Paints and Coatings Handbook for Contractors, Architects, and Builders, 2nd ed.; Structures Publishing Company: Farmington, MI, USA, 1973. [Google Scholar]
- Falconer, I.R. Potential impact on human health of toxic cyanobacteria. Phycologia 1996, 35, 6–11. [Google Scholar] [CrossRef]
- Chorus, I.; Bartram, J. Toxic Cyanobacteria in Water: A Guide to the Public Health Consequences, Monitoring and Management, 1st ed.; CRC Press: London, UK, 1999. [Google Scholar]
- Yebra, D.M.; Kill, S.; Darn-Johansen, K. Antifouling technology—Past, present and future steps towards efficient and environmentally friendly antifouling coatings. Prog. Org. Coat. 2004, 50, 75–104. [Google Scholar] [CrossRef]
- Bruno, D.W.; Ellis, A.E. Histopathological effects in Atlantic salmon, Salmo salar L., attributed to the use of tributyltin antifoulant. Aquacullure 1988, 72, 15–20. [Google Scholar] [CrossRef]
- Lee, H.B.; Lim, L.C.; Cheong, L. Observations on the use of antifouling paint in netcage fish farming in Singapore. Singap. J. Prim. Ind. 1985, 13, 1–12. [Google Scholar]
- Konstantinou, I.K. Antifouling Paint Biocides; Springer: Heidelberg, Germany, 2006. [Google Scholar]
- Giacomazzi, S.; Cochet, N. Environmental impact of diuron transformation: A review. Chemsophere 2004, 56, 1021–1032. [Google Scholar] [CrossRef] [PubMed]
- Diuron Mutagenicity Data; US Environmental Protection Agency (USEPA): Washington, DC, USA, 1986.
- Sorensen, S.R.; Albers, C.N.; Aamand, J. Rapid mineralization of the phenylurea herbicide diuron by Variovorax sp. strain SRS16 in pure culture and within a two-member consortium. Appl. Environ. Microbiol. 2008, 74, 2332–2340. [Google Scholar] [CrossRef] [PubMed]
- Wang, Z.; Wang, Y.; Gong, F.; Zhang, J.; Hong, Q.; Li, S. Biodegradation of carbendazim by a novel actinobacterium Rhodococcusjialingiae djl-6-2. Chemosphere 2010, 81, 639–644. [Google Scholar] [CrossRef] [PubMed]
- Amanullah, M.; Hari, B.Y. Evaluation of carbamate insecticides as chemotherapeutic agents for cancer. Indian J. Cancer 2011, 48, 74–79. [Google Scholar] [CrossRef] [PubMed]
- Guthery, E.; Seal, L.A.; Anderson, E.L. Zinc pyrithione in alcohol based products for skin antisepsis: Persistence of antimicrobial effects. Am J. Infect. Control 2005, 33, 15–22. [Google Scholar] [CrossRef] [PubMed]
- Cooney, J.J. Effects of polyurethane foams on microbial growth in fuel-water systems. Appl. Microbiol. 1969, 17, 227–231. [Google Scholar] [PubMed]
- Turley, P.A.; Fenn, R.J.; Ritter, J.C. Pyrithiones as antifoulants: Environmental chemistry and preliminary risk assessment. Biofouling 2000, 15, 175–182. [Google Scholar] [CrossRef] [PubMed]
- Gibson, W.T.; Hardy, W.S.; Groom, M.H. The effect and mode of action of zinc pyrithione on cell growth. II. In vitro studies. Food Chem. Toxicol. 1985, 23, 103–110. [Google Scholar] [CrossRef]
- Santa, A.M.; Pozuelo, J.M.; López, A.; Sanz, F. Toxicity of potential irritants in mammalian cells in vitro. Ecotoxicol. Environ. Saf. 1996, 34, 56–58. [Google Scholar]
- Fonseca, A.J.; Pina, F.; Macedo, M.F.; Leal, N.; Romanowska-Deskins, A.; Laiz, L.; Gómez-Bolea, A.; Saiz-Jimeneze, C. Anatase as an alternative application for preventing biodeterioration of mortars: Evaluation and comparison with other biocides. Int. Biodeterior. Biodegrad. 2010, 64, 388–396. [Google Scholar] [CrossRef]
- Markowska-Szczupak, A.; Ulfig, K.; Morawski, A.W. The application of titanium dioxide for deactivation of bio-particulates: An overview. Catal. Today 2011, 169, 249–257. [Google Scholar] [CrossRef]
- Caballero, L.; Whitehead, K.A.; Allen, N.S.; Verran, J. Photo inactivation of Escherichia coli on acrylic paint formulations using fluorescent light. Dyes Pigm. 2010, 86, 56–62. [Google Scholar] [CrossRef]
- Moafi, H.F.; Shojaie, A.F.; Zanjanchi, M.A. Semiconductor-assisted self-cleaning polymeric fibers based on zinc oxide nanoparticles. J. Appl. Polym. Sci. 2011, 121, 3641–3650. [Google Scholar] [CrossRef]
- Peng, Y.; Ji, J.; Zhao, X.; Wan, H.; Chen, D. Preparation of ZnO Nano powder by a novel ultrasound assisted non-hydrolytic sol–gel process and its application in photo-catalytic degradation of C.I. Acid Red 249. Powder Technol. 2013, 233, 325–330. [Google Scholar] [CrossRef]
- Roach, P.; Shirtcliffe, N.J.; Newton, M.I. Progress in super hydrophobic surface development. Soft Matter 2008, 4, 224–240. [Google Scholar] [CrossRef]
- Grant, C.; Hunter, C.A.; Flannigan, B.; Bravery, A.F. The moisture requirements of moulds isolated from domestic dwellings. Int. Biodeterior. 1989, 25, 259–284. [Google Scholar] [CrossRef]
- Ezeonu, I.M.; Noble, J.A.; Simmons, R.B.; Price, D.L.; Crow, S.A.; Ahearn, D.G. Effect of relative humidity on fungal colonization of fiber glass insulation. Appl. Environ. Microbiol. 1994, 60, 2149–2151. [Google Scholar] [PubMed]
- Viitanen, H. Factors affecting the development of biodeterioration in wooden constructions. Mater. Struct. 1994, 27, 483–493. [Google Scholar] [CrossRef]
- Chang, J.C.; Foarde, K.K.; Vanosdell, D.W. Growth evaluation of fungi (Penicillium and Aspergillus spp.) on ceiling tiles. Atmos. Environ. 1995, 29, 2331–2337. [Google Scholar] [CrossRef]
- Chang, J.C.; Foarde, K.K.; VanOsdell, D.W. Assessment of fungal (Penicillium chrysogenum) growth on three HVAC duct materials. Environ. Int. 1996, 22, 425–431. [Google Scholar] [CrossRef]
- Flannigan, B.; Morey, P.R. Control of Moisture Problems Affecting Biological Indoor Air Quality; International Society of indoor Air Quality and Climate: Ottawa, ON, Canada, 1996. [Google Scholar]
- Foarde, K.K.; VanOsdell, D.W.; Chang, J.C.S. Evaluation of fungal growth on berglass duct materials for various moisture, soil, use, and temperature conditions. Indoor Air 1996, 6, 83–92. [Google Scholar] [CrossRef]
- Mallows, C.L. Some comments on CP. Technometrics 1973, 15, 661–675. [Google Scholar]
- Akaike, H. Information theory and an extension of maximum likelihood principle. In Proceedings of the 2nd International Symposium on Information Theory, Tsahkadsor, Armenia, 2–8 September 1971; Petrov, B.N., Caski, F., Eds.; Akadémiai Kiado: Budapest, Hungary, 1973; pp. 267–281. [Google Scholar]
- ASTM D1210–05 Standard Test Method for Fineness of Dispersion of Pigment-Vehicle Systems by Hegman-Type Gage; ASTM International: Bethesda, MD, USA, 2010.
- ASTM D3719-00 Standard Test Method for Quantifying Dirt Collection on Coated Exterior Panels; ASTM International: Bethesda, MD, USA, 2000.
- Rasband, W. ImageJ. U.S. National Institutes of Health. Available online: https://imagej.nih.gov/ij/ (accessed on 26 November 2018).
- Chatterjee, S.; Hadi, A.S. Regression Analysis by Example, 4th ed.; John Wiley & Sons: Hoboken, NJ, USA, 2015. [Google Scholar]
- Mendenhall, W.; Sincich, T. Simple linear regression. In A Second Course in Statistics: Regression Analysis, 7th ed.; Prentice Hall: Boston, MA, USA, 2012; pp. 104–105. [Google Scholar]


| Serial No. | Ingredients | Quantity (g) |
|---|---|---|
| 1 | ROW | 27.16 |
| 2 | DIS | 0.84 |
| 3 | AMP | 0.60 |
| 4 | MS | 10.00 |
| 5 | ZO | 5.00 |
| 6 | ATD | 20.00 |
| 7 | RTD | 7.00 |
| Total | – | 70.60 |
| Serial No. | Ingredients | Quantity (g) |
|---|---|---|
| 1 | Nano mill slurry | 70.60 |
| 2 | SAC | 20.00 |
| 3 | PG | 6.00 |
| 4 | PMS | 2.00 |
| 5 | HAT | 0.84 |
| 6 | MHD | 0.56 |
| Total | – | 100.00 |
| Date | Temperature (°C) | Humidity (%) | Newly Developed Paint | Conventional Paint A | Conventional Paint B | Conventional Paint C | ||||
|---|---|---|---|---|---|---|---|---|---|---|
| Dc Value | Algae % | Dc Value | Algae % | Dc Value | Algae % | Dc Value | Algae % | |||
| 23/05/2016 | 32.54 | 47.22 | 100.8 | 0.00 | 98.6 | 0.06 | 99.3 | 0.21 | 100.6 | 0.08 |
| 01/06/2016 | 32.96 | 43.33 | 98.7 | 0.05 | 98.7 | 0.75 | 97.7 | 0.46 | 98.1 | 0.58 |
| 11/06/2016 | 33.09 | 61.78 | 98.3 | 0.37 | 98.2 | 0.19 | 97 | 0.56 | 97.7 | 0.38 |
| 21/06/2016 | 33.14 | 66.44 | 98.66 | 0.08 | 98.24 | 0.68 | 96.48 | 0.04 | 97.7 | 0.54 |
| 01/07/2016 | 32.16 | 76.22 | 98.03 | 0.01 | 97.72 | 0.11 | 96.43 | 0.03 | 97.61 | 0.05 |
| 11/07/2016 | 30.47 | 79.22 | 98.14 | 0.18 | 98.04 | 0.25 | 96.35 | 0.35 | 97.31 | 0.71 |
| 21/07/2016 | 29.44 | 80.6 | 97.85 | 0.17 | 97.31 | 0.93 | 96.49 | 0.20 | 97.03 | 0.28 |
| 01/08/2016 | 29.87 | 78 | 97.91 | 0.03 | 97.47 | 0.04 | 96.11 | 1.39 | 97.08 | 0.05 |
| 11/08/2016 | 29.78 | 74 | 98.05 | 0.10 | 97.63 | 0.07 | 96.21 | 0.50 | 96.93 | 0.12 |
| 21/08/2016 | 30.64 | 84.5 | 97.83 | 4.22 | 97.68 | 1.27 | 96.1 | 0.95 | 96.6 | 2.60 |
| 01/09/2016 | 29.79 | 69.25 | 96.88 | 5.17 | 96.8 | 9.55 | 95.64 | 13.19 | 96.33 | 7.08 |
| 10/09/2016 | 30.93 | 70.3 | 96.62 | 0.41 | 96.55 | 0.48 | 95.46 | 0.52 | 96.2 | 1.28 |
| 21/09/2016 | 31 | 75 | 96.99 | 0.15 | 96.96 | 0.36 | 95.43 | 0.16 | 96.35 | 1.62 |
| 01/10/2016 | 28.07 | 70.44 | 96.16 | 0.17 | 96.09 | 0.61 | 94.3 | 0.93 | 95.62 | 0.45 |
| 11/10/2016 | 29.59 | 70.44 | 96.1 | 2.40 | 96 | 3.53 | 94.48 | 3.15 | 95.42 | 6.73 |
| 21/10/2016 | 25.61 | 76.2 | 96.49 | 1.12 | 96.38 | 2.02 | 94.36 | 1.62 | 95.49 | 0.51 |
| 01/11/2016 | 23.09 | 81.22 | 94.61 | 0.45 | 93.55 | 1.95 | 92 | 0.89 | 91.63 | 0.50 |
| 11/11/2016 | 20.44 | 73.56 | 95.85 | 0.78 | 95.37 | 2.85 | 93.54 | 6.92 | 94.22 | 1.52 |
| 21/11/2016 | 19.67 | 72.11 | 94.87 | 1.06 | 94.64 | 3.84 | 93.02 | 8.98 | 93.7 | 2.58 |
| 01/12/2016 | 18.84 | 86 | 94.08 | 0.85 | 93.97 | 0.74 | 92.92 | 0.45 | 93.84 | 1.68 |
| 11/12/2016 | 16.92 | 80.78 | 93.96 | 0.20 | 93.86 | 2.81 | 92.79 | 0.22 | 93.77 | 0.21 |
| 21/12/2016 | 14.6 | 87 | 93.42 | 0.34 | 93.29 | 0.40 | 91.64 | 0.08 | 92.2 | 0.55 |
| 02/01/2017 | 15.12 | 78 | 93.63 | 0.21 | 93.35 | 0.47 | 91.58 | 0.77 | 92.32 | 0.23 |
| 11/01/2017 | 14.39 | 84.22 | 93.53 | 0.51 | 93.3 | 0.40 | 91.67 | 0.56 | 92.25 | 0.43 |
| 21/01/2017 | 11.46 | 80.21 | 93.46 | 1.53 | 93.13 | 0.39 | 92.28 | 1.81 | 93.04 | 1.34 |
| 21/02/2017 | 16.47 | 62.38 | 93 | 0.70 | 92.95 | 0.87 | 91.27 | 9.96 | 91.94 | 0.77 |
| 01/03/2017 | 19.21 | 71.7 | 94.37 | 0.32 | 94.17 | 0.32 | 92.21 | 1.55 | 92.38 | 0.98 |
| 11/03/2017 | 18.53 | 58.65 | 94.31 | 0.60 | 94.23 | 2.86 | 91.94 | 0.71 | 92.11 | 0.40 |
| 11/04/2017 | 24.68 | 47.22 | 91.71 | 1.32 | 90.96 | 1.53 | 90.49 | 1.87 | 90.07 | 1.84 |
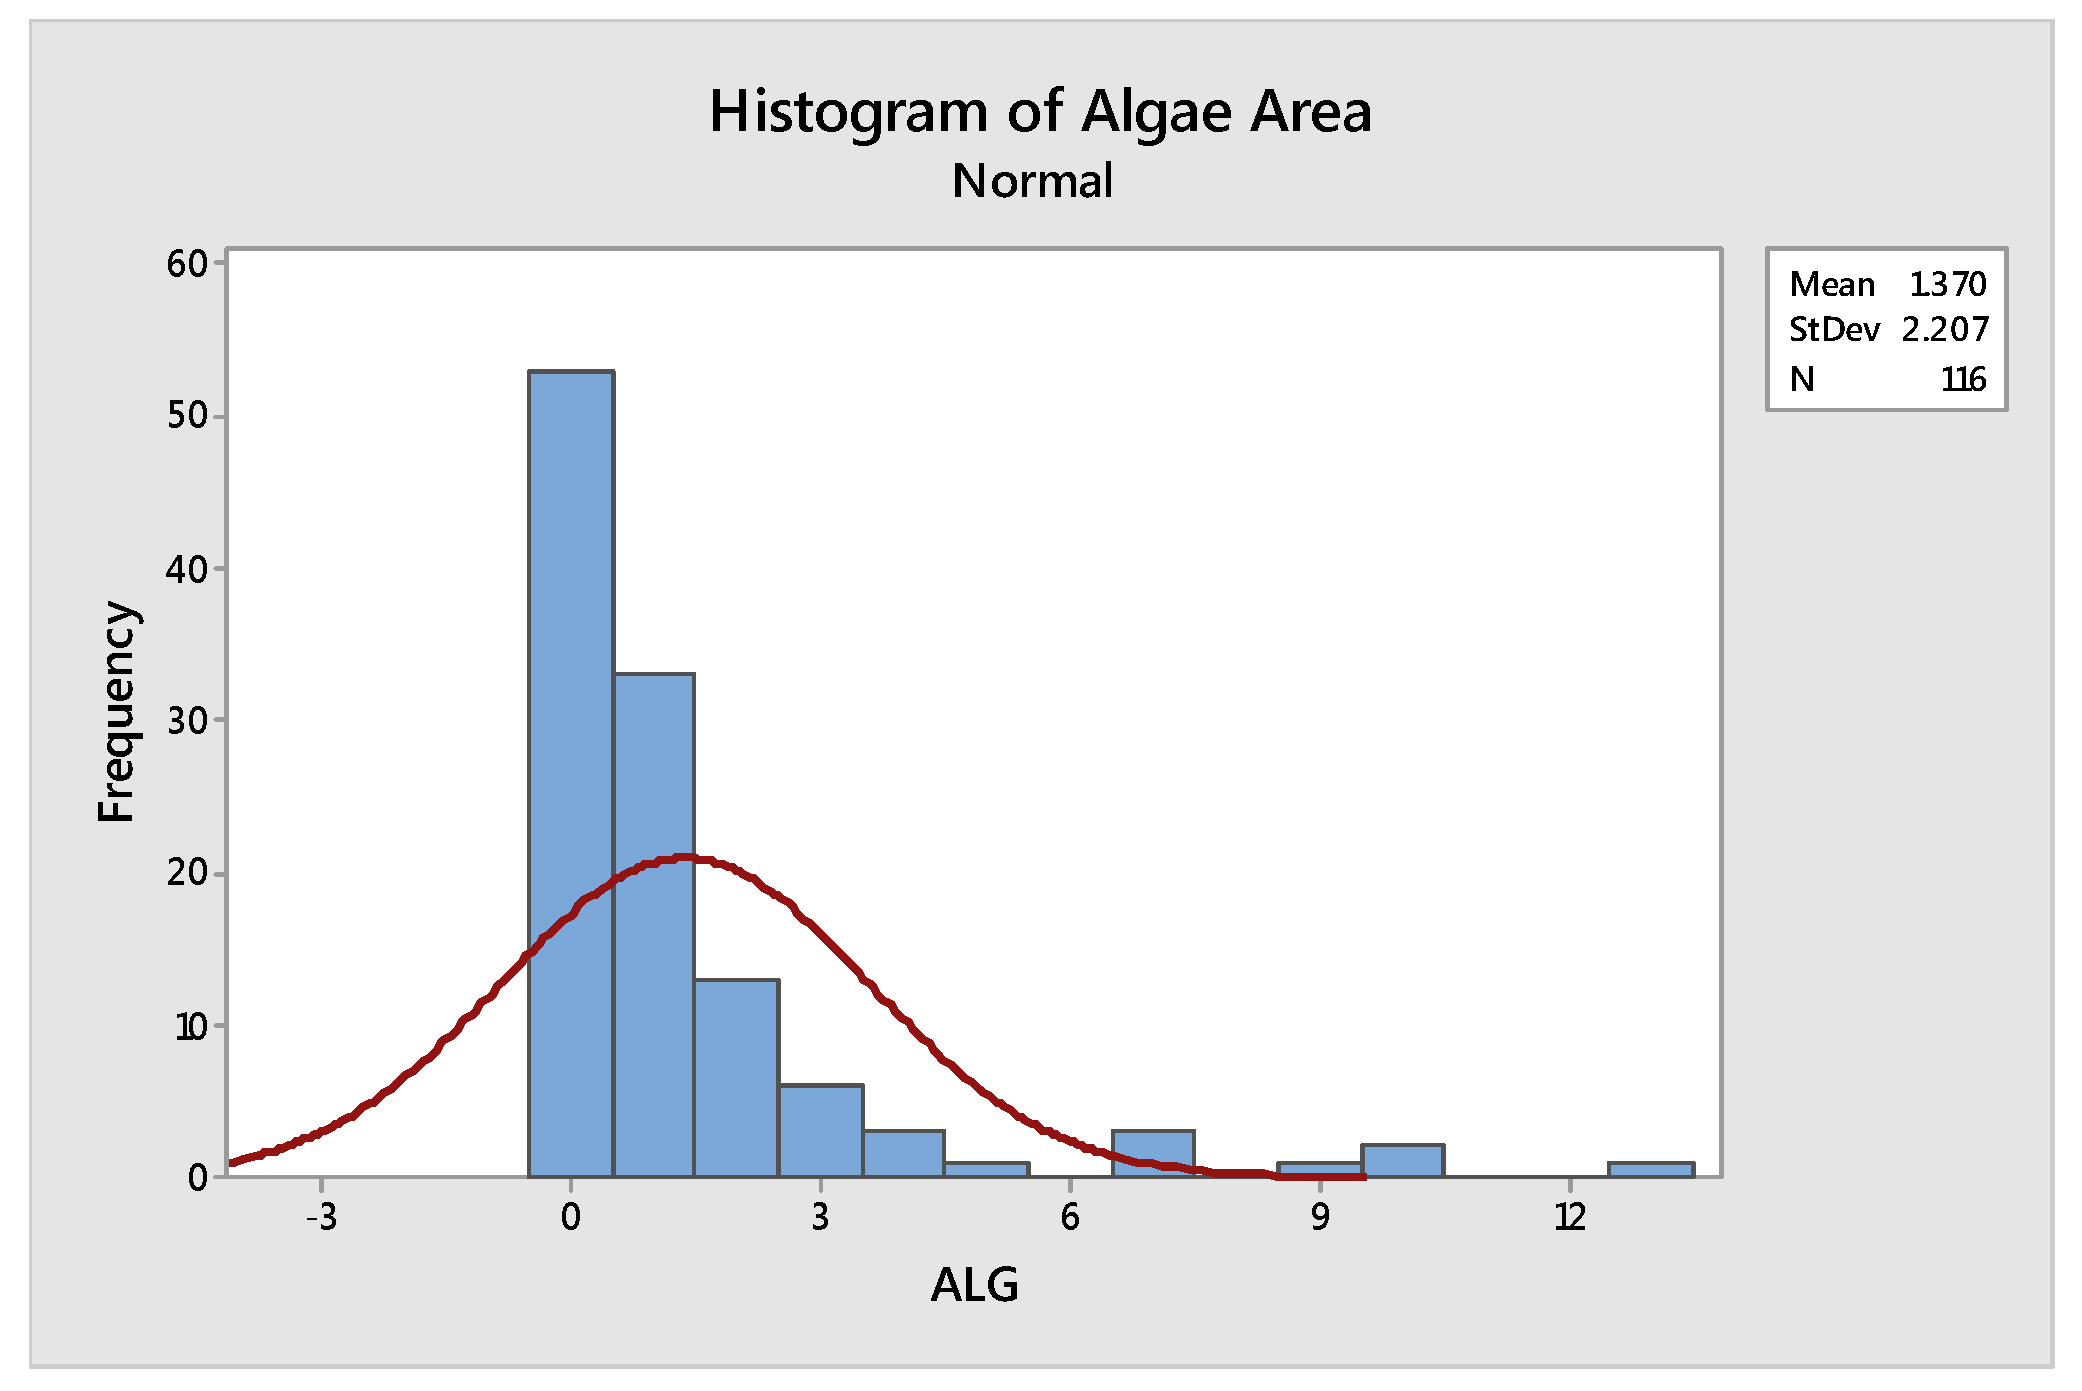
| Mean | Standard Deviation | Anderson Darling Statistic Value | p-Value |
|---|---|---|---|
| 1.37 | 2.207 | 16.073 | <0.005 |
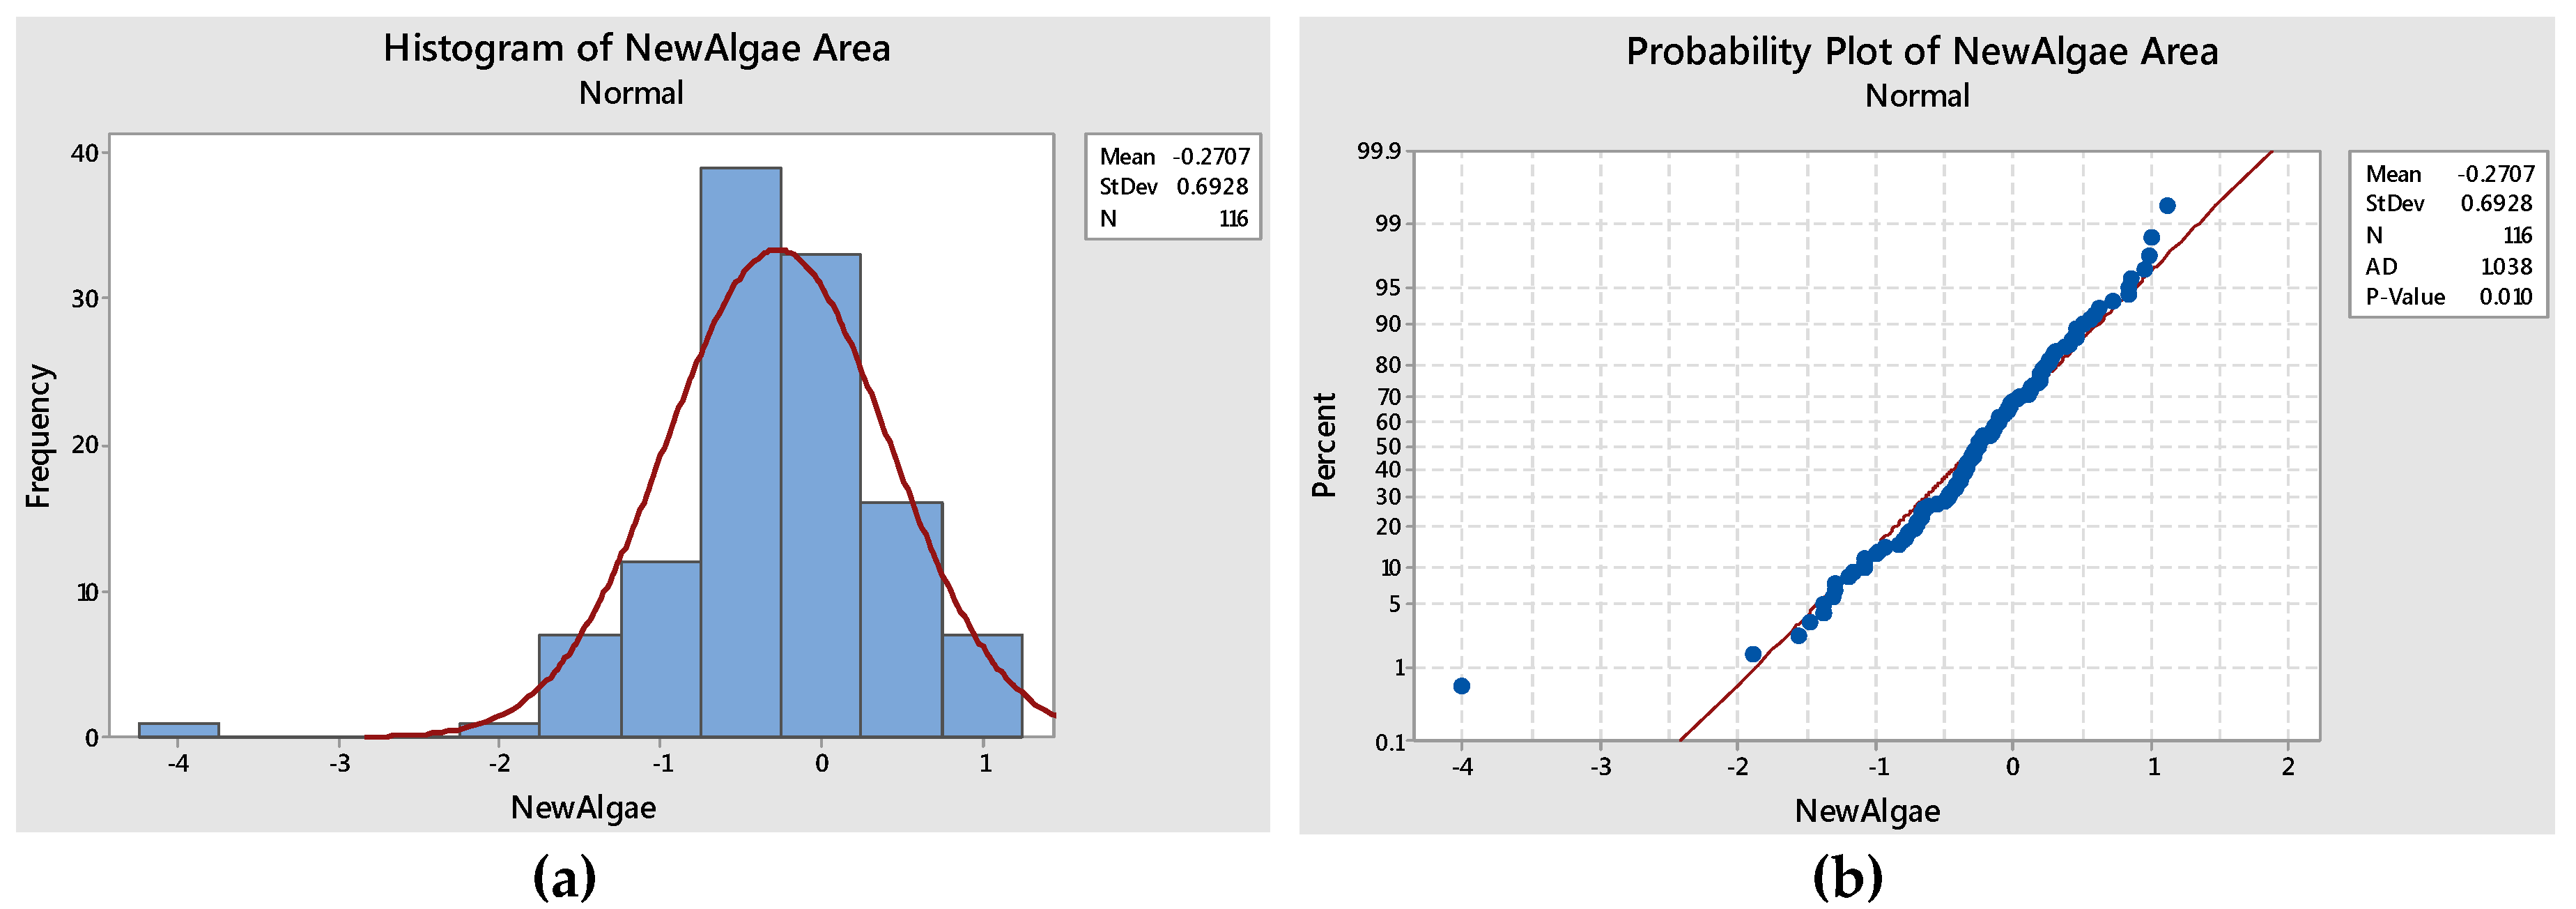
| Mean | Standard Deviation | Anderson Darling Statistic Value | p-Value |
|---|---|---|---|
| −0.27 | 0.6928 | 1.0838 | 0.01 |
| Regression Variables | Step 15 | Step 16 | Step 17 | |||
|---|---|---|---|---|---|---|
| Coefficients | p-Value | Coefficients | p-Value | Coefficients | p-Value | |
| Constant | 1203 | – | 1234 | – | 1603 | – |
| NDP | −0.526 | 0.001 | −0.53 | 0.001 | −0.529 | 0.001 |
| CN-1 | −0.157 | 0.282 | −0.159 | 0.271 | −0.159 | 0.269 |
| CN-2 | 0.179 | 0.228 | 0.178 | 0.227 | 0.186 | 0.205 |
| Dys | 0.053 | 0.788 | −0.003 | 0.981 | −0.004 | 0.966 |
| Hm | −27.53 | 0.001 | −27.04 | 0.001 | −34.39 | 0.001 |
| Tmp | −20.7 | 0.047 | −22.4 | 0.014 | −31.4 | 0.005 |
| Dys*Hm | −0.00338 | 0.232 | −0.00369 | 0.166 | −0.00435 | 0.107 |
| Dys*Tmp | 0.00257 | 0.035 | 0.00277 | 0.009 | 0.00436 | 0.005 |
| Hm*Tmp | 0.22 | 0.079 | 0.232 | 0.054 | 0.353 | 0.017 |
| Dys*Hm*Tmp | – | – | – | – | – | – |
| Tmp*Tmp | 0.0787 | 0.004 | 0.0814 | 0.002 | 0.0864 | 0.001 |
| DRT | −12.67 | 0.002 | −12.98 | 0.001 | −16.37 | 0 |
| Tmp*Drt | 0.205 | 0.047 | 0.2214 | 0.014 | 0.3 | 0.005 |
| Tmp*Tmp*DRT | – | – | – | – | – | – |
| Hm*DRT | 0.3074 | 0 | 0.3025 | 0 | 0.3712 | 0 |
| Hm*Hm | 0.1455 | 0.004 | 0.1386 | 0.002 | 0.1729 | 0.001 |
| Dys*Hm*Hm | 0.000033 | 0.123 | 0.000036 | 0.074 | 0.000034 | 0.092 |
| Hm*Hm*Tmp | 0.000596 | 0.007 | 0.000592 | 0.007 | 0.000492 | 0.032 |
| Hm*Hm*DRT | −0.001708 | 0.001 | −0.001639 | 0 | −0.001948 | 0 |
| Tmp*Tmp*Tmp | −0.000866 | 0.036 | −0.000907 | 0.021 | −0.000844 | 0.032 |
| Dys*Dys | 0.000047 | 0.417 | 0.000061 | 0.115 | −0.000157 | 0.317 |
| Dys*DRT | −0.00058 | 0.741 | – | – | – | – |
| Dys*Dys*DRT | – | – | – | – | – | – |
| Hm*Tmp*DRT | −0.00299 | 0.016 | −0.0031 | 0.009 | −0.00416 | 0.003 |
| Dys*Dys*Hm | – | – | – | – | 0.000004 | 0.154 |
| Model Selection Criteria | Step 15 | Statistics | Step 16 | Step 17 |
|---|---|---|---|---|
| Standard Error | 0.491774 | – | 0.489465 | 0.486741 |
| R-sq | 58.81% | 58.77% | 59.65% | |
| R-sq(adj) | 49.61% | 50.09% | 50.64% | |
| R-sq(pred) | 31.55% | 32.80% | 32.83% | |
| Mallows’Cp | 23.21 | 21.32 | 21.27 |
| Source | Degree of Freedom | Seq SS | Contribution | Adj SS | Adj MS F | p-Value | Value |
|---|---|---|---|---|---|---|---|
| Regression | 21 | 32.9269 | 59.65% | 32.9269 | 1.56795 | 6.62 | 0 |
| Dys | 1 | 8.7024 | 15.77% | 0.0004 | 0.00043 | 0 | 0.966 |
| Hm | 1 | 1.5116 | 2.74% | 3.0528 | 3.05282 | 12.89 | 0.001 |
| Tmp | 1 | 2.7377 | 4.96% | 1.9725 | 1.97249 | 8.33 | 0.005 |
| DRT | 1 | 1.3884 | 2.52% | 3.0968 | 3.09679 | 13.07 | 0 |
| NDP | 1 | 1.9468 | 3.53% | 2.7067 | 2.70665 | 11.42 | 0.001 |
| CN-1 | 1 | 0.0368 | 0.07% | 0.2928 | 0.29277 | 1.24 | 0.269 |
| CN-2 | 1 | 0.0162 | 0.03% | 0.3854 | 0.38536 | 1.63 | 0.205 |
| Dys*Dys | 1 | 3.2059 | 5.81% | 0.2393 | 0.23929 | 1.01 | 0.317 |
| Hm*Hm | 1 | 0.1791 | 0.32% | 2.8798 | 2.87981 | 12.16 | 0.001 |
| Tmp*Tmp | 1 | 0.001 | 0.00% | 2.6893 | 2.68929 | 11.35 | 0.001 |
| Dys*Hm | 1 | 0.059 | 0.11% | 0.6287 | 0.62871 | 2.65 | 0.107 |
| Dys*Tmp | 1 | 0.0243 | 0.04% | 1.9548 | 1.95478 | 8.25 | 0.005 |
| Hm*Tmp | 1 | 0.1876 | 0.34% | 1.3982 | 1.39818 | 5.9 | 0.017 |
| Hm*DRT | 1 | 5.0513 | 9.15% | 3.6732 | 3.67321 | 15.5 | 0 |
| Tmp*DRT | 1 | 0.0538 | 0.10% | 1.987 | 1.98701 | 8.39 | 0.005 |
| Tmp*Tmp*Tmp | 1 | 0.0005 | 0.00% | 1.12 | 1.12393 | 4.74 | 0.032 |
| Dys*Dys*Hm | 1 | 0.0861 | 0.16% | 0.4896 | 0.48958 | 2.07 | 0.154 |
| Dys*Hm*Hm | 1 | 1.5526 | 2.81% | 0.6873 | 0.68735 | 2.9 | 0.092 |
| Hm*Hm*Tmp | 1 | 2.2998 | 4.17% | 1.1293 | 1.12934 | 4.77 | 0.032 |
| Hm*Hm*DRT | 1 | 1.7178 | 3.11% | 3.8722 | 3.87216 | 16.34 | 0 |
| Hm*Tmp*DRT | 1 | 2.168 | 3.93% | 2.168 | 2.16796 | 9.15 | 0.003 |
| Error | 94 | 22.2701 | 40.35% | 22.2701 | 0.23692 | – | – |
| Total | 115 | 55.1971 | 100.00% | – | – | – | – |
© 2018 by the authors. Licensee MDPI, Basel, Switzerland. This article is an open access article distributed under the terms and conditions of the Creative Commons Attribution (CC BY) license (http://creativecommons.org/licenses/by/4.0/).
Share and Cite
Qureshi, S.A.; Shafeeq, A.; Ijaz, A.; Butt, M.M. Development of Algae Guard Façade Paint with Statistical Modeling under Natural Phenomena. Coatings 2018, 8, 440. https://doi.org/10.3390/coatings8120440
Qureshi SA, Shafeeq A, Ijaz A, Butt MM. Development of Algae Guard Façade Paint with Statistical Modeling under Natural Phenomena. Coatings. 2018; 8(12):440. https://doi.org/10.3390/coatings8120440
Chicago/Turabian StyleQureshi, Sheraz Ahmed, Amir Shafeeq, Aamir Ijaz, and Muhammad Moeen Butt. 2018. "Development of Algae Guard Façade Paint with Statistical Modeling under Natural Phenomena" Coatings 8, no. 12: 440. https://doi.org/10.3390/coatings8120440
APA StyleQureshi, S. A., Shafeeq, A., Ijaz, A., & Butt, M. M. (2018). Development of Algae Guard Façade Paint with Statistical Modeling under Natural Phenomena. Coatings, 8(12), 440. https://doi.org/10.3390/coatings8120440