Corrosion Behavior Evaluation of Coated Steel Using Fiber Bragg Grating Sensors

1
Department of Civil and Environmental Engineering, North Dakota State University, P.O. 6050, Fargo, ND 58108, USA
2
Department of Mechanical Engineering, North Dakota State University, P.O. 6050, Fargo, ND 58108, USA
*
Author to whom correspondence should be addressed.
Coatings 2019, 9(1), 55; https://doi.org/10.3390/coatings9010055
Submission received: 30 November 2018
/
Revised: 2 January 2019
/
Accepted: 16 January 2019
/
Published: 17 January 2019
(This article belongs to the Special Issue Advanced Coatings for Corrosion Protection in Extreme Environments)
Abstract
:Coatings, either soft or hard, are commonly used to protect steel against corrosion for longer service life. With coatings, assessing the corrosion behavior and status of the substrate is challenging without destructive analysis. In this paper, fiber Bragg (FBG) grating sensors were proposed to nondestructively evaluate the corrosion behavior of steel coated with two popular coatings, including the polymeric and wire arc sprayed Al-Zn coating. Laboratory accelerated corrosion tests demonstrated that the embedded FBG sensors inside both the soft and hard coatings can effectively quantify the corrosion rate, monitor the corrosion progress, and detect the coating damages and crack propagation of coated steel in real time. The laboratory electrochemical corrosion test on the wire arc sprayed Al-Zn coating validated the proposed embedded FBG sensor method with a good agreement in comparison. The proposed sensing platform provides an alternative nondestructive real-time corrosion assessment approach for coated steel in the field.
1. Introduction
Steel is popularly used in modern structures such as bridges, buildings, and pipes, which is vulnerable to corrosion attacks [1,2,3,4,5,6]. Steel corrosion is an electrochemical process, which happens naturally when structure steel meets with water and oxygen concurrently. With the presence of free electrons, water, and oxygen, reduction happens at cathodes, as shown in the reaction below [2,7]:
The corrosion reaction consists of a sequence of sub-reactions, ended in consuming steel as well as producing rust. Corrosion had been recognized as one of the main causes of steel component degradation due to its ability to substantially lower the cross-section area of component, causing a substantial deterioration in load-carrying capability of associated structural components [1,2]. Corrosion happens in reinforced concrete and has also been categorized as one of the most critical types of degradation [8,9]—not only because the corrosion reduces load capacity of steel bars in concrete, but also that rust is porous so that the enormously increased volume leads to severe cracks in concrete, and resulted in unexpected component failures. Therefore, corrosion significantly impacts the reliability and safety of steel related application and might cause catastrophic impacts on both humans and the environment occasionally if not properly mitigated. The newest estimation for corrosion cost in 2016 had been updated to be 1.1 trillion USD, which accounts for about 6% of the gross domestic product (GDP) of the United States [7]. Protecting steel against corrosion is required for any structures with steel in corrosive environments.
Since corrosion needs the presence of both water and oxygen, coatings which isolate the metal substrate from environments is an effective approach to protect steel against corrosion. Based on the hardness, coatings could be categorized as soft coating [8,9,10] or hard coating [11,12,13]. However, coatings still could fail under certain conditions such as external impacts, abrasions, biology attacks, water scouring, etc. When the coatings failed, the underlying structure would be exposed to corrosive environment and subjected to corrosion attacks. To ensure the proper functionality of coatings, multiple types of technologies can be applied to verify the performance of coatings as well as to predict service life, including destructive and non-destructive techniques [7,14,15,16,17,18,19,20,21,22,23,24].
For destructive corrosion assessment, there are two main approaches, including weight loss measurement and electrochemical measurement [14]. Weight loss measurement, which is also known as exposure test, is simple in concept that measures the weight difference of a coupon (sample) between certain time intervals, while placing it in a controlled corrosive environment. The corrosion rate is the weight difference divided by the time elapsed because the weight loss on coupon is exactly the amount of metal consumed by the corrosion reaction. Weight loss measurement is the earliest attempt to perform quantitative corrosion assessment [15,17], and is also the direct approach to accurately measure the corrosion rate in a certain environment. With statistical study and visual inspection efforts, weight loss measurement could provide additional information such as common early signs for corrosion initialization and corrosion types to guide local corrosion mitigation strategies [18]. However, weight loss measurement is extremely time-consuming and generally takes months to decades to complete, depending on the coupons and environment setups. The excessively long-term weight loss measurement could also be a problem that at the time that measurement was done, the environment to be simulated had already changed while performing the measurement.
Instead of weight loss measurement, electrochemical measurement or electrochemical impedance spectroscopy (EIS) can be used, which was first used in corrosion assessment in 1950s, and fast gained popularity due to its capability of completing measurements in a short period of time while providing and repeatable and reliable results [14,15,19]. Electrochemical measurements could also be adjusted for long-term corrosion behavior analysis purposes [20,21]. However, both weight loss and electrochemical measurements are destructive corrosion assessments. While they are able to obtain the corrosion rate directly, they are not suitable for conducting corrosion assessment on an existing steel structure.
In such circumstances, several non-destructive corrosion assessment methods have been developed to evaluate corrosion behavior of coated steel, including ultrasonic and acoustic tools, and embedded or attached sensors [22,23]. The ultrasonic measurement method is one of the most popular non-destructive corrosion assessment methods. It provides high sensitivity, accurate, and immediate assessment for thickness changes [22,23,24]. Traditional ultrasonic measurement methods are point-by-point measurements in nature as it requires ultrasonic wave perpendicularly penetrate the steel, but researches had shown the potential of enlarging measurement range when combined with guided wave methods [25,26]. However, the ultrasonic measurement methods are having difficulties in performing assessment on irregular shape parts, and the extensive knowledge requirement for operating and understanding the instrument often limits its application. Furthermore, the ultrasonic measurement requiring human operation on site could hardly become a candidate for the real-time monitoring system of a large area.
Acoustic emission (AE) has been widely used for damage monitoring in loaded structures, and researches are trying to adapt it in a corrosion assessment [27,28]. When there is rapid release of energy within structure, such as the occurrence of a crack, a set of transient elastic waves are generated and transmitted, starting from that release location. By analyzing the properties of AEs transmitted to receiver, the damage could be categorized and localized. The AE method, as one type of passive detection method, is suitable for real-time monitoring and provides high sensitivity, however, it would have low signal-to-noise ratio in field for small cracks.
Electrical resistance based strain gauges are gaining attention recently for corrosion assessment by measuring electrical resistance changes as corrosion progresses, especially for reinforced concrete structures. When corrosion reactions happen, although the original metal is consumed, the corrosion products (metal oxides) would occupy several times of volume compared with original metal [8,9,29,30]. If the corrosion reaction happens in a confined space, the excessive increased volume would induce a noticeable amount of strain, which could be used as an indicator of the corrosion reaction. Based on these principles, recently, electrical resistance sensors have been investigated to detect metallic and organic coating degradations [31,32]. However, electrical strain gauges may have difficulties in applying corrosion assessment due to moisture and intensive electromagnetic noise.
Fiber optic sensors, which are made by silica materials, have a great potential as a sensing tool in strain based corrosion assessment of steel [33,34,35,36,37]. Among all fiber optic sensors, fiber Bragg grating (FBG) sensors are well-known for its reliability, high sensitivity, and the ease in installation [38,39]. The relatively low cost of FBG sensors made large-scale application practical [38,40,41,42,43] and the chemical inertness of the FBG sensors made them great candidates in corrosion monitoring systems. A few recent attempts to apply FBG sensors in corrosion monitoring of steel rebar in reinforced concrete had shown the possibility of FBG sensors in corrosion monitoring [36,44,45,46,47]. Recently, the authors group investigated using FBG sensors to detect corrosion in High-Velocity Oxygen Fuel (HVOF) thermally sprayed metallic coatings [48]. However, limited studies have been performed on using FBG sensors to monitor corrosion for steel components coated with polymeric and other metallic coatings.
In this paper, for the first time to the authors’ acknowledge, FBG sensors were investigated to assess corrosion behavior in real time of steel components coated with two different popularly applied commercial coatings: The polymeric coating and the wire arc sprayed Al-Zn coatings. The FBG sensors embedded inside the coatings can measure the corrosion induced strains, which can be further related to corrosion progress of coated steel to study the corrosion mechanism. This paper set up the direct relation between the center wavelength changes of embedded FBG sensors and the corrosion progress changes in addition to the corrosion induced crack/delamination initialization inside the polymeric and wire arc sprayed coatings. The direct relation was validated through laboratory experiments. The validated technique presented in this paper provides onsite real-time monitoring tools to assess corrosion behavior of coated steel.
2. Operational Principles
The FBG sensor will be used to detect the corrosion in coated steel components. The FBG sensing unit (purchased from Micron Optics, Atlanta, GA, USA) is fabricated by periodic heating of fiber core using high-power UV laser, inducing a periodic modulation of the core refractive index. With the modulation, if a broadband light beam is transmitted through the FBG, part of the incoming light with a certain wavelength will be reflected, showing a dip in the reflected light spectrum, known as the Bragg wavelength (λB). The Bragg wavelength needs to meet the Bragg condition with an effective refractive index (neff) and grating pitch (Λ), as [38]:
λB = 2neff∙Λ
The effective refractive index (neff) is determined by the transmitting media, which is an optical fiber core in the case of an FBG. It will not change, as there is no material change related to optical fiber core during its use. However, the grating pitch (Λ) does change with length variation of FBG, whether it is caused by a temperature raise/drop () or an external tension/compression (). This will result in a shift in Bragg wavelength. The amount of Bragg wavelength change with strains or temperatures can be calculated as below [48]:
where is the photoelastic constant of the fiber, α is the thermal expansion coefficient of the fiber, and ξ is a temperature related constant. All these parameters can be determined by the material of fiber.
If a reference sensor is selected with , the wavelength change after elimination of temperature effects () can be expressed as:
Hence, with the measurement of Bragg wavelength change of a test sensor and a temperature compensation sensor (also known as reference sensor), the strain on a FBG can be calculated, which may further relate to the corrosion progressing status.
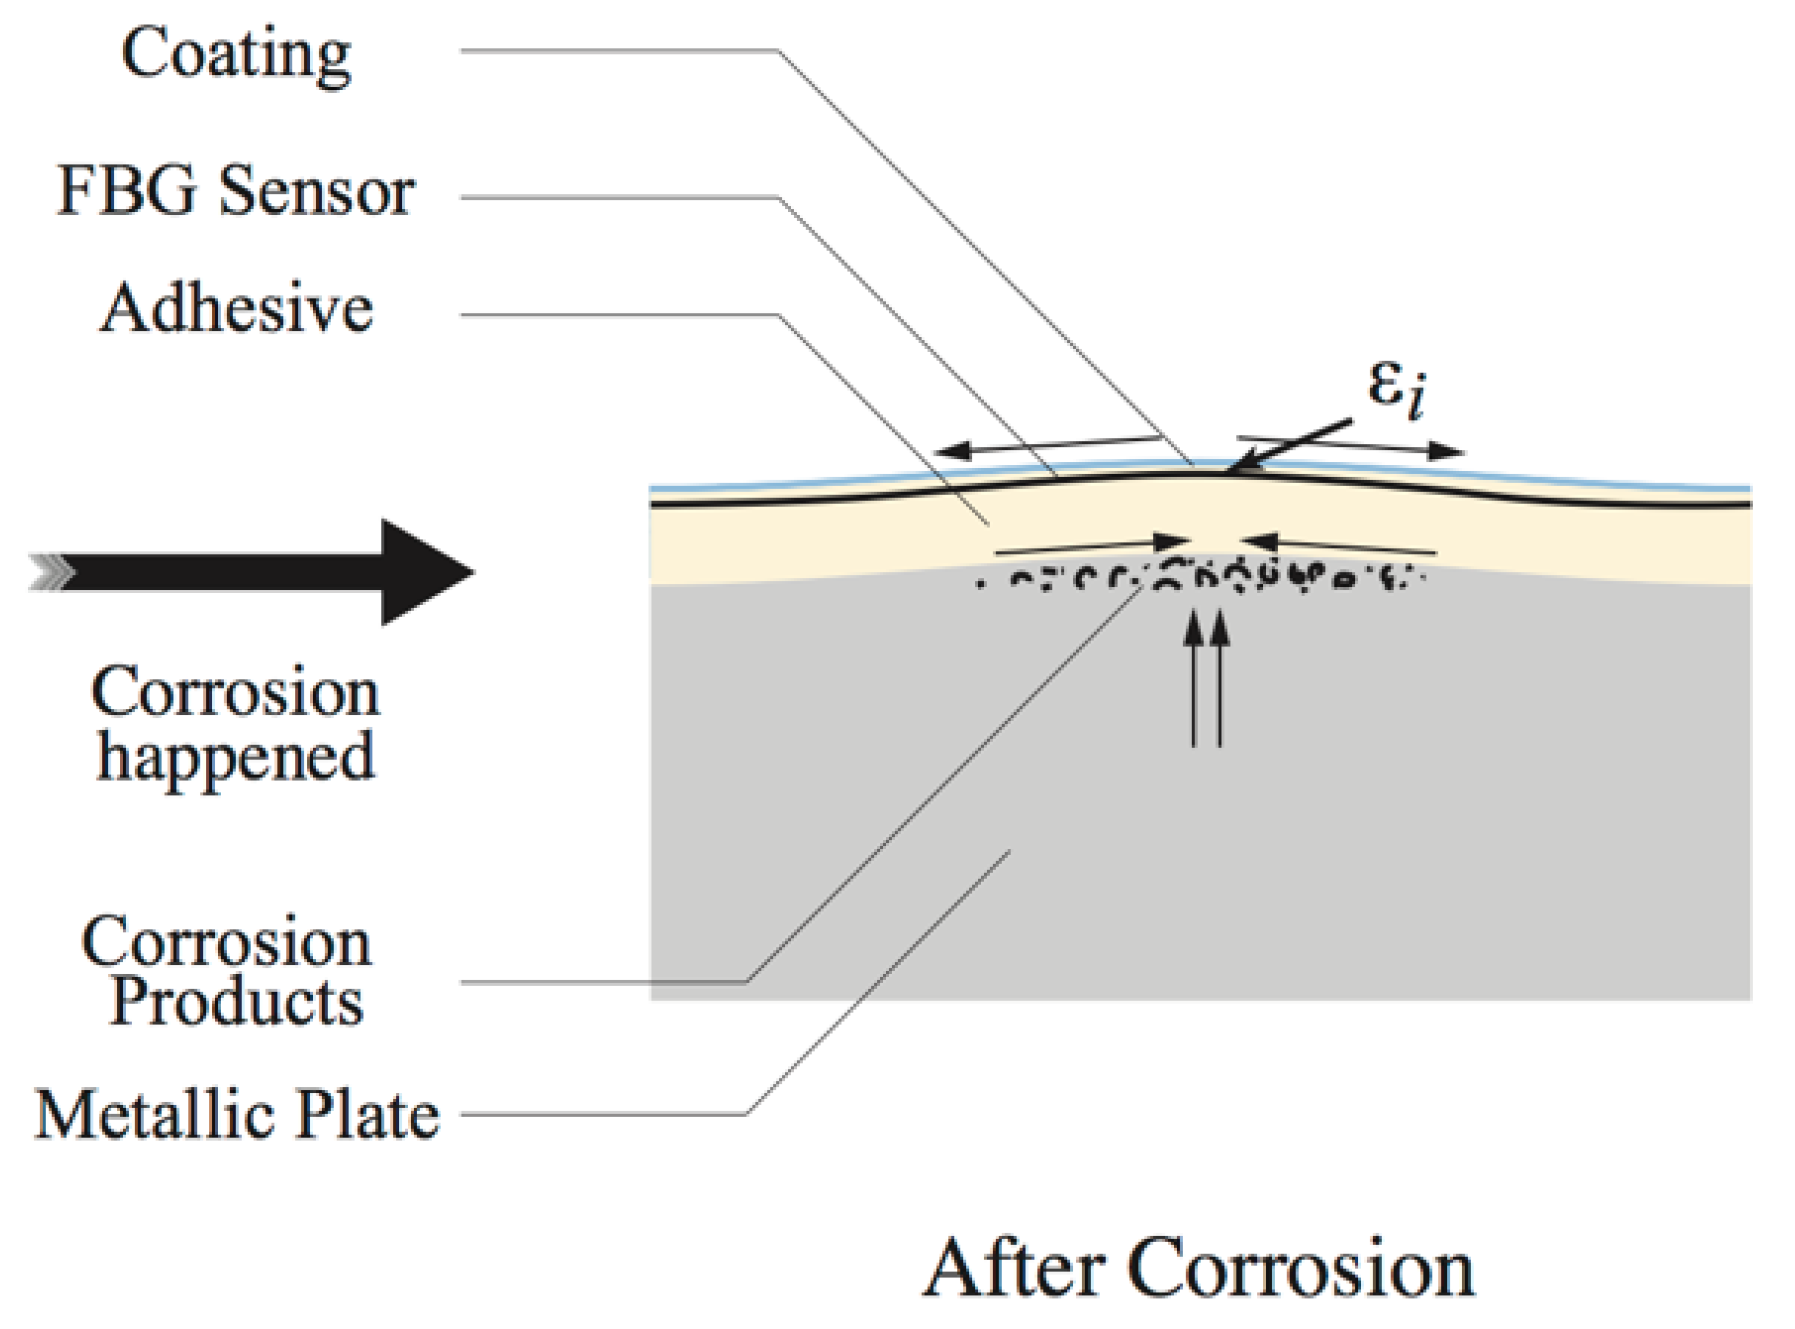
From Equation (1), it is known that the reduction at cathodes will change the iron into oxidized iron with size more than six times larger the original iron particles [46,47,48]. Thus, detecting the material volume or expansion change using the embedded FBG sensors in the coatings of steel components can potentially reveal the corrosion mechanism. When FBG sensors are embedded inside coatings on steel, the coating acts as constrains to the FBG sensor with an initial strain, ε0, introducing an initial Bragg wavelength, λ0. If no corrosion or damage, the Bragg wavelength will only vary with surrounding temperature. With a temperature reference FBG sensor on site, no Bragg wavelength change of the test sensor is expected, based on Equation (4). However, when corrosion occurs in the steel substrate, as shown in Figure 1, the corrosion products will push the coating up, inducing a strain on the FBG sensor, εi, that can be monitored by the Bragg wavelength change of the FBG sensors, λi, where i is the corrosion time step. If the corrosion production is accumulated within a relatively small area, as compared to the total span of the packaged FBG sensor and the expansion of corrosion productions that mainly occur in a vertical direction, the corrosion rate of the coated steel can be obtained through monitoring of the Bragg wavelength changes of the embedded FBG sensors as below [48]:
where CR is the corrosion rate, is the density of the coating, and , which relate only to the moment of inertia of the cross section with sensors (I), the span of beam (l), half of the height of cross-section (y), and the modulus of the coating (E). k3 is the linear scaling factor between volume of corrosion products and induced center displacement, and k4 is the expansion factor between the volumes of corrosion products and the iron, Δλ is the Bragg wavelength change measured with the embedded FBG sensor, and γ is the sensitivity of the sensor toward corrosion rate of metals, which can be calibrated with the known corrosion rate of one certain material. With laboratory accelerated corrosion tests, the parameters above, in Equation (5), can be calibrated. The calibrated model can then be applied to various coated steel components for further corrosion assessment.
3. Experimental Setup for Accelerated Corrosion Tests
To validate the effectiveness of the embedded FBG sensors based corrosion monitoring system for coated steel, laboratory experiments were performed by instrumenting steel plates with embedded FBG sensing system for both polymeric soft coating and metallic hard coatings. Both electrochemical methods and embedded FBG sensors were used for the hard coating, which is the wire arc sprayed Al-Zn coating, as compared to the embedded FBG sensing technology for corrosion measurements. The electrochemical method is also used to test the corrosion rate for bare steel as a reference corrosion rate.
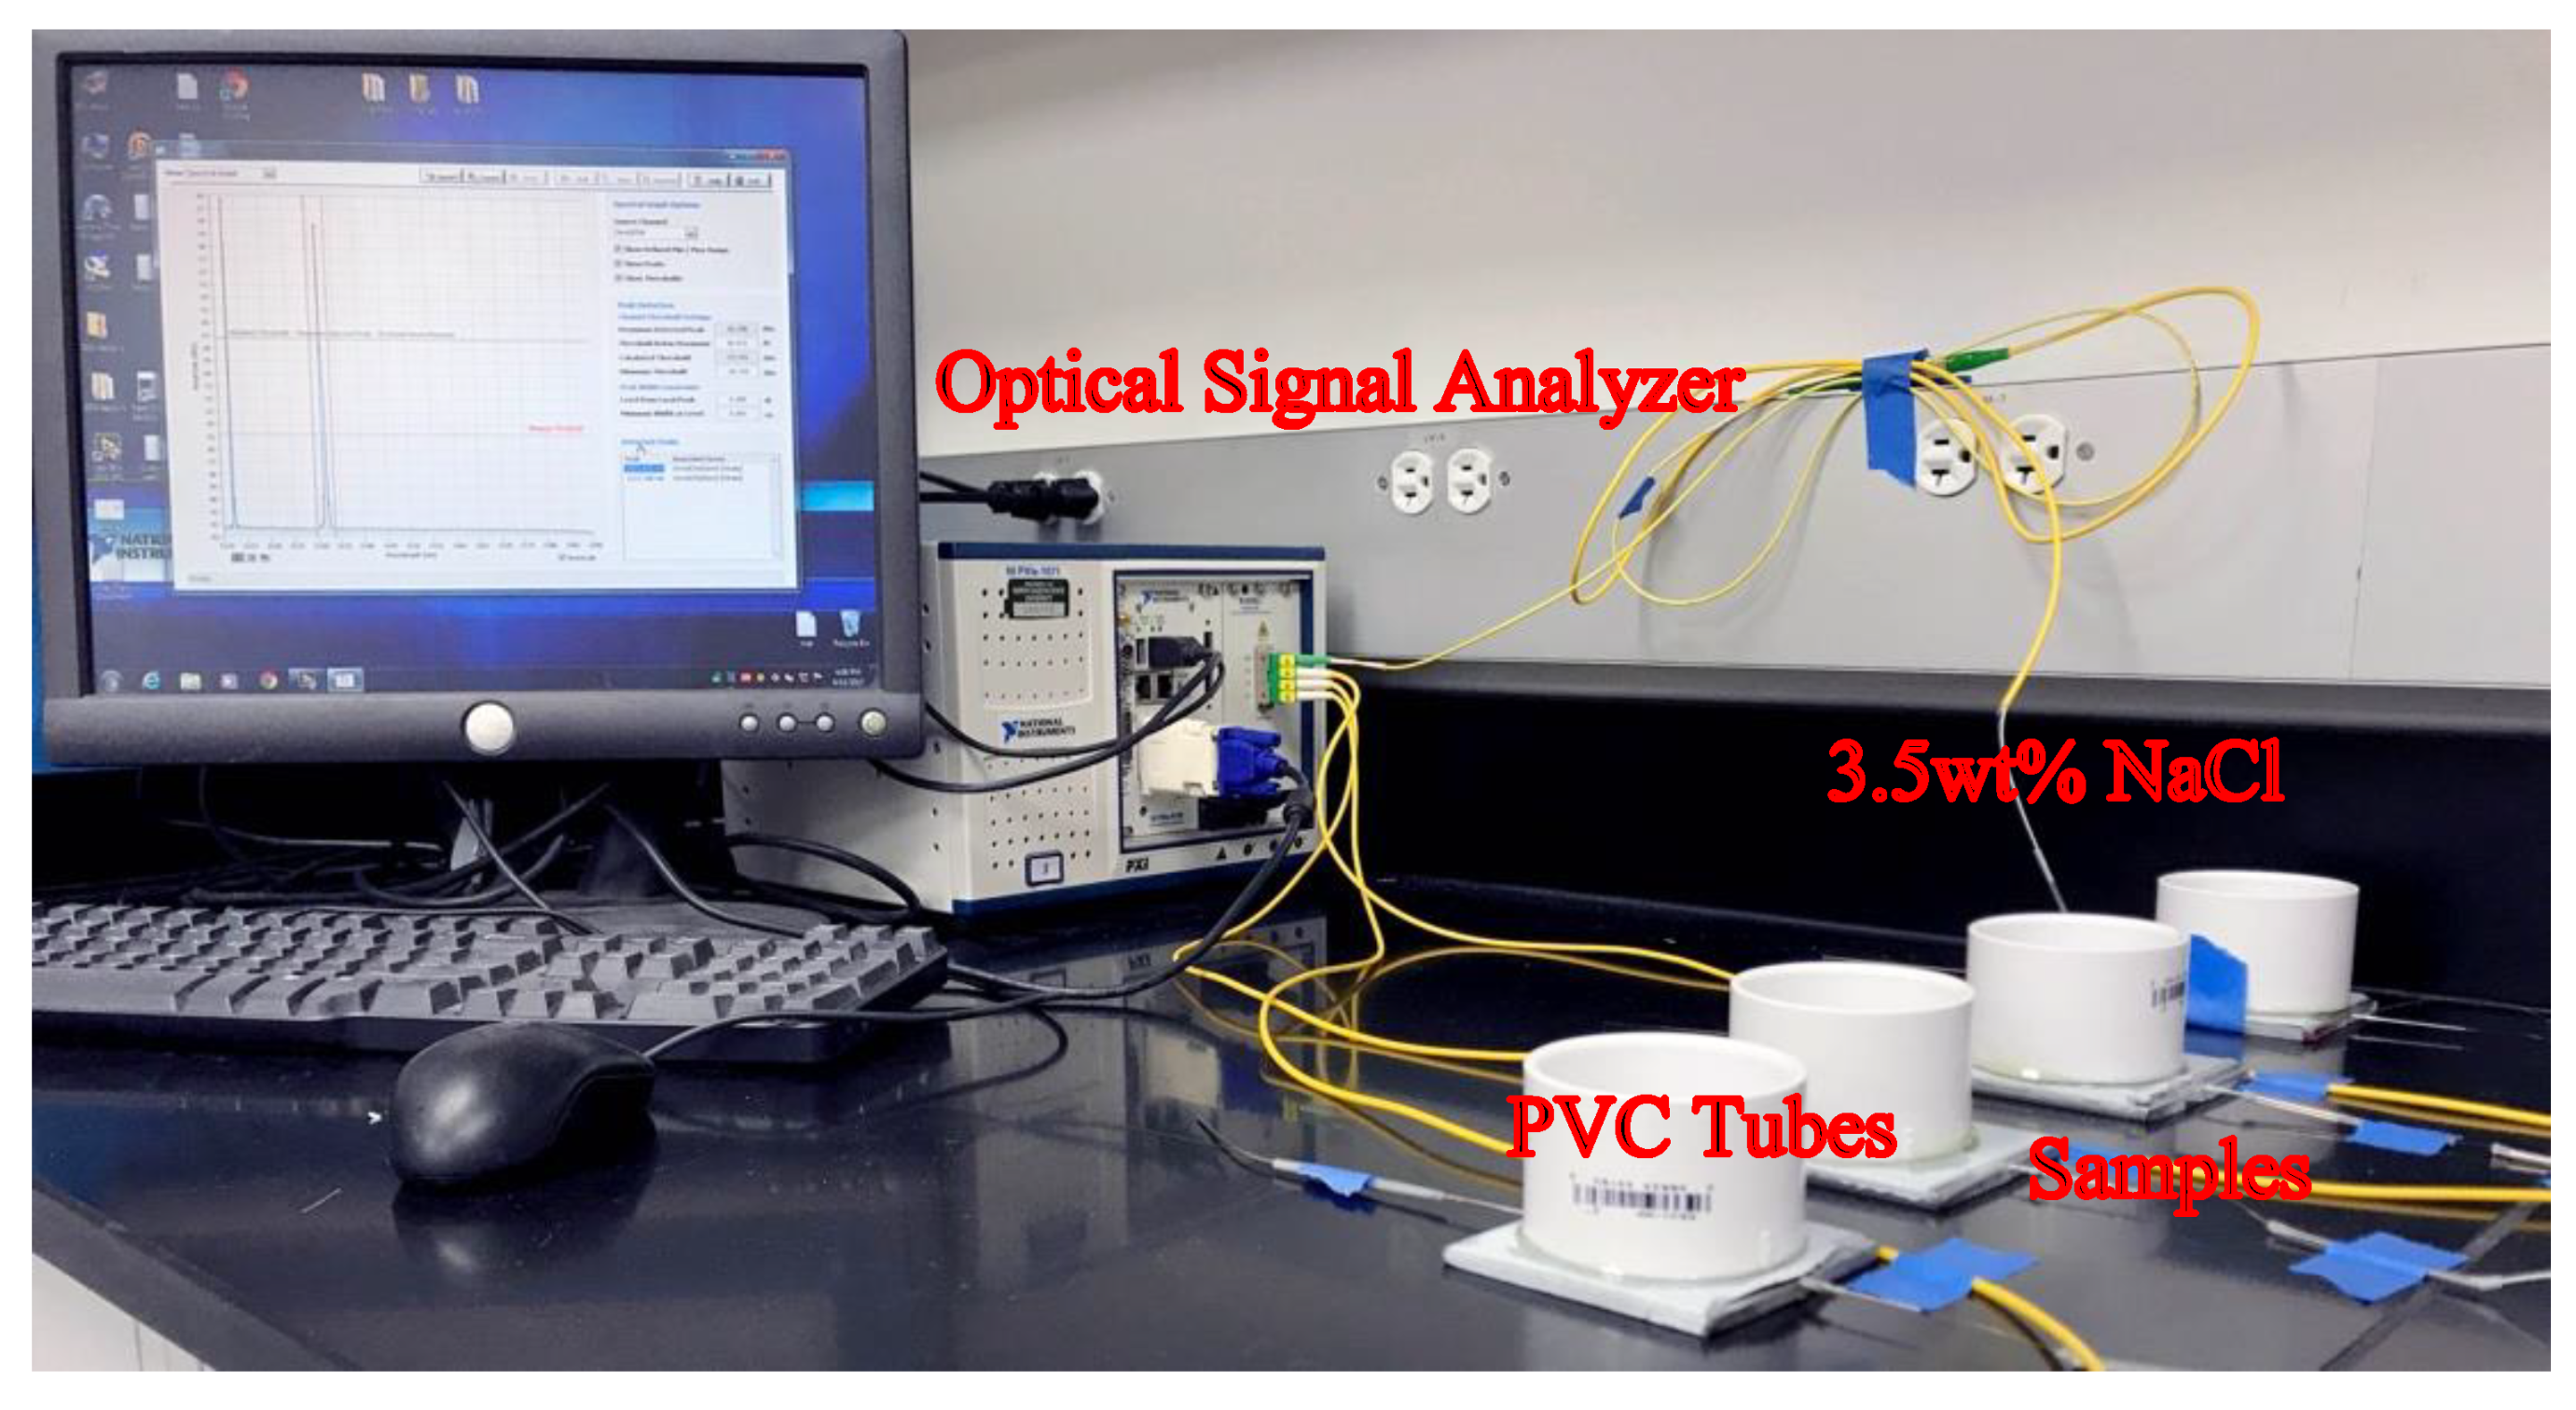
For accelerated corrosion tests with embedded FBG sensors, Figure 2 shows the test setup. To create a corrosive environment for accelerated corrosion, a PVC pipe with a diameter of two inches was fixed on top of the embedded sensors by Loctite heavy duty epoxy adhesive and filled with 3.5 wt % sodium chloride (NaCl) solution. The NaCl solutions were kept at room temperature (22 ± 3 °C) during the entire testing period. In addition to the test samples with embeeded sensors, an additional temperature compensation sample was made for both polymeric coating and wire arc sprayed Al-Zn coating to monitor the Bragg wavelength changes with tempeature variances. The Bragg wavelength changes from all the FBG sensors had been recorded using an optical signal analyzer (National Instruments PXIe-4844 Optical Sensor Interrogator integrated with PXIe-1071 Controller and PXIe-8133 Chassis, Austin, TX, USA) continuously during the testing period with a sampling frequency of 10 Hz. Visual inspections for all the samples were also scheduled at 12:00 p.m. daily to inspect the existence of corrosion on the surface of the samples.
All the nine test samples were tested. Table 1 shows the detail test matrix for the coated steel corrosion assessment used in this study. A36 steel (Standard Steel ASTM A53 [49]) was used as substrate. One bare A36 steel (Sample B) was tested using the eletro-chemical method for reference.
As seen in Table 1, three polymeric coating (Samples #S1–S3) were tested using embedded FBG sensors, respectively. The polymeric coating used in the test was epoxy resin (Duralco 4461, provided by Cotronics Corp., Brooklyn, NY, USA), which is clear in color and belongs to the amine complex [50]. The applied epoxy resin cured in room temperature within 16 h. After FBG sensor was attached on the surface of the substrate, one layer of epoxy was applied on top of the substrate with thickness approximately of 2 mm. After the epoxy was fully cured, the PVC pipes were fixed on top of the location of sensor followed by filling with 3.5 wt % NaCl solution to create corrosive environment, as seen in Figure 2. The accelrated corrosion tests for the polymric coating had a run for 6480 h (270 days).
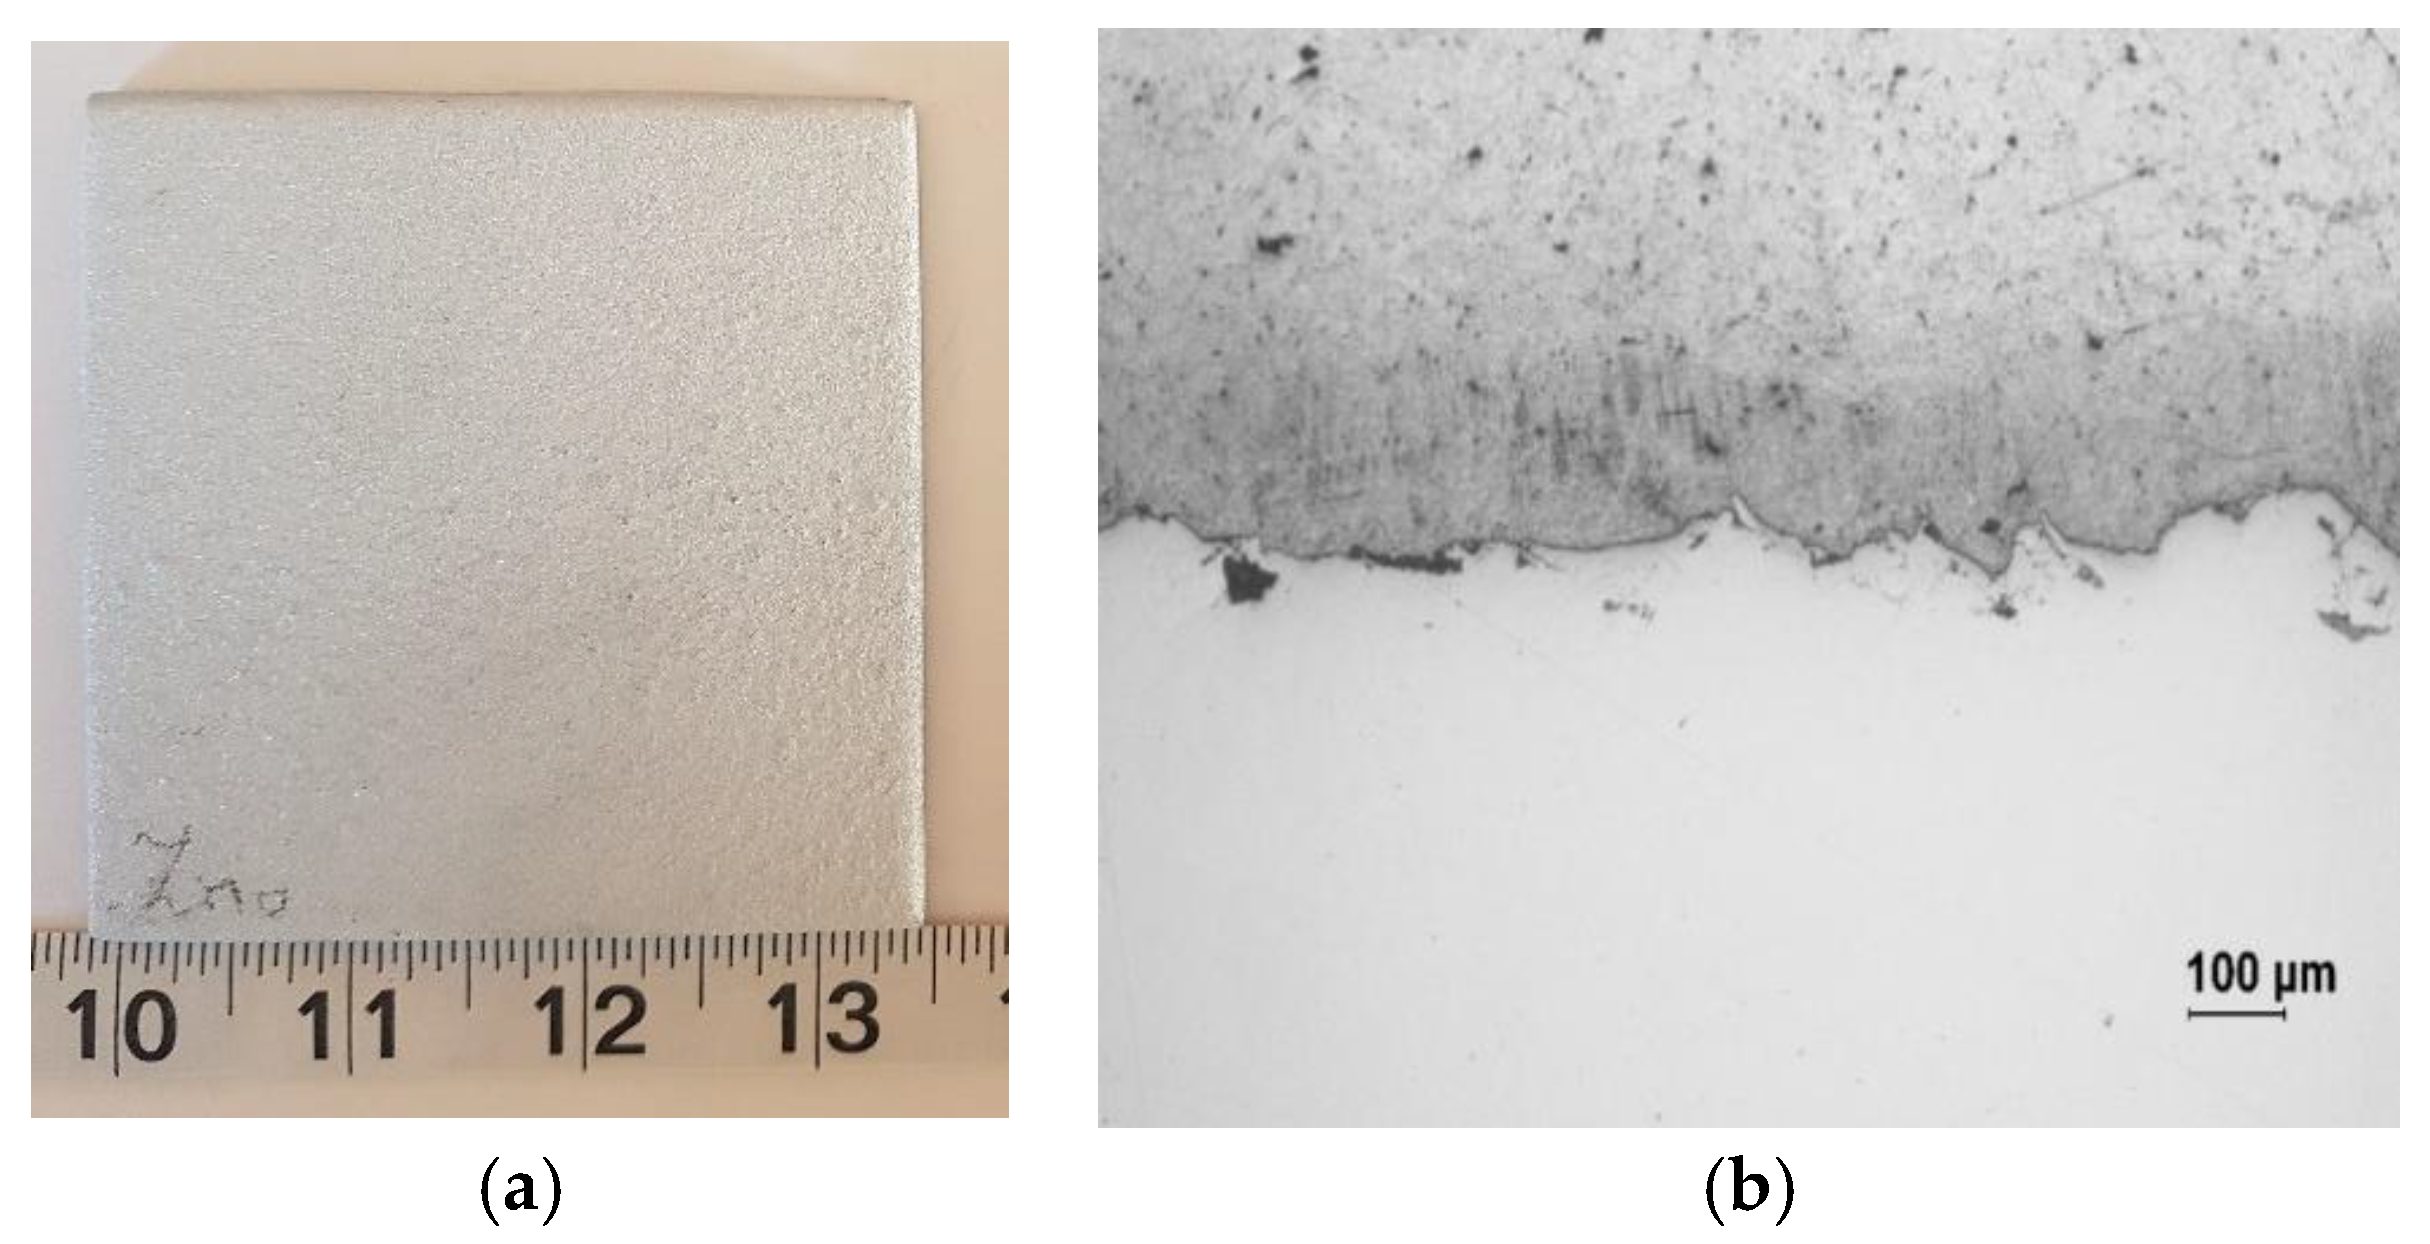
In addition, three samples coated with wire arc Al-Zn coating (Smaples #A1–A3) were also tested using embedded FBG sensors and one sample (Sample #A4) was tested using electrochemical method as seen in Tabel 1. The Al to Zn compositions in the wire arc sprayed coating is 85% Al and 15% Zn, which can also be noted as Al-15Zn. For the three wire arc sprayed Al-Zn coated samples tested using FBG sensors, the coating thickness varied between samples. Figure 3a,b shows the photo of the sample and microscope image of the wire-arc Al-Zn coating. As illustrated in Figure 3b, the coating was bonded on the substrate very uniformly. The analysis on the porosity of the wire arc sprayed Al-Zn coating based on Figure 3b indicated a porosity of 7% ± 0.6%. The coatings on Samples #A1 and #A2 had thickness of 2 mm, and the coating on Sample #A3 had a thickness of 1.5 mm. The coating thickness for Sample #A4, which used for the electrochemical corrosion testing, was 1.5 mm. Before the accelerated corrosion test was conducted, PVC pipes were also attached on top of each coated sample, as shown in Figure 2, and filled with 3.5 wt % NaCl solution for accelrated corrosion testing. The accelerated corrosion test had run for 350 h (14 days) on the wire arc sprayed Al-Zn coating.
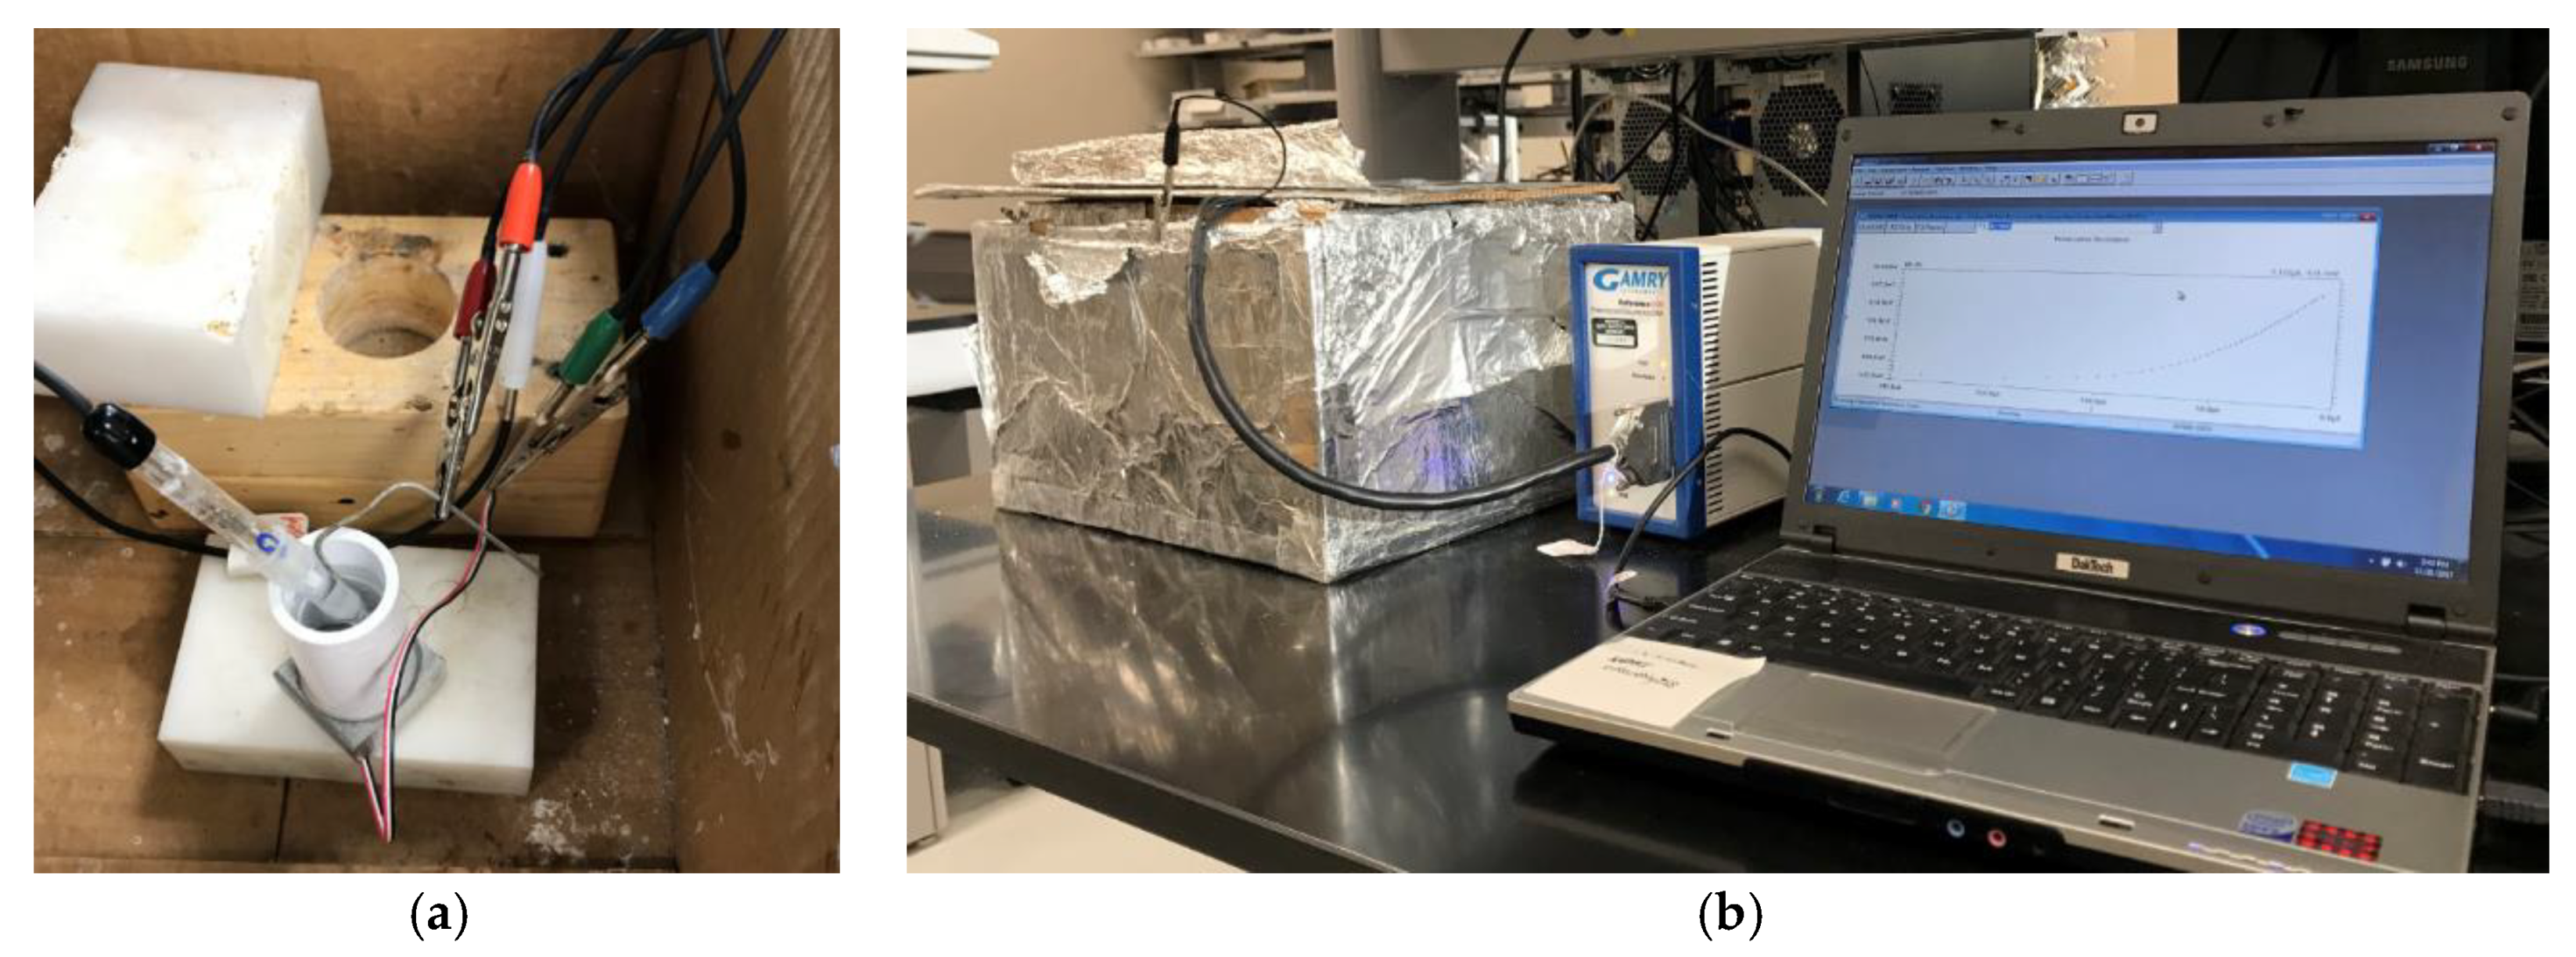
For the electrochemical corrosion test on bare steel and wire arc sprayed Al-Zn coating, a Tafel test was performed to obtain the reference corrosion rate, which is one of the most commonly used approaches for corrosion resistance evaluation of material for short term corrosion behavior [51]. In this study, a Gamry Reference 600 Potentiostat/Galvanostat/ZRA (Gamry Instruments, Warminster, PA, USA) was used to conduct the Tafel tests. Figure 4a,b shows the Tafel test setup. In order to conduct electrochemical corrosion test on the test sample, a PVC pipe was also attached to the sample and filled with 3.5 wt % NaCl solution to create free electron. After using epoxy to glue PVC pipe to the surface of the coated sample, a conductive wire was connected to the bottom of the sample for connecting testing instrument, as shown in Figure 4a. A scan rate was set to be 0.1 mV/s for the Tafel test.
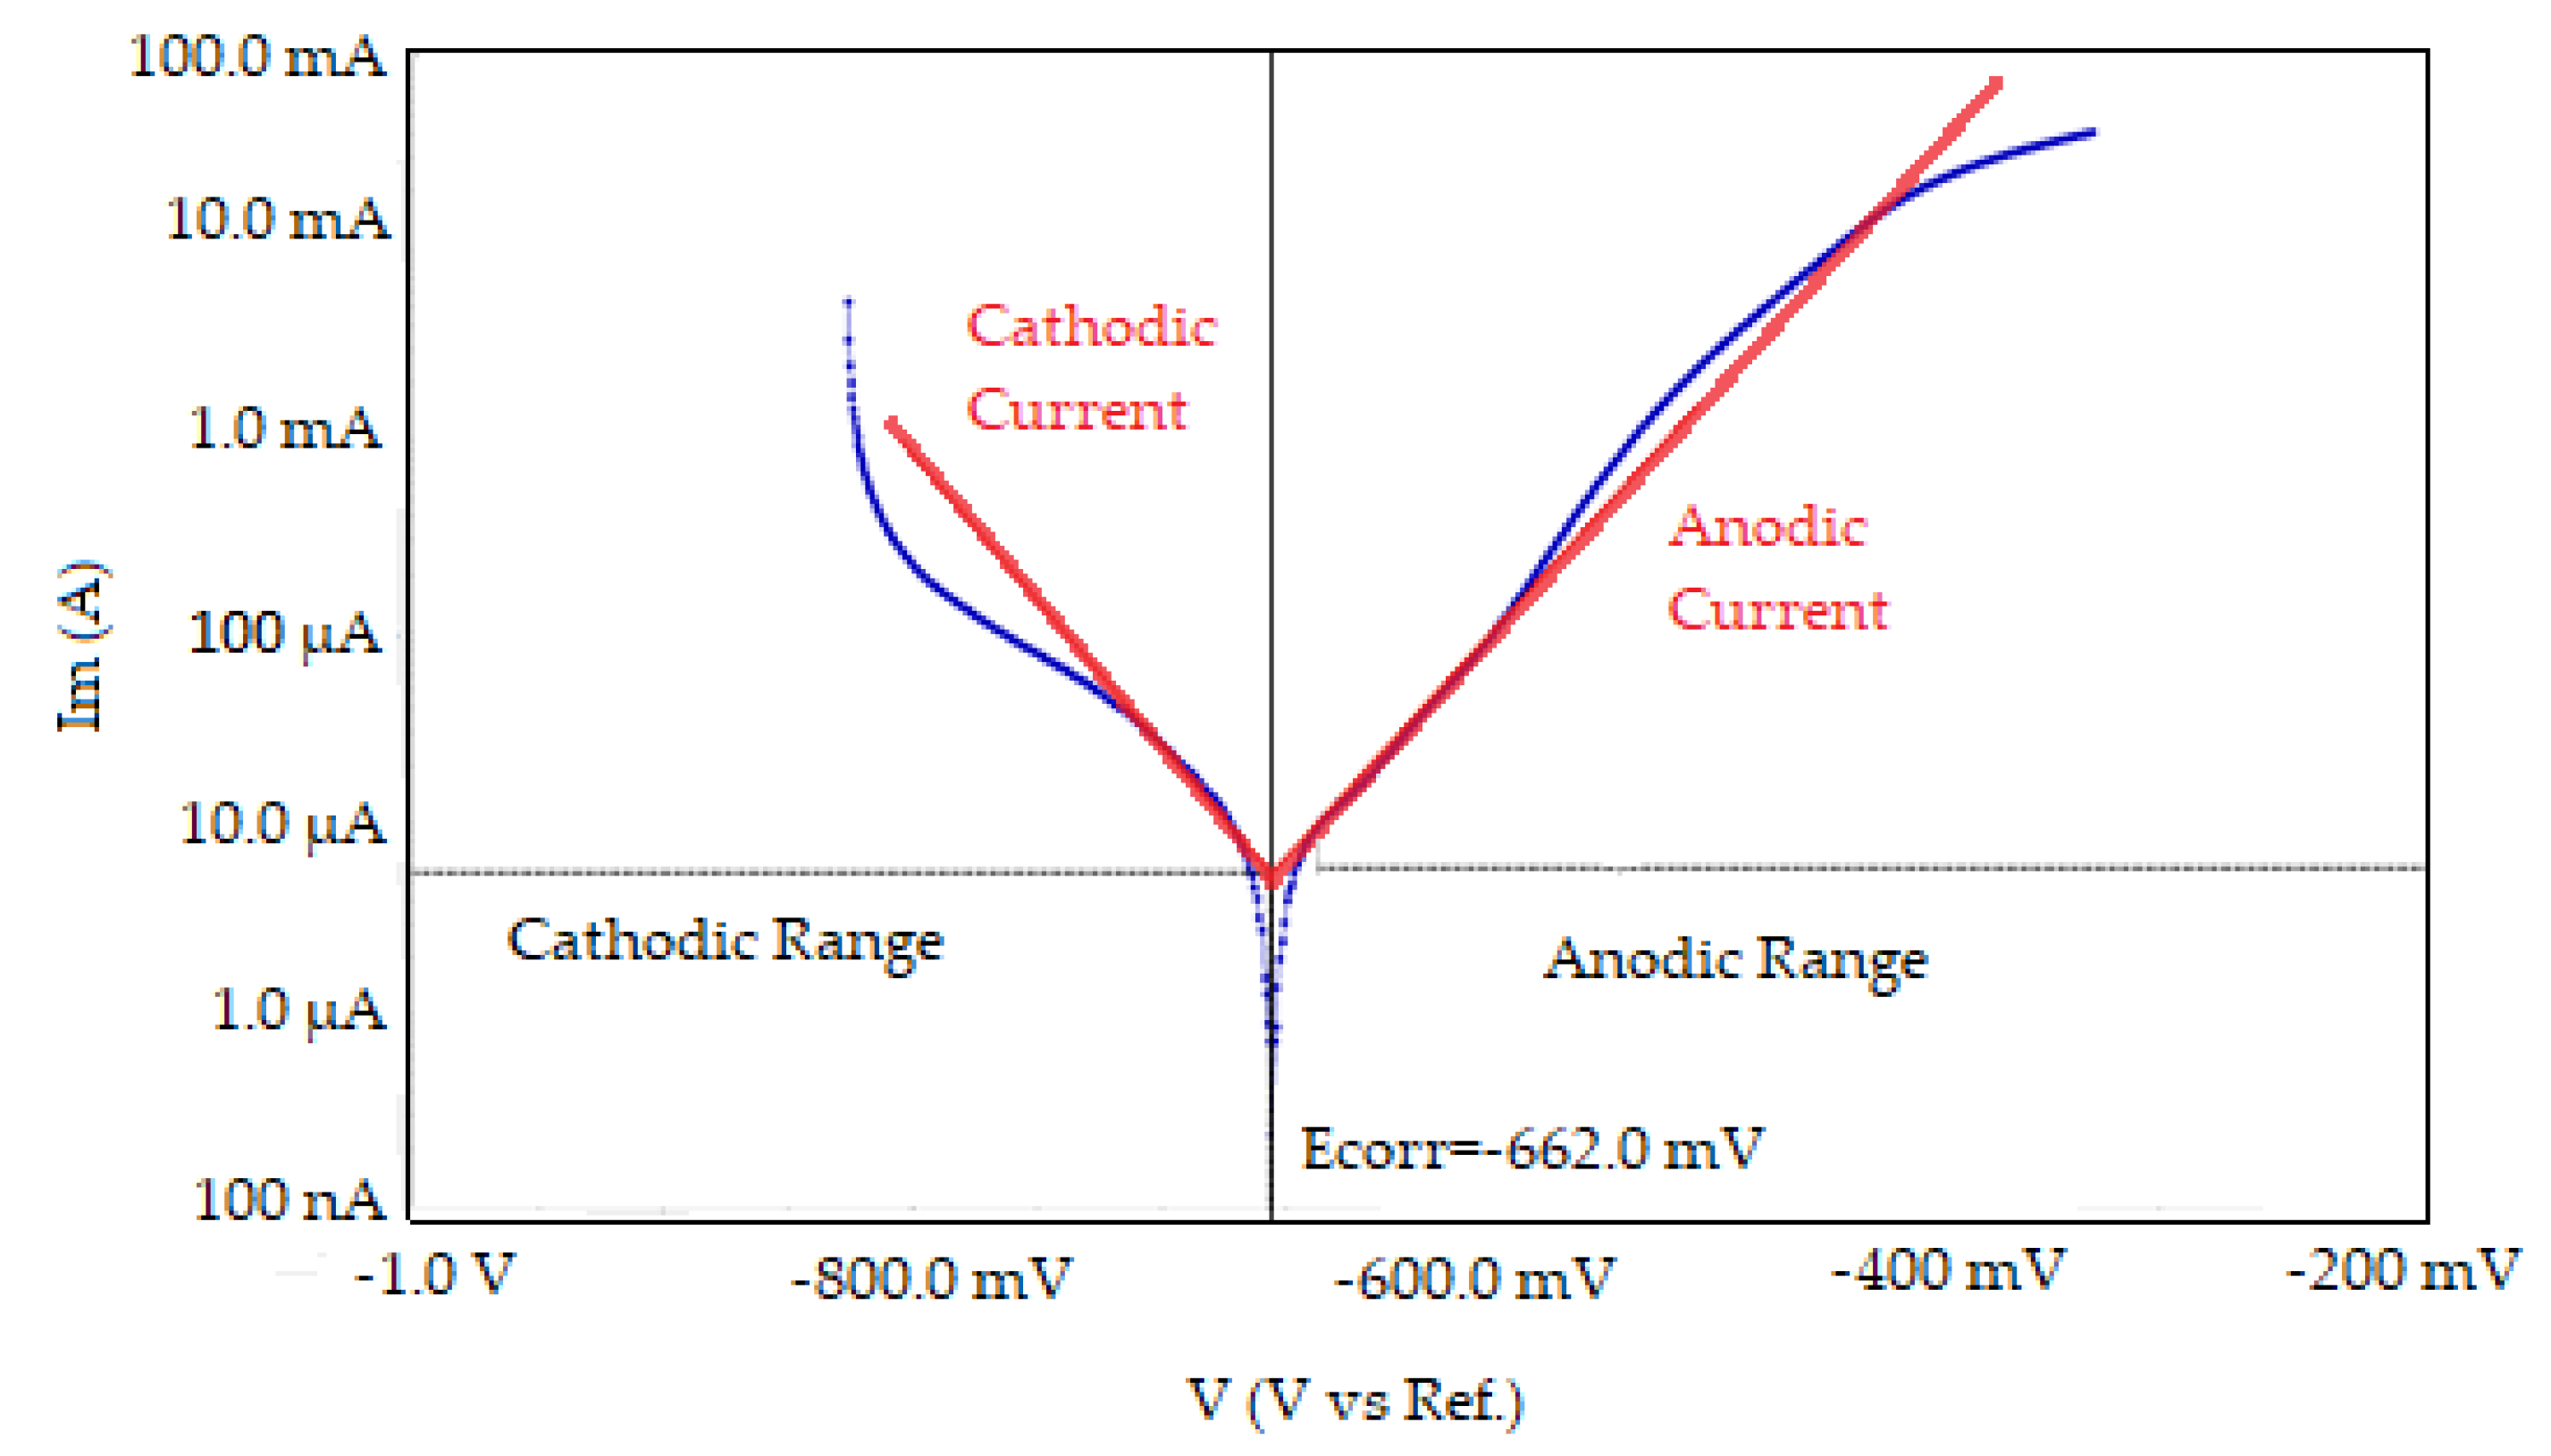
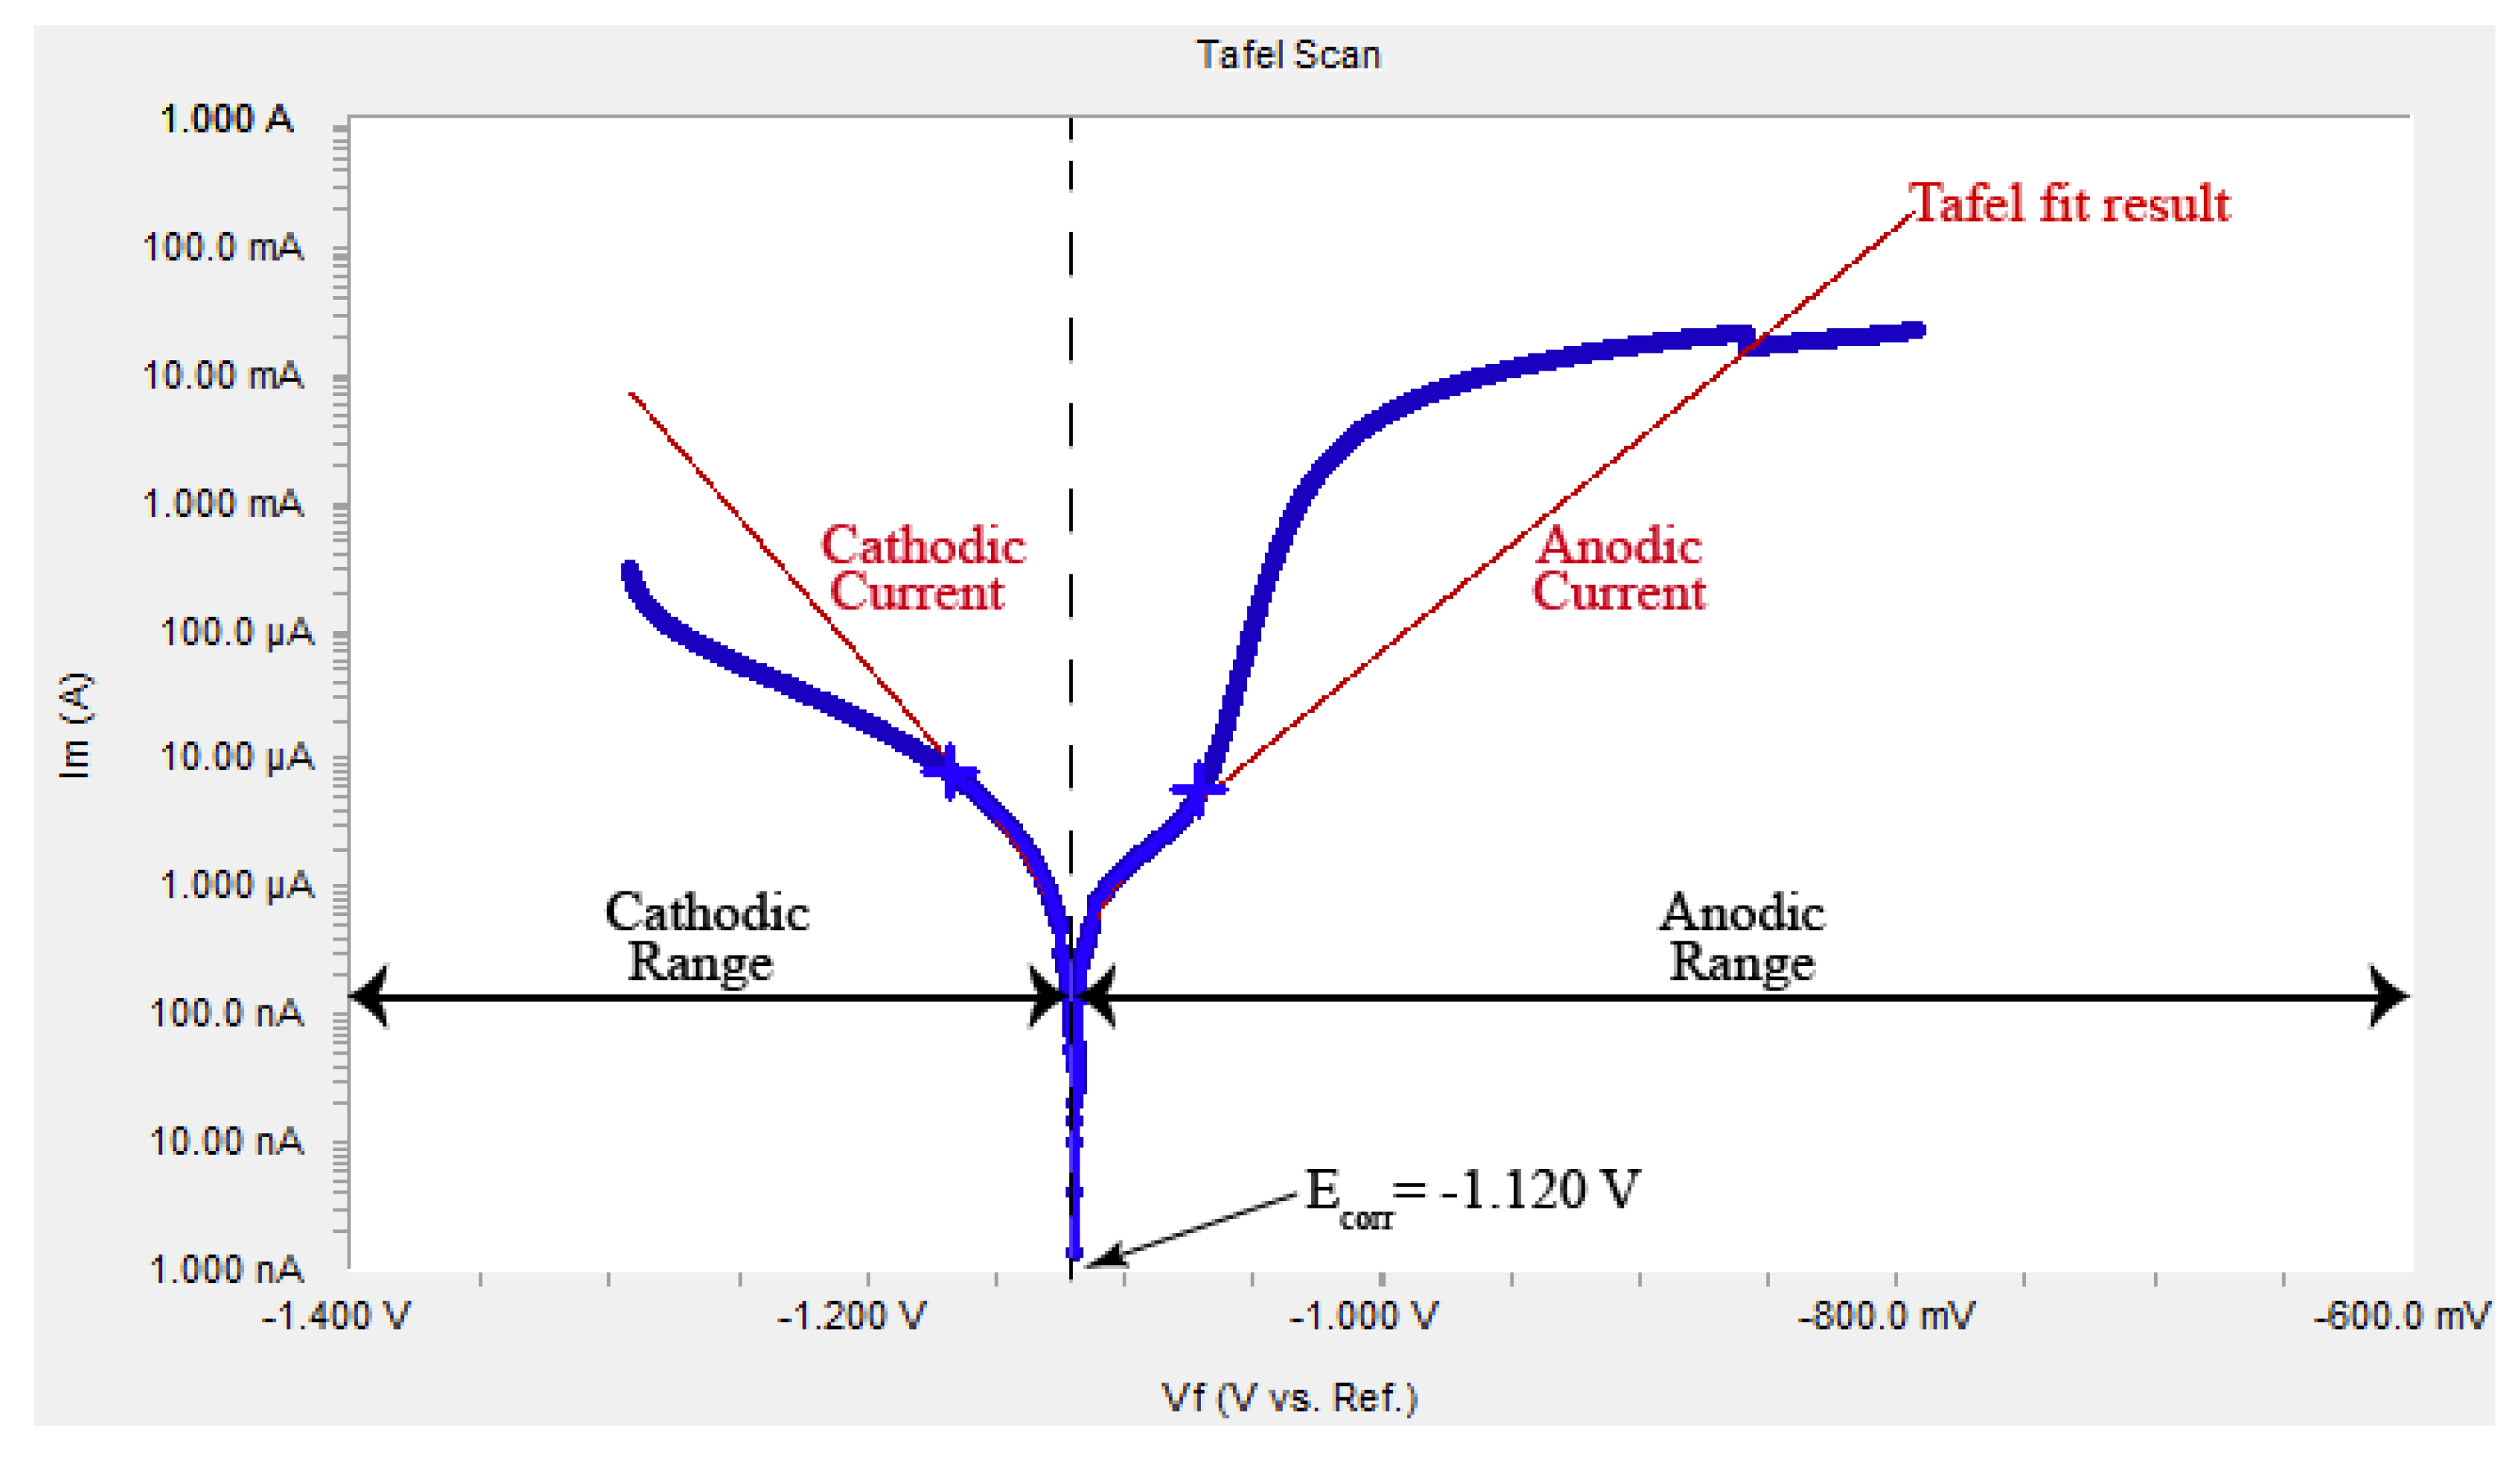
Since the corrosion is an electrochemical reaction, the corrosion rate could be described by its reaction rate, or the electron transferring rate, i.e., the current between anode side and cathode side. In a typical Tafel test, the testing instrument generates a range of potential between the anode and cathode, by attached counter electrode and working electrode, to excite the oxidation reaction on the anode aside and the reduction reaction on the cathode side. At the same time, the instrument also records the current for each potential generated during this process. As a result, two current vs. potential curves, one for the anode side and the other for cathode side, can be plotted in one graph, named Tafel plot. Figure 5 shows the measured Tafel plot from bare steel sample (Sample B).
After the Tafel plot was generated, to get the corrosion rate, the linear parts of anode and cathode side current vs. potential curves are used to find the balance point of anode and cathode side chemical reaction. At the balance point, the chemical reaction could continue without external interference, which means the current at the balance point is the corrosion rate of the testing metal. The measured corrosion potential is Ecorr, and the corrosion current density is Icorr. The larger value of corrosion current indicates a less corrosion resistance or a larger corrosion rate and vice versa. Thus, the corrosion current density can be calculated as follow [50]:
where the βA and βC are known as Tafel constants, which are the absolute value of slope of linear part of anode and cathode side polarization curve when the current axis is in log scale. Rp is the polarization resistance, which would be determined once the testing environment is settled down, and A is the testing area.
By fitting the linear part of Tafel plot graph, the Tafel constants, βA and βC, can be determined. With the polarization resistance (RP), which is determined by the material itself and the two Tafel constants, the corrosion rate can be calculated as follows [51]:
where CR is corrosion rate, K is unit conversion factor, WE is the equivalent weight of tested material, and d is density of tested material.
4. Corrosion Behavior Evaluation of Coated Steel
The corrosion behavior measured using the embedded FBG sensors were evaluated for steel plate samples coated using both polymeric coating and wire arc sprayed Al-Zn coating. The electrochemical method was also used to measure the corrosion rate of the wire arc sprayed Al-Zn coating in addition to the bare steel. Comparison between the FBG sensors and the electrochemical method for the wire arc sprayed Al-Zn coating was performed to validate the effectiveness of FBG sensors for monitoring corrosion in coated steel components.
4.1. Corrosion Behavior Evaluation in Polymeric Coating
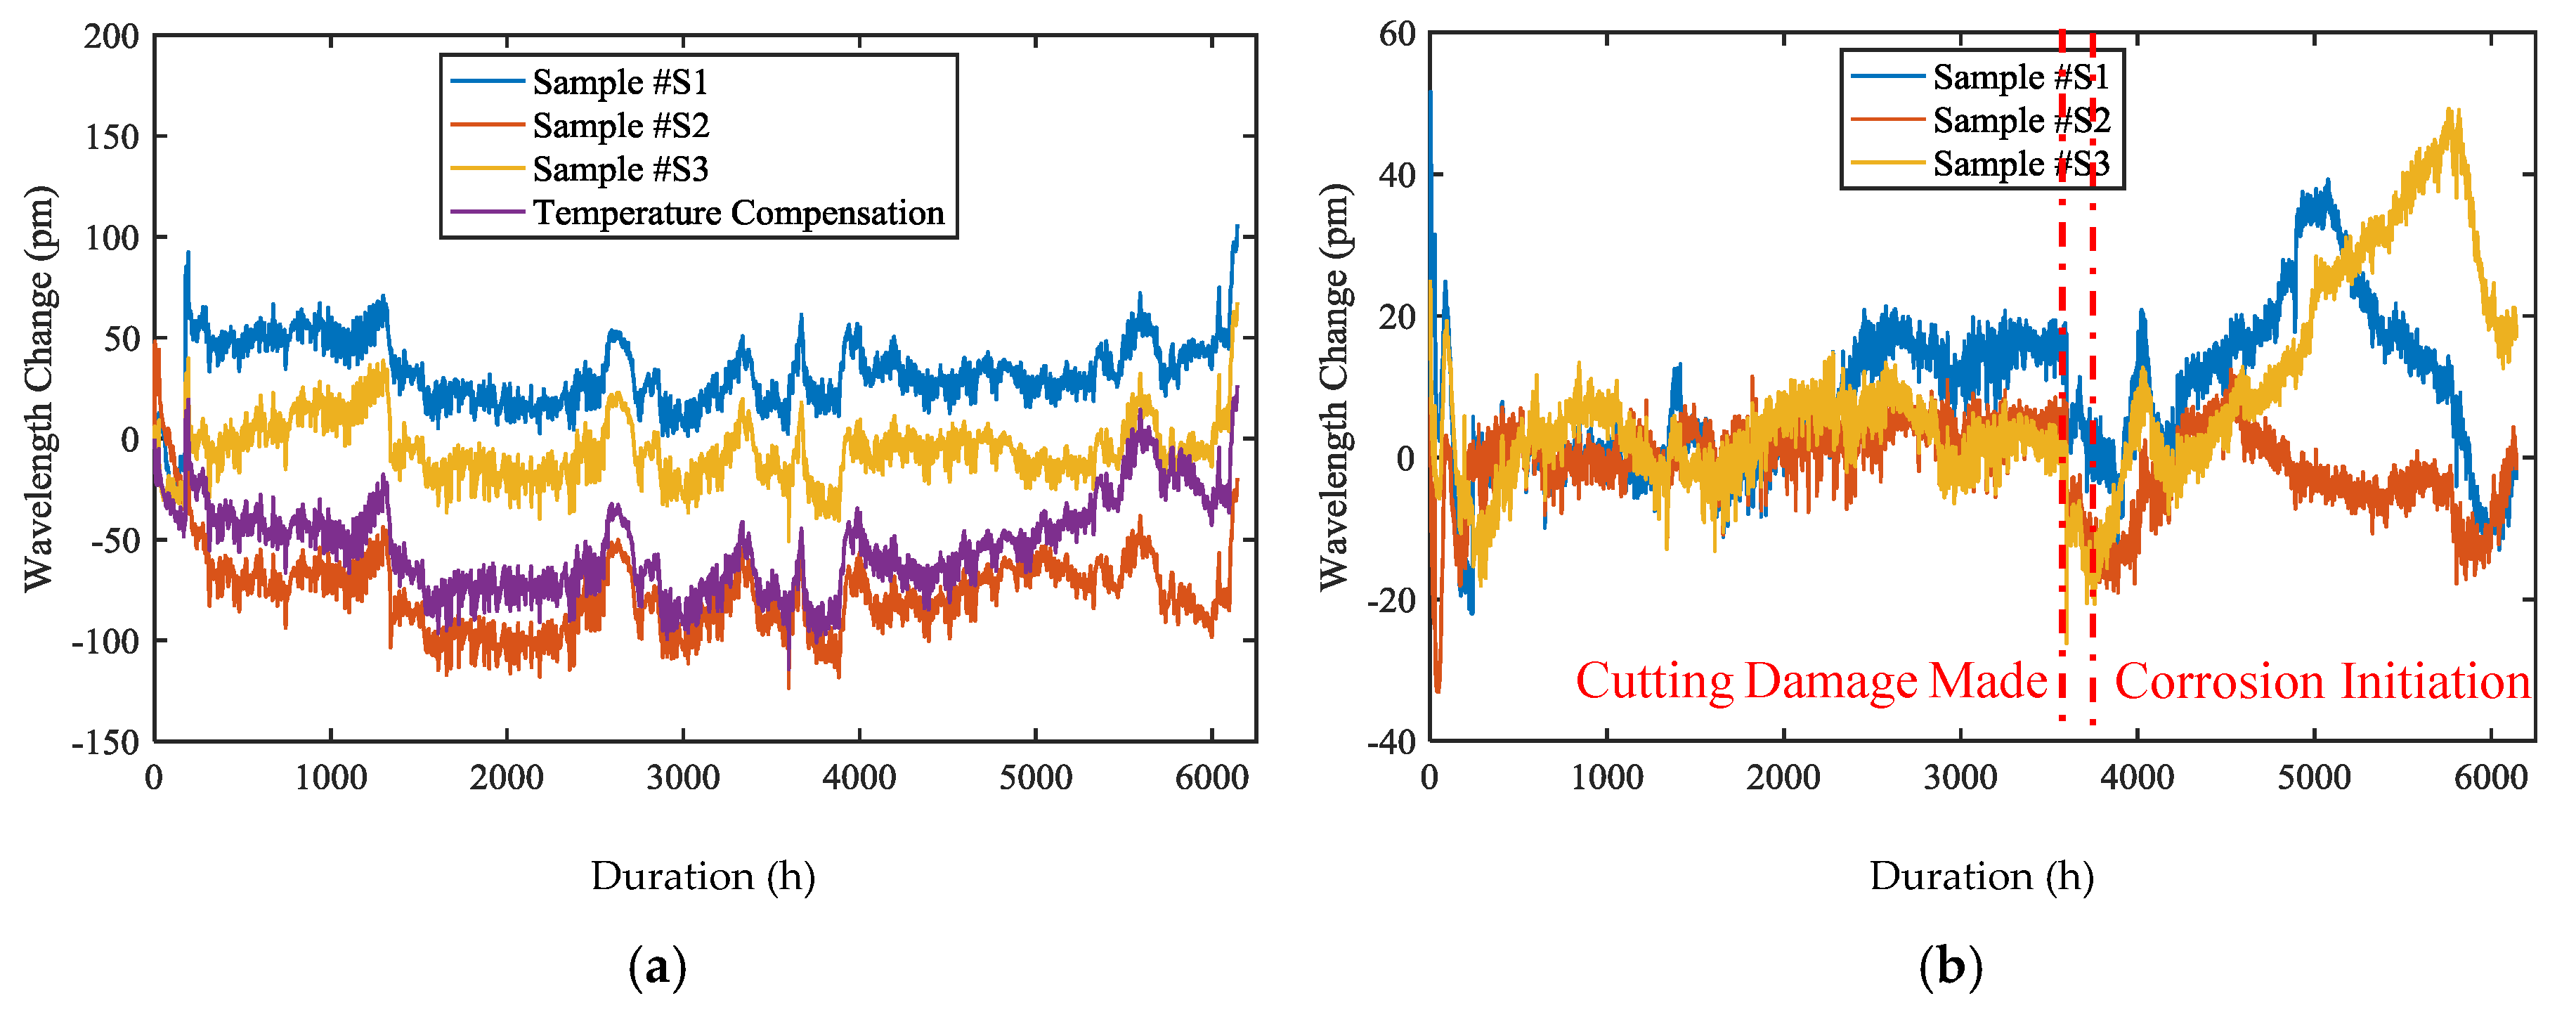
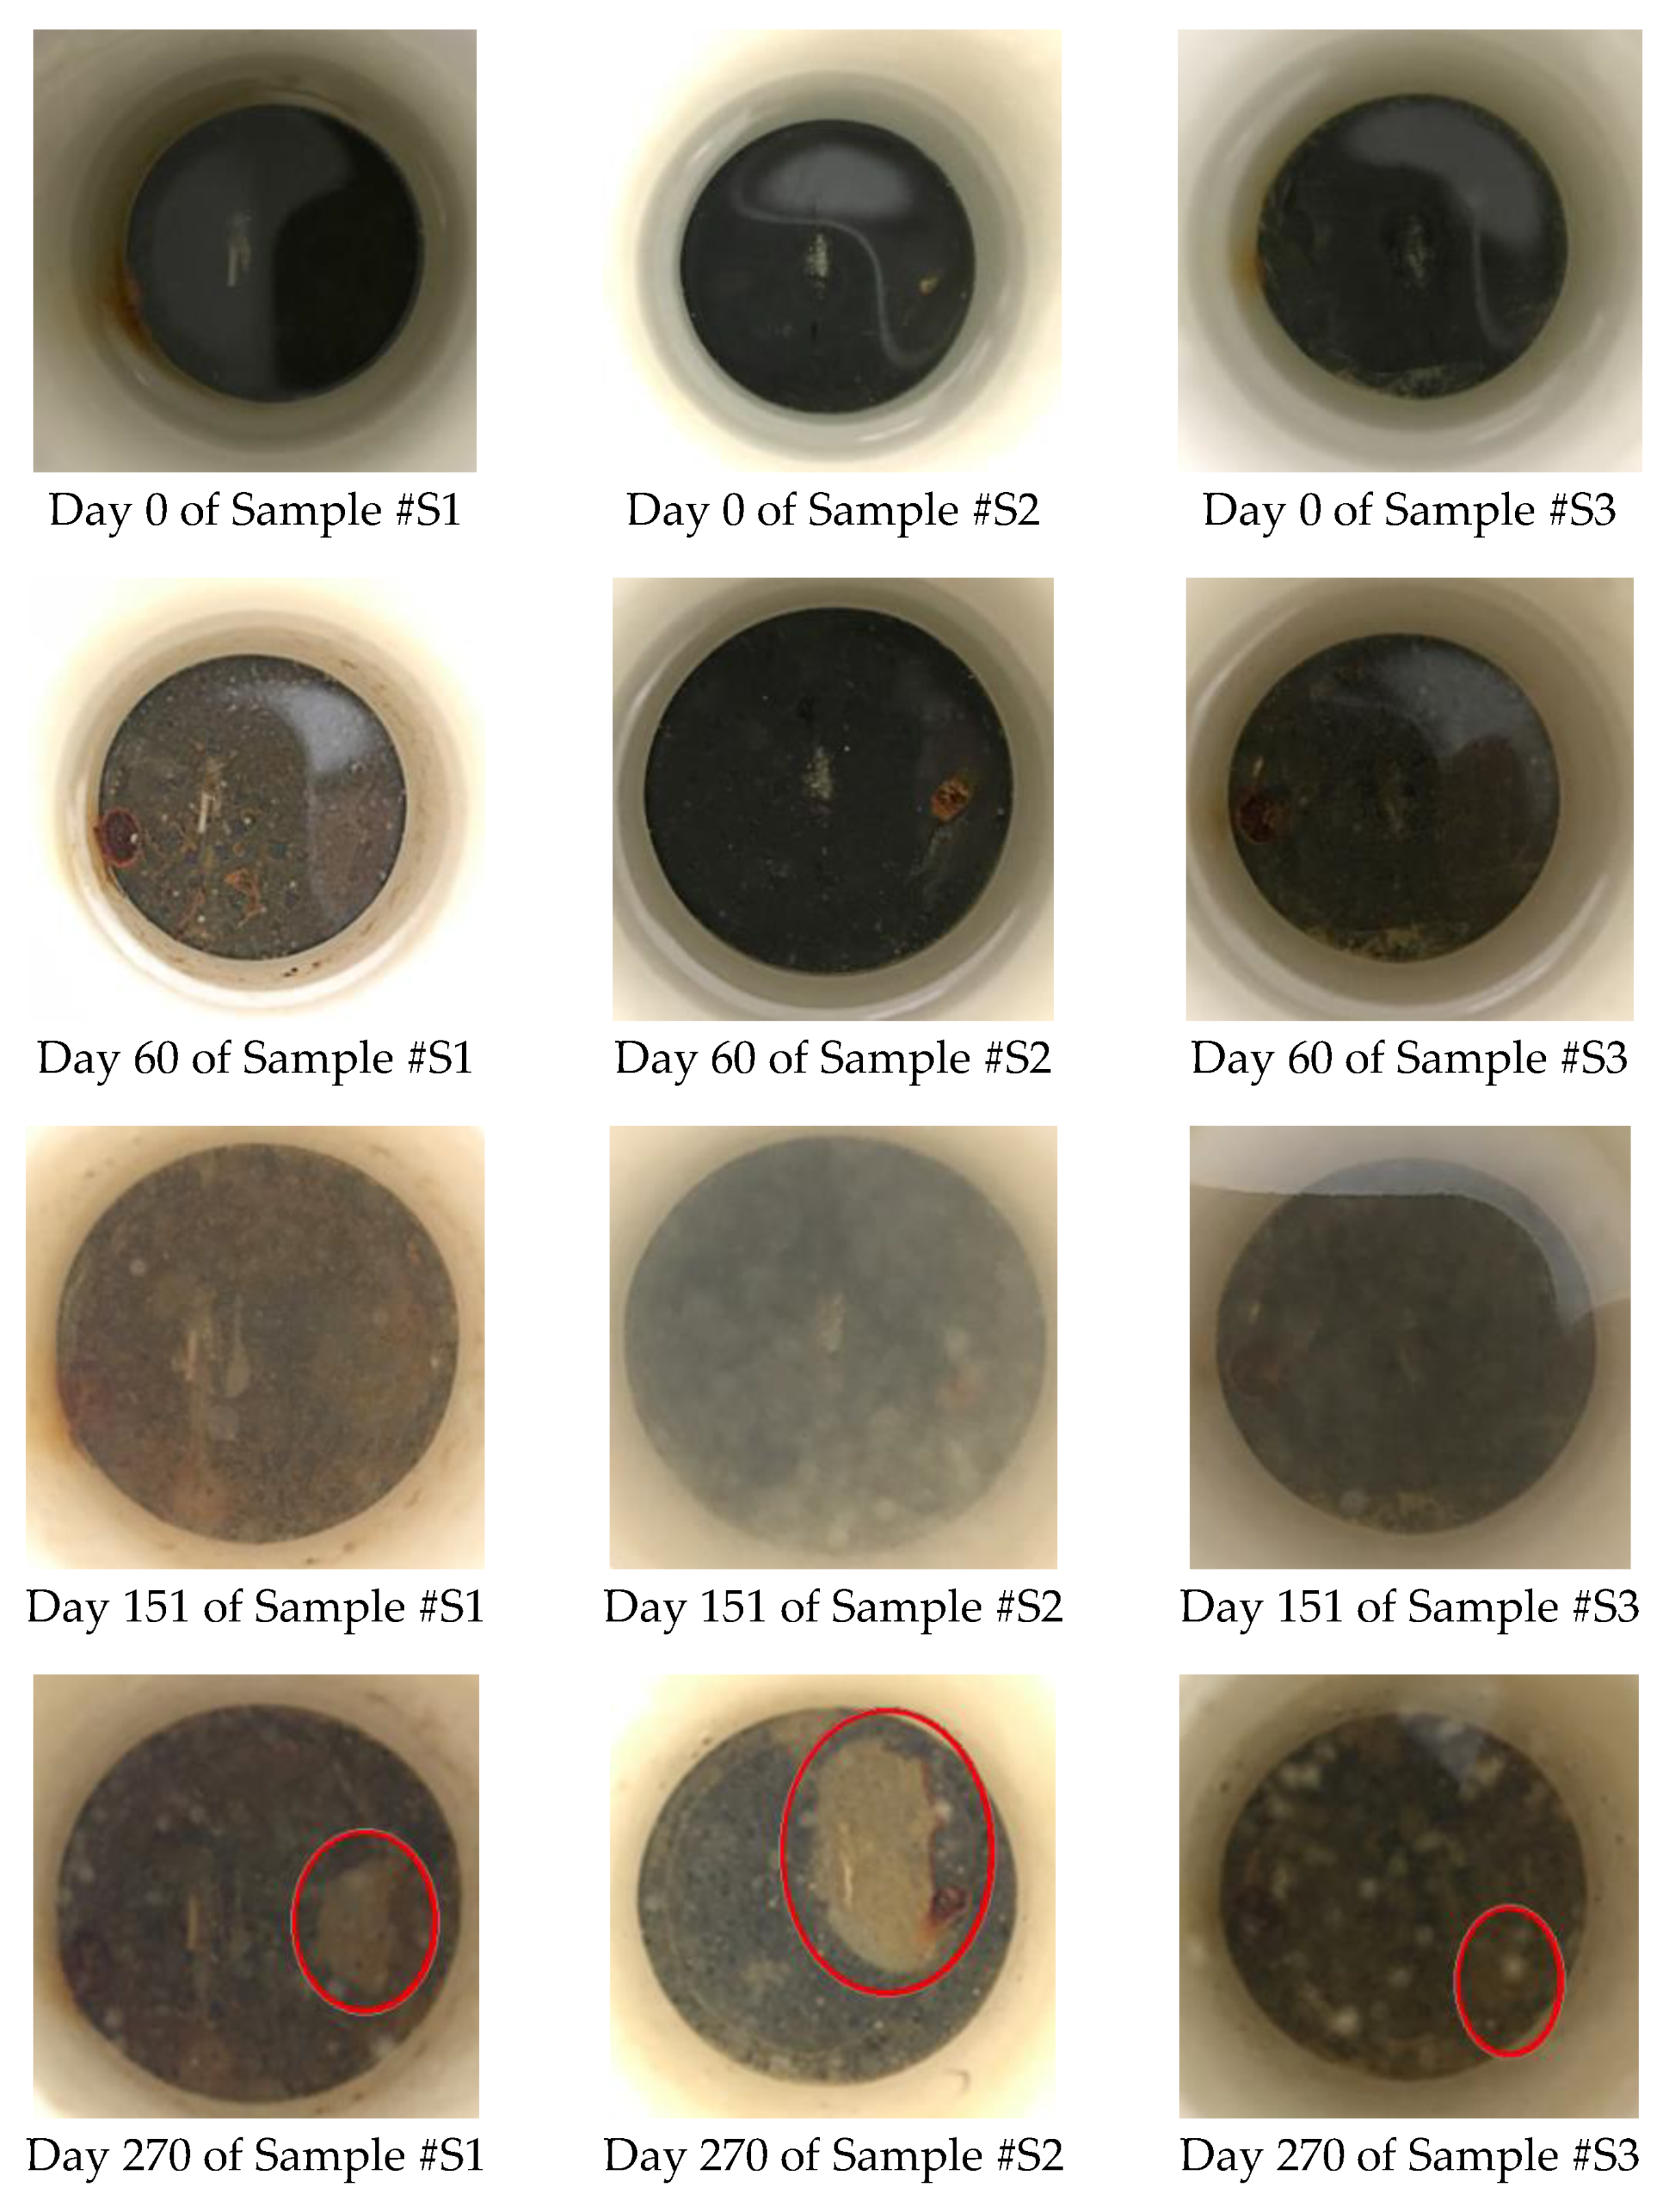
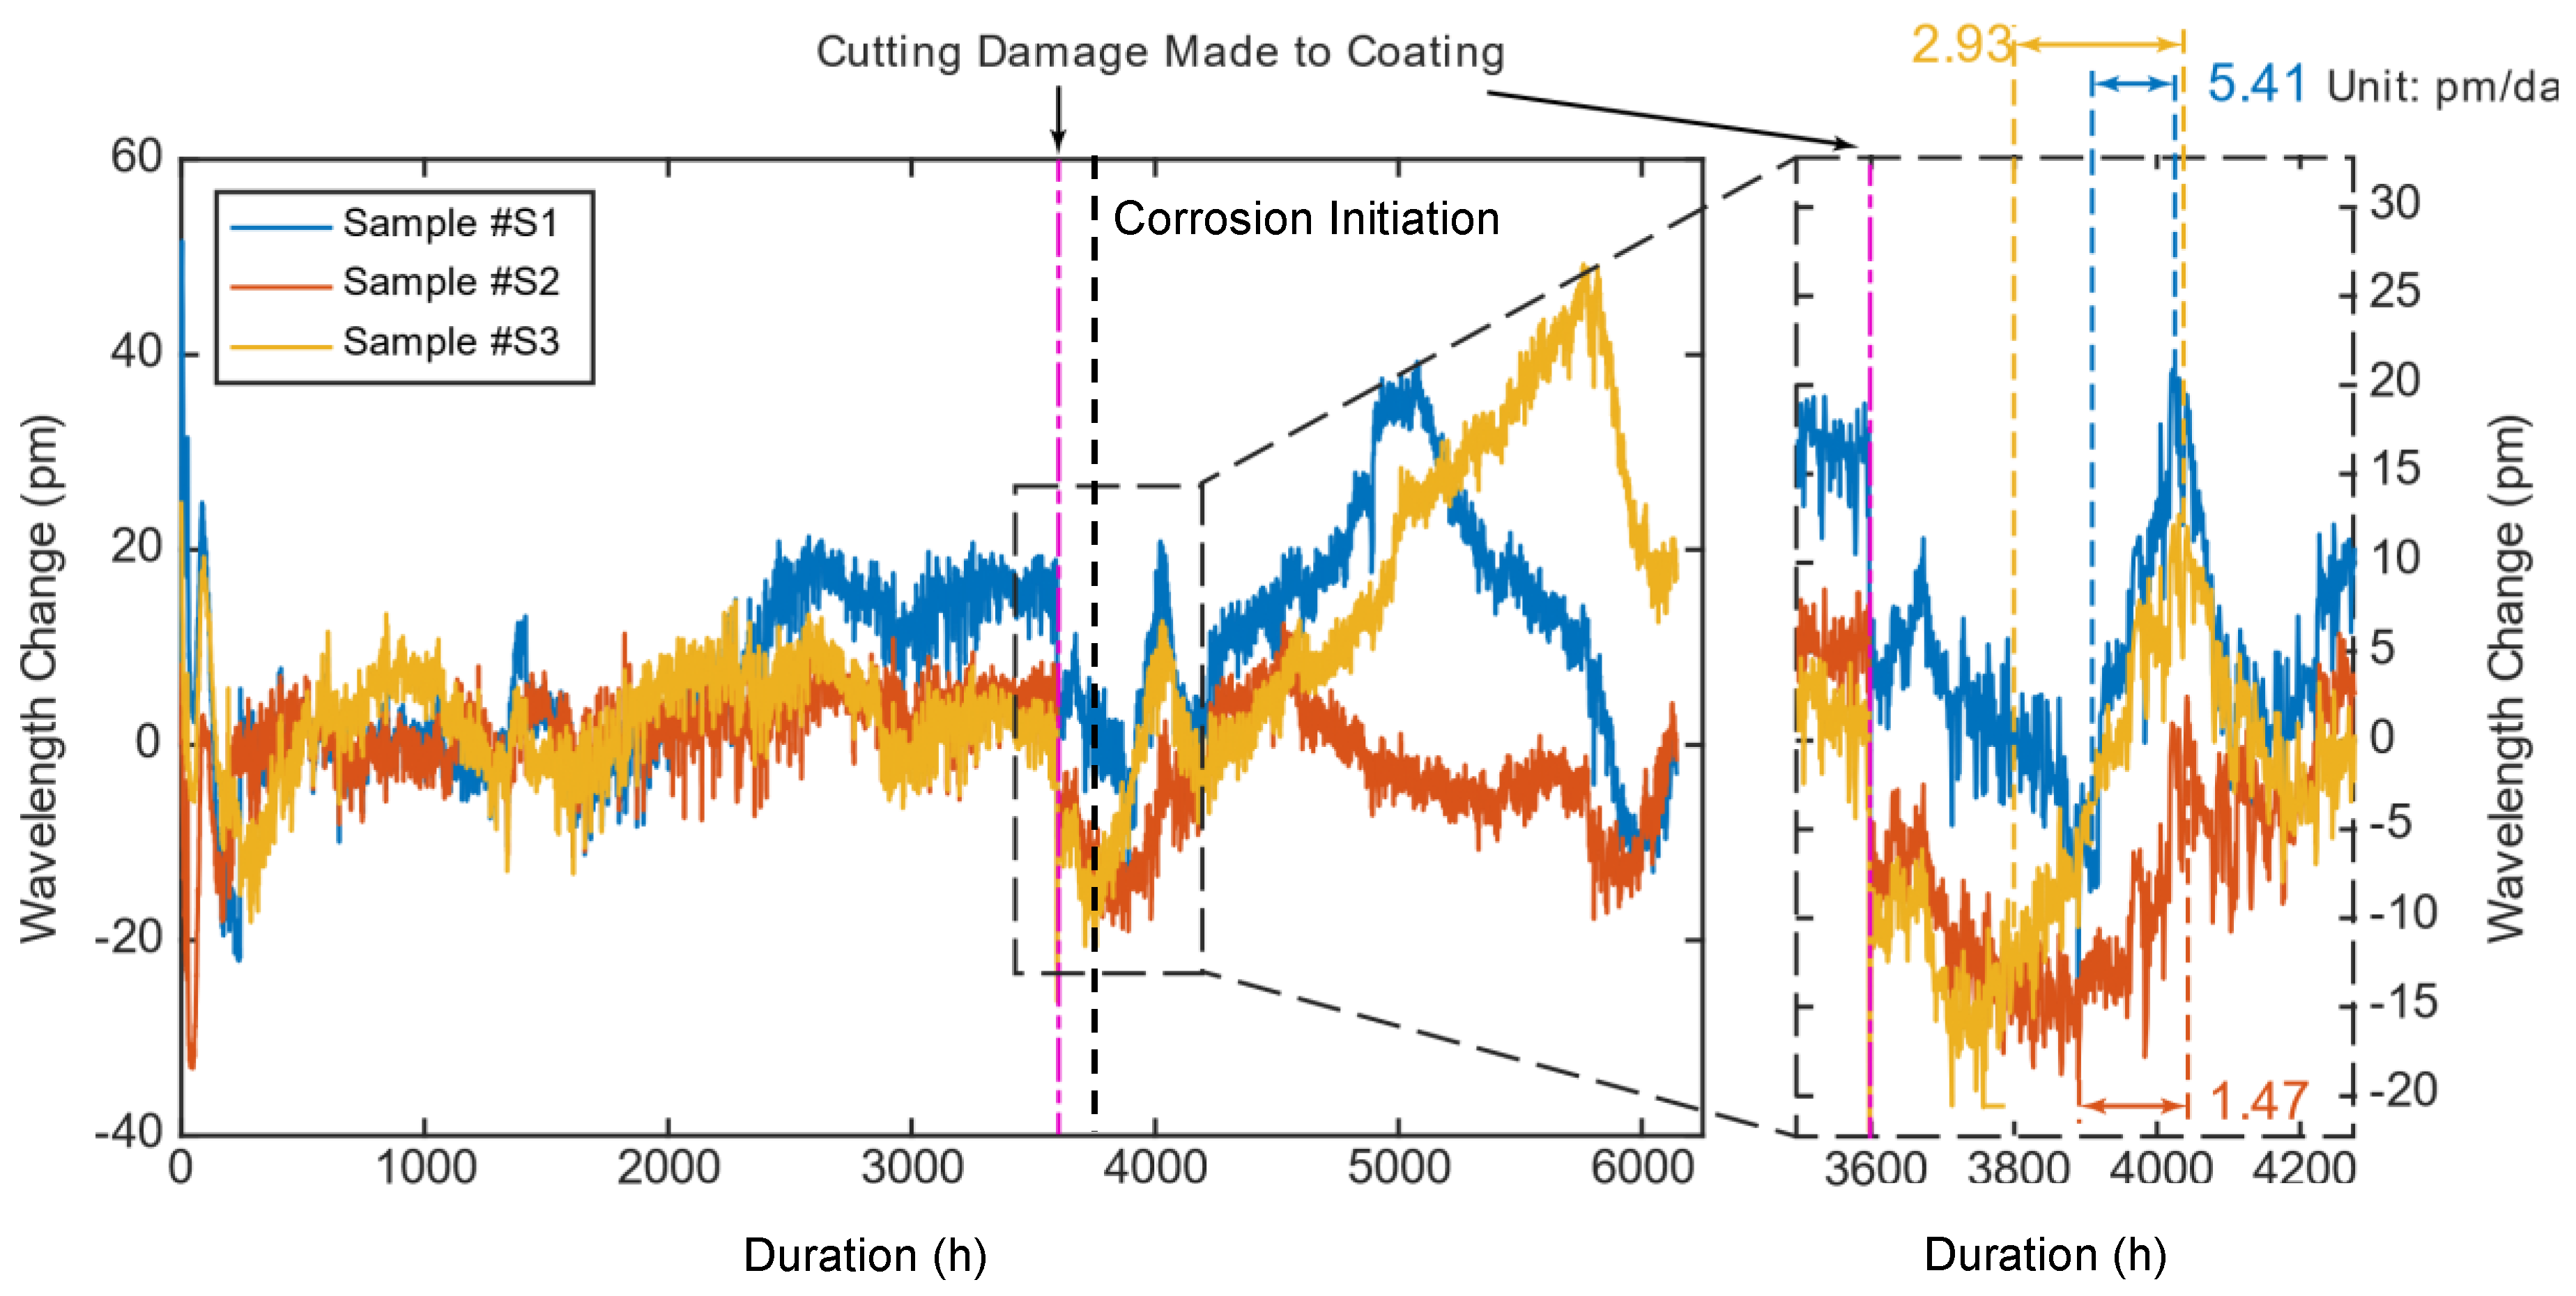
The corrosion behavior of polymeric coating was assessed using the embedded FBG sensors through laboratory accelerated corrosion tests. As seen in Table 1, three samples (#S1–S3) with epoxy resin coatings were tested. Due to strong corrosion resistance of the epoxy coating, the accelerated corrosion experiment run for 6480 h (270 days) in total. The center wavelength change collected from FBG sensors were shown in Figure 6a before temperature compensation and Figure 6b after temperature compensation. If the epoxy coating was not damaged, it can isolate the substrate from corrosive environment outside very well. Thus, corrosion cannot get initiated without the damage of epoxy coating. It was observed that after the first 144 h (6 days) short-term effects for coatings and sensors to be settled down, started from the 144 to 3598 h (6 to 150 days), the center wavelength of embedded FBG sensors of samples did not change, except for Sample #S1, which increased about 20 pico-meters. However, in practical, epoxy coating was vulnerable to external physical interferences such as impact force, abrasion, and metal cutting. To simulate the corrosion on epoxy coated steel, after 3598 h (150 days), as shown in Figure 6b, a manual cutting damage of around 2.5 mm in length was intentionally made to the epoxy coating parallel to sensor location. Selected visual inspection results of the epoxy coated steel samples were shown in Figure 7 for 0 h (Day 0), 1440 h (Day 60), 3624 h (Day 151, which was right after the fabricated cutting damage), and 6480 h (Day 270, which was the end of the lab testing).
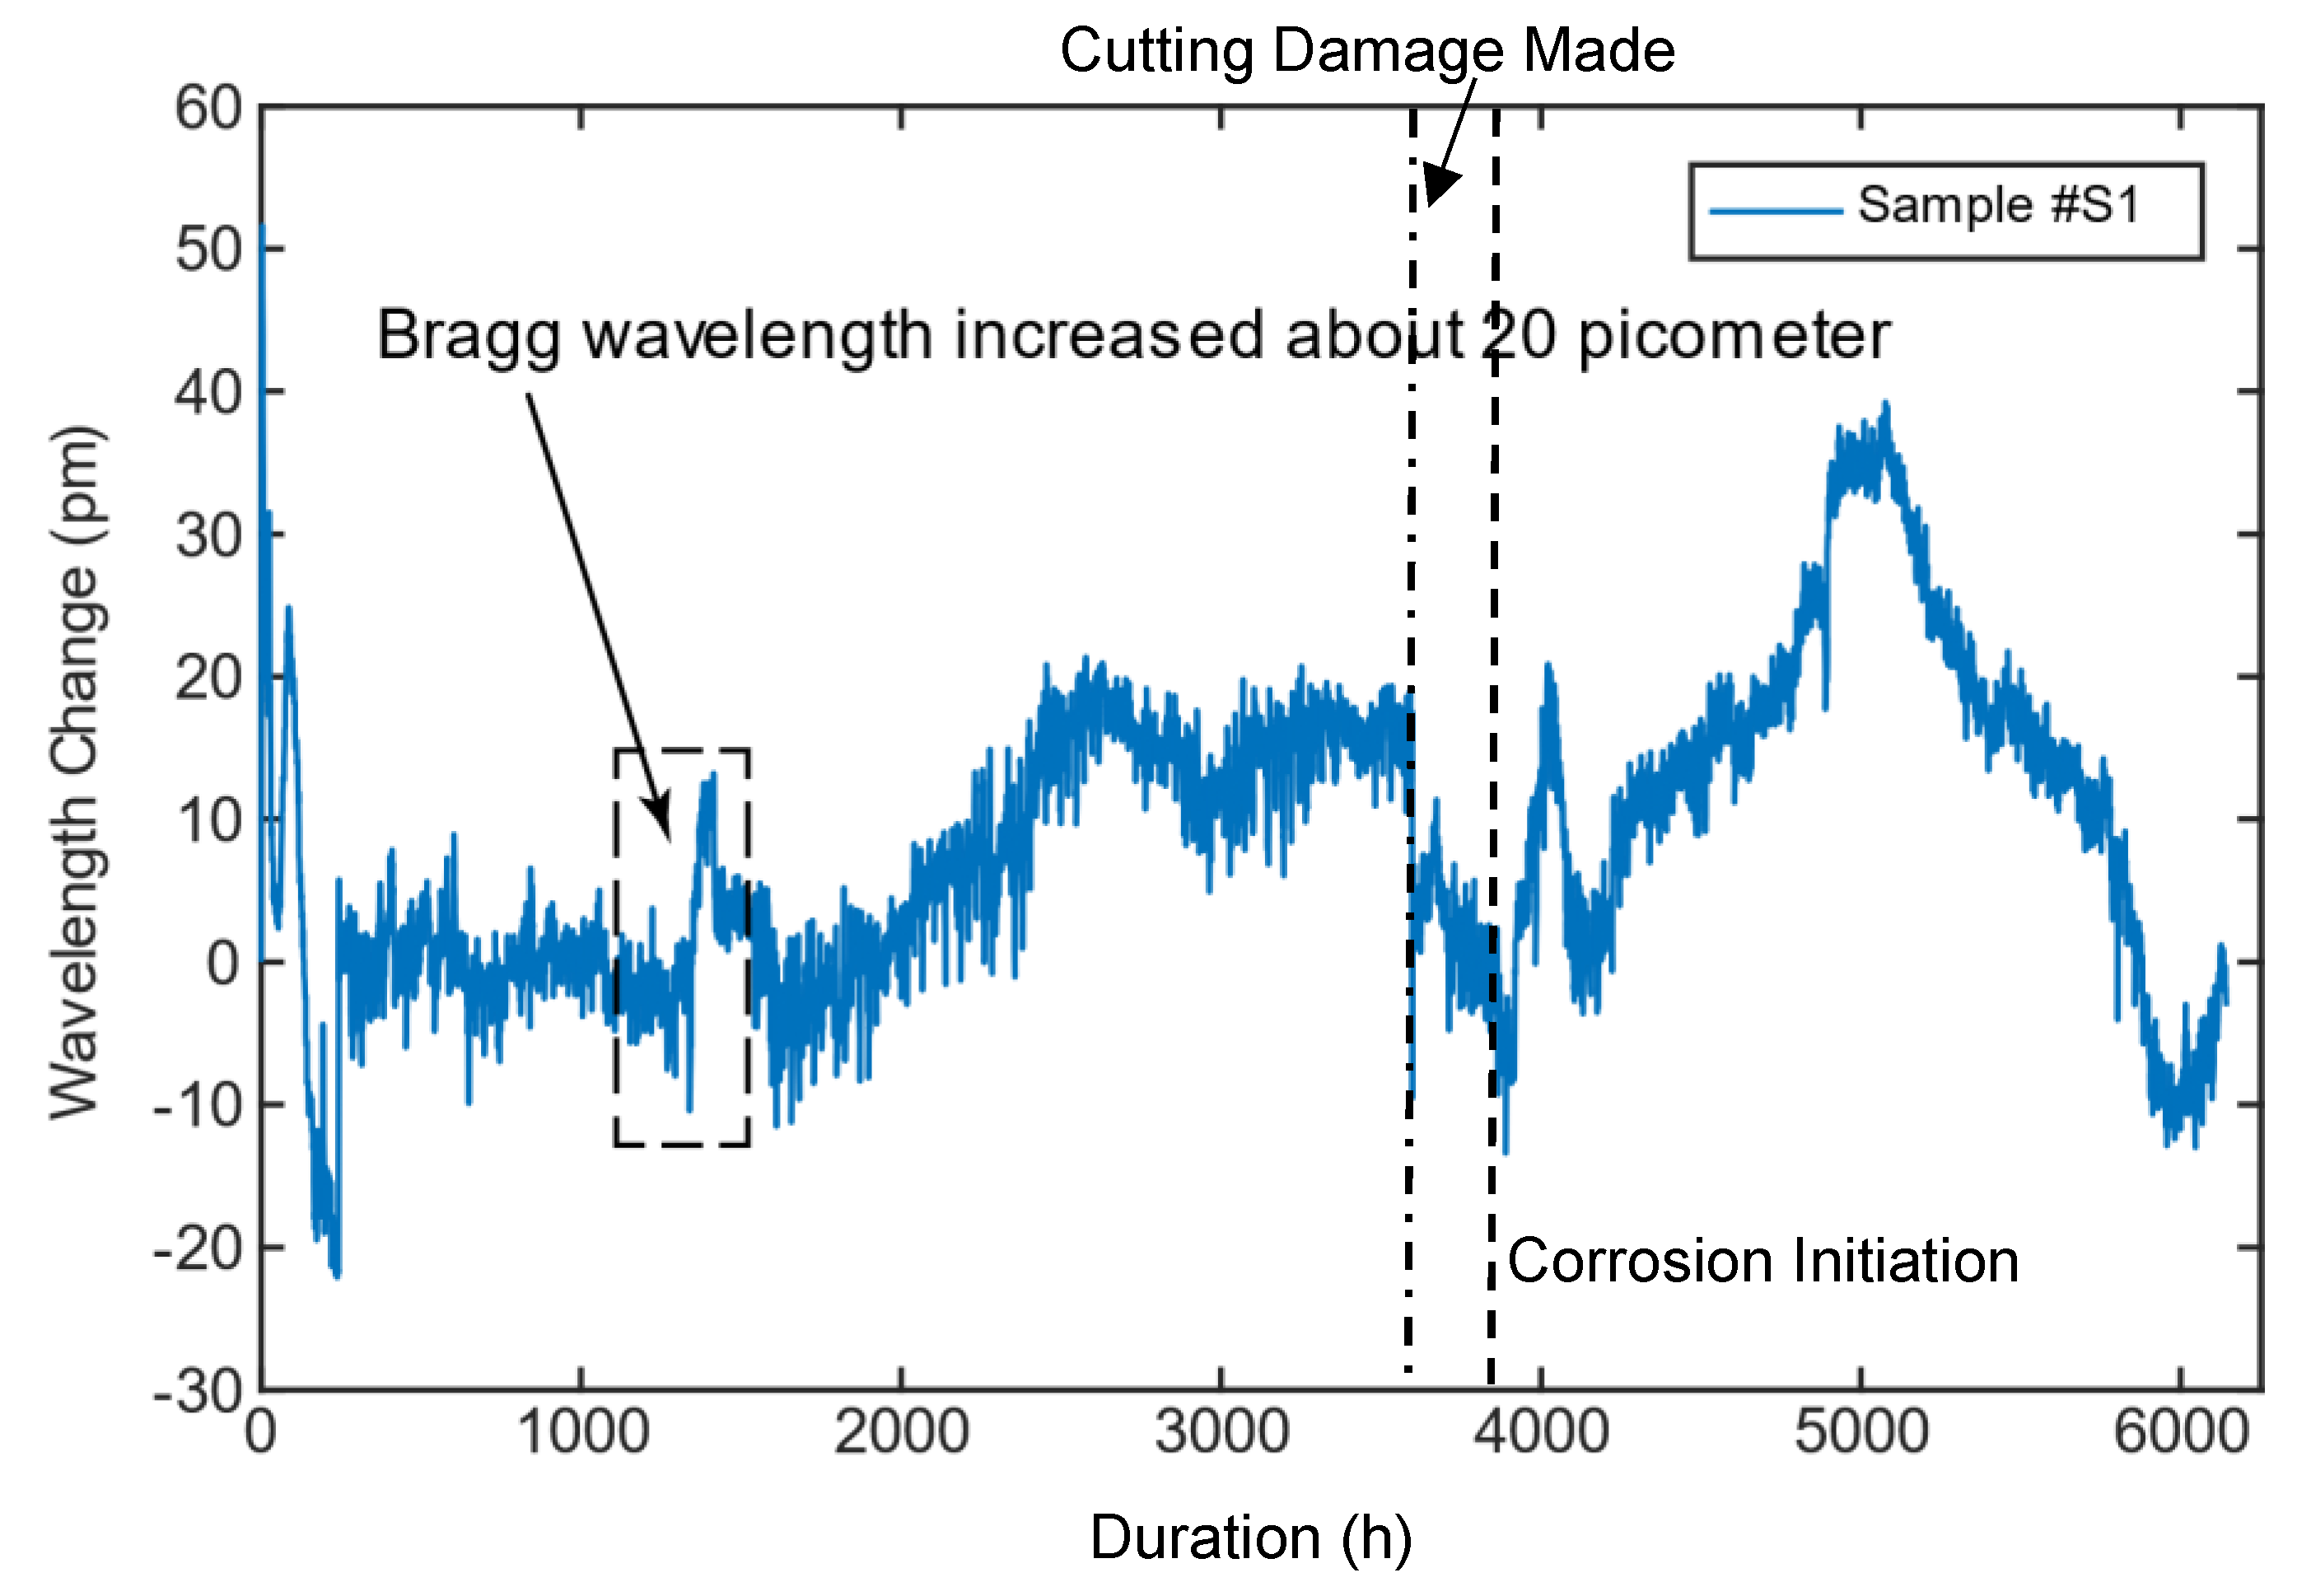
It was observed from visual inspection in Figure 7 that Sample #S1 had corrosion initiation before the cutting damage was made. This contributed to the 20 pico-meter increase in FBG sensor’s Bragg wavelength change of Sample #S1 started from about 1270 h (53 days), as shown in Figure 8. This may be induced by the fact that the PVC pipe was attached using a different type of epoxy before the epoxy coating was fully cured, causing the coating delaminated from the substrate.
By taking a closer look at the Bragg wavelength change curve of the three sensors together, as seen in Figure 9, it was found that when the cutting damages were intentionally made to the epoxy coatings, the Bragg wavelength drop dramatically, indicating damage initialization. After the initial Bragg wavelength drop, it was followed by a rapid increase, similar to the corrosion initiation pattern. This rapid increase suggested that once the epoxy coating had been damaged, the bare steel had been exposed to the corrosive 3.5 wt % NaCl solution, and corrosion started to occur on the substrate.
In Figure 9, it was observed that Bragg wavelength increases were followed by drops, and each of these drops suggested an internal crack or delamination of the epoxy coating. From the visual inspection result of 6480 h (Day 270), it can be clearly identified that a large portion of epoxy coating had delaminated from the substrate, and the samples were severely corroded. Additionally, the corrosion rate using Equation (5) after the crack was made were listed in the Table 3. An average of 3.650 µm/year of corrosion rate for steel with delaminated epoxy coating was detected using the embedded FBG sensors. Comparing to 39.263 µm/year for bare steel, polymeric coating reduces the corrosion rate significantly even delaminated. The testing results indicated that embedded FBG sensing system could successfully detect damages, cracks, or delamination in polymeric coating and the corrosion progressing after delamination.
4.2. Wire Arc Sprayed Al-Zn Coating
A steel plate coated with wire arc sprayed Al-Zn coating, Sample #A4 was first tested using the Tafel test for corrosion rate estimation. The measured Tafel plot of wire arc sprayed Al-Zn coated sample (Sample #A4) was shown in Figure 10. The corrosion rate of the tested sample was calculated using Equations (6) and (7), and Table 4 listed the parameters estimated from the Tafel test. The corrosion rate of the wire arc sprayed Al-Zn coating was measured as 2.184 µm/year using the electrochemical method.
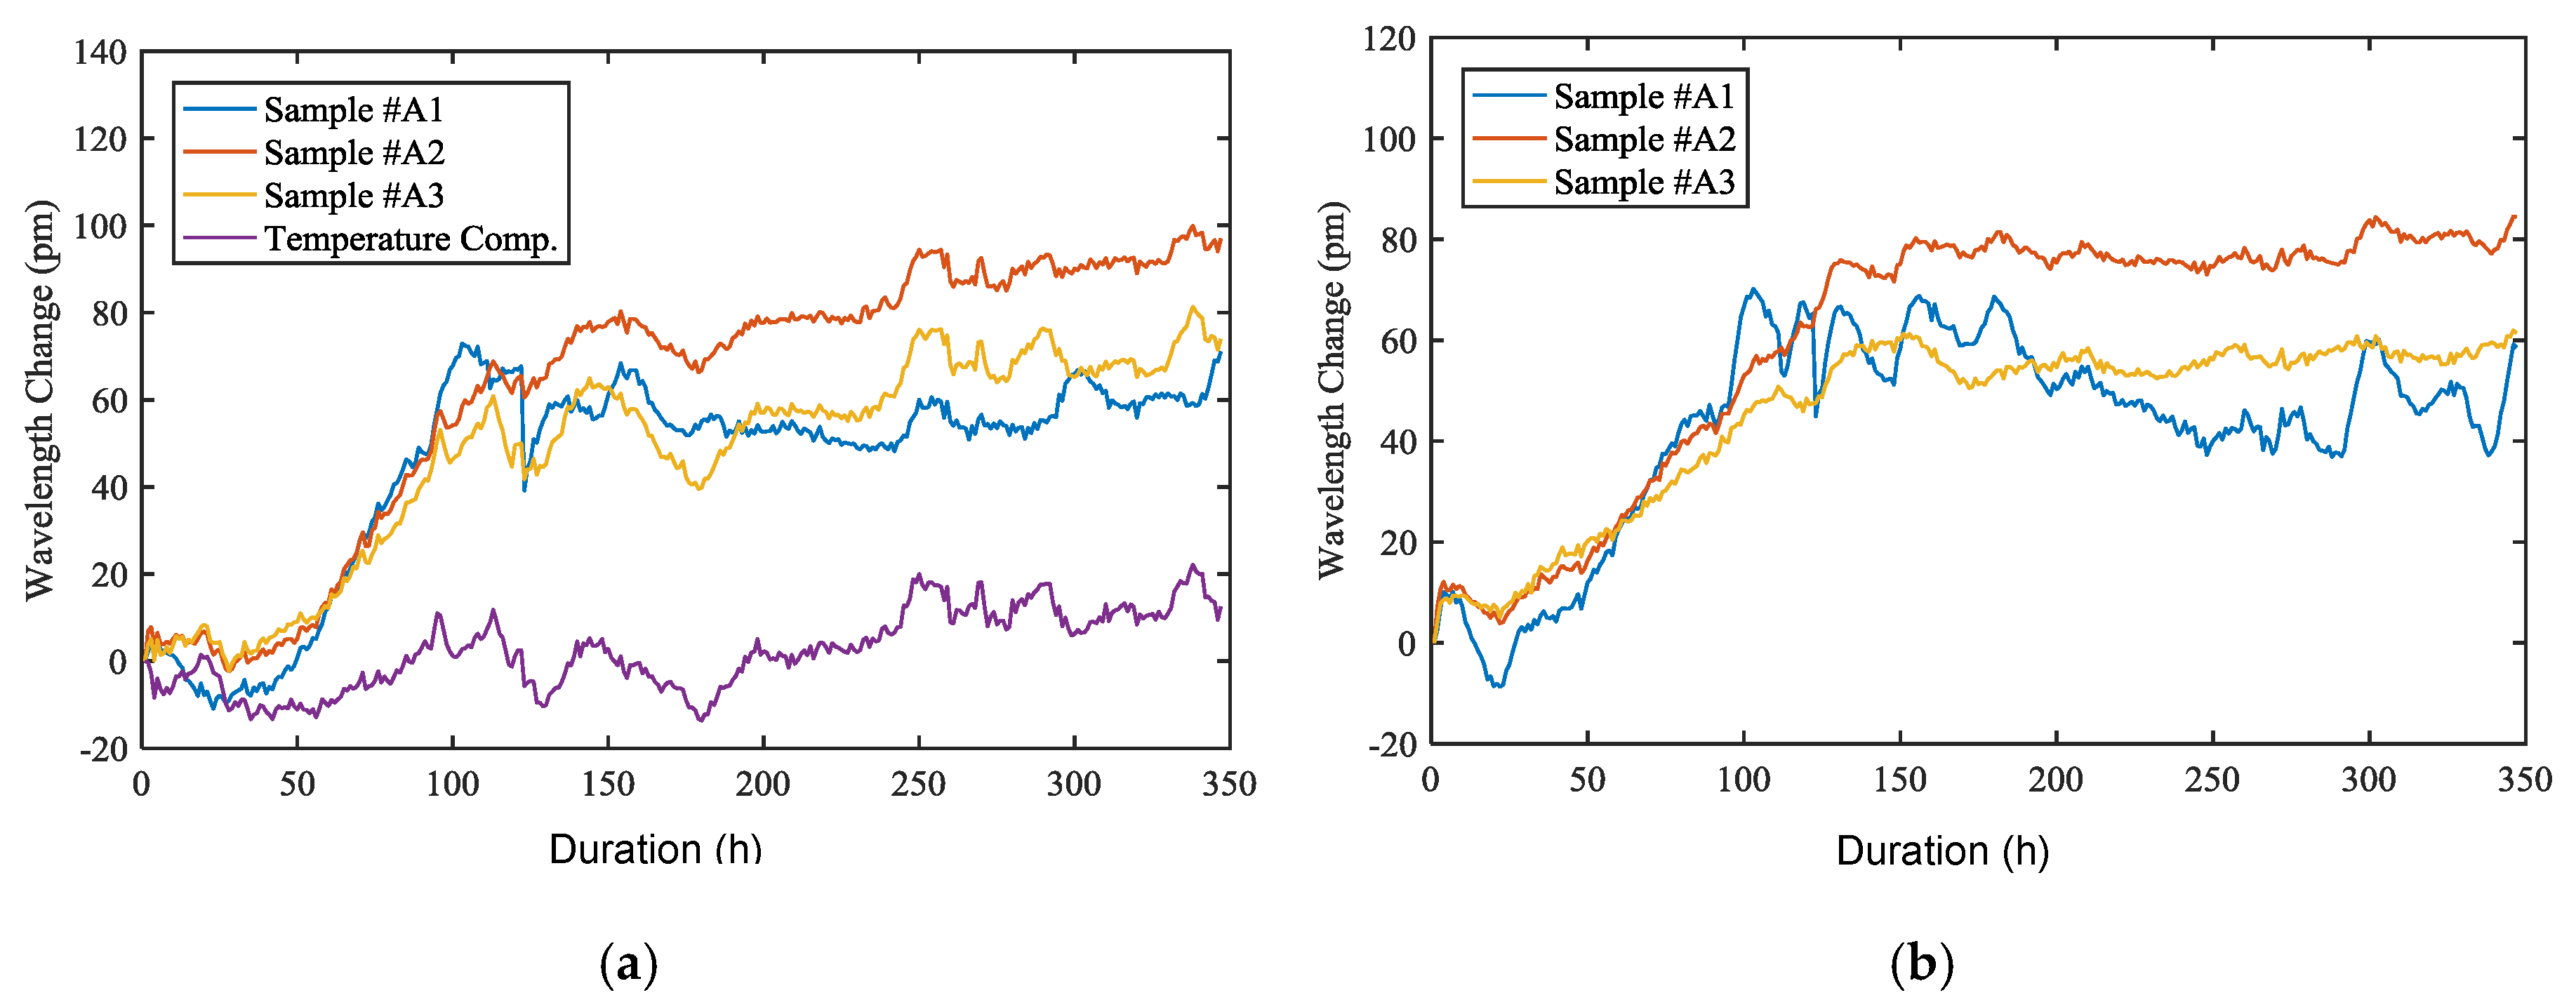
Steel plates coated with wire arc sprayed Al-Zn coatings were also assessed using the embedded FBG sensors through laboratory accelerated corrosion tests as indicated in Table 1. Figure 11a shows the data collected from embedded FBG sensing system, together with the data collected from the temperature compensation sensor during the two-week period, and Figure 11b shows the data after temperature compensation.
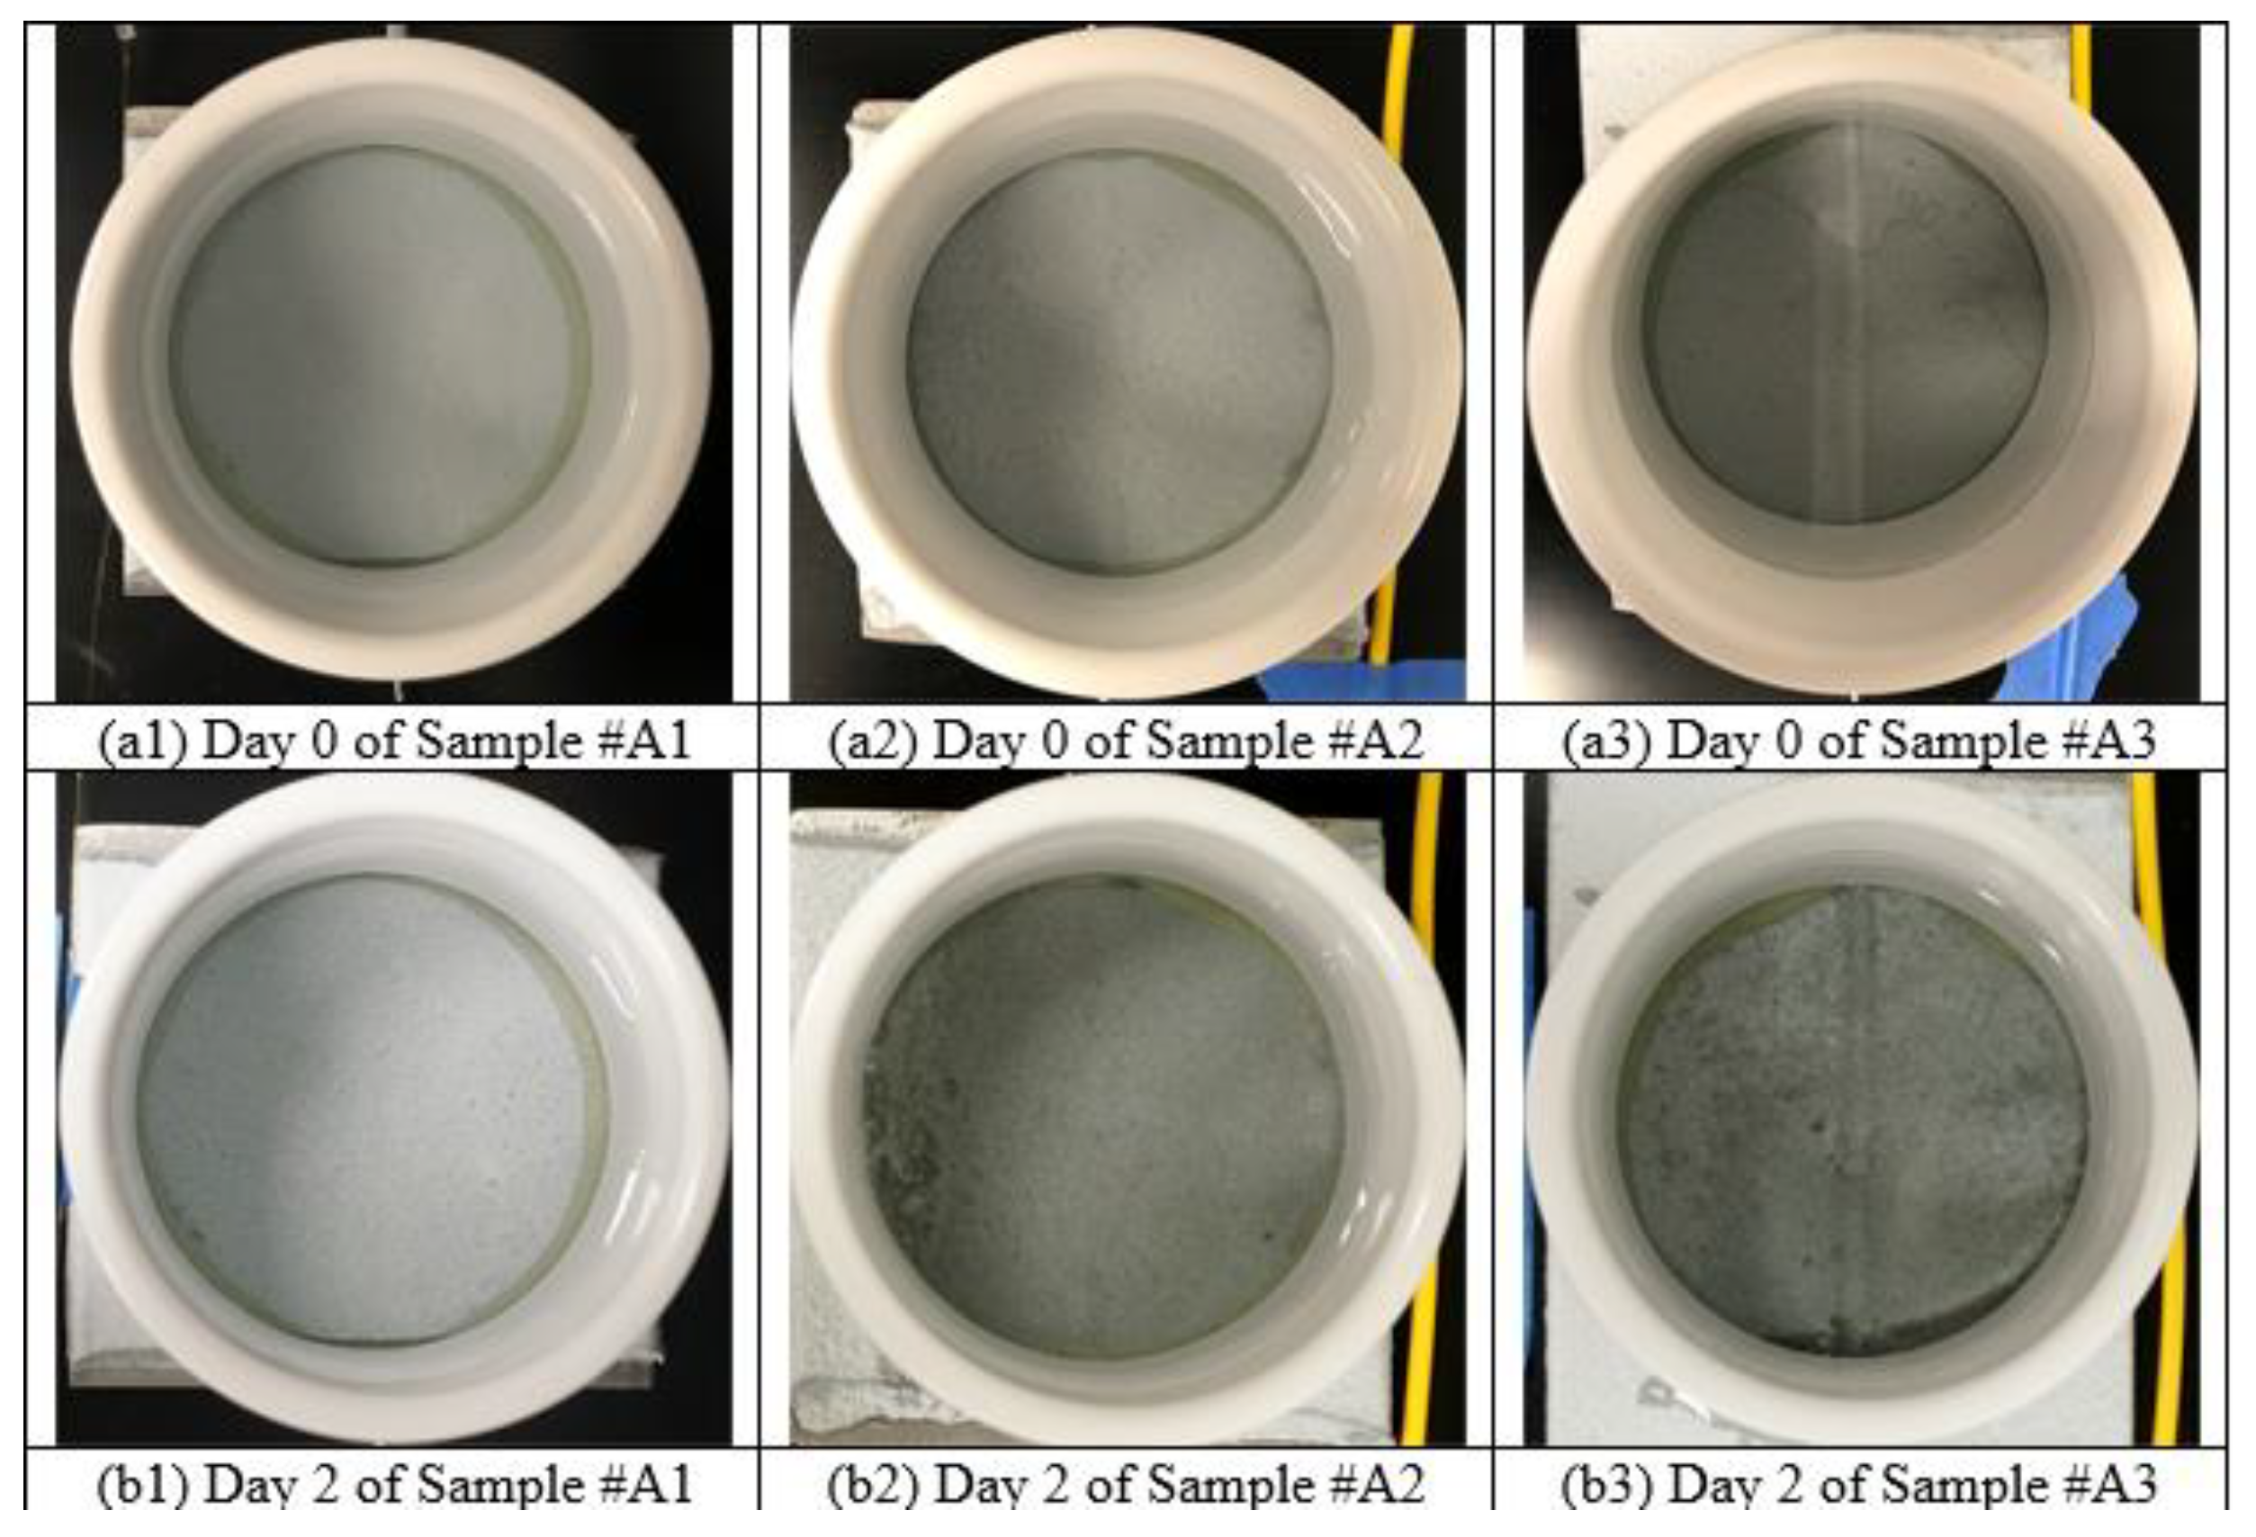
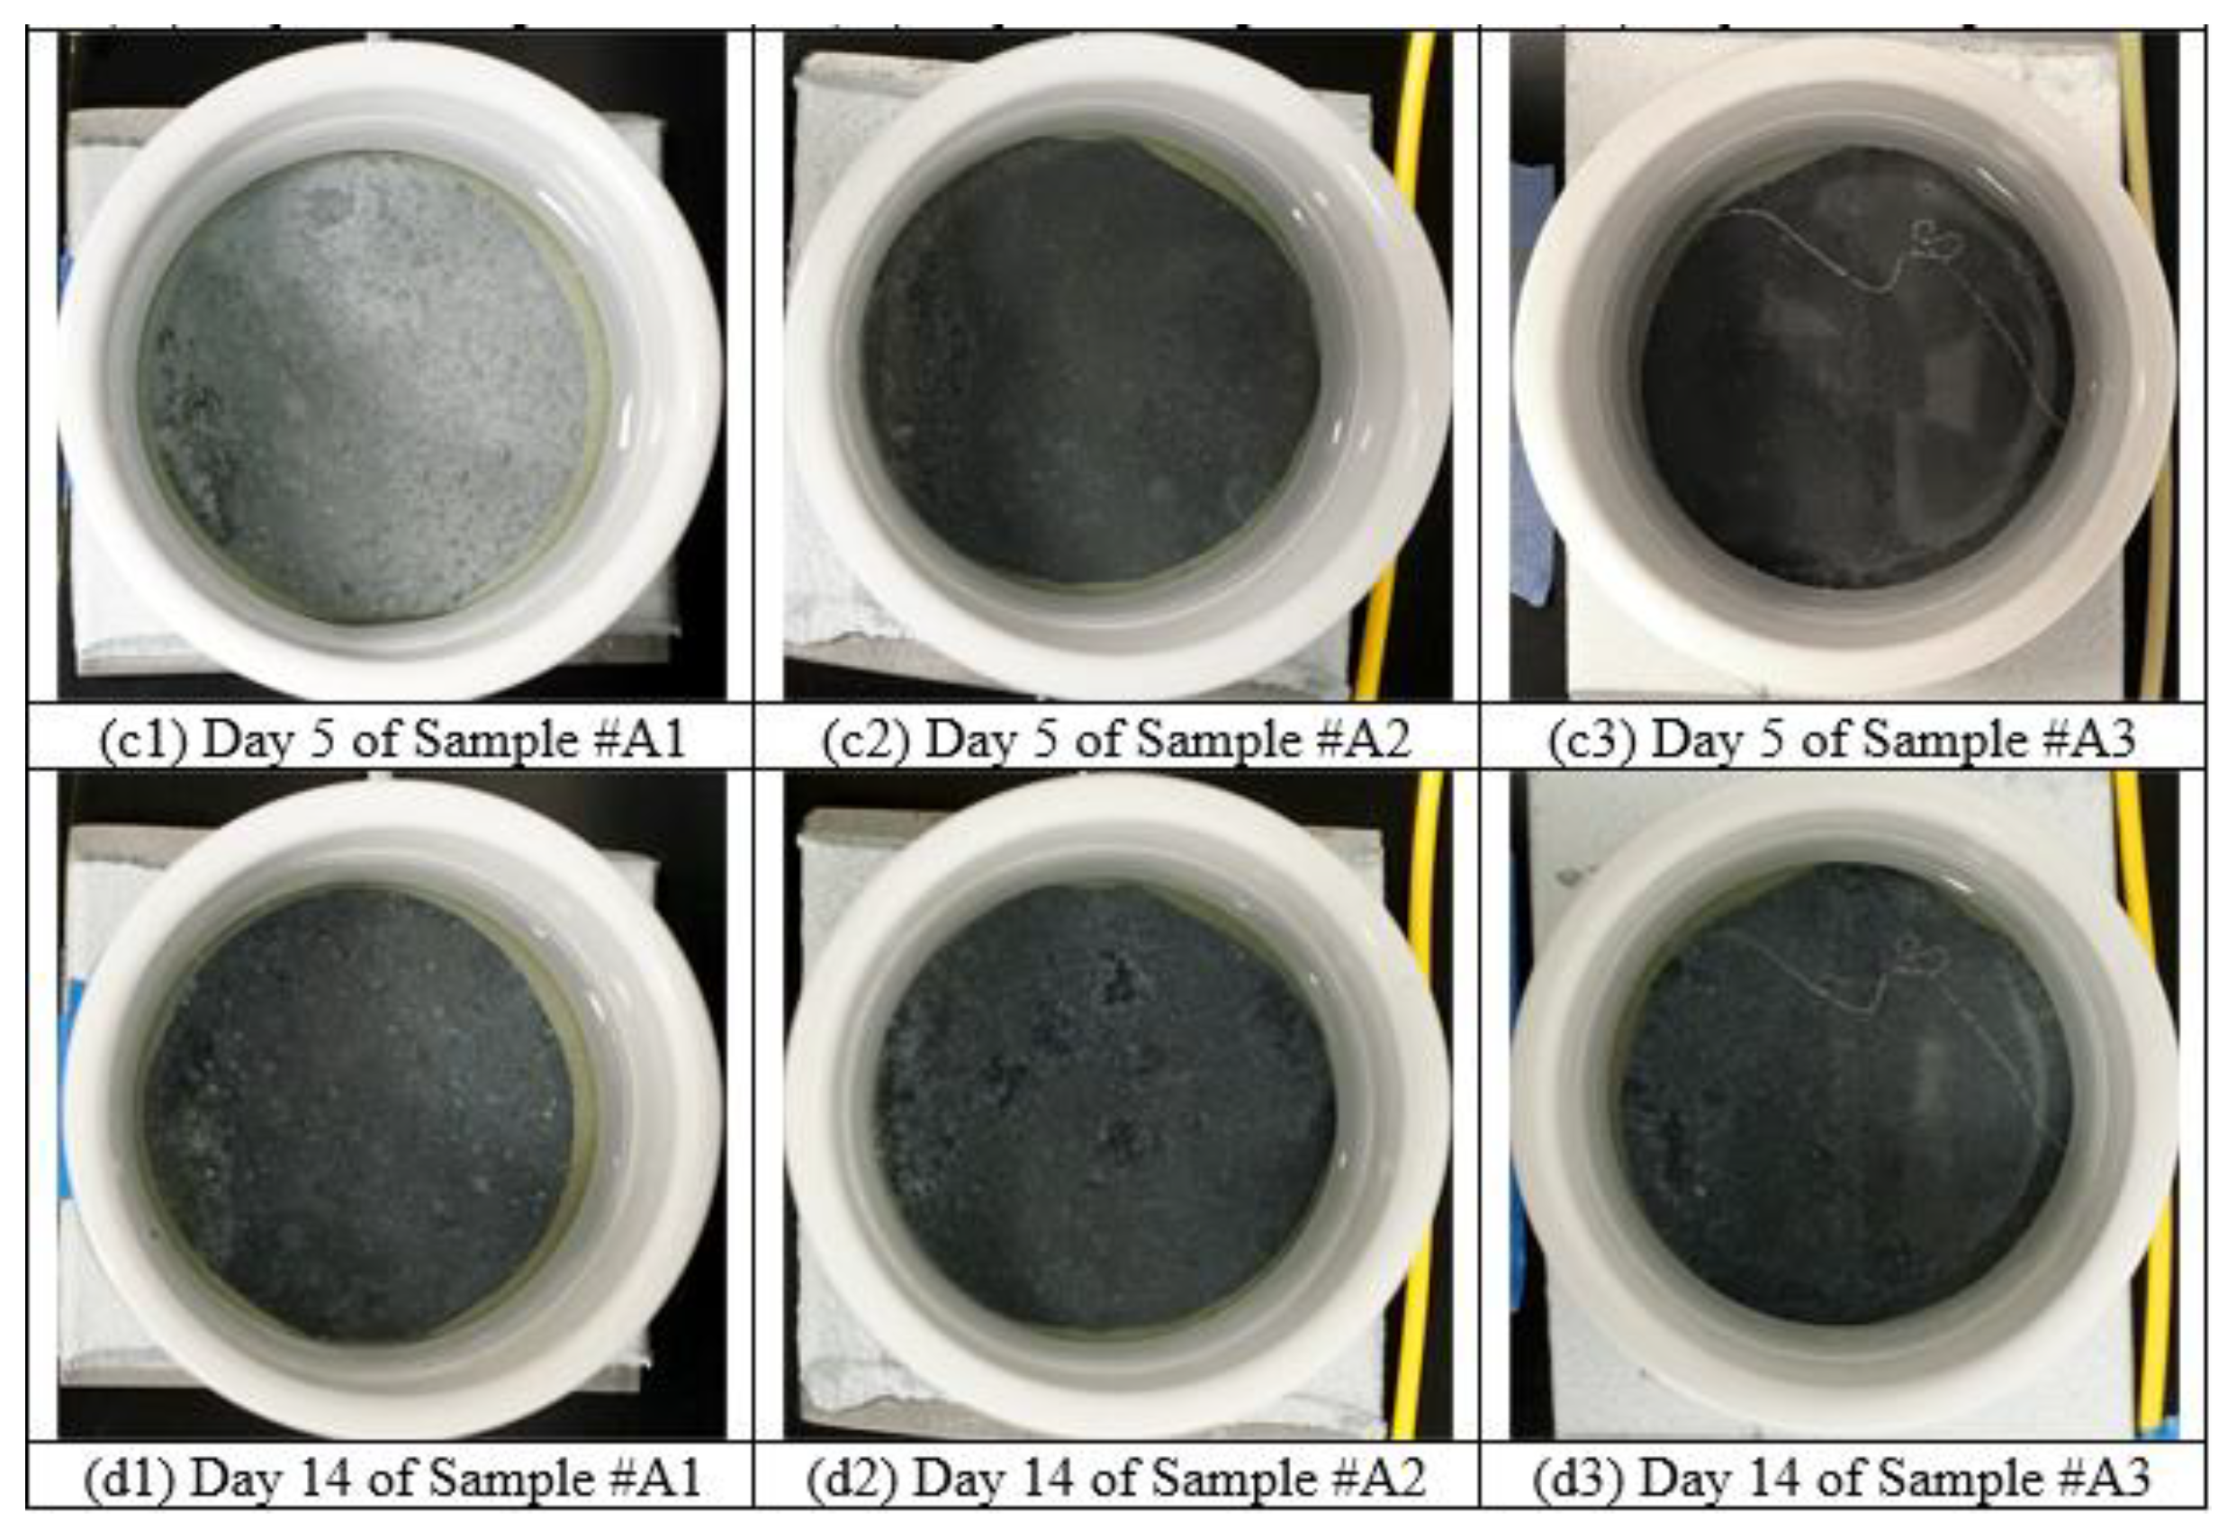
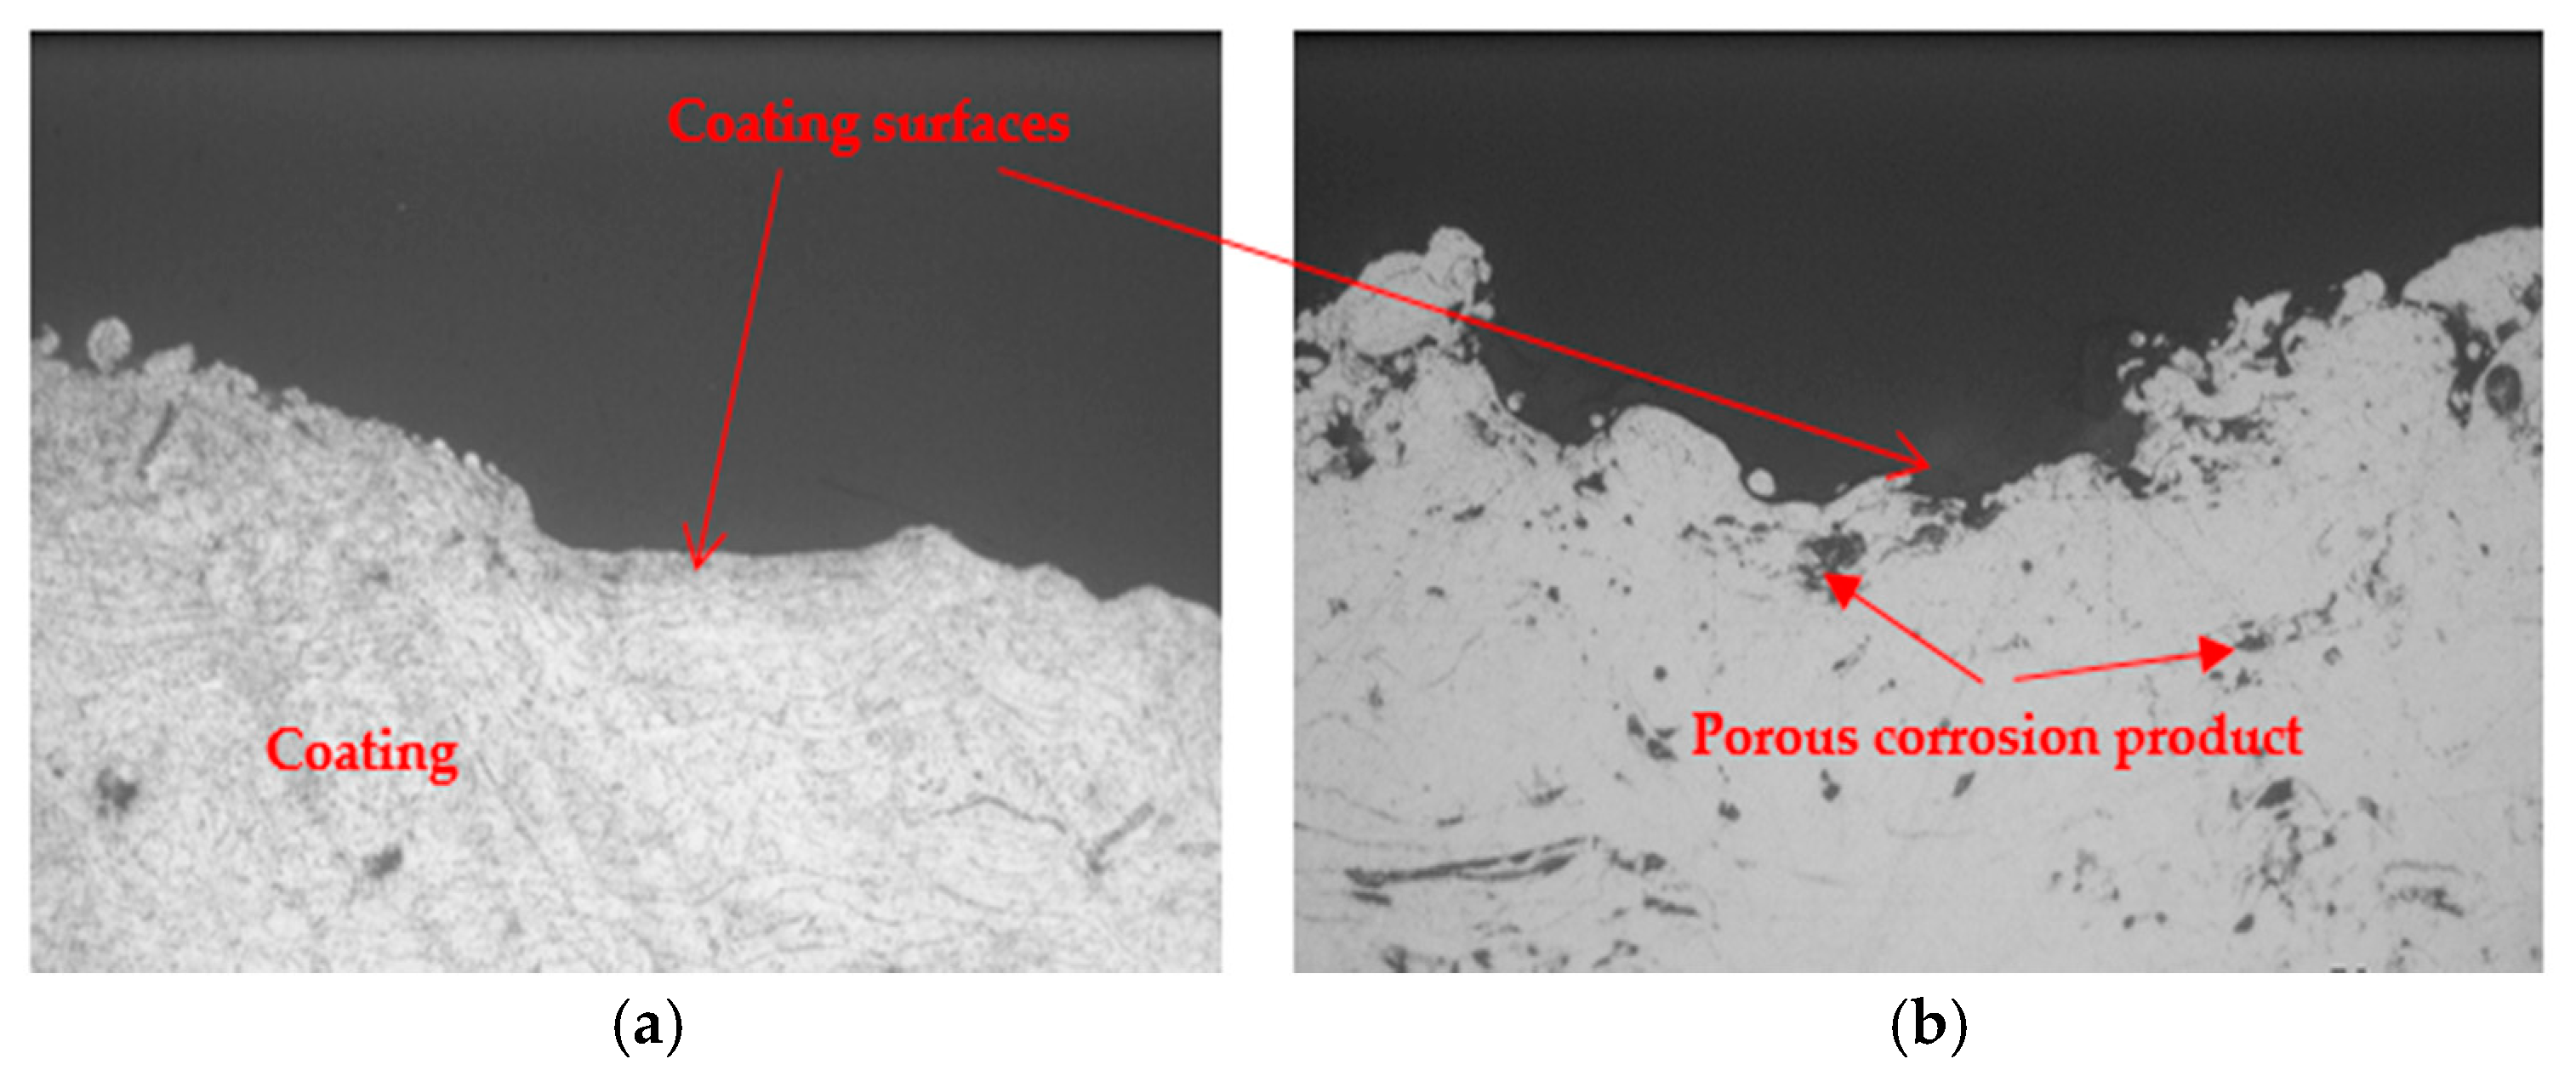
Figure 12 shows selected visual inspection results and Figure 13 compares the SEM images on the cross-section of the wire arc sprayed Al-Zn coating before and after accelerated corrosion tests. From Figure 12(b1–b3) for Samples #A1–A3, it can be clearly seen that after 48 h (Day 2), corrosion started to occur on the wire arc sprayed Al-Zn coating. Figure 12(c1–c3,d1–d3) indicates that after 120 h (Day 5) till 336 h (Day 14), the corrosion was very intensive and visible micro cracks started to form and penetrate through the coatings. The comparison of coating cross-section before and after corrosion in Figure 13 also illustrates that corrosion produced porous corrosion product on the surface of the coating after corrosion occurred.
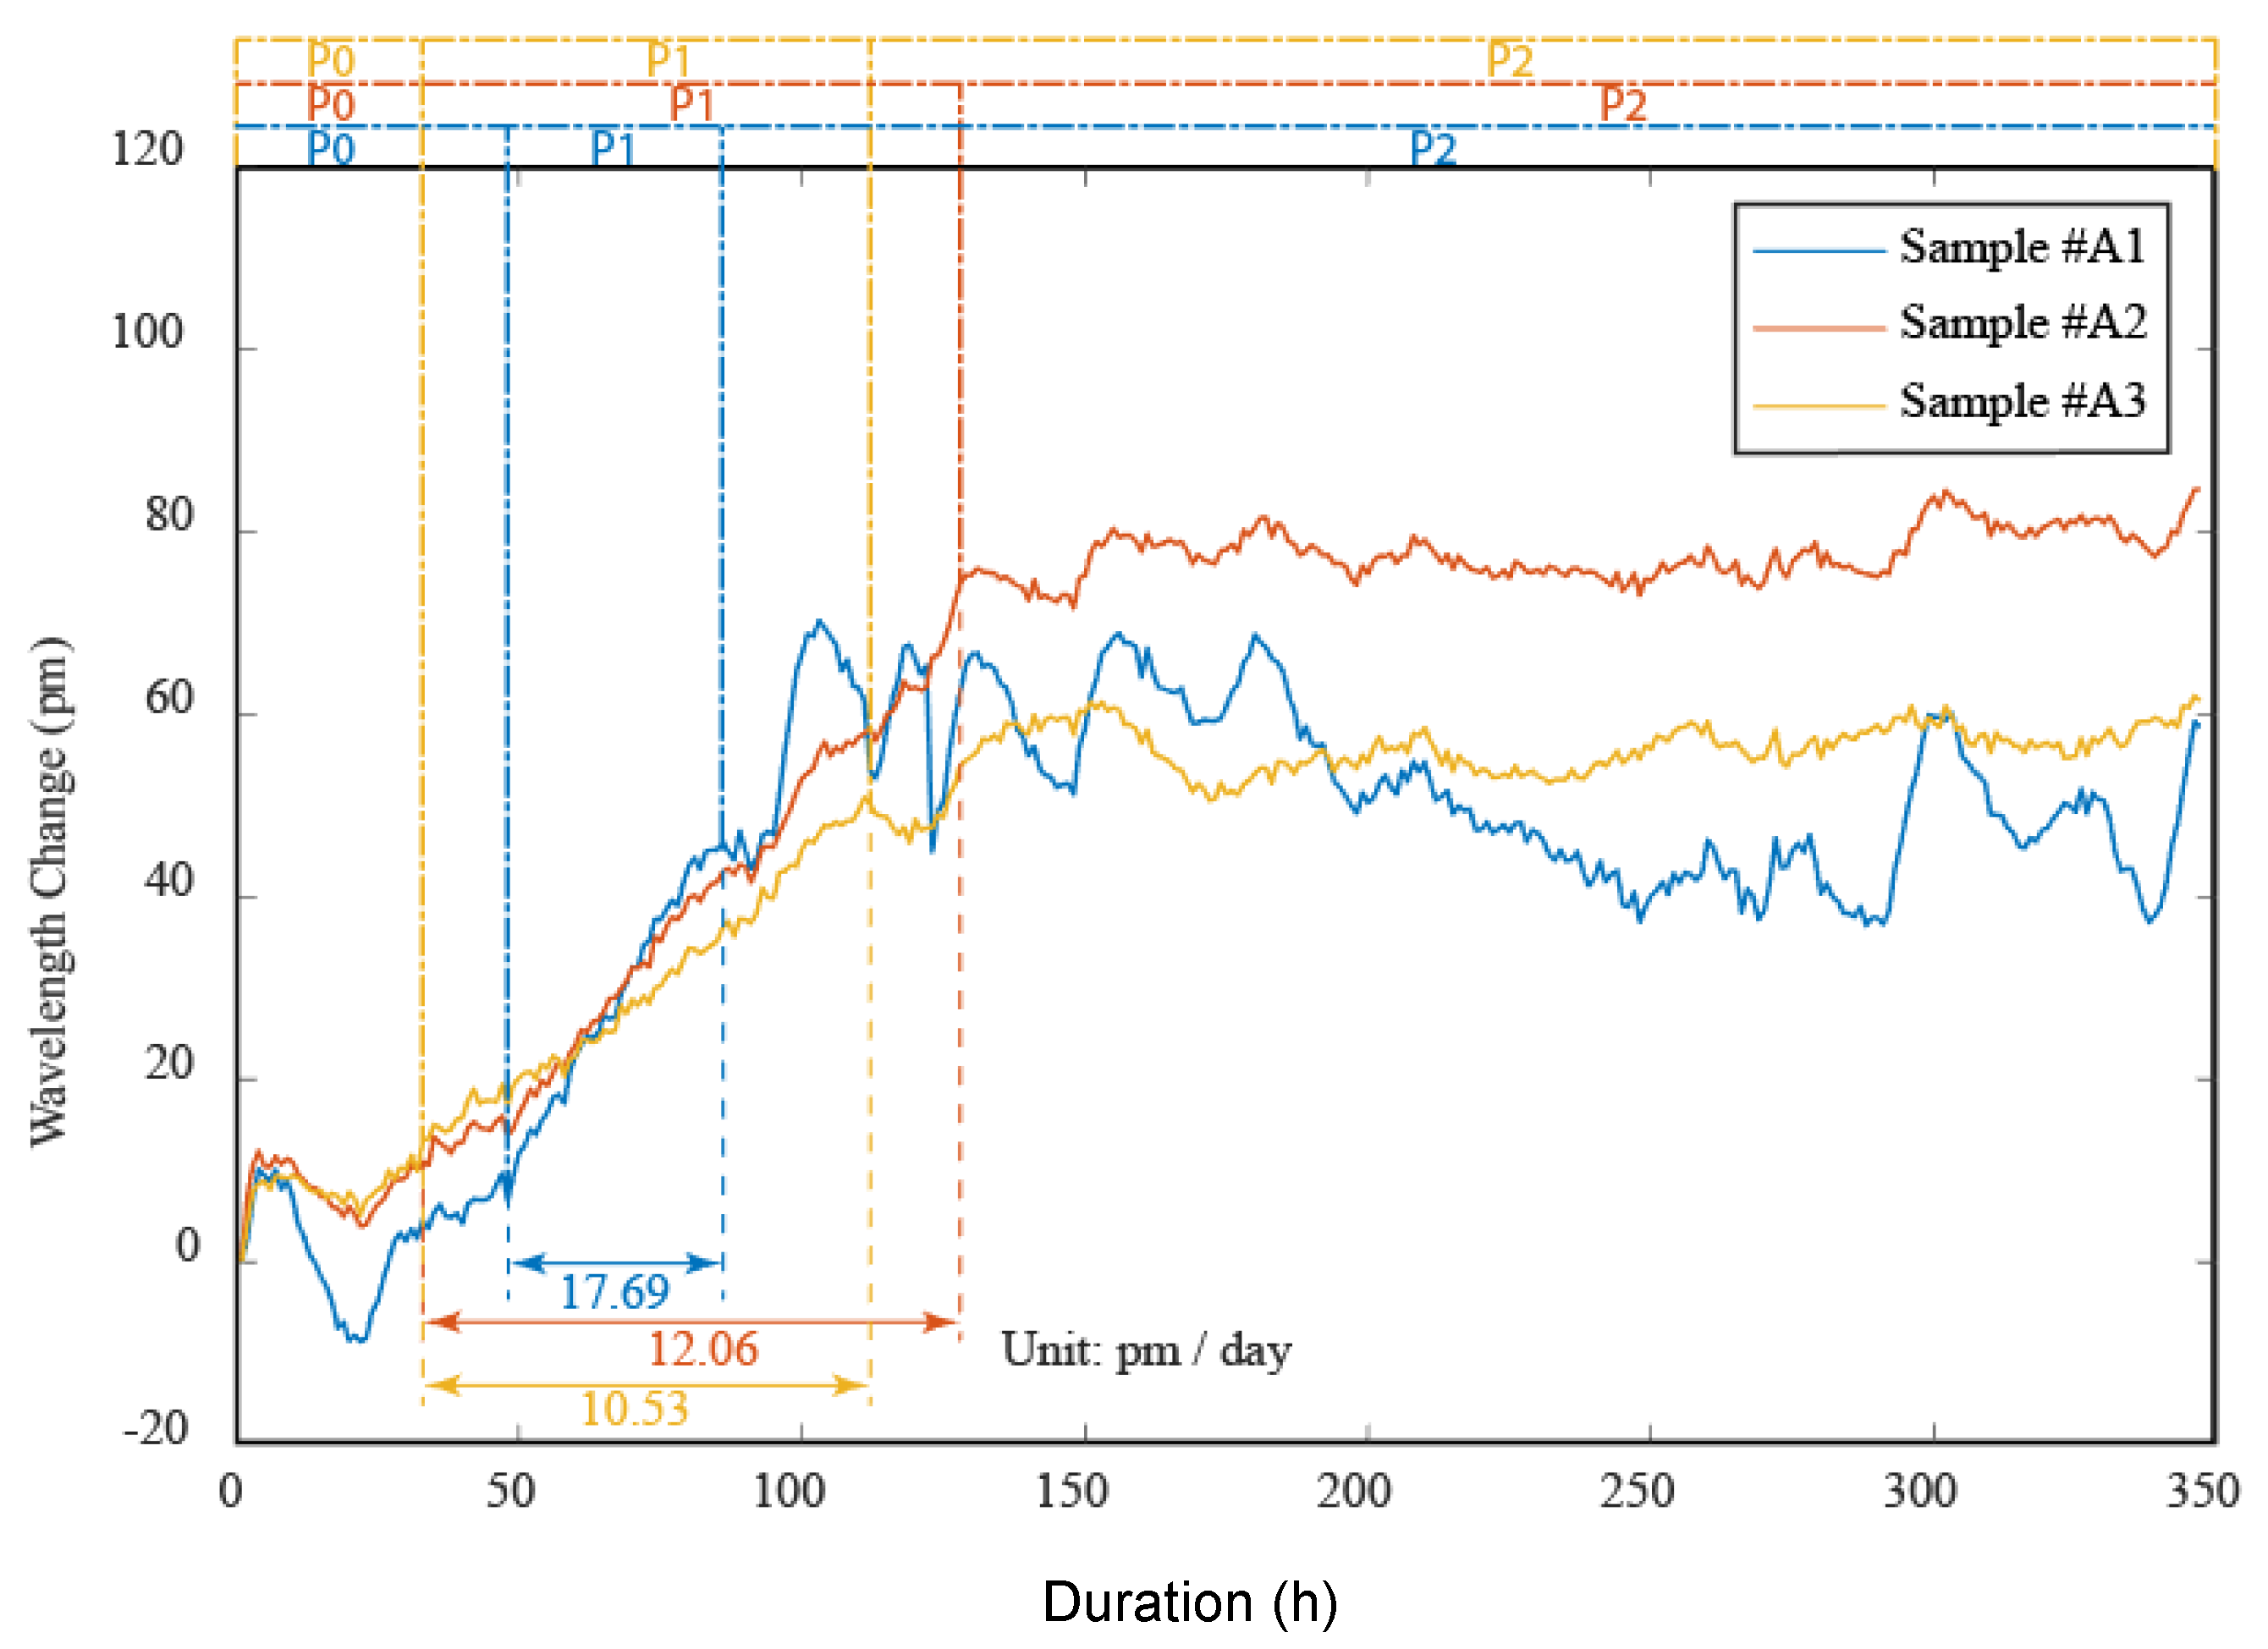
Based on Figure 11, the corrosion rate of Samples #A1–A3 could be calculated using the linear increase part of the Bragg wavelength change graph following Equation (5), as shown in Figure 14. In Figure 14, it was observed that there were multiple spikes on curve of Sample #A1 at range from 95 h to 200 h (4 days to 8 days), indicating the coating structure had been severely corroded. From Figure 14 and the previous study [48], it can be seen that the corrosion progress of the wire-arc Al-Zn coating can be divided into three different phases: Phase 0 (P0 in Figure 14) is the corrosion initialization phase when corrosion products start to fill the pores between adhesive and FBG sensor; Phase 1 (P1 in Figure 14) is the high corrosion rate phase, at which the slope of wavelength change curve in Phase 1 reflects the production rate of corrosion products; and Phase 2 (P2 in Figure 14) is the stabilized corrosion progress, when oxygen further diffuses through the corrosion products and strain caused by corrosion products slowly evanesce, and the remaining sensor reading on the wavelength change curve is primarily remnant stress. Thus, all the experiments stopped after the coating corrosion stayed in Phase 2 for 168 h (7 days). From the visual inspection pictures shown in Figure 12 and 13, it was also confirmed that at bottom left corner of the sample, severe corrosion had occurred in the coating, and started from 120 h (Day 5), the coating delaminated from the substrate. This also caused a higher corrosion rate for Sample #A1, comparing with Samples #A2 and #A3. A possible reason of higher corrosion rate of Sample #A1 might be a higher porosity of coating, or unevenly applied coating. The final corrosion rate of the tested three samples are listed in Table 5. The average corrosion rate of the wire arc Al-Zn coating is 2.182 µm/year, measured from the embedded FBG sensors. The calculation results suggested that the developed FBG sensing system could serve as an effective way of real-time onsite corrosion monitoring.
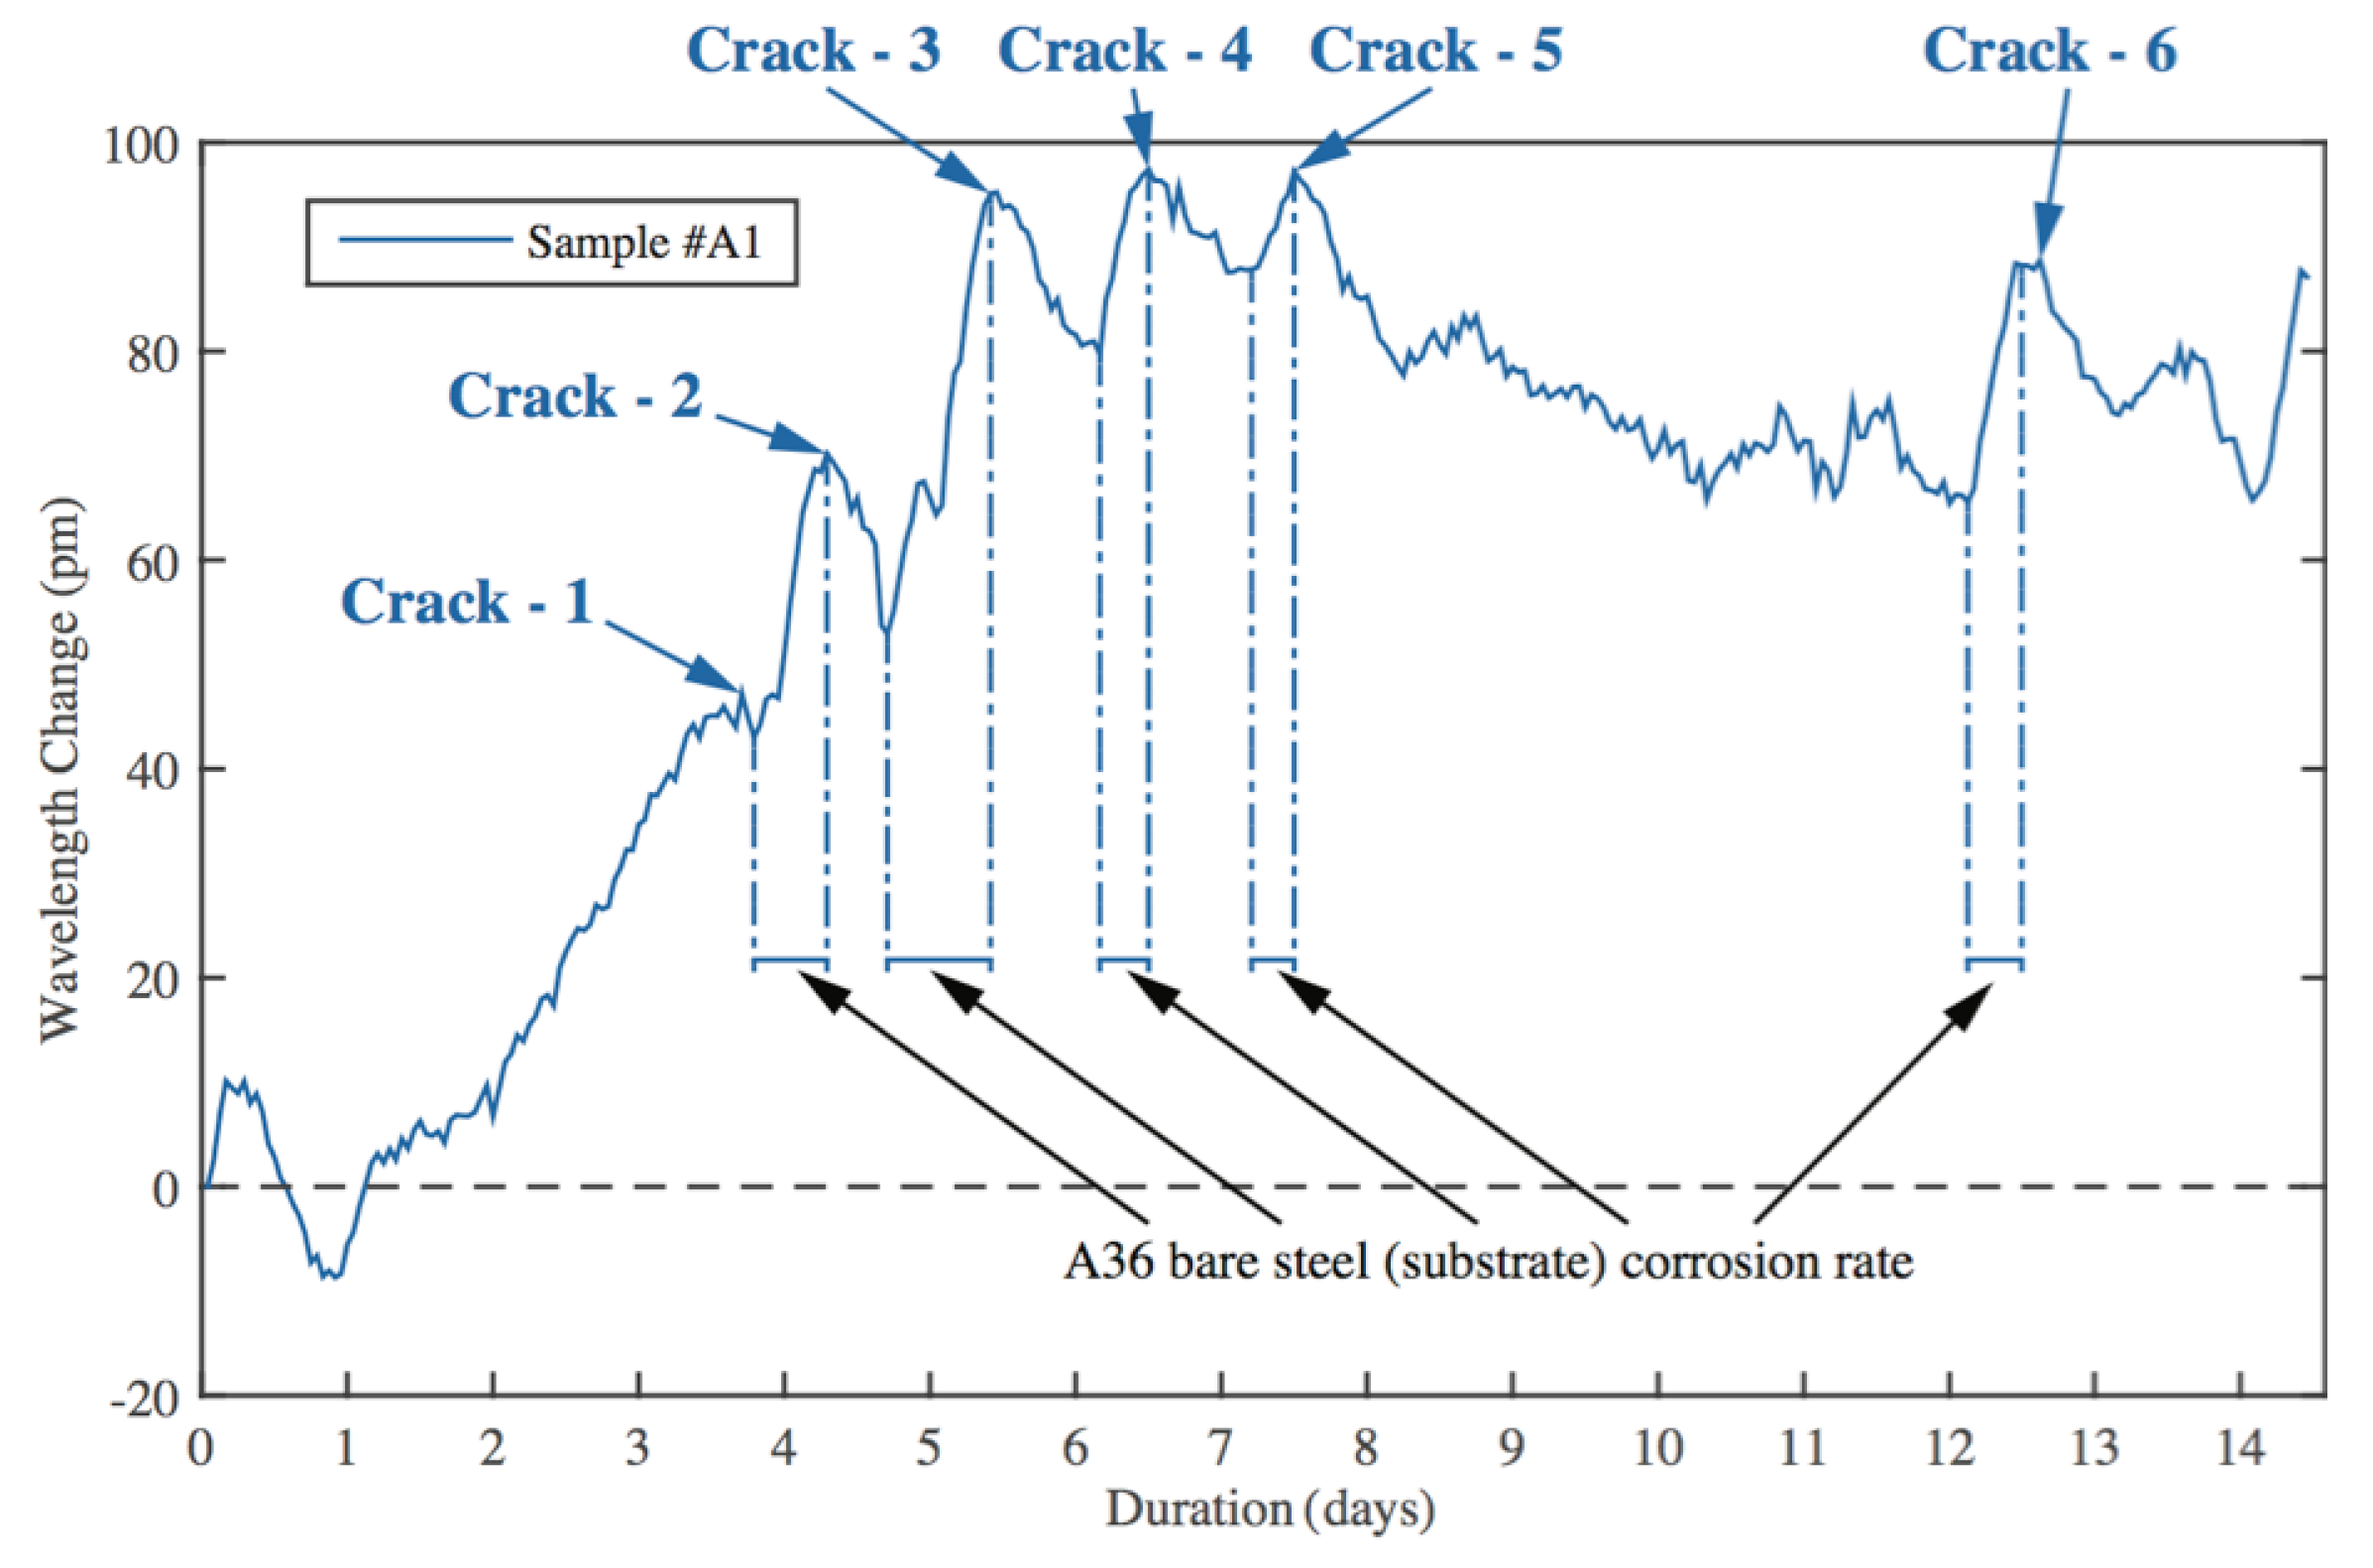
A close look at the changes of curves in Bragg wavelength of FBG sensors, as shown in Figure 14, as compared with visual inspection results in Figure 12, reveals that several inner coating cracks could be distinguished by the embedded sensor from 96 h (Day 4), as shown in Figure 15. After each crack, the Bragg wavelength of the FBG sensor firstly dropped for a short period, then increased rapidly, indicating an increase in corrosion rate, until a new crack was formed and then a new corrosion cycle started. Table 6 showed the corrosion rate of Sample #A1 before each coating crack. Table 6 showed that the corrosion rate was drastically increased after formation of cracks in the coating from 5.588 to 11.938 µm/year. Compared with the initial corrosion rate in Table 5, the fact that Table 6 showed a higher corrosion rate could be a combined corrosion progressing from the coating and its substrate after the occurrence of micro cracks.
4.3. Comparison Between Electrochemical Methods and the FBG Sensors
Table 7 compares the corrosion rate testing results of various coatings using the traditional electrochemical method and the embedded FBG sensors. For wire arc Al-Zn coating, the measured corrosion rate from electrochemical method is 2.184 µm/year and the average corrosion rate measured from the embedded FBG sensors is 2.182 µm/year, with a difference less than 1.0%. The comparison validated that the embedded FBG sensors can detect the corrosion rate accurately.
5. Conclusions
In this paper, for the first time, corrosion behavior was evaluated for steel coated by polymeric coating and wire arc sprayed Al-Zn coatings using embedded FBG sensors. From the laboratory testing results, the following conclusions can be drawn:
- The embedded FBG sensors can successfully measure the crack initialization and the propagation of corrosion on steel coated by polymeric coating. The monitored results showed that when corrosion started to laminate the polymeric coatings, the corrosion rate varied between 1.64 to 6.04 µm/year under the polymeric coating. Comparing with a 39.263 µm/year for bare steel, polymeric coating can reduce the corrosion rate even external damages induced delimitation allows corrosion under the coating.
- For steel coated by wire arc sprayed Al-Zn coating, the embedded FBG sensors not only measures the corrosion status inside the coating but also can detect micro cracks induced by corrosion and monitor the corrosion progress changes with the initiation and propagation of the micro cracks. The average corrosion rate of the wire arc Al-Zn coating was measured to be 2.182 µm/year from the FBG sensors, and with micro cracks inside the wire arc sprayed Al-Zn coatings, the corrosion rate was increased to be 5.588–11.938 µm/year. Thus, for the wire arc sprayed Al-Zn coating, approaches to prevent the prorogation of micro cracks in coatings will significantly increase the long-term corrosion behavior of the wire arc sprayed Al-Zn coated steel structures.
In the future, more laboratory experiments will be performed to confirm the test results from FBG sensors by comparing the results to other metal loss detection methods. In addition, future efforts will also be devoted to develop reliable sensor networks to locate two-dimensional corrosion in various coatings to investigate the corrosion mechanisms for coated steel.
Author Contributions
Y.H. conceived and designed the experiments, F.D. performed the experiments and analyzed the data; F.A. contributed materials coating tools and performed the coating.
Funding
This research was funded partially by a U.S. DOT PHMSA award under Agreement No. DTPH56-15-H-CAAP06 and a NSF award under Agreement No. 1750316. The findings and opinions expressed in the paper are those of the authors only and do not necessarily reflect the views of the sponsors.
Acknowledgments
The authors would like to thank Yechun Wang from mechanical engineering department at North Dakota State University for making the electrochemical testing facility available for testing in this paper.
Conflicts of Interest
The authors declare no conflict of interest.
References
- Roberge, P. Handbook of Corrosion Engineering; McGraw-Hill Professional: New York, NY, USA, 1999. [Google Scholar]
- Fontana, M.; Greene, N. Corrosion Engineering, 3rd ed.; McGraw-Hill Book Company: New York, NY, USA, 1986. [Google Scholar]
- Carreon-Alvarez, A.; Valderrama, R.; Martinez, J.A.; Estrada-Vargas, A.; Gomez-Salazar, S.; Barcena-Soto, M.; Casillas, N. Corrosion of aluminum, copper, brass and stainless steel 304 in tequila. Int. J. Electrochem. Sci. 2012, 7, 7877–7887. [Google Scholar]
- Evans, U.R. The Corrosion and Oxidation of Metals: Scientific Principles and Practical Applications; Arnold: London, UK, 1960. [Google Scholar]
- Melchers, R.E.; Jeffrey, R. Early corrosion of mild steel in seawater. Corros. Sci. 2005, 47, 1678–1693. [Google Scholar] [CrossRef]
- Southwell, C.; Bultman, J.; Alexander, A. Corrosion of metals in tropical environments. Final report of 16-year exposures. Mater. Perform. 1976, 15, 9–25. [Google Scholar]
- Andrade, C.; Alonso, C. Corrosion rate monitoring in the laboratory and on-site. Construct. Build. Mater. 1996, 10, 315–328. [Google Scholar] [CrossRef]
- Bentur, A.; Berke, N.; Diamond, S. Steel Corrosion in Concrete: Fundamentals and Civil Engineering Practice; CRC Press: Boca Raton, FL, USA, 1997. [Google Scholar]
- Cabrera, J. Deterioration of concrete due to reinforcement steel corrosion. Cement Concr. Compos. 1996, 18, 47–59. [Google Scholar] [CrossRef]
- Munger, C.G.; Vincent, L.D. Corrosion Prevention by Protective Coatings, 3rd ed.; NACE International: Houston, TX, USA, 2014. [Google Scholar]
- Dahan, I.; Admon, U.; Frage, N.; Sariel, J.; Dariel, M.; Moore, J. The development of a functionally graded TiC–Ti multilayer hard coating. Surf. Coat. Technol. 2001, 137, 111–115. [Google Scholar] [CrossRef]
- Robert, C.T., Jr. ASM Handbook, Volume 5A: Thermal Spray Technology; ASM International: Almere, The Netherlands, 2013. [Google Scholar]
- Sidky, P.; Hocking, M. Review of inorganic coatings and coating processes for reducing wear and corrosion. Br. Corros. J. 1999, 34, 171–183. [Google Scholar] [CrossRef]
- Mansfeld, F.; Tsai, S. Laboratory studies of atmospheric corrosion—I. Weight loss and electrochemical measurements. Corros. Sci. 1980, 20, 853–872. [Google Scholar] [CrossRef]
- Mueller, W. Theory of the polarization curve technique for studying corrosion and electrochemical protection. Can. J. Chem. 1960, 38, 576–587. [Google Scholar] [CrossRef]
- Baechler, R. Corrosion of Metal Fastenings in Zinc Chloride-Treated-Wood after 20 Years. In Proceedings of the 45th Annual Meeting of the American Wood Preservers’ Association, St. Louis, MO, USA, 1949; Volume 45, pp. 390–397. [Google Scholar]
- Wright, T.; Godard, H.; Jenks, I. The performance of alcan 65S-T6 aluminum alloy embedded in certain woods under marine conditions. Corrosion 1957, 13, 77–83. [Google Scholar] [CrossRef]
- Zelinka, S.L.; Rammer, D.R. Review of Test Methods Used to Determine the Corrosion Rate of Metals in Contact with Treated Wood; US Department of Agriculture, Forest Service, Forest Products Laboratory: Madison, WI, USA, 2005.
- Zou, Y.; Wang, J.; Zheng, Y. Electrochemical techniques for determining corrosion rate of rusted steel in seawater. Corros. Sci. 2011, 53, 208–216. [Google Scholar] [CrossRef]
- Jamesh, M.; Kumar, S.; Narayanan, T.S. Corrosion behavior of commercially pure Mg and ZM21 Mg alloy in Ringer’s solution—Long term evaluation by EIS. Corros. Sci. 2011, 53, 645–654. [Google Scholar] [CrossRef]
- Liang, J.; Srinivasan, P.B.; Blawert, C.; Störmer, M.; Dietzel, W. Electrochemical corrosion behaviour of plasma electrolytic oxidation coatings on AM50 magnesium alloy formed in silicate and phosphate based electrolytes. Electrochim. Acta 2009, 54, 3842–3850. [Google Scholar] [CrossRef]
- Bescond, C.; Kruger, S.; Lévesque, D.; Lima, R.; Marple, B. In-situ simultaneous measurement of thickness, elastic moduli and density of thermal sprayed WC–Co coatings by laser-ultrasonics. J. Thermal Spray Technol. 2007, 16, 238–244. [Google Scholar] [CrossRef]
- Lakestani, F.; Coste, J.F.; Denis, R. Application of ultrasonic Rayleigh waves to thickness measurement of metallic coatings. NDT E Int. 1995, 28, 171–178. [Google Scholar] [CrossRef]
- Rosa, G.; Oltra, R.; Nadal, M.H. Evaluation of the coating–substrate adhesion by laser-ultrasonics: Modeling and experiments. J. Appl. Phys. 2002, 91, 6744–6753. [Google Scholar] [CrossRef]
- Zhu, W.; Rose, J.; Barshinger, J.; Agarwala, V. Ultrasonic guided wave NDT for hidden corrosion detection. J. Res. Nondestruct. Eval. 1998, 10, 205–225. [Google Scholar] [CrossRef]
- Sargent, J. Corrosion detection in welds and heat-affected zones using ultrasonic Lamb waves. Insight-Non-Destr. Test. Cond. Monit. 2006, 48, 160–167. [Google Scholar] [CrossRef]
- Miguel, J.; Guilemany, J.; Mellor, B.; Xu, Y. Acoustic emission study on WC–Co thermal sprayed coatings. Mater. Sci. Eng. A 2003, 352, 55–63. [Google Scholar] [CrossRef]
- Wang, G.; Lee, M.; Serratella, C.; Botten, S.; Ternowchek, S.; Ozevin, D.; Thibault, J.; Scott, R. Testing of acoustic emission technology to detect cracks and corrosion in the marine environment. J. Ship Prod. Des. 2010, 26, 106–110. [Google Scholar]
- Batis, G.; Routoulas, T. Steel rebar corrosion investigation with strain gages. Cement Concr. Compos. 1999, 21, 163–171. [Google Scholar] [CrossRef]
- Pandit, P.; Venkataramana, A.; Venkataramana, K.; Parthiban, P. Experimental investigation on corroded reinforced concrete beam in coatal environment using strain gauges. Int. J. Eng. Innov. Technol. 2013, 3, 416–422. [Google Scholar]
- Diler, E.; Lédan, F.; LeBozec, N.; Thierry, D. Real-time monitoring of the degradation of metallic and organic coatings using electrical resistance sensors. Mater. Corros. 2017, 68, 1365–1376. [Google Scholar] [CrossRef]
- Svadlena, J.; Stoulil, J. Evaluation of protective properties of acrylate varnishes used for conservation of historical metal artefacts. J. Assoc. Corros. Eng. 2017, 61, 25–31. [Google Scholar] [CrossRef] [Green Version]
- Tennyson, T.C.; Morison, W.D.; Miesner, T. Fiber-optic monitoring focuses on bending, corrosion. Oil Gas J. 2006, 104, 55–60. [Google Scholar]
- Grattan, S.K.T.; Taylor, S.E.; Sun, T.; Basheer, P.A.M.; Grattan, K.T.V. Monitoring of corrosion in structural reinforcing bars: Performance comparison using in situ fiber-optic and electrical wire strain gauge systems. IEEE Sens. J. 2009, 9, 1494–1502. [Google Scholar] [CrossRef]
- Zou, L.; Sezerman, O.; Revie, W. Pipeline corrosion monitoring by fiber optic distributed strain and temperature sensors. In Proceedings of the CORROSION 2008, New Orleans, LA, USA, 16–20 March 2008. [Google Scholar]
- Mao, J.; Chen, J.; Cui, L.; Jin, W.; Xu, C.; He, Y. Monitoring the corrosion process of reinforced concrete using BOTDA and FBG sensors. Sensors 2015, 15, 8866–8883. [Google Scholar] [CrossRef]
- Almahmoud, S.; Shiryayev, O.; Vahdati, N.; Rostron, P. Detection of internal metal loss in steel pipes and storage tanks vis magnetic-based fiber optic sensor. Sensors 2018, 18, 815. [Google Scholar] [CrossRef]
- Friebele, E.J. Fiber Bragg grating strain sensors: Present and future applications in smart structures. Opt. Photonics News 1998, 9, 33. [Google Scholar] [CrossRef]
- Moyo, P.; Brownjohn, J.; Suresh, R.; Tjin, S. Development of fiber Bragg grating sensors for monitoring civil infrastructure. Eng. Struct. 2005, 27, 1828–1834. [Google Scholar] [CrossRef]
- Huang, J.; Hua, L.; Lan, X.; Wei, T.; Xiao, H. Microwave assisted reconstruction of optical interferograms for distributed fiber optic sensing. Opt. Express 2013, 21, 18152–18159. [Google Scholar] [CrossRef] [PubMed]
- Chen, Z.; Yuan, L.; Hefferman, G.; Wei, T. Terahertz fiber Bragg grating for distributed sensing. IEEE Photonics Technol. Lett. 2015, 27, 1084–1087. [Google Scholar] [CrossRef]
- Huang, J.; Wei, T.; Wu, S.P.; Lan, X.W.; Fan, J.; Xiao, H. Coaxial cable bragg grating sensors for structural health monitoring. Int. J. Pavement Res. Technol. 2012, 5, 338–342. [Google Scholar]
- Liu, T.; Wang, F.; Zhang, X.; Yuan, Q.; Niu, J.; Zhang, L.; Wei, T. Interrogation of ultra-weak FBG array using double-pulse and heterodyne detection. IEEE Photonics Technol. Lett. 2018, 30, 677–680. [Google Scholar] [CrossRef]
- Zheng, Z.; Sun, X.; Lei, Y. Monitoring corrosion of reinforcement in concrete structures via fiber Bragg grating sensors. Front. Mech. Eng. China 2009, 4, 316–319. [Google Scholar] [CrossRef]
- Gao, J.; Wu, J.; Li, J.; Zhao, X. Monitoring of corrosion in reinforced concrete structure using Bragg grating sensing. NDT E Int. 2011, 44, 202–205. [Google Scholar] [CrossRef]
- Lee, J.R.; Yun, C.Y.; Yoon, D.J. A structural corrosion-monitoring sensor based on a pair of prestrained fiber Bragg gratings. Meas. Sci. Technol. 2009, 21, 017002. [Google Scholar] [CrossRef]
- Hu, W.; Cai, H.; Yang, M.; Tong, X.; Zhou, C.; Chen, W. Fe–C-coated fibre Bragg grating sensor for steel corrosion monitoring. Corros. Sci. 2011, 53, 1933–1938. [Google Scholar] [CrossRef]
- Deng, F.; Huang, Y.; Azarmi, F.; Wang, Y. Pitted corrosion detection of thermal sprayed metallic coatings using fiber Bragg grating sensors. Coatings 2017, 7, 35. [Google Scholar] [CrossRef]
- ASTM G40-15 Standard Terminology Relating to Wear and Erosion; ASTM: West Conshohocken, PA, USA, 1987.
- Cotronics Epoxy Resins; DURALCO 4461; Cotronics Corporation: Brooklyn, NY, USA, 23 February 2006; Available online: http://mrclab.com/data/products/CATALOG//MSDS.PDF (accessed on 9 January 2019).
- Shi, Z.; Liu, M.; Atrens, A.J.C.S. Measurement of the corrosion rate of magnesium alloys using Tafel extrapolation. Corros. Sci. 2010, 52, 579–588. [Google Scholar] [CrossRef]
Figure 1.
Cross-section of embedded FBG sensors based corrosion monitoring system.

Figure 2.
Accelerated corrosion test set-up.

Figure 3.
Cross-section of the wire-arc Al-Zn coating (a) and microscope image of wire-arc Al-Zn coating interface (b).
Figure 3.
Cross-section of the wire-arc Al-Zn coating (a) and microscope image of wire-arc Al-Zn coating interface (b).

Figure 4.
Electrochemical corrosion test set-up (a) and test layout (b).

Figure 5.
Tafel Plot from bare steel sample (Sample B).

Figure 6.
Bragg wavelength of embedded FBG sensors with soft coating vs. time (a) before temperature compensation and (b) after temperature compensation.
Figure 6.
Bragg wavelength of embedded FBG sensors with soft coating vs. time (a) before temperature compensation and (b) after temperature compensation.

Figure 7.
Visual Inspection of Samples #S1–S3.

Figure 8.
Bragg wavelength change of Sample #S1.

Figure 9.
Bragg wavelength of embedded FBG sensors with polymeric coating with partial enlargement.

Figure 10.
Tafel plot measurement result of wire arc sprayed Al-Zn coated sample.

Figure 11.
Bragg wavelength of embedded FBG sensors with wire arc sprayed Al-Zn coating vs. time (a) before temperature compensation and (b) after temperature compensation.
Figure 11.
Bragg wavelength of embedded FBG sensors with wire arc sprayed Al-Zn coating vs. time (a) before temperature compensation and (b) after temperature compensation.

Figure 12.
Visual inspection results for Samples #A1–A3.


Figure 13.
SEM micrographs of the Wire arc deposited Al-Zn coating (a) before and (b) after corrosion.
Figure 13.
SEM micrographs of the Wire arc deposited Al-Zn coating (a) before and (b) after corrosion.

Figure 14.
Bragg wavelength of embedded FBG sensors with wire arc sprayed Al-Zn coating with linear increase part marked.
Figure 14.
Bragg wavelength of embedded FBG sensors with wire arc sprayed Al-Zn coating with linear increase part marked.

Figure 15.
Change of wavelength curves in FBG sensor due to existence of the cracks.


Table 1.
Test sample matrix.
| Coatings | Electrochemical Method | FBG Sensors |
|---|---|---|
| Bare steel | Sample B | – |
| Polymeric coating | – | Samples #S1–S3 |
| Wire arc Al-Zn coating | Sample #A4 | Samples #A1–A3 |
Table 2.
Parameters used for corrosion rate calculation in bare steel plate sample.
| Parameters | Value |
|---|---|
| /corrosion current density in µA/cm2 | 3.386 |
| K/unit convert constant | 128,800 |
| /equivalent weight in grams/equivalent | 28 |
| D/density in g/cm3 | 7.9 |
| A/sample area in cm2 | 2.835 |
| Corrosion rate in µm/year | 39.263 |
Table 3.
Corrosion rate after the cutting damage was manually made to polymeric coating samples.
| Sample Number | Corrosion Rate (µm/year) | Average Corrosion Rate (µm/year) |
|---|---|---|
| Sample #S1 | 6.04 | 3.650 |
| Sample #S2 | 3.29 | |
| Sample #S3 | 1.64 |
Table 4.
Parameters used for corrosion rate calculation in wire arc sprayed Al-Zn coated sample.
| Parameters | Value |
|---|---|
| /corrosion current in µA/cm2 | 0.144 |
| K/unit convert constant | 128,800 |
| /equivalent weight in grams/equivalent | 32 |
| D/density in g/cm3 | 6.9 |
| A/sample area in cm2 | 5.491 |
| Corrosion rate in µm/year | 2.184 |
Table 5.
Corrosion rate of tested wire arc sprayed Al-Zn coated samples.
| Sample Number | Corrosion Rate (µm/year) | Average Corrosion Rate (µm/year) |
|---|---|---|
| Sample #A1 | 2.875 | 2.182 |
| Sample #A2 | 1.961 | |
| Sample #A3 | 1.712 |
Table 6.
Corrosion rate after micro crack formation in hard coating.
| Corrosion Progress | Initial Point for Corrosion Rate Calculation | End Point for Corrosion Rate Calculation | Interval between Initial Point and End Point | Wavelength Change Slope (µm/year) |
|---|---|---|---|---|
| Sample #A1 at Crack #2 | 44.22 pm (92 h) | 68.69 pm (101 h) | 9.12 h (0.38 day) | 11.176 |
| Sample #A1 at Crack #3 | 52.93 pm (113 h) | 94.00 pm (129 h) | 16.08 h (0.67 day) | 10.668 |
| Sample #A1 at Crack #4 | 79.76 pm (148 h) | 97.38 pm (156 h) | 7.92 h (0.33 day) | 9.144 |
| Sample #A1 at Crack #5 | 87.79 pm (173 h) | 97.25 pm (180 h) | 6.96 h (0.29 day) | 5.588 |
| Sample #A1 at Crack #6 | 65.54 pm (291 h) | 88.41 pm (299 h) | 7.92 h (0.33 day) | 11.938 |
Table 7.
Comparison of corrosion test results between electrochemical approach and FBG sensors.
| Coatings | Corrosion Rate from Electrochemical Method | Corrosion Rate from Embedded FBG Sensors |
|---|---|---|
| Bare steel (Sample B) | 39.263 µm/year | – |
| Wire arc Al-Zn coating (Samples #A1–A3) | 2.184 µm/year | 2.182 µm/year * Corrosion progress monitored; Crack initiation detected. |
| Polymeric coating (Samples #S1–S3) | – | Crack initiation detected; Corrosion rate after the crack tested: 3.650 µm/year *. |
*: all sample average.
© 2019 by the authors. Licensee MDPI, Basel, Switzerland. This article is an open access article distributed under the terms and conditions of the Creative Commons Attribution (CC BY) license (http://creativecommons.org/licenses/by/4.0/).
Share and Cite
MDPI and ACS Style
Deng, F.; Huang, Y.; Azarmi, F. Corrosion Behavior Evaluation of Coated Steel Using Fiber Bragg Grating Sensors. Coatings 2019, 9, 55. https://doi.org/10.3390/coatings9010055
AMA Style
Deng F, Huang Y, Azarmi F. Corrosion Behavior Evaluation of Coated Steel Using Fiber Bragg Grating Sensors. Coatings. 2019; 9(1):55. https://doi.org/10.3390/coatings9010055
Chicago/Turabian StyleDeng, Fodan, Ying Huang, and Fardad Azarmi. 2019. "Corrosion Behavior Evaluation of Coated Steel Using Fiber Bragg Grating Sensors" Coatings 9, no. 1: 55. https://doi.org/10.3390/coatings9010055
Note that from the first issue of 2016, this journal uses article numbers instead of page numbers. See further details here.