Abstract
In order to assemble effective protective coatings against corrosion, electrochemical techniques such as linear potentiometry and cyclic voltammetry were performed on a copper surface in 0.1 mol·L−1 HCl solution containing 0.1% polyvinyl alcohol (PVA) in the absence and presence of silver nanoparticles (nAg/PVA). A recent paradigm was used to distinguish the features of the coatings, that is, a deep convolutional neural network (CNN) was implemented to automatically and hierarchically extract the discriminative characteristics from the information given by optical microscopy images. In our study, the material surface morphology, controlled by the CNN without the interference of the human factor, was successfully conducted to extract the similarities/differences between unprotected and protected surfaces in order to establish the PVA and nAg/PVA performance to retard copper corrosion. The CNN results were confirmed by the classical investigation of copper behavior in hydrochloric acid solution in the absence and presence of polyvinyl alcohol and silver nanoparticles. The electrochemical measurements showed that the corrosion current density (icorr) decreased and polarization resistance (Rp) increased, with both PVA and nAg/PVA being effective inhibitors for copper corrosion in an acid environment, forming polymer protective coatings by adsorption on the metal surface. Furthermore, scanning electron microscopy (SEM) certifies the formation of polymer coatings, revealing a specific morphology of the copper surface in the presence of PVA and nAg/PVA, very different from that of corroded copper in uninhibited solutions. Finally, the correlation of the CNN information with experimental data was reported.
1. Introduction
The corrosion consequences are revealed by the short lifetime of metals/alloys as a result of their degradation, as well as the release of corrosion products, causing environmental pollution. Numerous studies invoke that the corrosion effects can be delayed by assembling protective layers at the metal–environment interface [1,2,3,4,5,6]. One of the easiest and most effective ways involves the adsorption of corrosion inhibitors on the metallic surfaces [7,8,9,10,11].
Deep learning (DL) has recently emerged within computer science as both a hot topic and a top performing paradigm for practical scenarios, supported by large amounts of data and high power of computation. One of its most exciting and promising domains of application is represented by image interpretation. Within this area, analysis of microscopy slides by DL has received a substantial number of literature entries over the last couple of years. The DL field, typically tailored for such imaging data, is represented by convolutional neural networks (CNN), with their essential automatic feature extraction capability, which makes them even more valuable for artificial learning independent of the human expert.
Several DL models have recently been proposed for the detection, segmentation, diagnosis, and prognosis on optical microscopy data from different domains, that is, medicine [12,13,14,15,16,17], bioinformatics [18,19,20,21], and physical sciences [22]. Within materials science, it is the DL (shallow) predecessors, that is, artificial neural networks (ANN), that have been proposed for the related analysis of steel corrosion under different inhibitors—although on numerical data, for example, quantum chemical calculations [23] and electrochemical impedance spectroscopy curves [24]. However, images are expected to hold more information on the formed coatings, and their feature complexity and the need for their automatic representation make DL a more suitable candidate for the given task. Very recently, a transfer learning DL approach for the study of stainless steel corrosion inhibition [25] demonstrated good potential in the examination of formed coatings.
The current work thus puts forward a straight CNN model for the examination of the effect of uninhibited and inhibited hydrochloric acid solution on the copper surface. The polymeric films based on poly(vinyl) alcohol (PVA) and poly(vinyl) alcohol with silver nanoparticles (nAg/PVA) were discussed according to optical microscopy. By microscopy, a limited optical image is designed at a fixed plane providing information related to a narrow area. To extend the optical image information to the whole surface, a CNN architecture was employed to accurately distinguish between copper standard state and copper surface changes after linear potentiometry (LP) and cyclic voltammetry (CV) in the following: (i) 0.1 mol·L−1 HCl blank solution; (ii) 0.1 mol·L−1 HCl solution containing 0.1% PVA; and (iii) 0.1 mol·L−1 HCl solution containing 0.1% PVA (wt.) and nAg. In general, the CNN layers gradually learn features of the input images from low-level attributes, such as lines and dots, to those high-level representing shapes that are more complex. In this specific case, a two-layer convolution component extracts the features of the surface morphology. On the basis of these characteristics, the classification second step with two fully-connected layers learns the mapping between the input features of the training data and the different copper possible outputs. The model is thus trained with the objective to minimize the value of the loss function (the difference between the predicted output and the ground truth) by updating the weights of the network through an optimization algorithm. Electrochemical measurements associated with scanning electron microscopy (SEM) were used for classical investigation of the coatings formed by PVA and nAg/PVA adsorption on the copper surface in the 0.1 mol·L−1 HCl solution.
2. Materials and Methods
2.1. Modeling of Coatings
Linear potentiometry (LP) and cyclic voltammetry (CV), with ten cycles, were conducted on copper specimens, in 0.1 mol·L−1 HCl solution, without and with PVA and nAg/PVA, with the latter being prepared as described in a previous study [26]. Electrochemical measurements were performed in the potential range from −1.0 to 1.0 V (anodic direction), with a scan rate of 1.0 mV·s−1 (LP) and 100 mV·s−1 (CV), respectively. The standard electrochemical cell with three electrodes was used. Copper and platinum plates with the area of 1.0 cm−2 constituted the working and auxiliary electrodes, using the Ag/AgCl electrode as reference. The materials, methodology, and devices have been described in other studies [11,26].
To apply the CNN@microscopic slides, the optical images for all copper samples, before and after electrochemical measurements, were displayed using the metallographic Euromex microscope described in our earlier works [10,27]. The following set of distinct copper states was investigated: (1) copper standard surface (before corrosion); (2) copper surface after LP in 0.1 mol·L−1 HCl blank solution (LPuninhib); (3) copper surface after LP in 0.1 mol·L−1 HCl solution with 0.1% PVA (LPPVA); (4) copper surface after LP in 0.1 mol·L−1 HCl solution containing 0.1% PVA and silver nanoparticles (LPnAg/PVA); and the same after CV: (5)—CVuninhib, (6)—CVPVA, and (7)—CVnAg/PVA, respectively.
Consequently, the CNN was applied to six classification sub-tasks:
- Standard copper vs. LP electrodeposited coating in 0.1 mol·L−1 HCl blank solution (LPuninhib) vs. PVA vs. nAg/PVA (four classes, abbreviated hereafter as StandardLP).
- Standard copper vs. CV electrodeposited coating in 0.1 mol·L−1 HCl blank solution vs. PVA vs. nAg/PVA (four classes, referred to hereafter as StandardCV).
- CV electrodeposited coating in 0.1 mol·L−1 HCl solution with PVA vs. LP electrodeposited coating in 0.1 mol·L−1 HCl solution with PVA (binary classification, CVPVA − LPPVA).
- CV electrodeposited coating in 0.1 mol·L−1 HCl solution with nAg/PVA vs. LP electrodeposited coating in 0.1 mol·L−1 HCl solution with nAg/PVA (binary classification, CVnAg/PVA − LPnAg/PVA).
- CV electrodeposited coating in 0.1 mol·L−1 HCl solution with PVA vs. CV electrodeposited coating in 0.1 mol·L−1 HCl solution with nAg/PVA (binary classification, CVPVA − CVnAg/PVA).
- LP with electrodeposited coating in 0.1 mol·L−1 HCl solution PVA vs. LP electrodeposited coating in 0.1 mol·L−1 HCl solution with nAg/PVA (binary classification, LPPVA − LPnAg/PVA).
2.2. Convolutional Neural Networks for Copper Slide Interpretation
The present study appoints a CNN for the analysis of copper slides. CNNs are able to perform both feature extraction and classification through their unique architecture. First of all, convolutional layers gradually learn feature representations from low-level to high-level structures in an automatic manner from the training images. Subsequently, the pattern of input–output mapping is discovered in the secondary classification step.
The architecture proposed for the problem at hand is presented in Figure 1. The designed flow and parameters were experimentally chosen in a way that neutralizes overfitting. This overspecialization on the training samples and inability to generalize on new instances may be induced by the small sample size (453 examples). The input samples (volumes) of 150 × 150 × 3 (denoting image width and height in pixels (px), and number of color channels) enter through two convolutional layers, the first with kernel size (KS) = 7 and kernel depth (KD) = 8, and the second with KS = 5 and KD = 16. Every such formed filter of size KS × KS is convolved with the image, and KD resulting activation maps are stacked in a volume for the next layer [28]. Each convolution is followed by a rectified linear unit (ReLU) for non-linearity and max-pooling (window size 2 px × 2 px) for downsampling the representation. Subsequently, the information passes through two fully connected layers. Dropout is employed between all layers (with a rate of 0.25 after the convolutional ones and 0.9 after the first fully connected one) and cuts a subset of neuron activations from each corresponding preceding layer. The last fully connected layer outputs the scores (probabilities) of each possible class for every copper slide under examination.
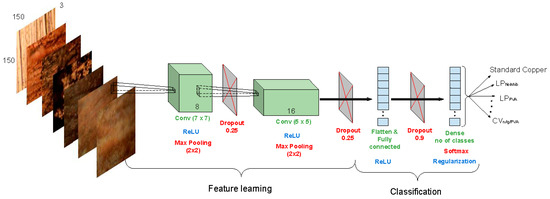
Figure 1.
The architecture of the convolutional neural network (CNN) for inspecting copper slides. Feature representation is achieved by the flow of convolutional layers with rectified linear unit (ReLU) nonlinearity and max-pooling. Classification is performed by the two fully-connected layers and leads to scores for each of the copper states. Dropout is used in between layers to further prevent overfitting. LP—linear potentiometry; CV—cyclic voltammetry.
2.3. Confirmation of CNN Data by the Classical Investigation of Assembled Coatings on the Copper Surface
2.3.1. Electrochemical Measurements
To highlight the corrosion protection performance of coatings formed on copper surface in HCl solution containing PVA in the absence and presence of silver nanoparticles, the LP polarization curves were processed as semilogarithmic ones in the potential range of −1.0 V and 1.0 V. Thus, the main electrochemical parameters, such as corrosion potential (Ecorr), polarization resistance (Rp), and corrosion current density (icorr) computed at the intersection of the Tafel lines, in the potential range of ± 150 mV with respect to Ecorr, were determined using the VoltaMaster 4 software (version 7.8.26338.3) [29].
2.3.2. Scanning Electron Microscopy (SEM)
SEM images of the copper samples after LP conducted in 0.1 mol·L−1 HCl solution containing 0.1 % PVA with and without nAg, after ten cycles, were acquired using a Hitachi SU 8010 microscope (Chiyoda, Tokyo, Japan) with a cold-field emission gun.
3. Results and Discussion
3.1. Characterization of Coatings by Optical Microscopy
The optical microscopy images presented in Figure 2 show the copper surface morphology before (Figure 2a) and after LP and CV in 0.1 mol·L−1 HCl solution (Figure 2b) and in 0.1 mol·L−1 HCl solution containing PVA and nAg/PVA as corrosion inhibitors (Figure 2c,d).
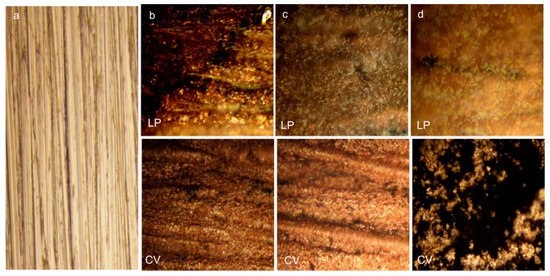
Figure 2.
The optical microscopy images of copper surface (×80): (a)—before corrosion; (b–d)—after linear potentiometry (LP) and cyclic voltammetry (CV) (ten cycles) in 0.1 mol·L−1 HCl solution, and 0.1 mol·L−1 HCl solution containing polyvinyl alcohol (PVA) and nAg/PVA as corrosion inhibitors.
The standard sample exposes a characteristic morphology of copper surface before corrosion (Figure 2a). As shown in Figure 2b, after LP and CV, an irregular coating can be observed, revealing that the acid environment significantly affects the metallic surface. In the presence of PVA, after both electrochemical measurements (Figure 2c—LP, CV), but more nuanced after CV (Figure 2c—CV), the microscopy images display distinctive features, probably because of polymer adsorption on the copper surface.
The addition of the nAg/PVA inhibitor in 0.1 mol·L−1 HCl solution leads to the occurrence of a smoother layer adsorbed on the copper surface after LP, without highlighting the silver nanoparticles (Figure 2d—LP). After CV (Figure 2d—CV), the surface morphology is completely changed as a result of the successive oxidation/reduction processes occurring during the ten voltammetric cycles.
Microscopy images show the morphology on a very narrow surface area and the comments traditionally target carefully selected images according to predicted or expected changes and appearance. As images in Figure 2b–d show (first row), after LP, the optical microscopy images reveal a confusing surface morphology for the layers obtained in acidic solutions with and without inhibitors.
Thus, it is necessary to compare in an objective manner a multitude of microscopic slides obtained for copper behavior in HCl solution, uninhibited and inhibited with PVA and nAg/PVA, during LP. In order to achieve the purpose, the CNN method compares the microscope slides of the metal surfaces unmodified and modified under various conditions to measure how well the different categories are distinguished.
3.2. The CNN Approach
3.2.1. Experimental Setup
For each classification sub-problem in turn, the data were randomly split into 67% samples for training and the rest for testing, maintaining the proportion between the classes. The CNN learns the specificities from the images of each class from the training set and then applies the knowledge to distinguish the previously unseen images from the test set.
The total number of samples is 453 and the distribution over the 7 classes is relatively balanced: from a minimum of 12% for the CVnAg/PVA up to a maximum of 17% for all slides of the class LPuninhib. As some classes of images appear in several of the classification sub-tasks mentioned above, the same split is maintained for each sub-problem. All images are resized to 150 px × 150 px within the current experiment, because of computer memory limitations triggered by the use of CNN.
3.2.2. CNN Implementation
The implementation was conducted in Python with TensorFlow, under Keras as the high-level API. The Conv2D, MaxPooling 2D, Dense layers are added to a sequential model. The kernel size for the first layer is set to 7 px × 7 px and the depth to 8, while the second layer has a size of 5 px × 5 px and double the number of filters (16). Each convolutional layer has a ReLU activation argument. The window size for MaxPooling is 2 px × 2 px. The output of the last convolutional group is flattened (with a Flatten layer), and then two fully-connected (Dense) layers perform the classification step. The number of neurons in the first dense layer is set to 100, and that of the last layer has a value equal to the number of classes of the task under consideration. The activation of the last dense layer is the softmax function, commonly used for multi-class classification problems.
Because the data set has a reduced number of samples when compared with the usual applications of CNN, several measures are taken with the purpose of increasing the sample size and thus reducing overfitting. The main concern comes from the small size of the training set, as the model is not exposed to sufficient slides and thus is not able to generalize well. To overcome this drawback, data augmentation is utilized in order to generate new images that suffer various random transformations. Accordingly, the CNN does not meet the same image twice. Data augmentation in the current experiment includes shearing transformation, zoom range, and horizontal flip.
For the same purpose of limiting overfitting, a dropout layer follows each convolutional layer (rate = 0.25) and is also added just before the final dense layer (rate = 0.9). In addition, a limited number of convolutional layers (2) is considered and L1 and L2 weight regularization (0.01) is utilized, forcing the weights to take smaller values in order to simplify the model.
The number of epochs for learning the weights is empirically set to 50. An epoch is said to have passed when all the training data make a forward and backward pass through the network. In order to increase the training speed, the data are split into batches. A batch size of 16 samples is considered.
3.2.3. CNN Results and Visualization
The CNN generally proves to be very efficient in distinguishing between classes, reaching perfect classification in four out of the six problems enumerated in Section 2.1.
The model completely discerns between the surface morphology designed by CV and that reached by LP. It also differentiates between the CV surface morphology and the metal in its standard form. Additionally, the two inhibitors are recognized when the coating is induced by CV. The results for the case studies StandardLP and LPPVA − LPnAg/PVA, where the model has misclassified samples, are illustrated in Table 1. Table 2 provides a deeper per class statistical analysis for the former. This assessment takes into account several performance metrics for each class. Sensitivity accounts for the number of samples labelled correctly with the given class by the method out of all the examples actually belonging to that class. Specificity measures the number of samples assigned by the approach to the complementary classes out of those that really belong to the complement of that class. Precision gives the number of samples assigned correctly to the class by the technique over all the samples labelled by the model with that class in the learning process. The F1 score outputs the harmonic mean between precision and sensitivity. Balanced accuracy denotes the average sum of sensitivity and specificity.

Table 1.
Prediction accuracy and confusion matrix for the more complex classification tasks. LP—linear potentiometry; PVA—polyvinyl alcohol.
Table 2.
Statistical measures for the performance obtained in the case of each class for the StandardLP task.
Figure 3 shows the samples that are misclassified by the model. Figure 4 brings more insight about the decision of the model regarding the likelihood that a sample belongs to a specific class. This output is provided for every test example within the StandardLP task in the form of probabilities for each category. In Figure 4, every class is taken in turn. For every test image of that category, the approach outputs the probabilities of belonging to each of the four possible classes. Ideally, the probability for the real class is the highest.
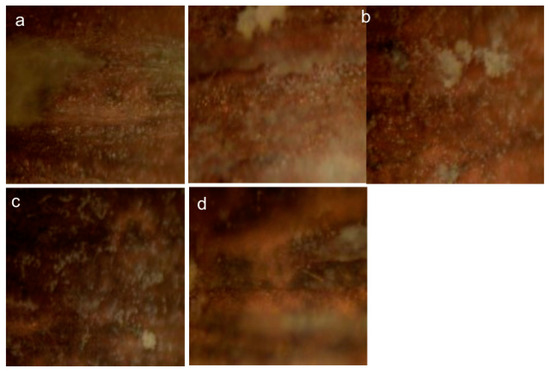
Figure 3.
The optical images (×80) of the samples misclassified by the CNN model (in the following, with the meaning “correct class labeled as wrong category”): (a)—LPuninhib labeled as LPPVA, (b)—LPPVA labeled as LPnAg/PVA, (c)—LPPVA labeled as LPuninhib,(d)—LPnAg/PVA labeled as LPPVA. The last sample from the second row is misclassified within both classification tasks, StandardLP and LPPVA − LPnAg/PVA.
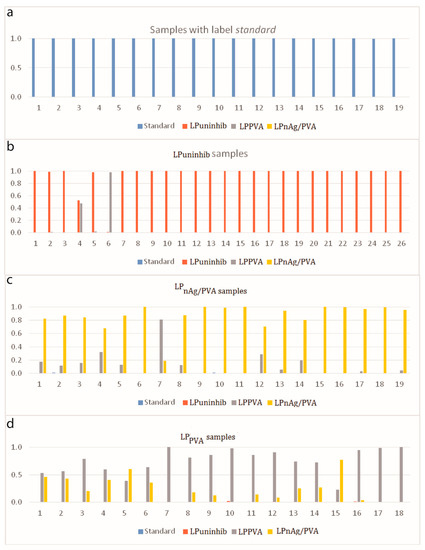
Figure 4.
Classification probabilities for every sample from the test set, when considering every class in turn, each drawn in a different color: (a)—standard samples, (b)—LPuninhib samples, (c)—LPnAg/PVA samples, (d)—samples labeled with LPPVA. Ideally, all the highest bars for a plot should have the color of the represented class.
3.2.4. Discussion
The obtained classification accuracies for all six subsets of data illustrate that there is a high resemblance between LPPVA and LPnAg/PVA. Two LPPVA samples are misclassified for LPnAg/PVA within the StandardLP task, as observed in the confusion matrix from Table 1 and further illustrated in Figure 3. The same misclassifications lead to a reduced sensitivity rate in Table 2 for LPPVA. By analyzing further how these samples are confused by the model, they can be identified in Figure 4, last row, as samples 5 and 15. As observed in both situations, however, the probabilities of assigning the samples to the reference class, that is, LPPVA, are relatively high, at 0.39 and 0.23, respectively.
The interpretation is that the two samples have characteristics that are common to both categories and the distinction between them is difficult. This observation is sustained by the fact that, as can be seen in the same fourth plot from Figure 4, for other samples, even if the decision was the correct one, the probabilities of assigning the samples to LPnAg/PVA are still very high; this can be especially seen for slides 1–6, 13, and 14, but also for 8, 9, 11, or 12.
There is a clear demarcation between the slides of the standard copper and the rest of the categories. The observation is underlined in the first row of Table 2, but it can be also noticed in the first plot of Figure 4, where the probabilities of assigning the samples to the actual class are equal to 1 in all situations. The LPuninhib samples are usually very distinct when compared with the other classes, with only two exceptions, samples 4 and 6 in the second plot from Figure 4, when they are found similar to LPPVA. In one of the two cases (sample 6, also illustrated in the first image from Figure 3), the decision even favors the latter. LPnAg/PVA samples are well detected in most cases, with minor resemblances to LPPVA and one sample (sample 7 in the third plot from Figure 4) even confused to LPPVA.
The specificity (Table 2) illustrates that most of the time when the samples are misclassified, they are put in either LPPVA or LPnAg/PVA, and less often in LPuninhib. Precision, F1, and balanced accuracy also underline that the categories that are more difficult to distinguish are LPPVA and LPnAg/PVA.
An interesting aspect is that LPPVA is well distinguished in the LPPVAnAg/PVA binary classification task and the only sample that is misclassified is the last slide from Figure 3. Clearly, when having four classes, the task of the CNN is more complex, which leads to confusion in interpreting the LPPVA slides, while for the binary classification, they are easier to separate.
3.3. Classical Investigation
3.3.1. Results of the Electrochemical Measurements
The semilogarithmic curves processed from the LP polarization ones in the potential range between −1.0 and 1.0 V are shown in Figure 5.
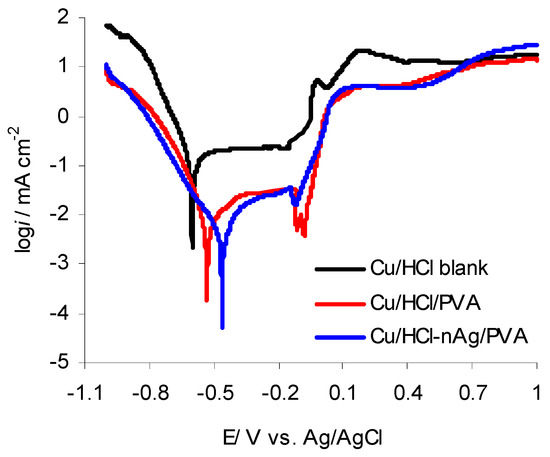
Figure 5.
Semilogarithmic curves obtained in the potential range of −1.0 V to 1.0 V for copper corroded in 0.1 mol·L−1 HCl blank solution and 0.1 mol·L−1 HCl solution containing PVA and nAg/PVA, respectively.
It can be seen that in the presence PVA and nAg/PVA, respectively, both anodic and cathodic processes are affected in a considerable manner. The corrosion potential (Ecorr) shifted towards the positive direction, while polarization curves were recorded at lower currents compared with those obtained in the HCl blank solution. This behavior leads to the hydrogen evolution reaction decreasing and delaying the oxidation processes. Consequently, it can be assumed that the corrosion is restricted by the adsorption of PVA and nAg/PVA, respectively, on the copper surface, contributing to assembling the interfacial coatings and changing the surface architecture. The experimental data are listed in Table 3.
Table 3.
Inhibition efficiency (IE) and the main electrochemical parameters of copper corroded in 0.1 mol L−1 HCl solution containing 0.1 % PVA, in the absence and presence of silver nanoparticles.
Investigating the data from Table 3, it can be observed that the corrosion current density decreases and polarization resistance increases. Consequently, the copper corrosion inhibition in the HCl solution takes place with an efficiency of 94.0% in the presence of PVA and around 98.0% in the presence of nAg/PVA. The inhibition efficiency (IE) was calculated using Equation (1) [29].
where EPo indicates the value of each elelectrochemical parameter (EP) as iocorr and Rop computed for copper in 0.1 mol L−1 HCl blank solution; and EP are the values of icorr and Rp parameters calculated for copper corroded in HCl solution containing PVA and nAg/PVA.
Consequently, PVA and nAg/PVA are effective inhibitors for copper corrosion in 0.1 mol·L−1 HCl solution, acting by adsorption on the surface, which results in the formation of protective coatings that restrict corrosion processes.
3.3.2. SEM Observation
SEM images of the copper surface before and after LP in 0.1 mol L−1 HCl solution, without and with inhibitors, are presented in Figure 6. To better highlight the profile of coatings, two magnifications were used, as 5.0 μm for all samples (Figure 6a–d) and 1.0 μm for the samples corroded in the presence of inhibitors (Figure 6c’,d’).
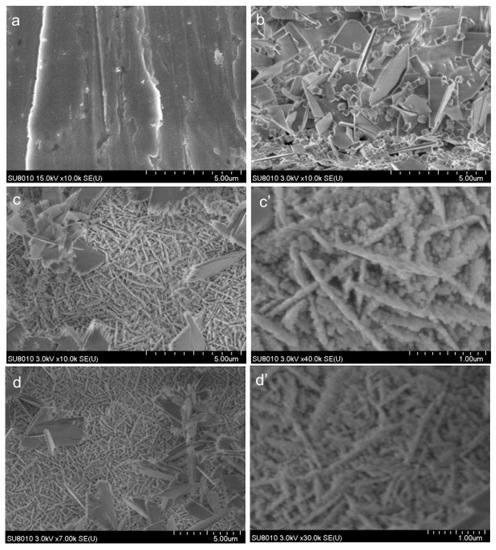
Figure 6.
SEM images of copper surface: (a)—standard copper; (b)—after LP in 0.1 mol·L−1 HCl blank solution; (c,c’)—after LP in 0.1 mol·L−1 HCl solution containing PVA; (d,d’)—after LP in 0.1 mol·L−1 HCl solution containing nAg/PVA.
Certain randomly distributed deposits on the surface can be observed after corrosion in the uninhibited acid solution (Figure 6b), which drastically change the characteristics of the standard (Figure 6a). On the contrary, in the presence of inhibitors (Figure 6c,d), more uniform coatings are observed with an architecture of some irregular “nano-cables”. This is probably because of the capacity of the copper ions to initiate the PVA crosslinking reaction [30], which then forms a cross-linked polymer coating on the surface that prevents the dissolution of the copper. As shown in Figure 6d’, the “nano-cables” are more orderly distributed on the surface, compared with those highlighted in Figure 6c’, leading to a more uniform coating in the presence of silver.
3.3.3. Correlation of the Results Obtained from Classical Investigation with CNN Information
The same conclusions can be deduced by applying CNN on the optical microscopy slides. The CNN inherently learned distinctive characteristics for each class of surface morphology, showing a clear demarcation between the standard copper slides and those obtained after LP in uninhibited HCl solution. There were no similarities with the standard, which implies that the corrosion affects the entire surface.
The slides of inhibited samples are very distinct as opposed to those of the uninhibited samples, with minor similarities being detected, indicating that the surface is almost completely covered with the polymer layers, this being in good agreement with the high surface coverage degree computed from electrochemical measurements, which reached values of 0.94 for PVA and 0.98 for nAg/PVA.
The microscopy slides of nAg/PVA were well detected from those with PVA, involving a different morphology of these, probably because of the surface chemistry modification by the silver interconnection to the macromolecular chain. The resemblances between some nAg/PVA slides and PVA ones indicate that, on the copper surface, there are certain free fractions from silver nanoparticles and, consequently, these are randomly distributed over the surface.
3.4. Important Data Derived from the CNN Regarding the Protective Coatings Against Corrosion
a. The type of corrosion can be determined by comparative examination of the slides acquired for the standard metal/alloy and those of the sample exposed to corrosive media without inhibitors. Thus, in our study, the slides of the surface fractions attained for the corroded sample in the acid environment without inhibitors were not confused with those of the reference sample, indicating that the surface was totally affected and generalized corrosion was induced on the copper surface.
b. The surface coverage degree or the coated surface fraction with the protective layer formed by the adsorption of some organic compounds may be estimated by comparison between the slides obtained for the copper surface modified in inhibited acid media with those acquired in an uninhibited acid environment. Particularly, under the conditions mentioned in our study, in the presence of PVA, some slides similar to those of the uninhibited sample were found, showing that there are unprotected surface fractions. The CNN applied on microscopy slides identifies minor similarities between uninhibited and inhibited samples, meaning that the surface coverage degree reaches a high level.
c. The CNN can extract the peculiarities of surface layers formed by the adsorption of distinct systems. As shown in our study, in most of the cases, LPnAg/PVA samples were well delimited; the minor similarities with LPPVA that were detected suggest that the silver nanoparticles were not evenly distributed in the PVA film.
d. The CNN accurately distinguishes differences or similarities between the coatings presenting the same surface chemistry, but assembled by different methods. Some of the distinctive features (shapes) found by the network for the states Standard, CVuninhib, CVnAg/PVA, LPuninhib, and LPnAg/PVA can be visualized in Figure 7, where selected activation maps from both convolutional layers are depicted. These are the result of the convolution process and are slices from the volume that enters the subsequent layer. Each filter focuses on different aspects of the initial image. The features in the figure are extracted from the image on the left.
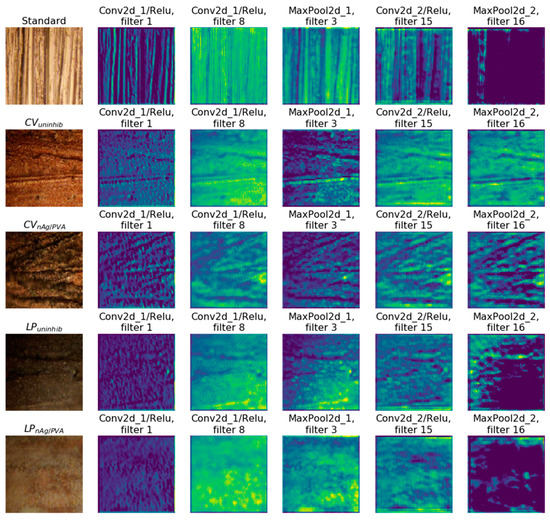
Figure 7.
Activation maps for copper slides: from top to bottom lines, the slide is in standard state, CVuninhib, CVnAg/PVA, LPuninhib, and LPnAg/PVA, respectively.
4. Conclusions
PVA and nAg/PVA coatings formed on the copper surface in 0.1 mol·L−1 HCl solution, after electrochemical measurements, were investigated using convolutional neural networks (CNN). The CNN data were compared with those obtained from electrochemical measurements and scanning electron microscopy (SEM).
The inhibition performance of PVA and nAg/PVA on copper corrosion in hydrochloric acid solution was calculated from electrochemical measurements, reaching high levels of 94.0% and 98.0%, respectively, indicating a high surface coverage degree of 0.94 in the presence of PVA and 0.98 in the presence of nAg/PVA.
The optical microscopy images designed a different morphology of copper surfaces after CV and LP, but PVA and nAg/PVA coatings obtained during linear potentiometry are easily confused.
The problem was resolved using the CNN method applied on microscopic slides, showing that LPPVA was well distinguished in the LPnAg/PVA binary classification task in a proportion of 97.5%.
Surface morphology of copper after electrochemical measurements in 0.1 mol·L−1 HCl solutions containing PVA and nAg/PVA, respectively, were examined by SEM. In the presence of inhibitors, an architecture of some irregular “nano-cables” is suggested, as a result of cross-linked polymer adsorption. The presence of silver nanoparticles does not change the surface architecture, but a more uniform coating can be observed.
The study thus showed that the novel popular deep learning computational paradigm can be successfully used to complement the standard means for investigating metal/alloy corrosion inhibition processes by objective multiple slide examination and additional estimation of affected/protected surface area.
Author Contributions
Conceptualization, A.S.; Data curation, B.T. and R.G.; Formal analysis, A.S.; Investigation, R.S., C.S., B.T., R.G. and N.C.; Methodology, A.S. and R.S.; Software, C.S.; Validation, R.S.; Visualization, C.S.; Writing—original draft, A.S., R.S. and C.S.
Funding
The funding of this work was supported by the research grants awarded by the University of Craiova, Romania, in the competition “The Awards of Research Results-ISI Articles”, November 2018.
Conflicts of Interest
The authors declare no conflict of interest.
References
- Fateh, A.; Aliofkhazraei, M.; Rezvanian, A.R. Review of corrosive environments for copper and its corrosion inhibitors. Arab. J. Chem. 2017. [Google Scholar] [CrossRef]
- Samide, A.; Bibicu, I.; Rogalsky, M.S.; Preda, M. Study of the corrosion inhibition of carbon steel in dilute ammoniacal media using N-cyclohexyl-benzothiazole-sulphenamide. Corros. Sci. 2005, 47, 1119–1127. [Google Scholar] [CrossRef]
- Rao, B.A.; Reddy, M.N. Formation, characterization and corrosion protection efficiency of self-assembled 1-octadecyl-1H-imidazole films on copper for corrosion protection. Arab. J. Chem. 2017, 10, S3270–S3283. [Google Scholar] [CrossRef]
- Kovacevic, N.; Milosev, I.; Kokalj, A. The roles of mercapto, benzene, and methyl groups in the corrosion inhibition of imidazoles on copper: II. Inhibitor–copper bonding. Corros. Sci. 2015, 98, 457–470. [Google Scholar] [CrossRef]
- Samide, A.; Tutunaru, B.; Negrila, C.; Dobritescu, A. Study of the corrosion products formed on carbon steel surface in hydrochloric acid solution. J. Therm. Anal. Calorim. 2012, 110, 145–152. [Google Scholar] [CrossRef]
- El Ibrahimi, B.; Soumoue, A.; Jmiai, A.; Bourzi, H.; Oukhrib, R.; El Mouaden, K.; El Issami, S.; Bazzi, L. Computational study of some triazole derivatives (un-and protonated forms) and their copper complexes in corrosion inhibition process. J. Mol. Struct. 2016, 1125, 93–102. [Google Scholar] [CrossRef]
- Samide, A. A pharmaceutical product as corrosion inhibitor for carbon steel in acidic environments. J. Environ. Sci. Health A 2013, 48, 159–165. [Google Scholar] [CrossRef]
- Samide, A.; Tutunaru, B. Adsorption and inhibitive properties of a Schiff base for the corrosion control of carbon steel in saline water. J. Environ. Sci. Health A 2011, 46, 1713–1720. [Google Scholar] [CrossRef]
- Qiang, Y.; Zhang, S.; Xu, S.; Li, W. Experimental and theoretical studies on the corrosion inhibition of copper by two indazole derivatives in 3.0% NaCl solution. J. Colloid Interface Sci. 2016, 472, 52–59. [Google Scholar] [CrossRef]
- Samide, A.; Tutunaru, B.; Ionescu, C.; Rotaru, P.; Simoiu, L. Aminophylline: Thermal characterization and its inhibitory properties for the carbon steel corrosion in acidic environment. J. Therm. Anal. Calorim. 2014, 118, 631–639. [Google Scholar] [CrossRef]
- Samide, A.; Tutunaru, B.; Dobriţescu, A.; Ilea, P.; Vladu, A.C.; Tigae, C. Electrochemical and theoretical study of metronidazole drug as inhibitor for copper corrosion in hydrochloric acid solution. Int. J. Electrochem. Sci. 2016, 11, 5520–5534. [Google Scholar] [CrossRef]
- Albarqouni, S.; Baur, C.; Achilles, F.; Belagiannis, V.; Demirci, S.; Navab, N. Aggnet: Deep learning from crowds for mitosis detection in breast cancer histology images. IEEE Trans. Med. Imag. 2016, 35, 1313–1321. [Google Scholar] [CrossRef] [PubMed]
- Saha, M.; Chakraborty, C.; Racoceanu, D. Efficient deep learning model for mitosis detection using breast histopathology images. Comput. Med. Imag. Graph. 2018, 64, 29–40. [Google Scholar] [CrossRef] [PubMed]
- Sirinukunwattana, K.; Raza, S.E.A.; Tsang, Y.V.; Snead, D.R.J.; Cree, I.A.; Rajpoot, N.M. Locality sensitive deep learning for detection and classification of nuclei in routine colon cancer histology images. IEEE Trans. Med. Imag. 2016, 35, 1196–1206. [Google Scholar] [CrossRef] [PubMed]
- Postavaru, S.; Stoean, R.; Stoean, C.; Joya, G. Adaptation of deep convolutional neural networks for cancer grading from histopathological images. In Proceedings of International Work-Conference on Artificial Neural Networks (IWANN) 2017: Advances in Computational Intelligence, Cadiz, Spain, 14–16 June 2017; Rojas, I., Joya, G., Catala, A., Eds.; Springer: Cham, Switzerland, 2017; Volume 10306, pp. 38–49. [Google Scholar]
- Sheikhzadeh, F.; Ward, R.K.; Van Niekerk, D.; Guillaud, M. Automatic labeling of molecular biomarkers of immunohistochemistry images using fully convolutional networks. PLoS ONE 2018, 13, e0190783. [Google Scholar] [CrossRef] [PubMed]
- Xing, F.; Xie, Y.; Su, H.; Liu, F.; Yang, L. Deep learning in microscopy image analysis: A survey. IEEE Trans. Neural Netw. Learn. Sys. 2017, 29, 4550–4568. [Google Scholar] [CrossRef] [PubMed]
- Li, R.; Zeng, T.; Peng, H.; Ji, S. Deep learning segmentation of optical microscopy images improves 3-D neuron reconstruction. IEEE Trans. Med. Imag. 2017, 36, 1533–1541. [Google Scholar] [CrossRef]
- Kraus, O.Z.; Ba, J.L.; Frey, B.J. Classifying and segmenting microscopy images with deep multiple instance learning. Bioinformatics 2016, 32, i52–i59. [Google Scholar] [CrossRef]
- Calderon, C.P.; Daniels, A.L.; Randolph, T.W. Deep convolutional neural network analysis of flow imaging microscopy data to classify subvisible particles in protein formulations. J. Pharm. Sci. 2018, 107, 999–1008. [Google Scholar] [CrossRef]
- Fredericksen, M.A.; Zhang, Y.; Hazen, M.L.; Loreto, R.G.; Mangold, C.A.; Chen, D.Z.; Hughes, D.P. Three-dimensional visualization and a deep-learning model reveal complex fungal parasite networks in behaviorally manipulated ants. Proc. Natl. Acad. Sci. USA 2017, 114, 12590–12595. [Google Scholar] [CrossRef]
- Ziatdinov, M.; Dyck, O.; Maksov, A.; Li, X.; Sang, X.; Xiao, K.; Unocic, R.R.; Vasudevan, R.; Jesse, S.; Kalinin, S.V. Deep learning of atomically resolved scanning transmission electron microscopy images: Chemical identification and tracking local transformations. ACS Nano 2017, 11, 12742–12752. [Google Scholar] [CrossRef] [PubMed]
- Khaled, K.F.; Abdel-Shafi, N.S. Corrosion inhibition of mild steel by some sulfur containing compounds: Artificial neural network modeling. J. Mater. Environ. Sci. 2014, 5, 1288–1297. [Google Scholar]
- Bassam, A.; Ortega-Toledo, D.; Hernandez, J.A.; Gonzalez-Rodriguez, J.G.; Uruchurtu, J. Artificial neural network for the evaluation of CO2 corrosion in a pipeline steel. J. Solid State Electr. 2009, 13, 773–780. [Google Scholar] [CrossRef]
- Samide, A.; Stoean, C.; Stoean, R. Surface study of inhibitor films formed by polyvinyl alcohol and silver nanoparticles on stainless steel in hydrochloric acid solution using convolutional neural networks. Appl. Surf. Sci. 2019, 475, 1–5. [Google Scholar] [CrossRef]
- Samide, A.; Iordache, S.; Iacobescu, G.E.; Tigae, C.; Spînu, C. Titanium implant surface modification in physiological serum containing new mixed inhibitor based on poly(vinyl) alcohol/silver nanoparticles/epirubicin. Int. J. Elecrochem. Sci. 2018, 13, 12125–12139. [Google Scholar] [CrossRef]
- Samide, A.; Tutunaru, B.; Bratulescu, G.; Ionescu, C. Electrochemical synthesis and characterization of new electrodes based on poly-hematoxylin films. J. Appl. Polym. Sci. 2013, 130, 687–697. [Google Scholar] [CrossRef]
- Karpathy, A. Stanford University cs231n: Convolutional Neural Networks for Visual Recognition. 2018. Available online: http://cs231n.github.io/convolutional-networks/ (accessed on 7 February 2019).
- Samide, A.; Iacobescu, G.E.; Tutunaru, B.; Grecu, R.; Tigae, C.; Spînu, C. Inhibitory properties of neomycin thin film formed on carbon steel in sulfuric acid solution: Electrochemical and AFM investigation. Coatings 2017, 7, 181. [Google Scholar] [CrossRef]
- Gong, J.; Luo, L.; Yu, S.H.; Qian, H.; Fei, L. Synthesis of copper/cross-linked poly(vinyl alcohol) (PVA) nanocables via a simple hydrothermal route. J. Mater. Chem. 2006, 16, 101–105. [Google Scholar] [CrossRef]
© 2019 by the authors. Licensee MDPI, Basel, Switzerland. This article is an open access article distributed under the terms and conditions of the Creative Commons Attribution (CC BY) license (http://creativecommons.org/licenses/by/4.0/).