Article

A Comparative Study of YSZ Suspensions and Coatings

Department of Mechanical, Industrial and Aerospace Engineering, Concordia University, Montreal, QC H3G1M8, Canada
*
Author to whom correspondence should be addressed.
Coatings 2019, 9(3), 188; https://doi.org/10.3390/coatings9030188
Submission received: 6 January 2019 / Revised: 2 March 2019 / Accepted: 5 March 2019 / Published: 13 March 2019

Abstract

:
The demand for suspensions that are used in thermal spray processes is expanding from research labs using the lab-prepared suspensions toward actual coating production in different industrial sectors. Industrial applications dictate the reduced production time and effort, which may in turn justify the development of the market for ready-to-use commercial suspensions. To this end, some of the powder suppliers have already taken steps forward by introducing, to the market, suspensions of some of the most used materials, such as yttria-stabilized zirconia (YSZ), alumina, and titania. However, there is a need to compare the suspension characteristics over time and the resultant coatings when using these suspensions when compared with the freshly prepared homemade suspensions. In this work, such a comparison is done using YSZ suspensions of the sub-micron to a few micron powders. In addition, some changes in the suspensions’ formula were performed as a tool to vary the coatings’ microstructures in a more predictable way, without any variation of the spray parameters. The coatings were generated while using both radial and axial injection of the suspensions into Oerlikon-Metco 3MB and Mettech Axial III plasma spray torches, respectively. A clear effect of suspension viscosity on the coating microstructure was observed using the 3MB torch with a radial injection of suspension (i.e., cross flow atomization). However, the viscosity role was not dominant when using the Axial III torch with an axial feed injection system (i.e., coaxial flow atomization).

1. Introduction

The suspension plasma spray (SPS) process is considered as a technique that enables variations of thermally sprayed coatings e.g., from highly dense and vertically cracked (DVC) to porous, feathery, and columnar microstructures [1]. There is a growing demand for yttria-stabilized zirconia (YSZ) suspensions to deposit thermal barrier coatings (TBC), either to generate the main TBC ceramic layer or as a repair method [2]. In both cases, the preferred microstructure contains large globular pores and connected cracks that can potentially yield high strain tolerance and low thermal conductivity [1,3].
Accordingly, to satisfy the needs of the industry, the suppliers have offered to the market the ready-to-use suspensions of yttria stabilized zirconia-YSZ powders. Therefore, it is a matter of interest to first identify the differences (if any) of the commercially available suspensions with those freshly made in laboratory. A major difference when comparing commercial suspensions with the homemade ones is the freshness of the latter. Therefore, whether the “aging” of a suspension could affect its properties is a question that is to be addressed in this work. In addition, the commercial suspension formula target highly demanding applications that require coatings with specific microstructure and properties that are produced in a consistent manner. Therefore, it would be important to verify the flexibility of such commercial formula toward the fabrication of different types of microstructure mentioned above (columnar, DVC, etc.).
While numerous studies have been conducted for controlling the coating microstructure by optimizing the spray parameters [4,5], this work focusses on investigating the influence of the suspension characteristics on the coating structure, while keeping the other spray parameters constant. VanEvery et al. [6] suggested a mechanism for variation of the SPS coating microstructures that are based on the impacting particle size that has a direct influence on the particle velocity and direction prior to impact [7,8] and it showed a transition from planar (like in atmospheric plasma spray (APS)) deposition to columnar coatings as the average particle size decreases. The size of the suspension droplets that were atomized by the plasma jet has a strong influence on the size of the in-flight particles in SPS process [9,10,11]. It is known, based on the Stokes law [10], that the smaller particles suffering from low inertia can easily be distracted from the normal flow by the stagnating gas layer parallel to the substrate on the deposition point. Such small particles will be thus forced toward a parallel flow to the substrate, resulting in an impact angle much less than 90°. In such a condition, the splat formation is less likely and a large number of such particles will get trapped in the roughness asperities of the substrate and it will form a mechanical barrier for the upcoming particles from reaching the substrate. This scenario favors less splat formation and more porous or even entirely columnar structures.
Therefore, the control of the resultant coating microstructure is dependent, among all, on the size of the droplets generated during the atomization/fragmentation of the suspension as it determines the size of the impacting particles that are formed following the evaporation of the suspension solvent [12]. In addition to the droplet size, a variety of morphologies of the in-flight suspension droplets during drying can be formed, such as solid or hollow spheres, as well as large inflated shapes that depend on their heating and drying history [13]. Such intermediate shapes of the particles following the solvent evaporation that occur before deposition on the substrate shall affect the coating microstructures [14].
Literature on atomization phenomena recognizes the importance of the viscosity and surface tension of the liquid phase (solvent and suspended solid particles in this study) in either cross flow [15,16] or coaxial flow [17]. These parameters become fundamental, especially when other parameters are identical, that is to say, when the densities (similar solid loading and carrier liquid) and the gas and liquid velocities (using identical spray parameters) during fragmentation of the suspensions are kept constant. Therefore, in this work, apart from particle size studies, the viscosity and surface tension of the suspensions are the main parameters of investigation.

2. Experimental

2.1. Suspensions and Feed Material

Overall, five different YSZ suspensions were deposited in this experiment, as presented in Table 1. They included two commercial suspensions (as received), one commercial suspension with an amended formula, and two homemade (HM) suspensions, all at 25 wt % solid. The commercial suspensions were supplied by Innovnano (4YSZSE.4, Porto Salvo, Portugal), named C1 in this work and Treibacher (YSZ suspension, Althofen, Austria), named C2. The amended commercial suspension is called C3. It was produced by adding 5 wt % of the solid content of PVP (Poly vinyl pyrrolidone, average mol wt. 40,000, Sigma-Aldrich Chemicals, Oakville, ON, Canada) in the C2 suspension that is continuously agitated with a magnetic stirrer (Huanghua faithful instrument Co., Huanghua, China). There is no surfactant present in the composition of the commercial suspension C1; and, the quantity of the surfactant in C2 (if any) is not known to the authors. The homemade suspensions that were prepared using the 8YZS powder (D50 0.4 µm) from Zhonglong Materials Group Co., Ltd., (Hongkong, China) had the formulation that is presented in Table 1 The surfactant used was with an amount of 5 wt % of the solid. The HM1 suspension was firstly produced by mixing the surfactant with the ethanol, followed by the gradual addition of the powder, while both magnetic and ultrasonic mixing were in process (during about 30 min). The HM2 suspension was generated the same way as HM1, except that, in this case, no surfactant was used.
The size distributions of the particles in the suspensions were measured while using the Spraytec particle size analyzer (Malvern Worcestershire, UK), which had a measurement range of 0.1–2000 µm. The system uses a wet cell, in which a dilute suspension of the particles in ethanol is circulated. An MRC 502 rheometer system (Anton-PaarGraz, Graz, Austria) using double cylinder method with shear rates that varied from 10 to 1000 s−1 measured the suspension viscosities. The measurements were done on fresh or magnetically re-mixed suspensions for at least 30 min or after bottle mixing (manual shaking) for the commercial suspensions. For further characterization of the suspensions, a thin layer of suspension was spread on a glass plate and then dried at room temperature. The particles and agglomerates were then observed by SEM microscopy using Hitachi TM-3030 system (Hitachi, Tokyo, Japan). Surface tension measurements were performed using the arrangement shown in Figure 1, which consists of a droplet flow syringe ending to a needle. The specified size of the tip of the needle allows for the suspension droplet to fall and the CCD camera (Data Physics Instruments, Stuttgart, Germany) takes a video of the phenomena. Using the recorded images, the moment of droplet detachment and the diameter and volume of the droplet are calculated, and based on the density of suspension (0.95 g/mm3) are translated to the surface tension by the software (Data physics SCA 22 Software for Surface and Interfacial measurement 2000250). The software uses the Young–Laplace equation for pendant drop tensiometry [18] to the experimental drop profile. The equation is based on the balance between the gravitational deformation of the drop and the restorative interfacial tension. A minimum of five measurements were taken and the related standard deviations were calculated as error bars.
The five suspensions were used to compare the commercial suspensions with homemade ones having either different formula and/or different time of life (previously prepared commercial or freshly prepared). In addition, they made it possible to investigate if the microstructures of coatings produced with the commercial suspensions can be tailored for other applications than TBC.

2.2. Coatings Generation

Two commercial plasma spray systems, including a 3MB torch (Oerlikon-Metco, Pfäffikon, Switzerland) with radial injection; and, an Axial III (Northwest Mettech Corp., North Vancouver, BC, Canada) with axial injection of the suspension, generated the coatings. In both cases, the suspension was fed into the plasma torch using a NanoFeed™ Liquid & Suspension Feeder (Northwest Mettech Corp., North Vancouver, BC, Canada), which uses a Coriolis flowmeter for density and flow rate measurements. The spray conditions are summarized in Table 2 and Table 3 for the two plasma spray torches. The plasma power that was used with 3MB torch was 25 kW and that of Mettech axial III was 78 kW. The substrates were 2.54 × 2.54 cm2 and 3 mm thick stainless steel 304 plates blasted with alumina grit 20. The approximate roughness of the substrates was 5–6 µm. The radial injection was normal to the flow axis.
Table 2 and Table 3 can point out that some deviations from the set point value in the feed rate were observed. These deviations were more pronounced when using the axial injection plasma torch (Table 3). The suspension densities, as measured during spraying, varied between 0.95–1.1 g/cm3. The fluctuations observed in the flow rate and the associated density could be related to temporary clogging of the injection line. The flow rate change is more pronounced in axial injection due to the injection nozzle exit being coaxial and relatively close to the torch exit that results in melting and solidification, and/or the accumulation of the dried powder particles on the nozzle exit. The variation in density during spray process can also to be due to some settlement of powders, as the mechanical mixing in the container during spraying is not as efficient as magnetic plus ultrasonic mixing during the preparation of the suspensions.

3. Results and Discussion

3.1. Suspension Characteristics

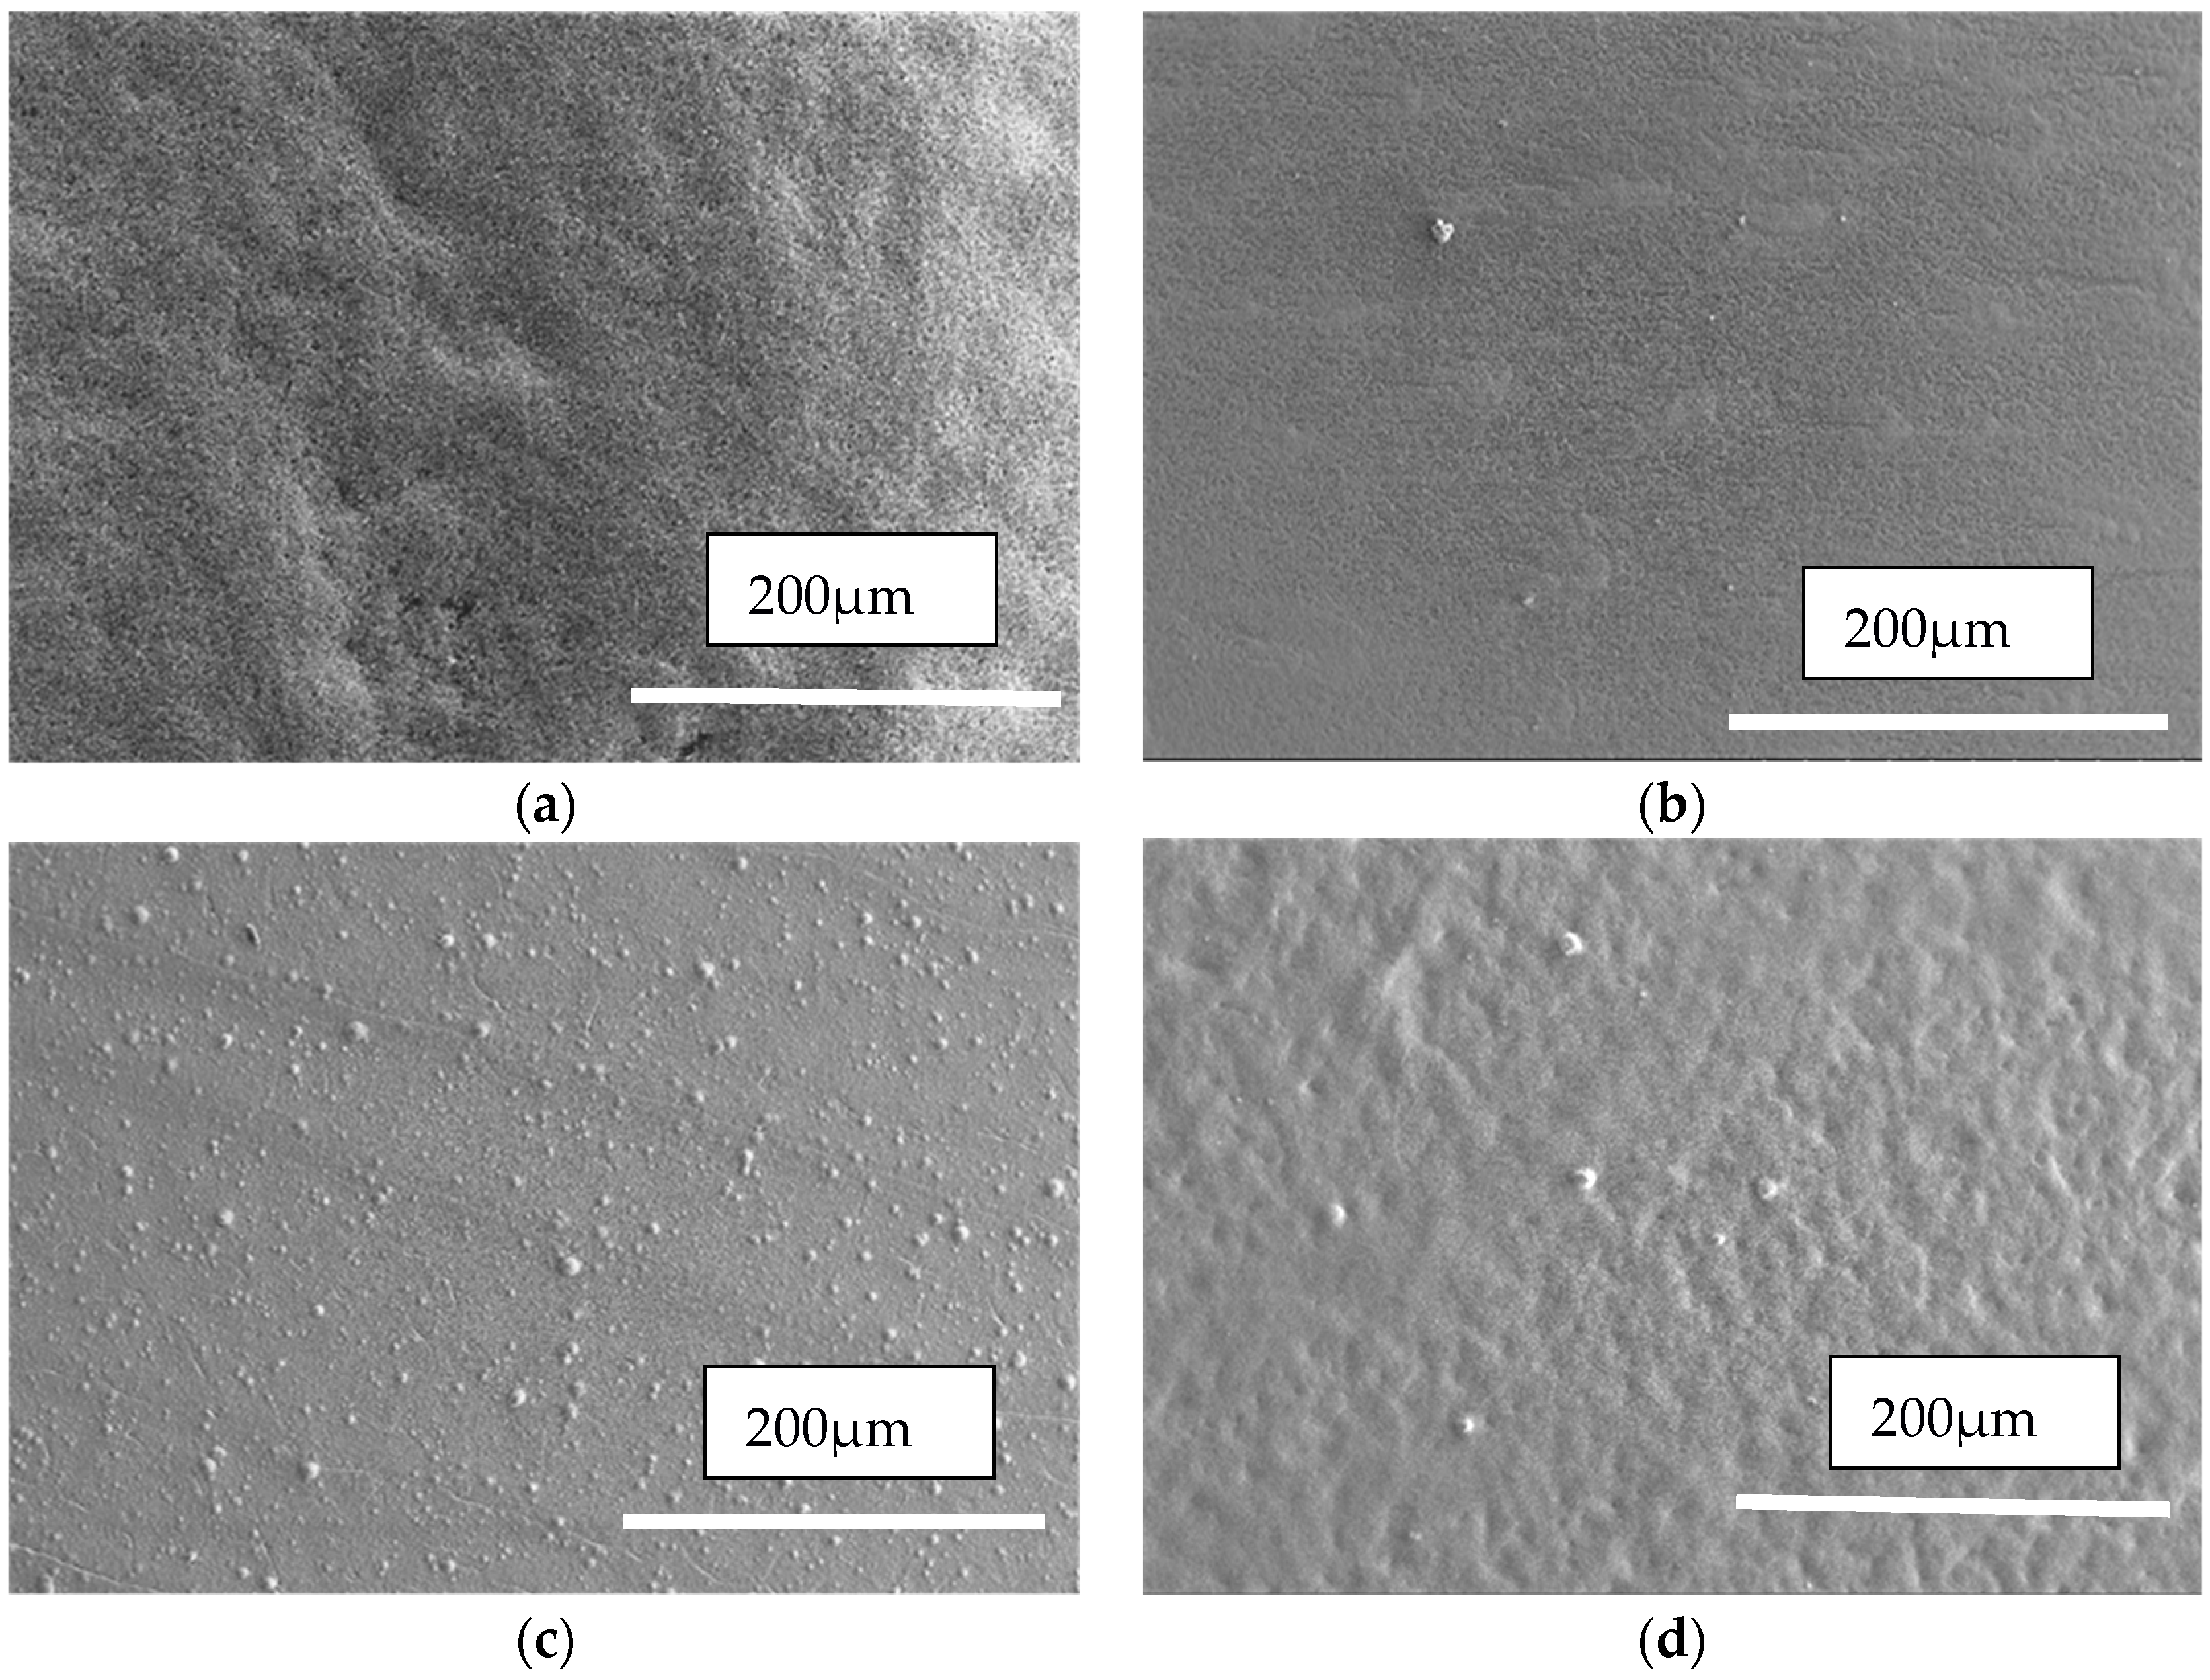
3.1.1. Dried Suspensions

Figure 2 presents the low magnification SEM images of the dried suspensions from the two commercial and the two homemade suspensions. It can be observed that there is a higher tendency in the HM suspensions to form large agglomerates of about up to 50 µm. This tendency is significantly stronger in case of the HM1, which contains surfactant. It is interesting to note that, while the surfactant may provide a better dispersion of particles in suspension and help with better stability, it can have a contradictory effect and favor the formation of large agglomerates. When comparing Figure 2a,b with Figure 2c,d, the difficulty to prepare homogeneous homemade suspensions in the lab is shown. Cleary, the processes used by the commercial suspension providers provide a high degree of homogeneity of the suspensions without significant number of large agglomerates, as shown in Figure 2a,b. Such agglomerates in the suspension can cause a blockage in various sections of the injection line and/or the formation of extra-large splats/partially-melted or un-melted particles, and thus impaired homogeneity in the resulting microstructure.
Higher magnification SEM images of the same suspensions are shown in Figure 3, revealing further information regarding the original powders that were used in each of these suspensions. It can be seen that, while the powders in C1 and the HM suspensions are closely similar in morphology (mainly round) and size, the powder particles in C2 are more of an angular shape and larger (roughly 2–3 times).

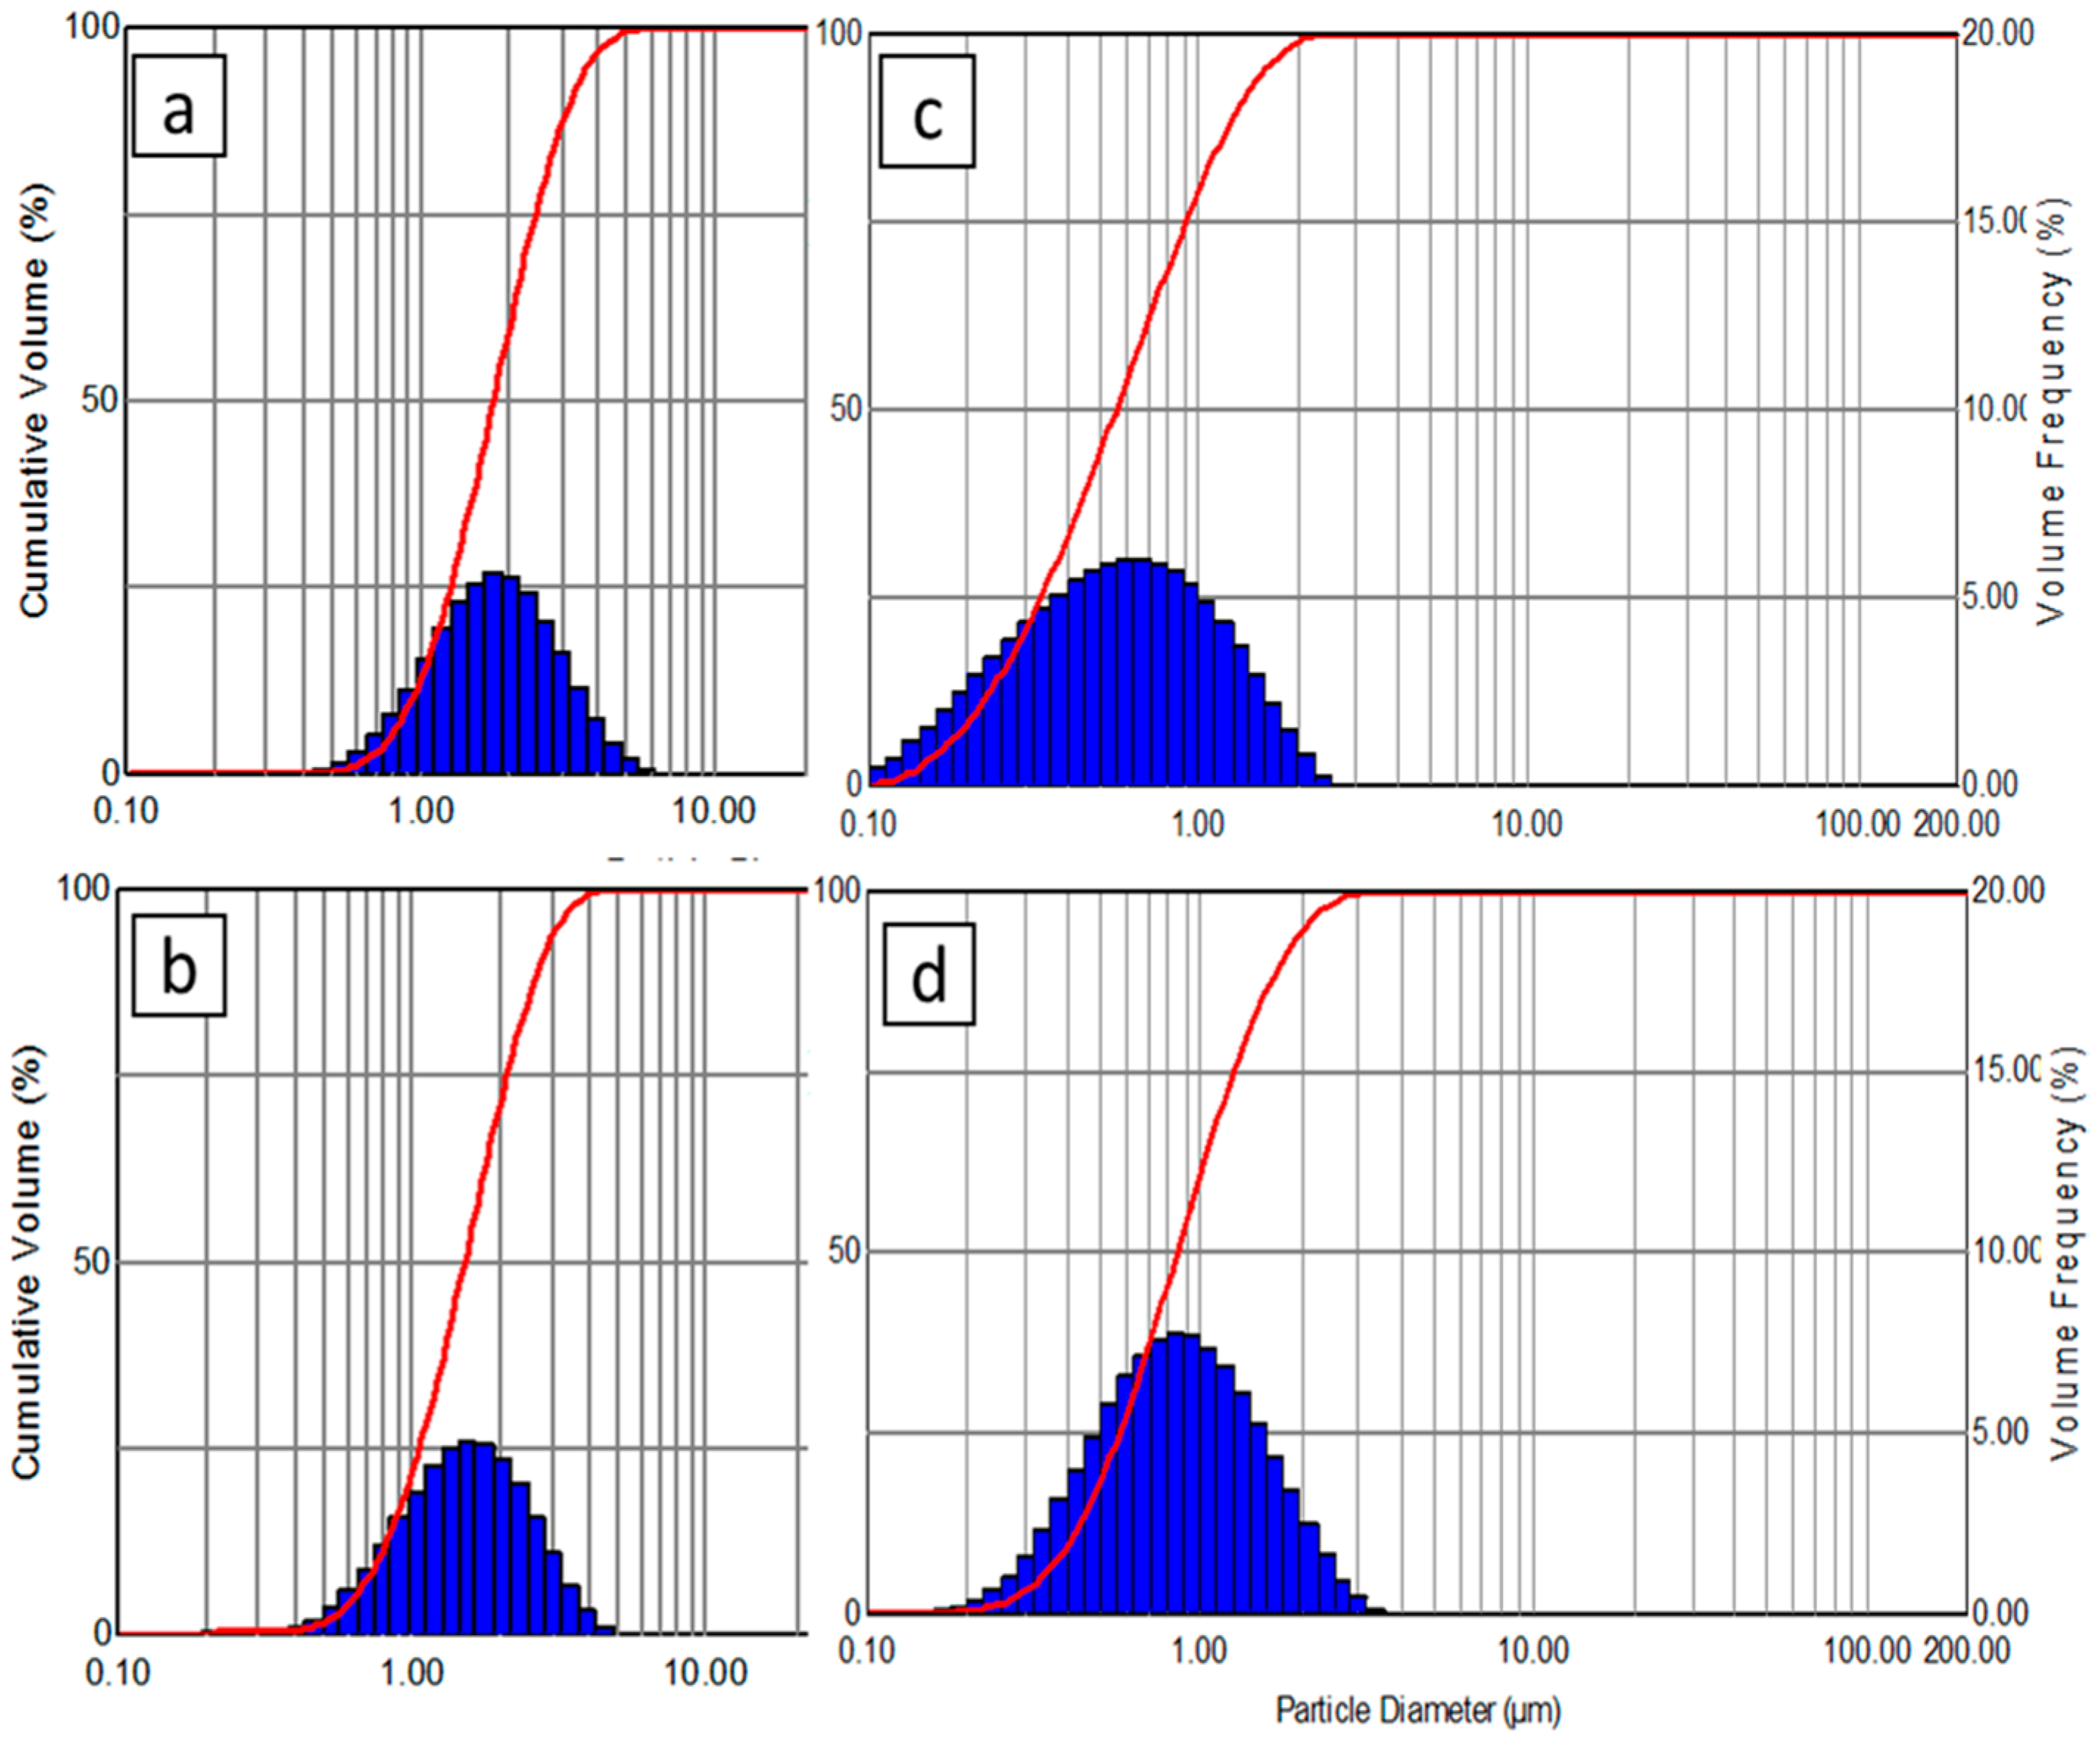
3.1.2. Particle Size Distributions

The measured particle/agglomerate size distributions in the suspensions are compared with the original powder size that was provided by the suppliers in Table 4. The measured size values can be significantly larger than the size of the particles, as they can form micron-sized agglomerates when suspended in ethanol. The addition of surfactant made it possible to better disperse the particles as seen when comparing homemade suspensions HM1 (with surfactant) with HM2 (without surfactant). Indeed, adding the surfactant resulted in a D50 of 0.4 µm, while a D50 of 1.00 µm was obtained for the suspension without a surfactant (HM1).
It should be noted that the SEM images appear to show particle sizes that are different from the particle sizer reports, primarily s these reports are in volumetric base, while the SEM image provides an impression of the size distribution that is based on the number of the particles. Figure 4 compares the size distribution of the two commercial suspensions and the two homemade ones. The size distribution curve for the suspension C3 was close to that of HM1.

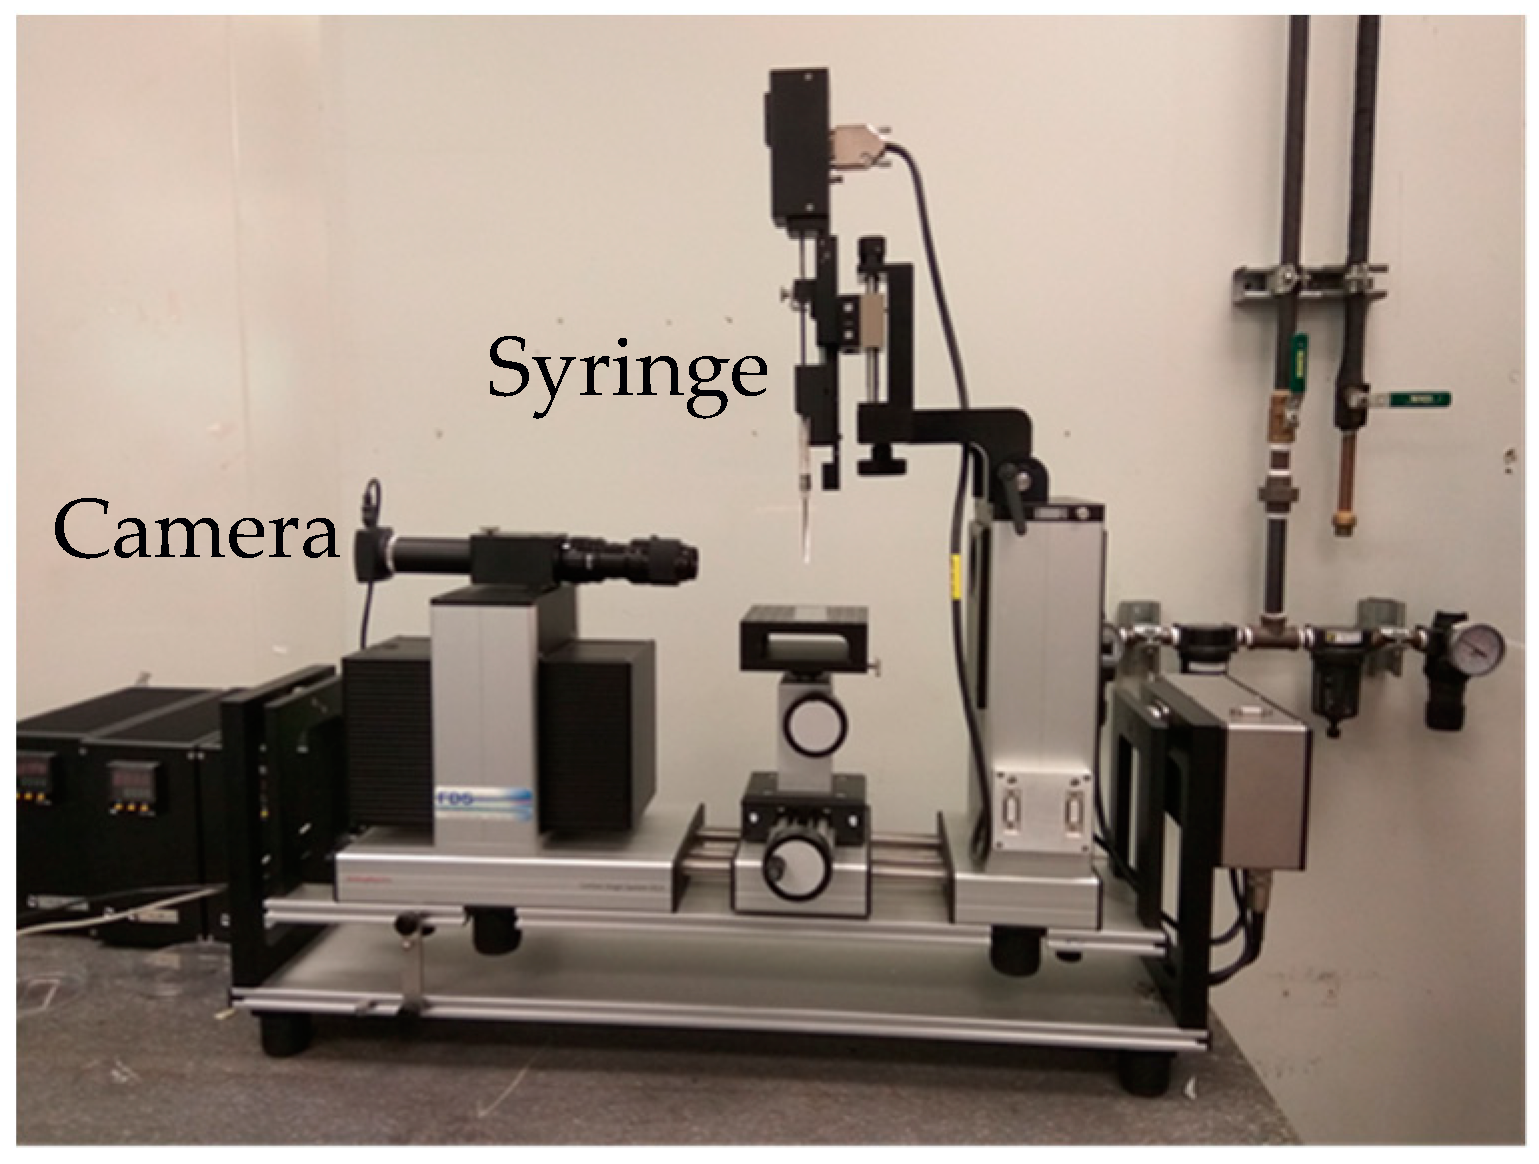
3.1.3. Surface Tensions
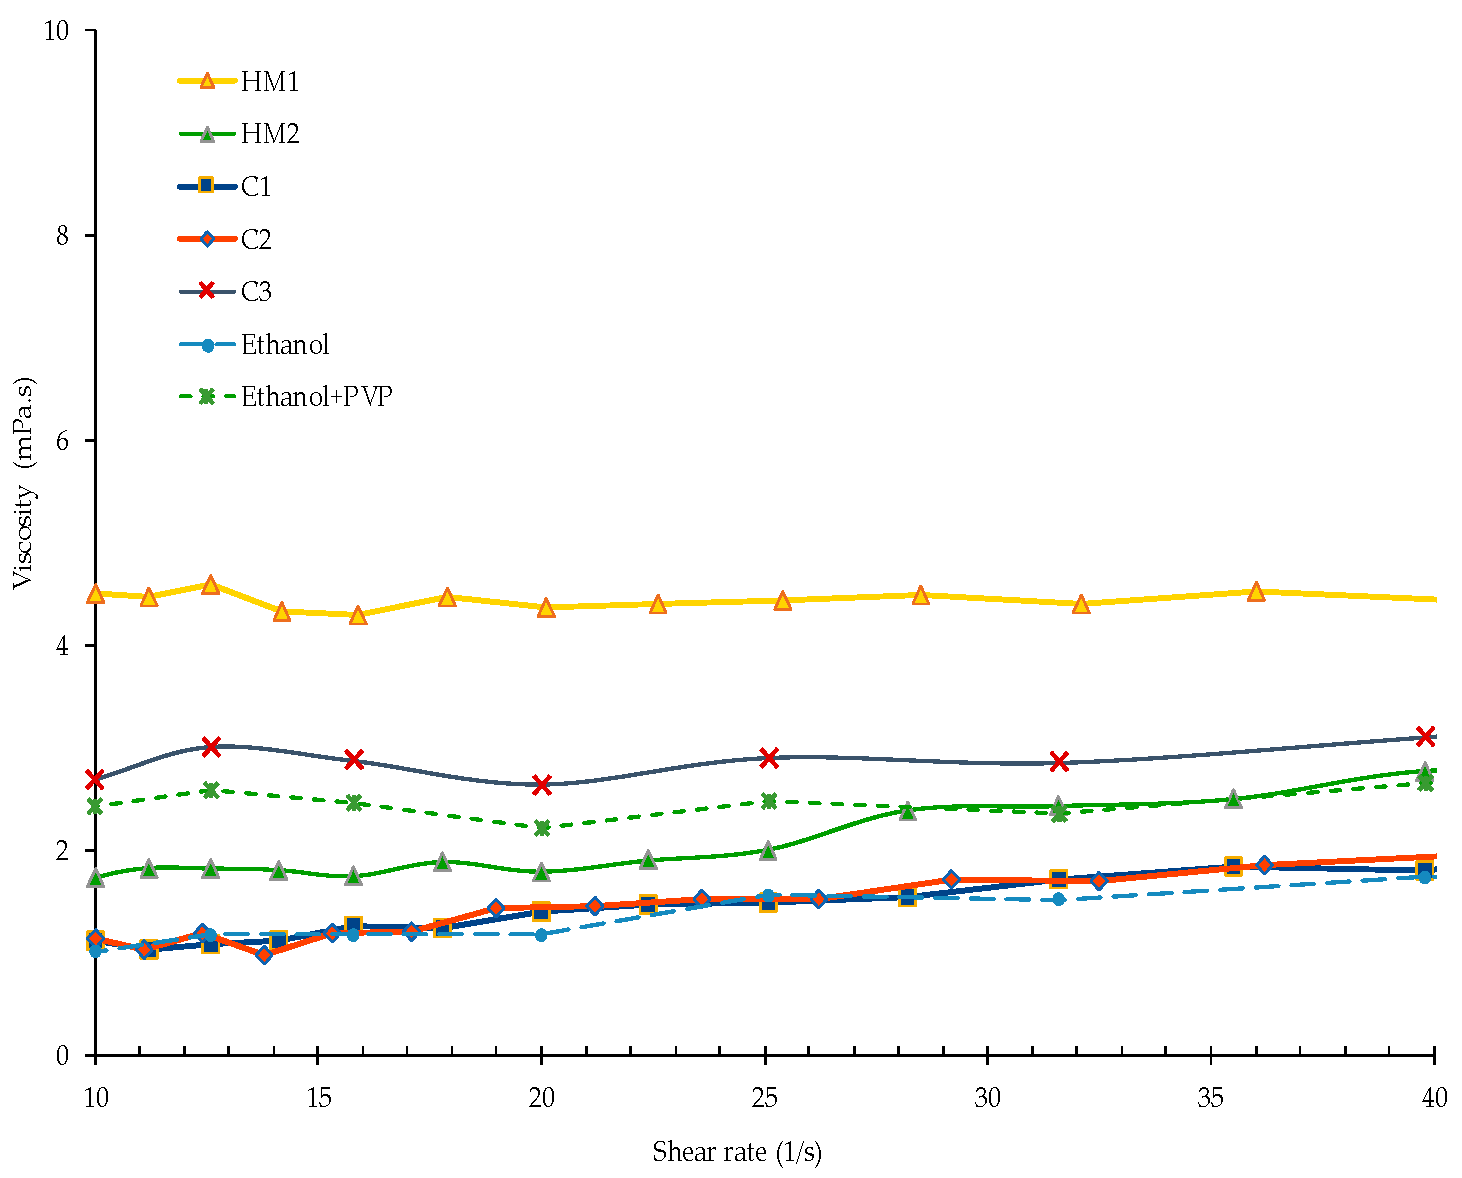
Surface tensions of six samples were measured including the two commercial suspensions and the homemade ones, both with and without surfactant addition. The results are summarized in Figure 5. Although, the suspension C1 with added surfactant (C1 + PVP) was not sprayed, the effect of the addition of surfactant to this suspension was investigated for comparison purpose and the verification of the behavior observed in commercial suspension C2. As can be readily seen, the changes in surface tension due to surfactant addition in all three suspensions are rather small (less than 6.5%). The highest surface tensions are obtained with the HM suspensions, while the lower ones are obtained with the C2 and C3. In addition, the effect of surfactant addition could be either increasing (in case of C1) or decreasing (in case of HM and C2).

3.1.4. Viscosity

Viscosity of the suspensions was studied to verify the effect of aging of the suspensions, as well as to investigate the effect of surfactant addition.
• Solid particles and surfactant effects
Figure 6 represents the viscosity of the two commercial suspensions, one amended commercial formula (C3) and the two homemade formulas. Both homemade suspensions (HM1 and HM2) present higher viscosities than the commercial suspensions. However, the addition of surfactant to the commercial suspension has resulted in an increase of viscosity, as observed in C3. A similar increase is observed when comparing the viscosity of HM2 (with surfactant) as compared with HM1 (without surfactant).
In the application of either polymeric or ionic surfactants, under-dosed (less than optimum quantity for stabilization) of surfactants can result in increased viscosity [19,20]. It can thus be the low quantity of surfactant that is used in this experiment that caused the increased viscosity of the suspensions.
It is known that the viscosity of a shear-thickening fluid depends on the shear rate. Key parameters that control the shear thickening behavior comprise; particle size distribution, particle volume fraction, particle shape, inter-particle interaction, and continuous phase (solvent) viscosity [21]. Here, to investigate the role of the solid particles on the thickening behavior of the suspensions, the viscosities of the solvents (ethanol and ethanol plus PVP) were measured and they are shown in Figure 6. It is also noticeable in this figure that the viscosity of the ethanol plus PVP is even higher than the suspension with 25 wt % solid without surfactant. This comparison emphasizes the non-negligible influence of even small quantities of surfactant on suspension viscosity.
• Aging effect
Figure 7 shows the effect of ageing on the suspension behavior. It should be noted that the aged suspensions were well remixed before deposition. The viscosities of the two suspensions—HM1 (with surfactant) and HM2 (without surfactant)—have been measured as fresh as well as after one, three, and five months. The viscosity is initially increased by the age of the suspension in one month. However, this relation reverses when the time gets longer. As can be seen for the viscosity of the suspension HM2 from one month to five months, the suspension shows a lower viscosity by time. It should be added that the viscosity of the commercial suspensions (aged for long time before testing and remixed in bottle) that were measured in different occasions were showing the same exact curves, regardless of the time.

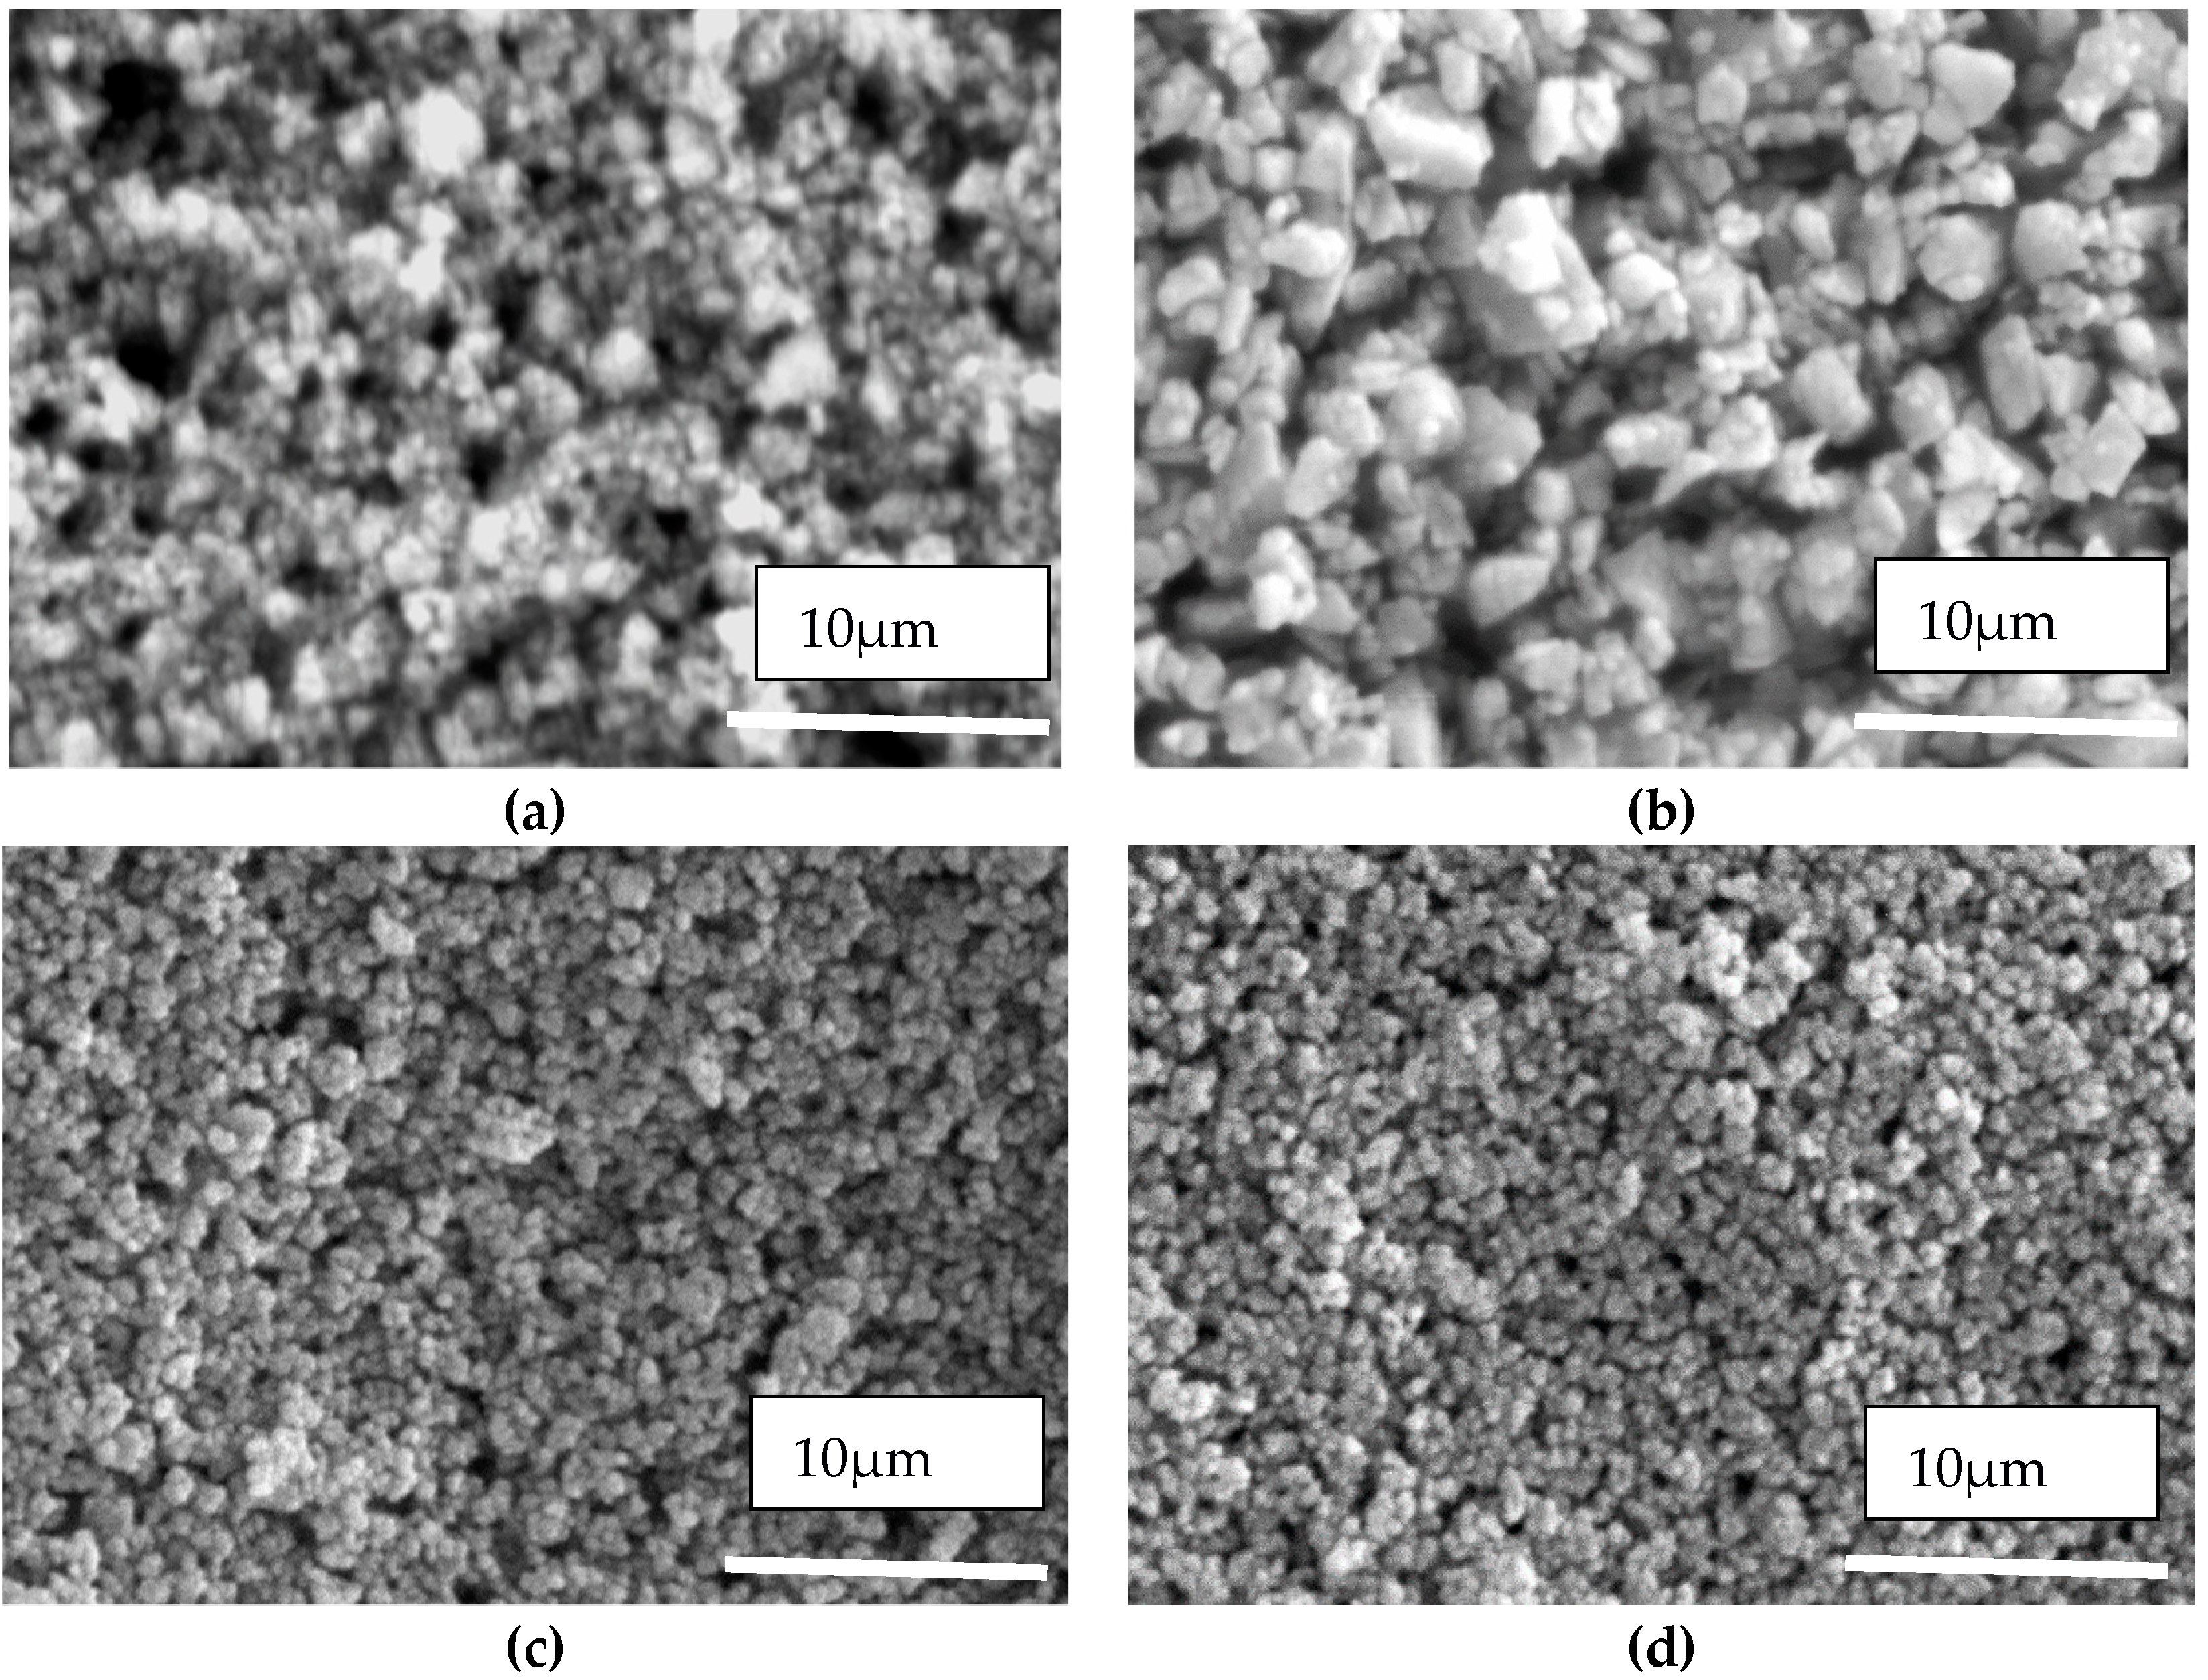
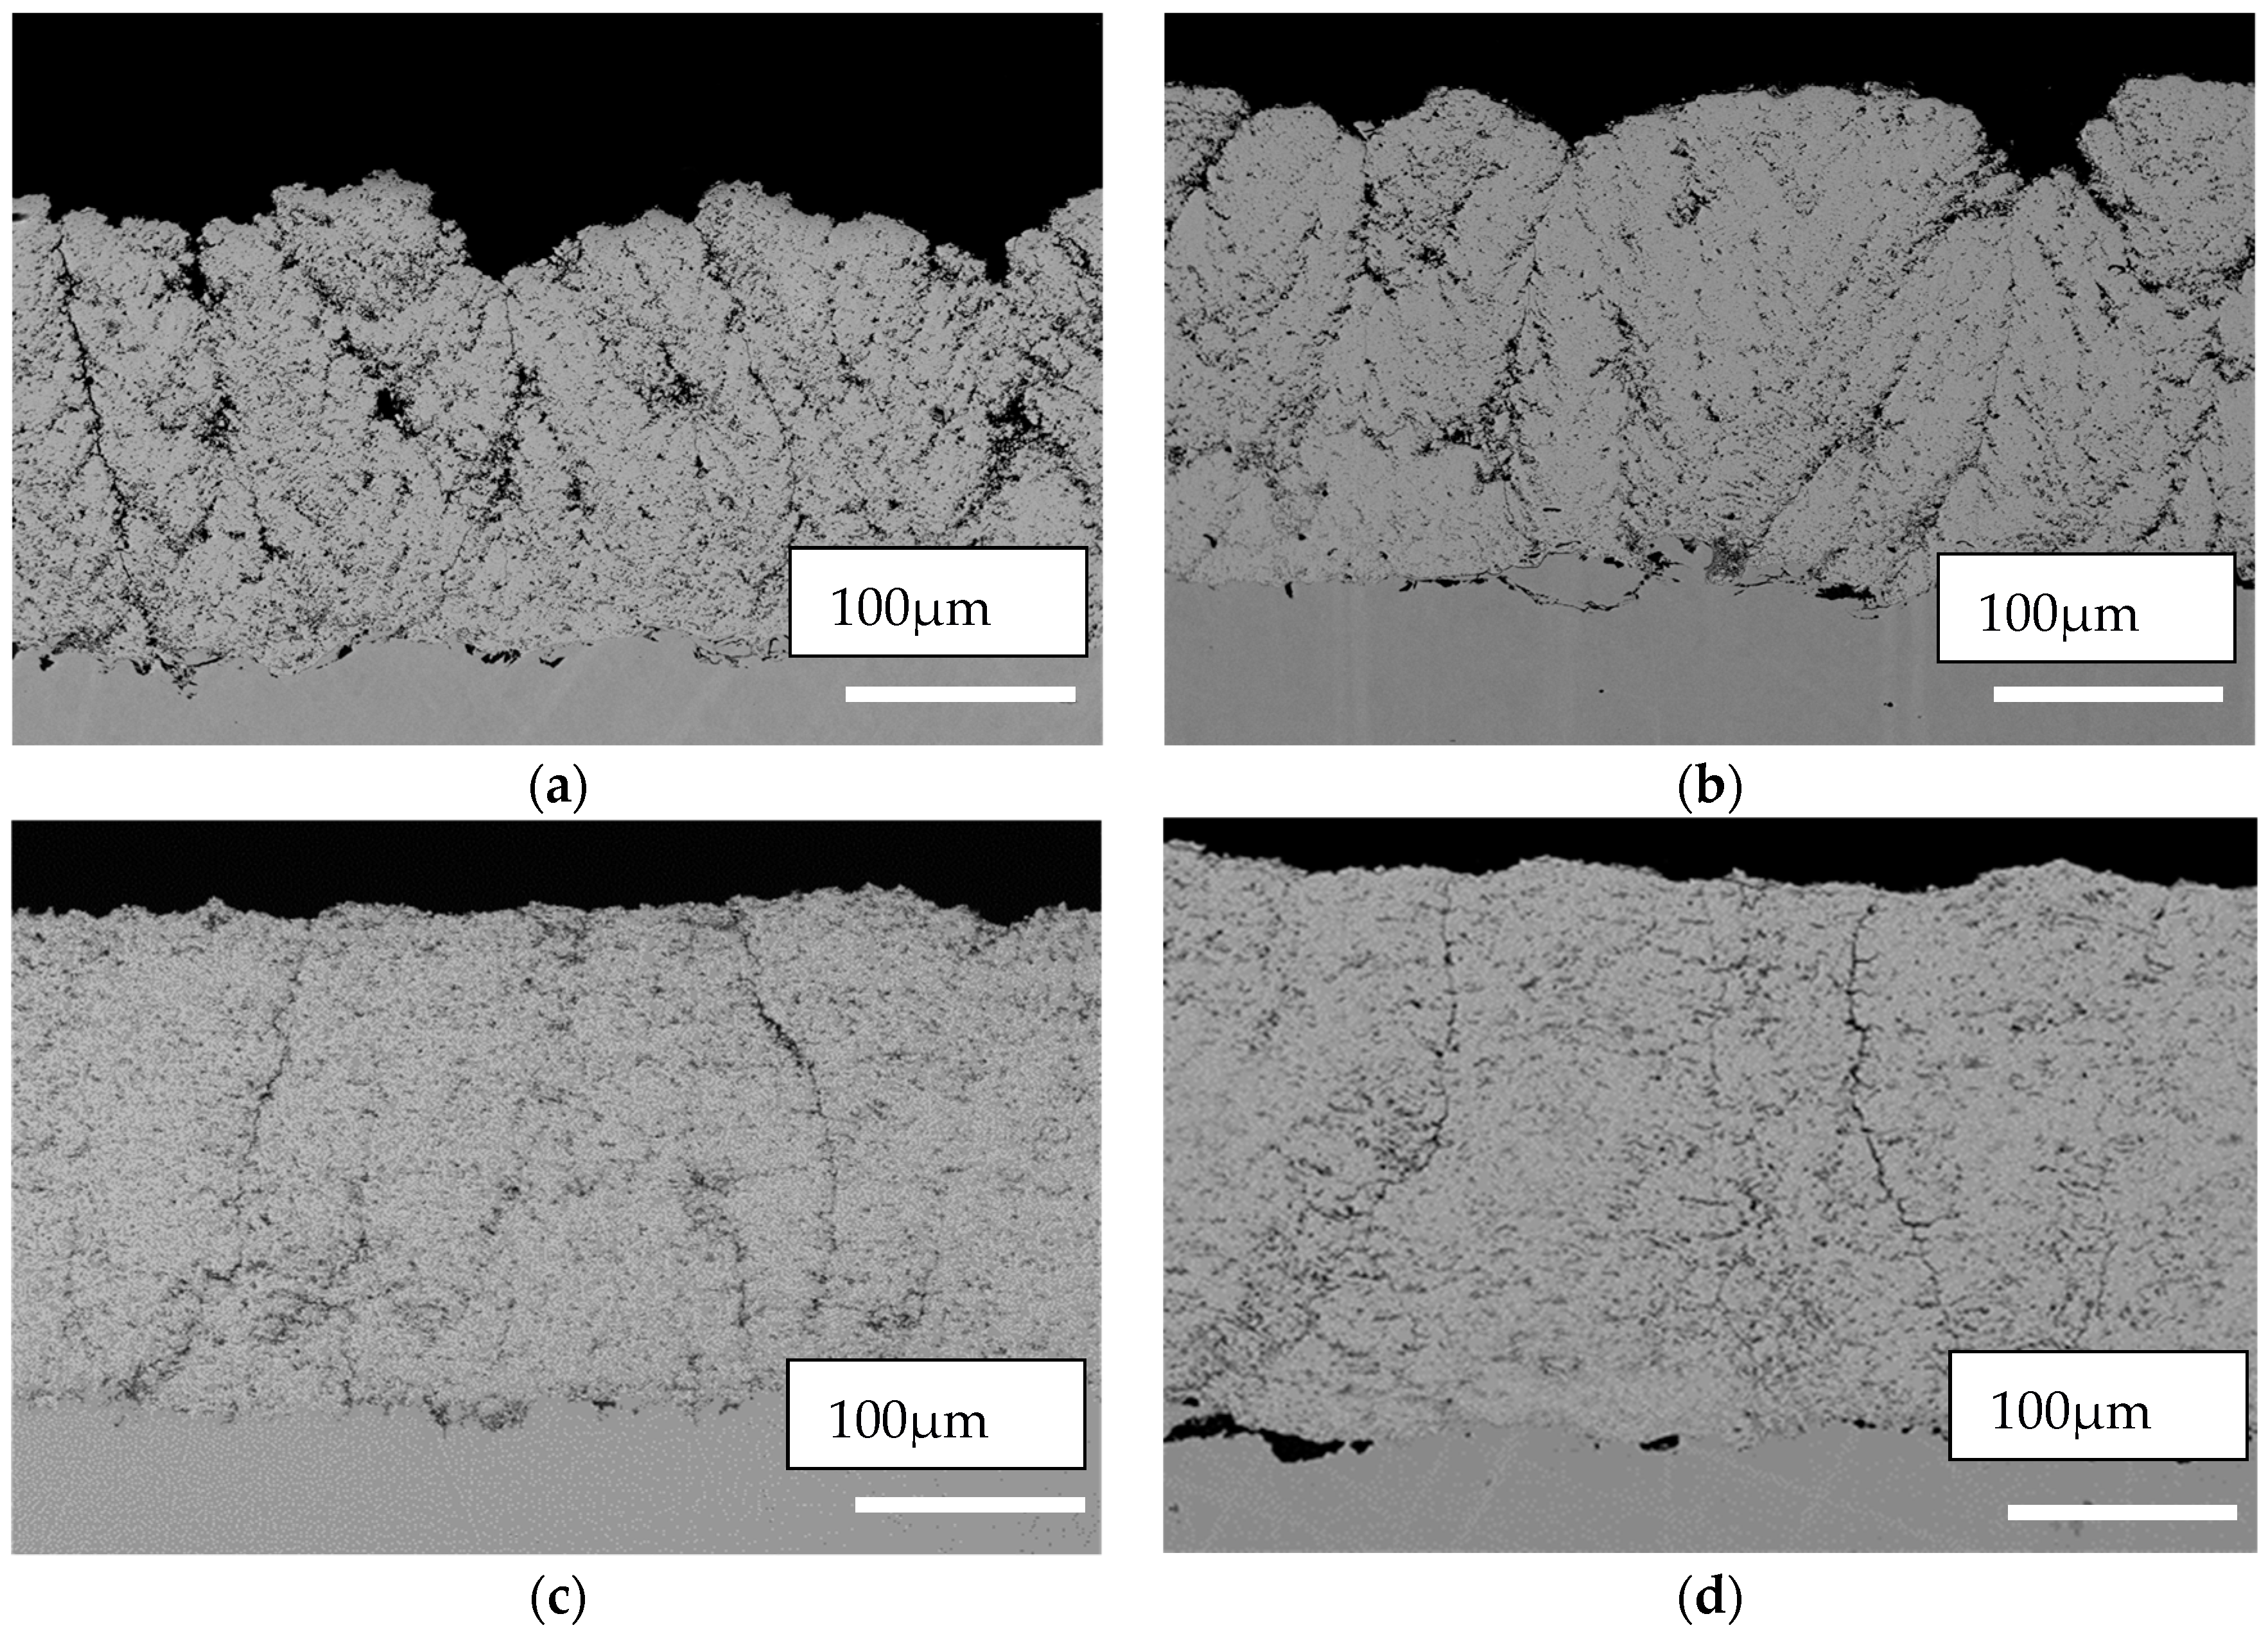
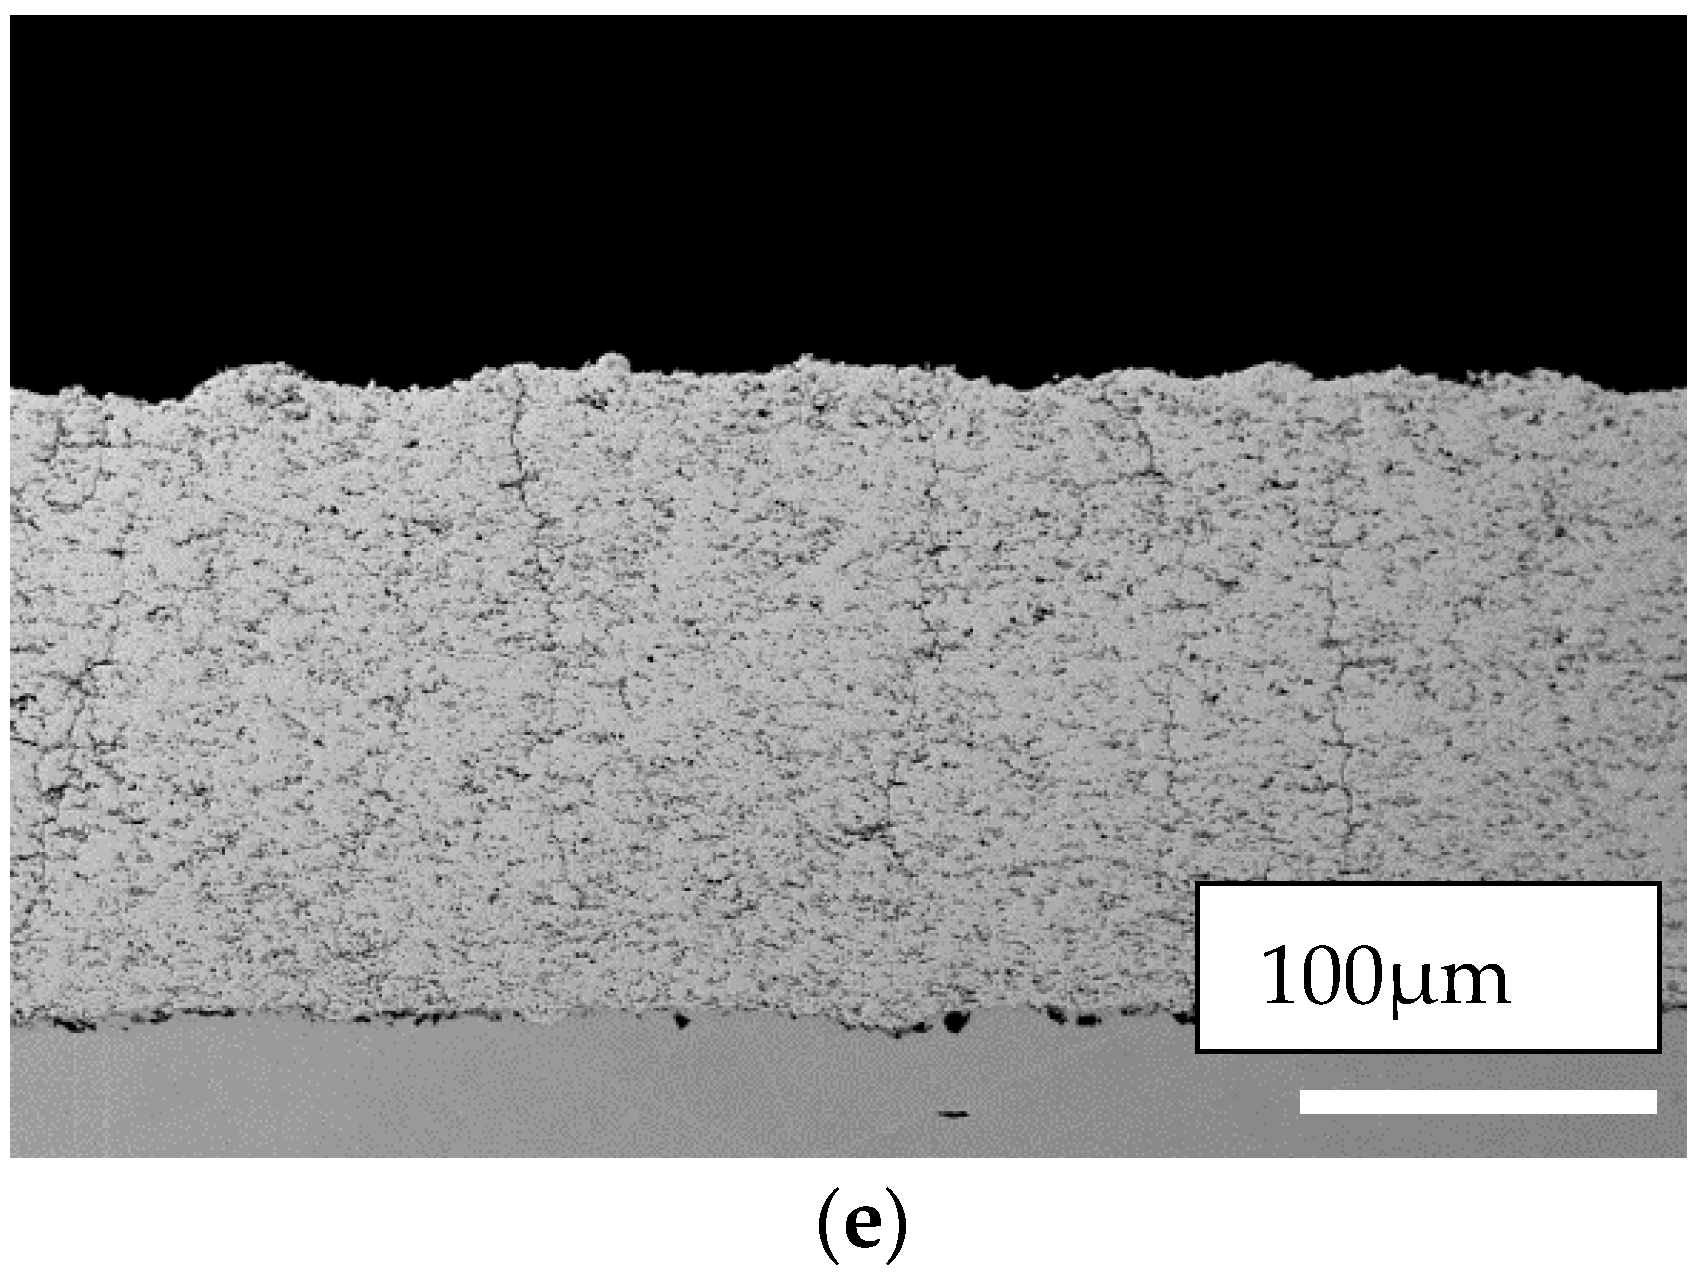
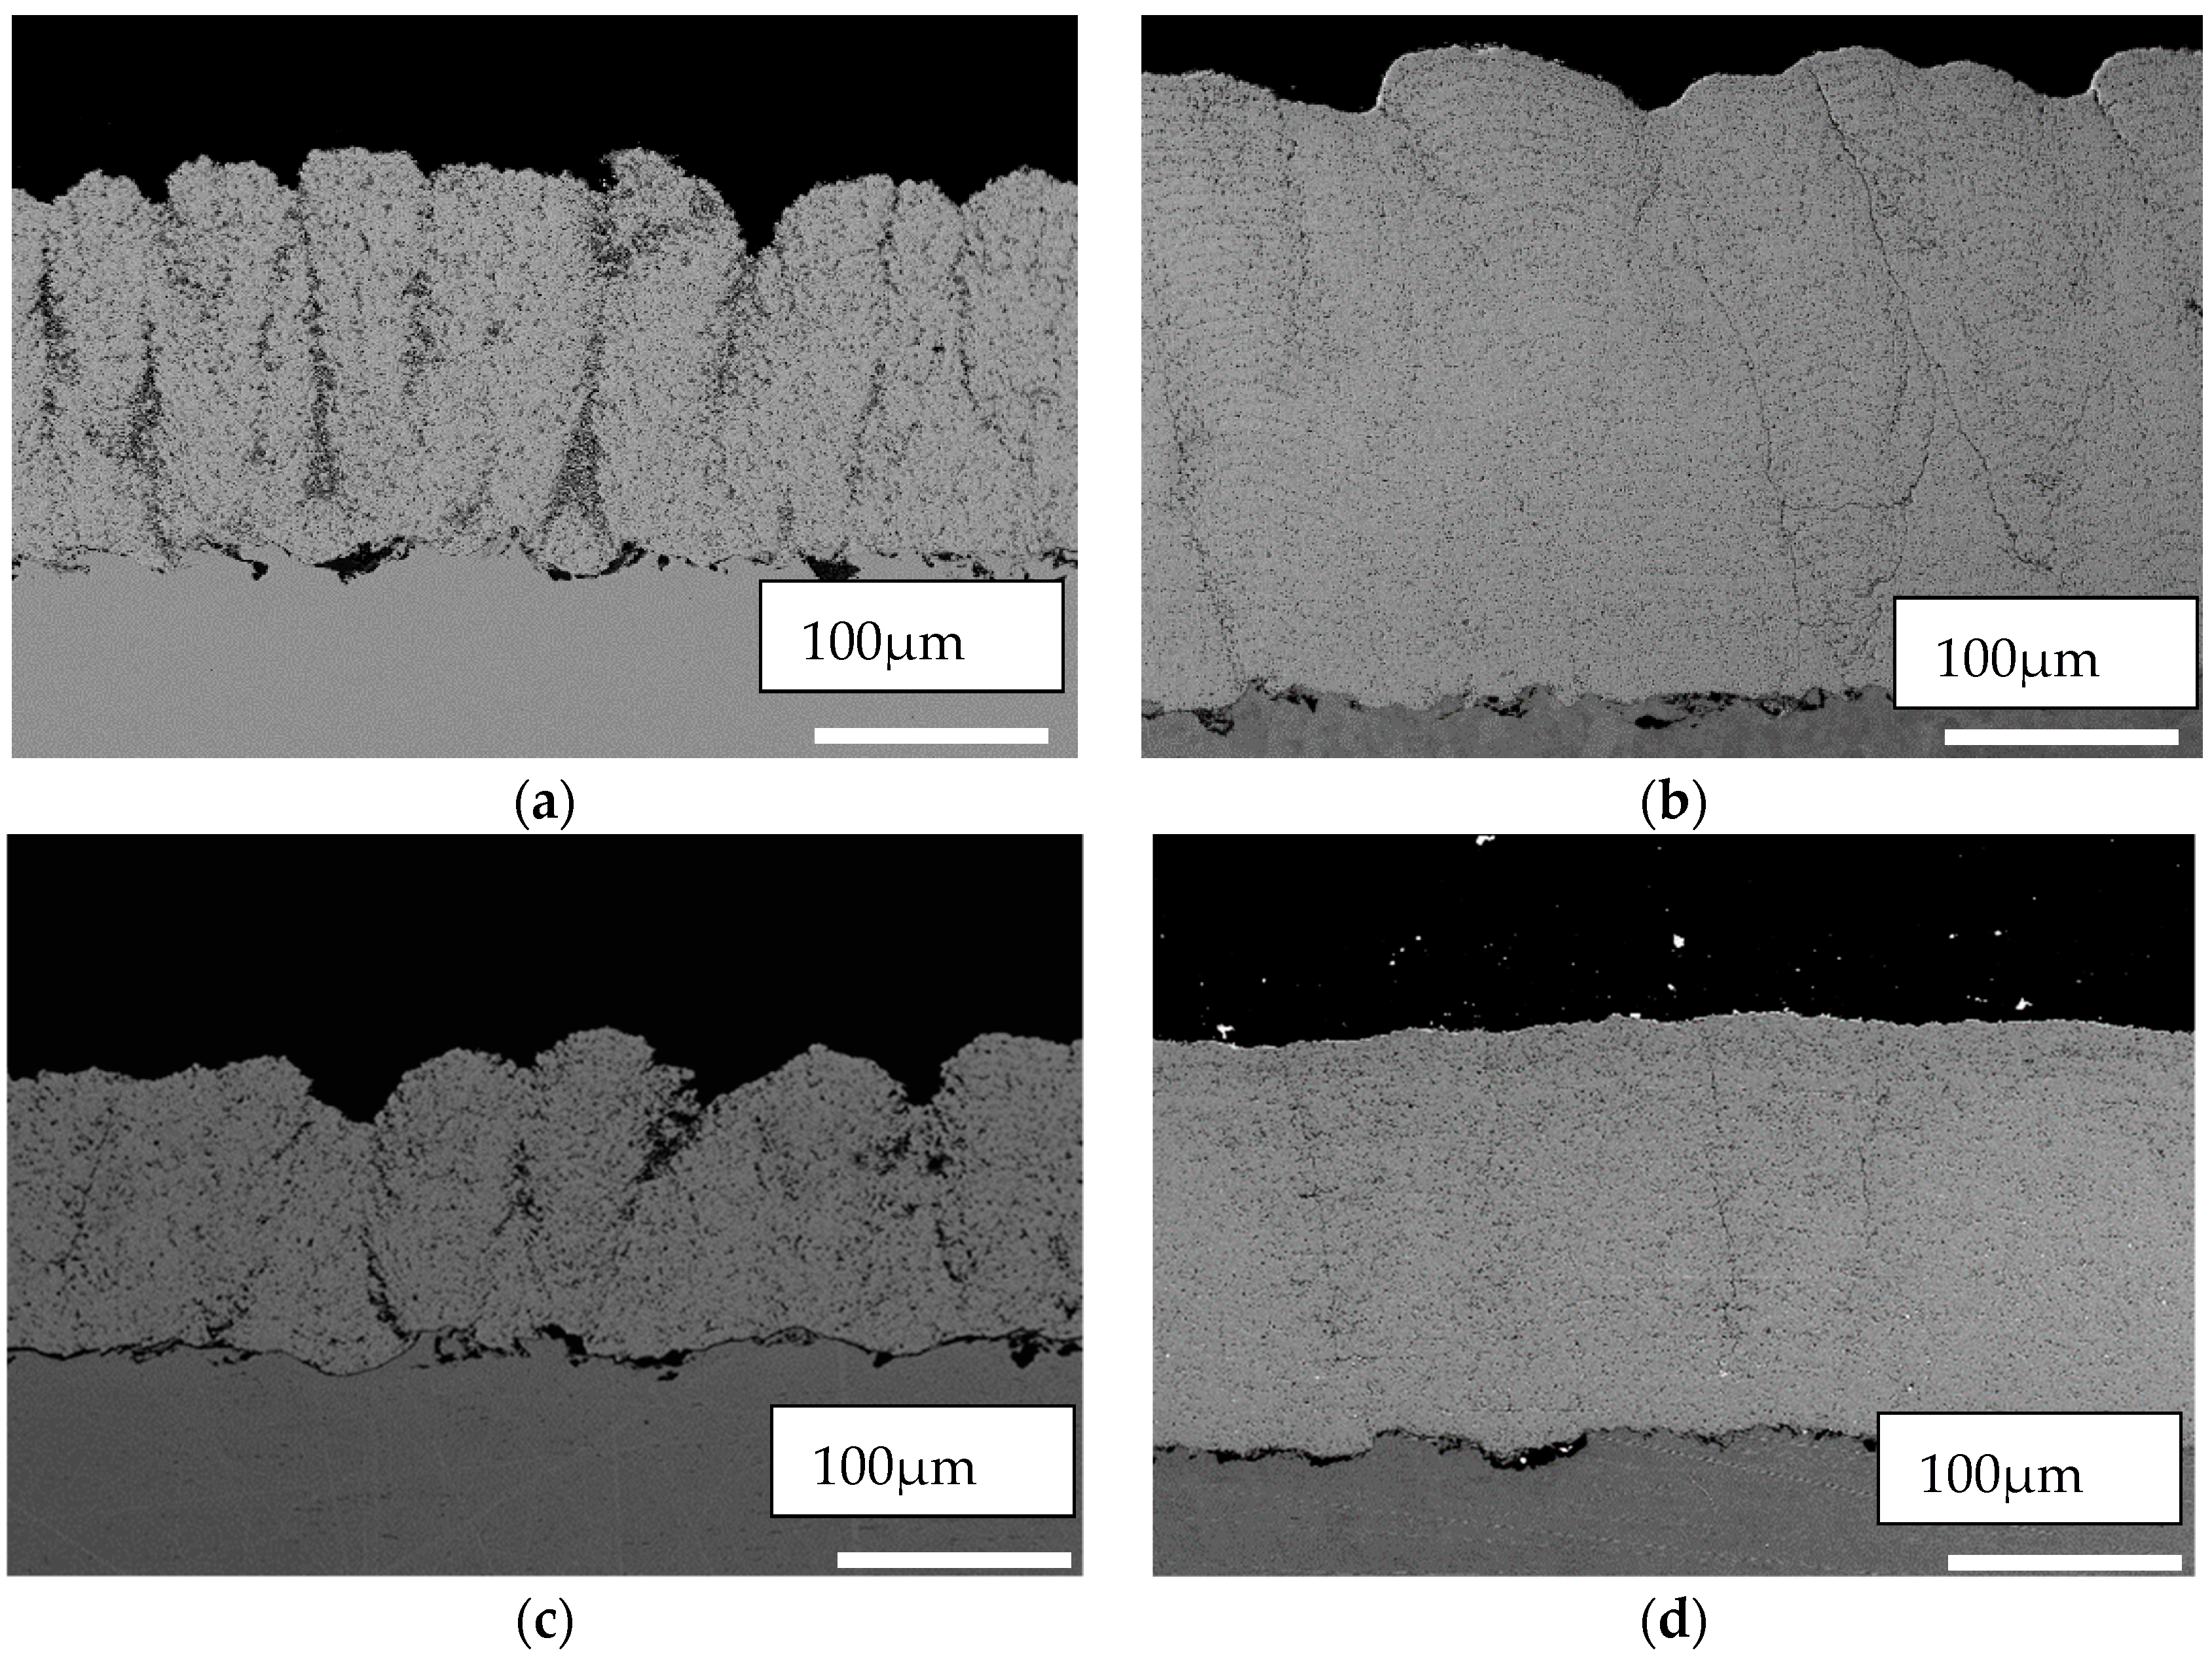
3.2. Coatings Microstructures

The influence of the suspension characteristics on the resulting coating microstructures was evaluated by depositing coatings using two different plasma torches. The microstructures of the coatings that were generated using the radial injection Oerlikon-Metco 3MB torch are shown in Figure 8. Coatings presented in Figure 8a,b, as generated from the two commercial suspensions with similar viscosities and lowest surface tensions, show similar columnar microstructures. In contrast, homemade suspensions HM1 and HM2 with higher viscosities and higher surface tension resulted in clearly denser microstructures, as seen in Figure 8c,d. Additionally, coatings that were produced with suspension C3 (C2 + surfactant) presents a microstructure that is comparable to that found for the homemade suspensions, as shown in Figure 8e. As shown in Figure 7, the viscosity of suspension C3 is higher than C1 and C2. Accordingly, the observed changes of coating microstructures correlate with the viscosity and the surface tension of the different suspensions. The lower viscosity suspensions produced more columnar structures.
This observed relationship can possibly be interpreted in the following manner. During deposition with the 3MB torch, the suspension is radially injected, in which the suspension jet is not atomized before interacting with the plasma jet. Consequently, cross flow atomization occurs when the suspension jet penetrates the high-speed high-temperature plasma flow. In such conditions, it is expected that lower suspension viscosity and surface tension produce smaller size suspension droplets, and thus smaller size of the zirconia molten particles after evaporation of the solvent. The trajectories of smaller particles (with reduced mass) are more easily deviated by the presence of the substrate, and thus the particles impact with shallower angles on the substrate surface. In such case, the shadow effect has more influence on the coating build-up process, resulting in the formation of columnar structures as those that are shown in Figure 8a,b for coatings produced with the commercial suspensions. On contrary, one can expect that higher viscosity and surface tension lead to larger particles and thus the formation of denser coatings, as observed in Figure 8c–e. The clear variation of microstructures thus supports the expected role of the suspension low viscosity and low surface tension on the atomization process and the resulting microstructure when cross flow atomization plays a dominant role.
Figure 9 shows the cross-sections of the coatings that were generated using axial suspension injection into the Axial III Mettech torch. In Figure 9a,b, it can be seen that the two commercial suspensions, C1 and C2, produced coatings with significantly different densities and microstructures, despite having the same viscosity and almost similar surface tension values (18.6 and 17.3 mN/m for C1 and C2, respectively). However, the coating that was produced with the homemade suspension HM2 with higher viscosity and higher surface tension (seen in Figure 9c) shows columnar microstructure similar to that of C1. Finally, suspension C3 (C2 with surfactant) with relatively high viscosity and low surface tension presents a dense microstructure (Figure 9d) mostly similar to the coatings from C2.
As seen in Figure 9, the microstructural changes that were observed with the different suspensions do not correlate in a straightforward manner with the different viscosities and surface tensions of the investigated suspensions in opposition to the results that were observed with the radial injection (Figure 8) and the literature using Axial III torch [22]. In the axial injection torch, the suspension undergoes two successive atomization steps. The first one occurs in the injector that comprises a coaxial flow atomizer. Indeed, the injected suspension is atomized (primary atomization) before entering in the plasma flow. It is important to mention that, if a laminar suspension jet was used (without an air assist atomization as in the radial injection case discussed above), the interaction of this liquid jet with the plasma flow would be very limited, as both of the fluids travel in the same direction, leading to extremely large droplets or ligaments of suspensions that dramatically reduce the deposition efficiency of the spray process. The second atomization step takes place when the injected suspension droplets interact with the high-speed plasma jet inside the torch. This secondary atomization occurs according to the catastrophic regime, where Rayleigh–Taylor and Kelvin–Helmholtz waves (high Weber numbers) play a dominant role in droplet fragmentation [9,15]. Accordingly, it is expected that the role of the suspension characteristics like viscosity and surface tension be different in the axial injection configuration than in the radial one. What is predictable is that the more the droplets are fragmented, the smaller the particle size, and the stronger the tendency to form coatings with porous and columnar structures. In coatings that were sprayed with the axial injection plasma torch, other factors (than the suspension rheological properties) influence the development of different coating structures.
In Figure 3 showing the SEM images of the dried suspensions and the original powders, one can note that the sizes and rounded shapes of the particles in the homemade suspensions and in suspension C1 are very similar. On the other hand, the particles in suspension C2 are roughly 2–3 times larger, mainly presenting angular/faceted shapes. As all spray parameters are almost identical for all suspensions and as their rheological properties do not correlate well with the observed microstructures, one can speculate that the different observed structures are linked with the actual particle size and shape, which may influence the fragmentation behavior of the suspensions as well as the way that particles merge together in flight after the solvent (ethanol) is fully evaporated. These phenomena are not well understood today and it can have a significant influence on the final particle size and speed before impact on the substrate.
Finally, it is worth noting in this context that the powder shape can be an important factor that influences the packing density of the solid particles within the droplets as the solvent gets evaporated. A higher solid packing density may result in larger in-flight molten particles and/or result in thicker molten shells that can break up forming much smaller molten ceramic particles. These phenomena need to be further investigated to develop a more complete understanding of the relationship between the suspension characteristics and the coating attributes.

4. Conclusions

The comparison of the suspensions investigated in this study brought up the following summary of observations:
  • While in the absence of surfactant, an increase in Dv50 that ranges 2–4 times of the original particle size is observed, the surfactant addition preserves the original particle size distribution.
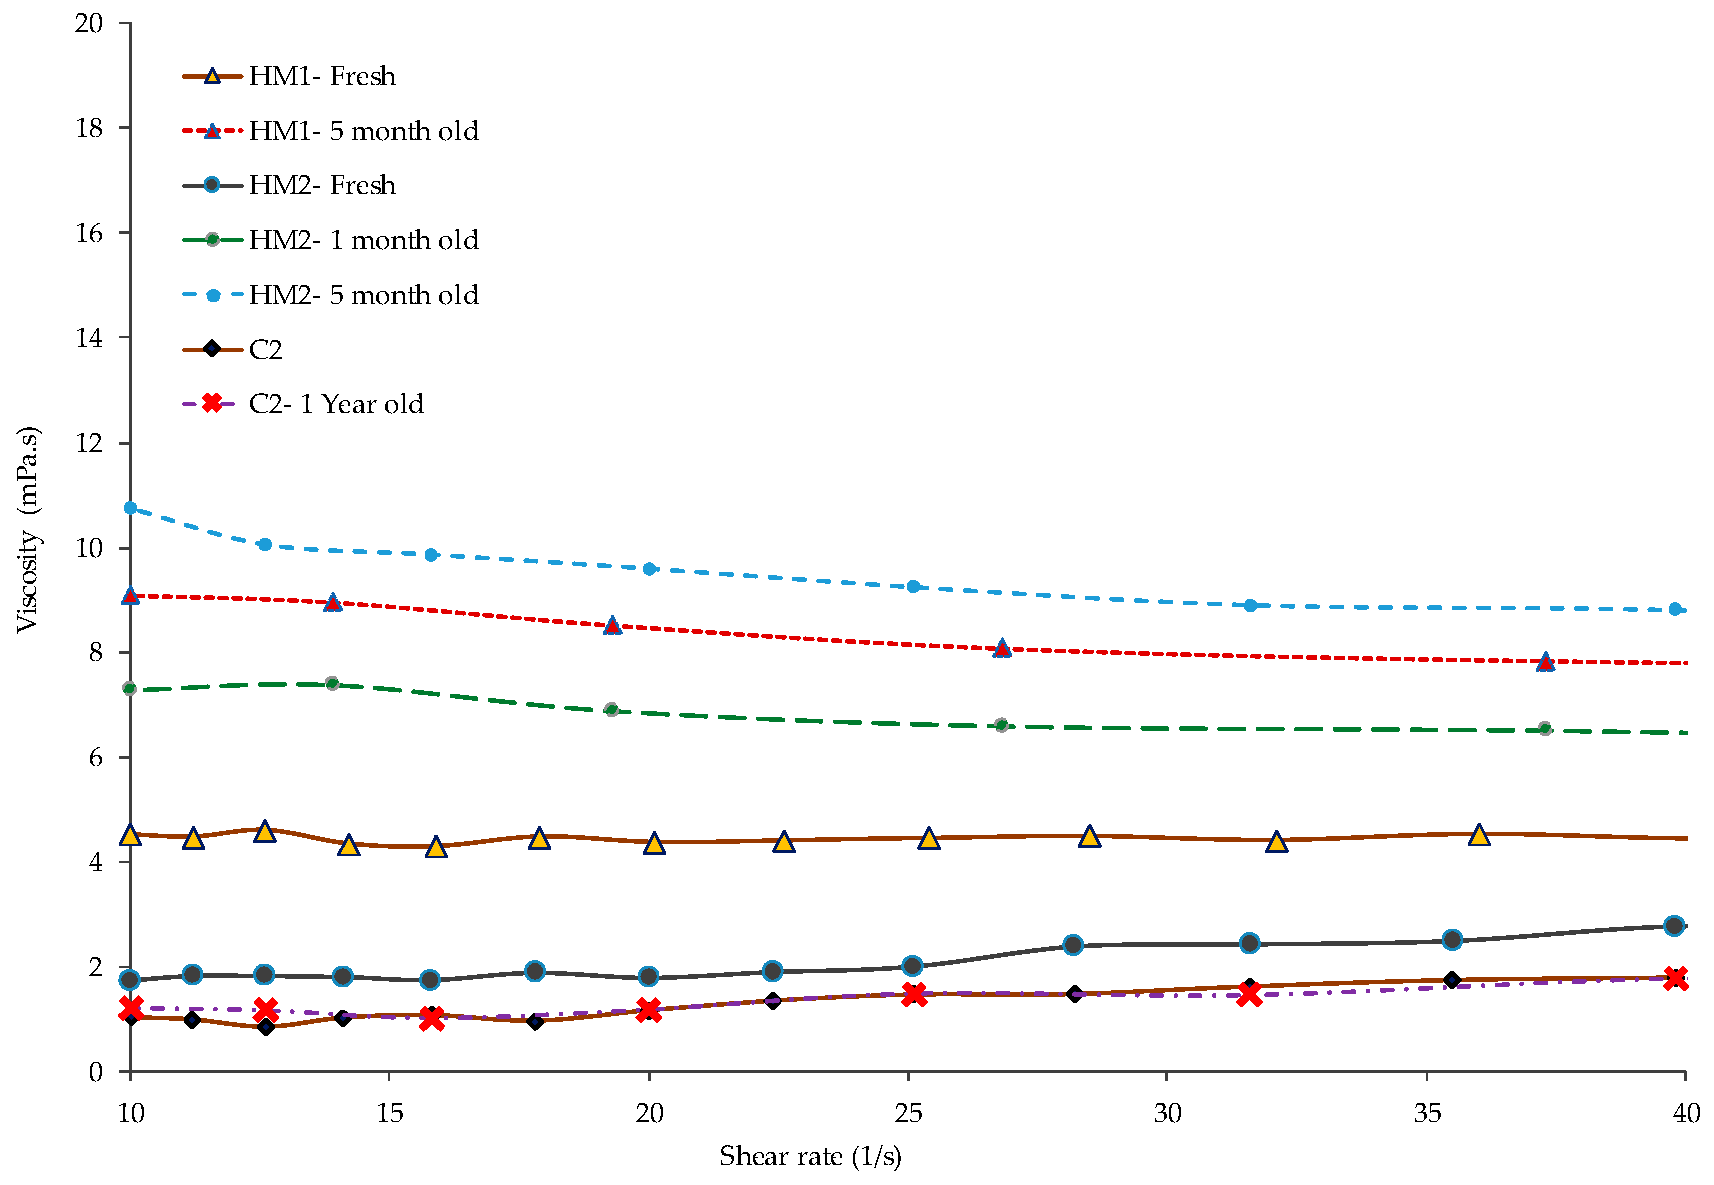
  • Freshly made suspensions (HM) leave more floccules during drying than the commercial ones. Meanwhile, they show higher viscosities than the commercial suspensions. These can play a role on their behavior also during in-flight drying and differentiate them from the commercial suspensions.
  • Surface tension due to addition of up to 5 wt % solid of PVP does not show a large variation.
  • The addition of surfactant even in small quantity clearly increases the viscosity. This influence on viscosity of the liquid carrier (for the present suspensions) is more than that of as high as 25 wt % solid content.
  • Aging of the fresh HM suspensions also increases the viscosity for some time. Subsequently, it reduces the viscosity after a longer time, which is probably due to more time for better wetting.
  • Radial injection (no atomization during injection- cross flow atomization in plasma plum) showed a similar coating structure for the two commercial suspensions with similar viscosities and surface tension values. However, denser structures were formed using the HM suspensions with higher viscosities and surface tensions.
  • Axial injection (atomized injection- coaxial flow atomization) showed great difference in the microstructure of the coatings from two commercial suspensions, despite similar viscosities and surface tensions. However, that of HM shows greater similarity to the commercial suspension with similar particle shape and size.
  • Commercial suspensions allow for the manipulation of microstructure, while using small amendment of the formula.
To conclude, the commercial suspensions that were prepared in the industrial scale and with optimized procedures seem to show more stability and provide reproducibility in the coatings. In addition, the manipulation of microstructures is always possible. An interesting distinction in the behaviors of suspensions with a variation in particle shape (and a small size change) is observed when the axial injection in the axial III torch was used. The reasons for varying the role of the suspension viscosity and surface tension in the case of radial and axial injection, as observed here, as well as the potential role of the particle shape (and less probably small particle size change) on a significant change of the microstructure remain as the matter of detailed droplet and in-flight collected particles investigation. Therefore, the exact reason for this difference remains the matter of further investigation.

Author Contributions

Conceptualization, C.M.; Data Curation, F.T. and E.A.; Formal Analysis, F.T., E.A., A.D., C.M.; Funding Acquisition, C.M.; Investigation, F.T. and E.A.; Methodology, F.T.; Resources, C.M.; Writing–Original Draft Preparation, F.T.; Writing–Review & Editing, F.T., A.D. and C.M.

Funding

This research was funded by the NSERC Canada Research Chairs Program.

Acknowledgments

The authors would like to thank Mehdi Jadidi for his valuable input in the analysis of the results, Fadhel Ben Ettouil for his held in the deposition of the SPS coatings and Swanand Khanwelkar and Masiar Rahman for their help during the experiments. This research was undertaken thanks to funding from the Canada Research Chairs Program.

Conflicts of Interest

The authors declare no conflict of interest.

References

  1. Markocsan, N.; Gupta, M.; Joshi, S.; Nylén, P.; Li, X.; Wigren, J. Liquid feedstock plasma spraying: An emerging process for advanced thermal barrier coatings. J. Therm. Spray Technol. 2017, 26, 1104–1114. [Google Scholar] [CrossRef]
  2. Ucasz, M.T. Thermal Barrier Coating Repair. U.S. Patent Application US20160281204A1, 29 September 2016. [Google Scholar]
  3. Gupta, M.; Dwivedi, G.; Nylén, P.; Vackel, A.; Sampath, S. An experimental study of microstructure-property relationships in thermal barrier coatings. J. Therm. Spray Technol. 2013, 22, 659–670. [Google Scholar] [CrossRef]
  4. VanEvery, K.; Krane, M.J.M.; Trice, R.W. Parametric study of suspension plasma spray processing parameters on coating microstructures manufactured from nanoscale yttria-stabilized zirconia. Surf. Coat. Technol. 2012, 206, 2464–2473. [Google Scholar] [CrossRef]
  5. Meillot, E.; Vert, R.; Caruyer, C.; Damiani, D.; Vardelle, M. Manufacturing nanostructured YSZ coatings by suspension plasma spraying (SPS): Effect of injection parameters. J. Phys. D 2011, 44, 194008. [Google Scholar] [CrossRef]
  6. VanEvery, K.; Krane, M.J.M.; Trice, R.W.; Wang, H.; Porter, W.; Besser, M.; Sordelet, D.; Ilavsky, J.; Almer, J. Column formation in suspension plasma-sprayed coatings and resultant thermal properties. J. Therm. Spray Technol. 2011, 20, 817–828. [Google Scholar] [CrossRef]
  7. Pourang, K.; Moreau, C.; Dolatabadi, A. Effect of substrate and its shape on in-flight particle characteristics in suspension plasma spraying. J. Therm. Spray Technol. 2016, 25, 44–54. [Google Scholar] [CrossRef]
  8. Oberste Berghaus, J.; Bouaricha, S.; Legoux, J.-G.; Moreau, C. Injection conditions and in-flight particle states in suspension plasma spraying of alumina and zirconia nano-ceramics. In Proceedings of the International Thermal Spray Conference, Basel, Switzerland, 2–4 May 2005; pp. 512–518. [Google Scholar]
  9. Fauchais, P.; Rat, V.; Coudert, J.-F.; Etchart-Salas, R.; Montavon, G. Operating parameters for suspension and solution plasma-spray coatings. Surf. Coat. Tech. 2008, 202, 4309–4317. [Google Scholar] [CrossRef]
  10. Fauchais, P.; Montavon, G.; Lima, R.S.; Marple, B.R. Engineering a new class of thermal spray nano-based microstructures from agglomerated nanostructured particles, suspensions and solutions: An invited review. J. Phys. D 2011, 44, 093001. [Google Scholar] [CrossRef]
  11. Fauchais, P.; Vardelle, M.; Vardelle, A.; Goutier, S. What do we know, what are the current limitations of suspension plasma spraying? J. Therm. Spray Technol. 2015, 24, 1120–1129. [Google Scholar] [CrossRef]
  12. Fazilleau, J.; Delbos, C.; Rat, V.; Coudert, J.F.; Fauchais, P.; Pateyron, B. Phenomena involved in suspension plasma spraying part 1: Suspension injection and behavior. Plasma Chem. Plasma Process. 2006, 26, 371–391. [Google Scholar] [CrossRef]
  13. Handscomb, C.S.; Kraft, M.; Bayly, A.E. A new model for the drying of droplets containing suspended solids after shell formation. Chem. Eng. Sci. 2009, 64, 228–246. [Google Scholar] [CrossRef] [Green Version]
  14. Chen, D.; Jordan, E.H.; Gell, M. Effect of solution concentration on splat formation and coating microstructure using the solution precursor plasma spray process. Surf. Coat. Technol. 2008, 202, 2132–2138. [Google Scholar] [CrossRef]
  15. Jabbari, F.; Jadidi, M.; Wuthrich, R.; Dolatabadi, A. A numerical study of suspension injection in plasma-spraying process. J. Therm. Spray Technol. 2014, 23, 3–13. [Google Scholar] [CrossRef]
  16. Jadidi, M.; Mousavi, M.; Moghtadernejad, S.; Dolatabadi, A. A three-dimensional analysis of the suspension plasma spray impinging on a flat substrate. J. Therm. Spray Technol. 2015, 24, 11–23. [Google Scholar] [CrossRef]
  17. Lasheras, J.C.; Hopfinger, E.J. Liquid jet instability and atomization in a coaxial gas stream. Ann. Rev. Fluid Mech. 2000, 32, 275–308. [Google Scholar] [CrossRef]
  18. Berry, J.D.; Neeson, M.J.; Dagastine, R.R.; Chan, D.Y.C.; Tabor, R.F. Measurement of surface and interfacial tension using pendant drop tensiometry. J. Colloid Interface Sci. 2015, 454, 226–237. [Google Scholar] [CrossRef] [PubMed]
  19. Preecha, P.; Wanless, E.J.; Arquero, O.-A.; Franks, G.V. The effect of ionic surfactant adsorption on the rheology of ceramic glaze suspensions. J. Am. Ceram. Soc. 2005, 88, 540–546. [Google Scholar]
  20. Sato, T.; Kohnosu, S. Effect of surfactant on rheological properties of aqueous titanium dioxide suspensions. J. Colloid Interface Sci. 1992, 152, 543–547. [Google Scholar] [CrossRef]
  21. Galindo-Rosales, F.; Rubio-Hernández, F.J.; Velázquez-Navarro, J.F. Shear-thickening behavior of Aerosil® R816 nanoparticles suspensions in polar organic liquids. Rheologica Acta 2009, 48, 699–708. [Google Scholar] [CrossRef]
  22. Ganvira, A.; Filomena Calinas, R.; Markocsan, N.; Curry, N.; Joshi, S. Experimental visualization of microstructure evolution during suspension plasma spraying of thermal barrier coatings. J. Eur. Ceram. Soc. 2019, 39, 470–481. [Google Scholar] [CrossRef]
Figure 1. Setup for surface tension measurement.
Coatings 09 00188 g001
Figure 2. Dried suspensions of (a) C1, (b) C2, (c) HM1, and (d) HM2.
Coatings 09 00188 g002
Figure 3. High magnification SEM images of the dried suspensions of (a) C1, (b) C2, (c) HM1, and (d) HM2, revealing the original powder particle shapes and sizes.
Coatings 09 00188 g003
Figure 4. Particle size distribution of (a) C1, (b) C2, (c) HM1 and (d) HM2.
Coatings 09 00188 g004
Figure 5. Surface tension of various suspensions.
Coatings 09 00188 g005
Figure 6. Viscosity vs. shear rate for the two homemade (HM) (freshly prepared) and the three commercial suspensions (as received and amended), as well as their respective base liquids.
Coatings 09 00188 g006
Figure 7. Viscosity vs. shear rate of the two homemade suspensions HM1 and HM2 aged for one, three, and five months compared with fresh suspensions.
Coatings 09 00188 g007
Figure 8. Backscattered SEM micrographs of the coatings deposited by radial injection using various suspensions; (a) C1, (b) C2, (c) HM2, (d) HM1, and (e) C3.
Coatings 09 00188 g008aCoatings 09 00188 g008b
Figure 9. Backscattered SEM micrographs of the coatings deposited by axial injection using various suspensions; (a) C1; (b) C2; (c) HM2 and (d) C3.
Coatings 09 00188 g009
Table 1. Formulation of the investigated suspensions.
SupplierSuspension NameFormulation
InnovnanoC125 wt %YSZ in ethanol
TreibacherC225 wt %YSZ in ethanol
Treibacher-amendedC325 wt %YSZ in ethanol + 5 solid wt % PVP
Homemade 1HM125 wt % YSZ + 5 solid wt % PVP in ethanol
Homemade 2HM225 wt %YSZ in ethanol (similar to commercial formula)
Table 2. Spray conditions using 3MB torch with radial injection and no prior suspension atomization.
Sample NumberSuspension NamePlasma Gas (L/min)Gas Pressure (psi)Current (A)Feed Rate (mL/min) (Set = 20)Robot Speed (m/s)Spray Distance (mm)Injector Diameter (µm)Number of Passes
1C1Ar + He (25,25)6060019–2013015069
2C221–2380
3C320–2380
4HM120–2480
5HM222–2480
Table 3. Spray conditions using Axial III with axial injection and atomization.
Sample #Suspension NameAtomizing Gas (N2) (L/min)Plasma Gases (L/min)Total Gas (l/min)Current (Amp)Feed Rate (mL/min) (Set = 40)Robot Speed (m/s)Spray Sistance (mm)Number of Pass
1C115Ar/N2/H2 (75/10/15)24519032–4815040
2C230
3C330
4HM230
Table 4. Particle size distribution in original powder and in suspensions.
Suspension NameOriginal Powder Size (µm)Particle Size Distribution in the Suspension (µm) (Volume-Based)
D10D50D90
C10.4–0.5 (D50)1.082.144.07
C20.15–0.4, 0.4–0.8, 0.9–1.7 (D10, D50, D90)0.851.632.97
C3Same as C20.240.511.06
HM10.4 (D50)0.150.40.80
HM20.4 (D50)0.451.001.88

