Analyzing Platinum and Palladium Consumption and Demand Forecast in Japan

1
Tokyo University of Science, Noda 278-8510, Japan
2
National Institute of Advanced Industrial Science and Technology, Tsukuba 305-8560, Japan
*
Author to whom correspondence should be addressed.
Resources 2017, 6(4), 61; https://doi.org/10.3390/resources6040061
Submission received: 5 September 2017
/
Revised: 14 October 2017
/
Accepted: 20 October 2017
/
Published: 25 October 2017
(This article belongs to the Special Issue Urban Mining for Resource Supply)
Abstract
:Platinum and palladium are used in small but essential quantities in a variety of advanced industrial sectors. Platinum and palladium are used as catalysts in various industrial sectors, especially in the car industry. However, their sources are typically concentrated in South Africa and Russia, and there are concerns about supply security. In terms of resource security, it is important to verify domestic platinum and palladium consumption trends and future demand. In order to understand the domestic platinum and palladium consumption trends in Japan, we tracked the historical platinum and palladium consumption structures from 2001 to 2013, applying a bottom-up approach, and illustrated recent domestic platinum and palladium flow by using a substance flow analysis. The results showed that catalytic converters (9.1–12.8 t) and jewelry (5.3–15.5 t) for platinum, and catalytic converters (14.2–20.0 t) and dental use (9.5–16.4 t) for palladium, have marked the biggest consumption sectors during 2001–2013, where the total consumption of platinum and palladium have fluctuated by 18.4–31.6 t for platinum and from 33.0–46.3 t for palladium. We also forecasted the demand for each end-use of both up to the year 2025 using multiple regression analysis. Our results suggest that platinum demand could decrease from 18.9 t in 2013 to 11.9 t in 2025 and palladium demand could slightly decrease from 33.0 t in 2013 to 13.8 t in 2025.
1. Introduction
Platinum and palladium are members of the platinum group metals (PGMs) along with rhodium, ruthenium, iridium, and osmium. These shiny, silvery-white metals have similar chemical properties, remarkable resistance to corrosion even at high temperatures, and high catalytic performance. Although annual demand of platinum and palladium in Japan appears to be about 20–40 t and 30–70 t, respectively [1,2,3,4,5,6,7,8,9,10,11,12,13,14,15,16,17,18,19], they are indispensable for many cutting-edge technologies, as well as being popular for jewelry-making. The leading use for them is in catalytic converters, to decrease harmful emissions from automobiles. They are also used as catalysts for bulk-chemical production, petroleum refining, in fuel cells, and in electronic applications such as computer hard disks and thermocouples. They are also used in the medical sector as dental restorative materials [20,21,22].
World resources of PGMs are estimated to total more than 100 million kilograms. The largest reserves are in Bushvel Complex in South Africa. Small quantities are also recovered as a by-product of copper and nickel refining. However, as natural resources, they occur sparsely in the world, mostly only in South Africa, Russia, USA, and Zimbabwe [22]. These sources are at risk due to unstable political situations, labor strikes, accidents, etc. An unexpected downturn in production quantity could trigger supply risk and price upwelling. Strikes in South African PGM companies shorten the supply [23]. In each mining company, labor-management negotiations are carried out from July to August but often workers go on strike due to the breakdown of negotiations. Conflict between labor and management is one factor that influences the supply. In addition, accidents at the mine and shortage of electricity supply in the country may affect a mine’s production activities and these movements will change the price of metals [23,24].
Due to these unstable circumstances, in order to secure the supply it is important to track a quantitative material flow and to clarify consumption trends, followed by forecasting future demand. Here, we aim to show the domestic consumption patterns of platinum and palladium chronologically from 2001 to 2013 by compiling their consumption by end uses. The domestic flows of platinum and palladium in 2013 were determined by using a substance flow analysis (SFA) and we forecasted their demand up to 2025. Consumption in this study was estimated by the amount of those contained in end uses manufactured in Japan, using a bottom-up approach.
2. Substance Flow Analysis (SFA)
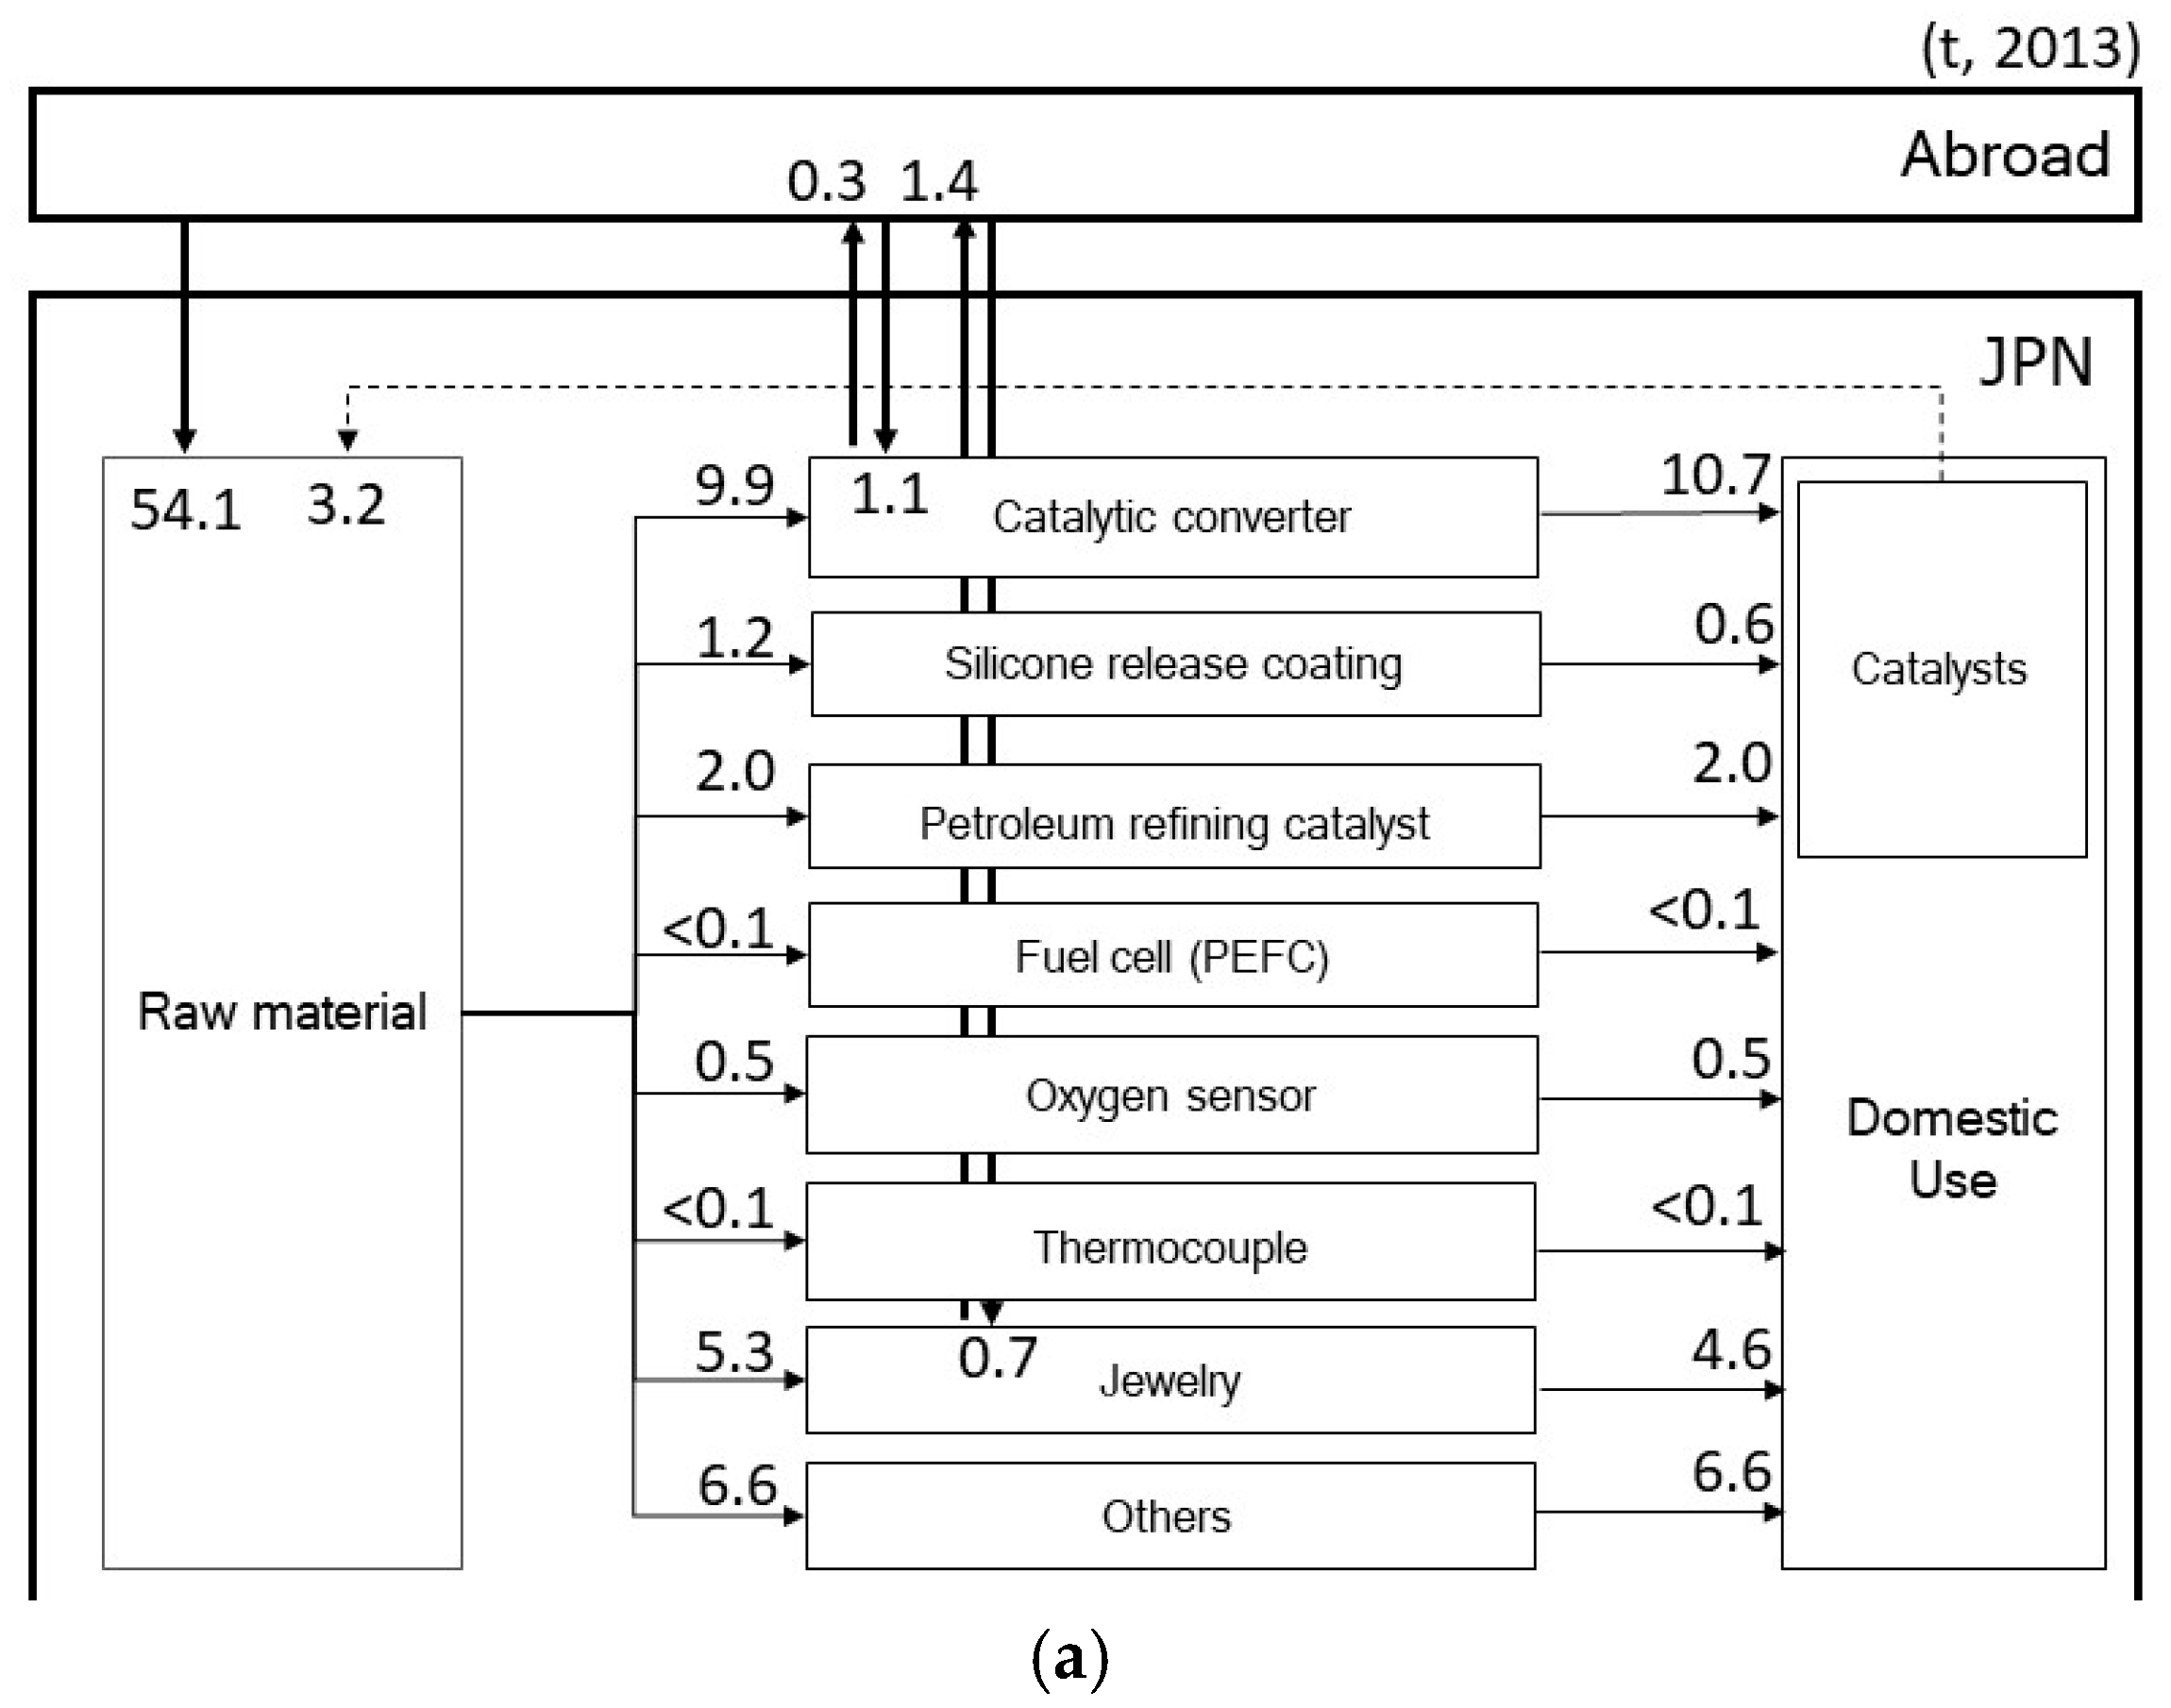
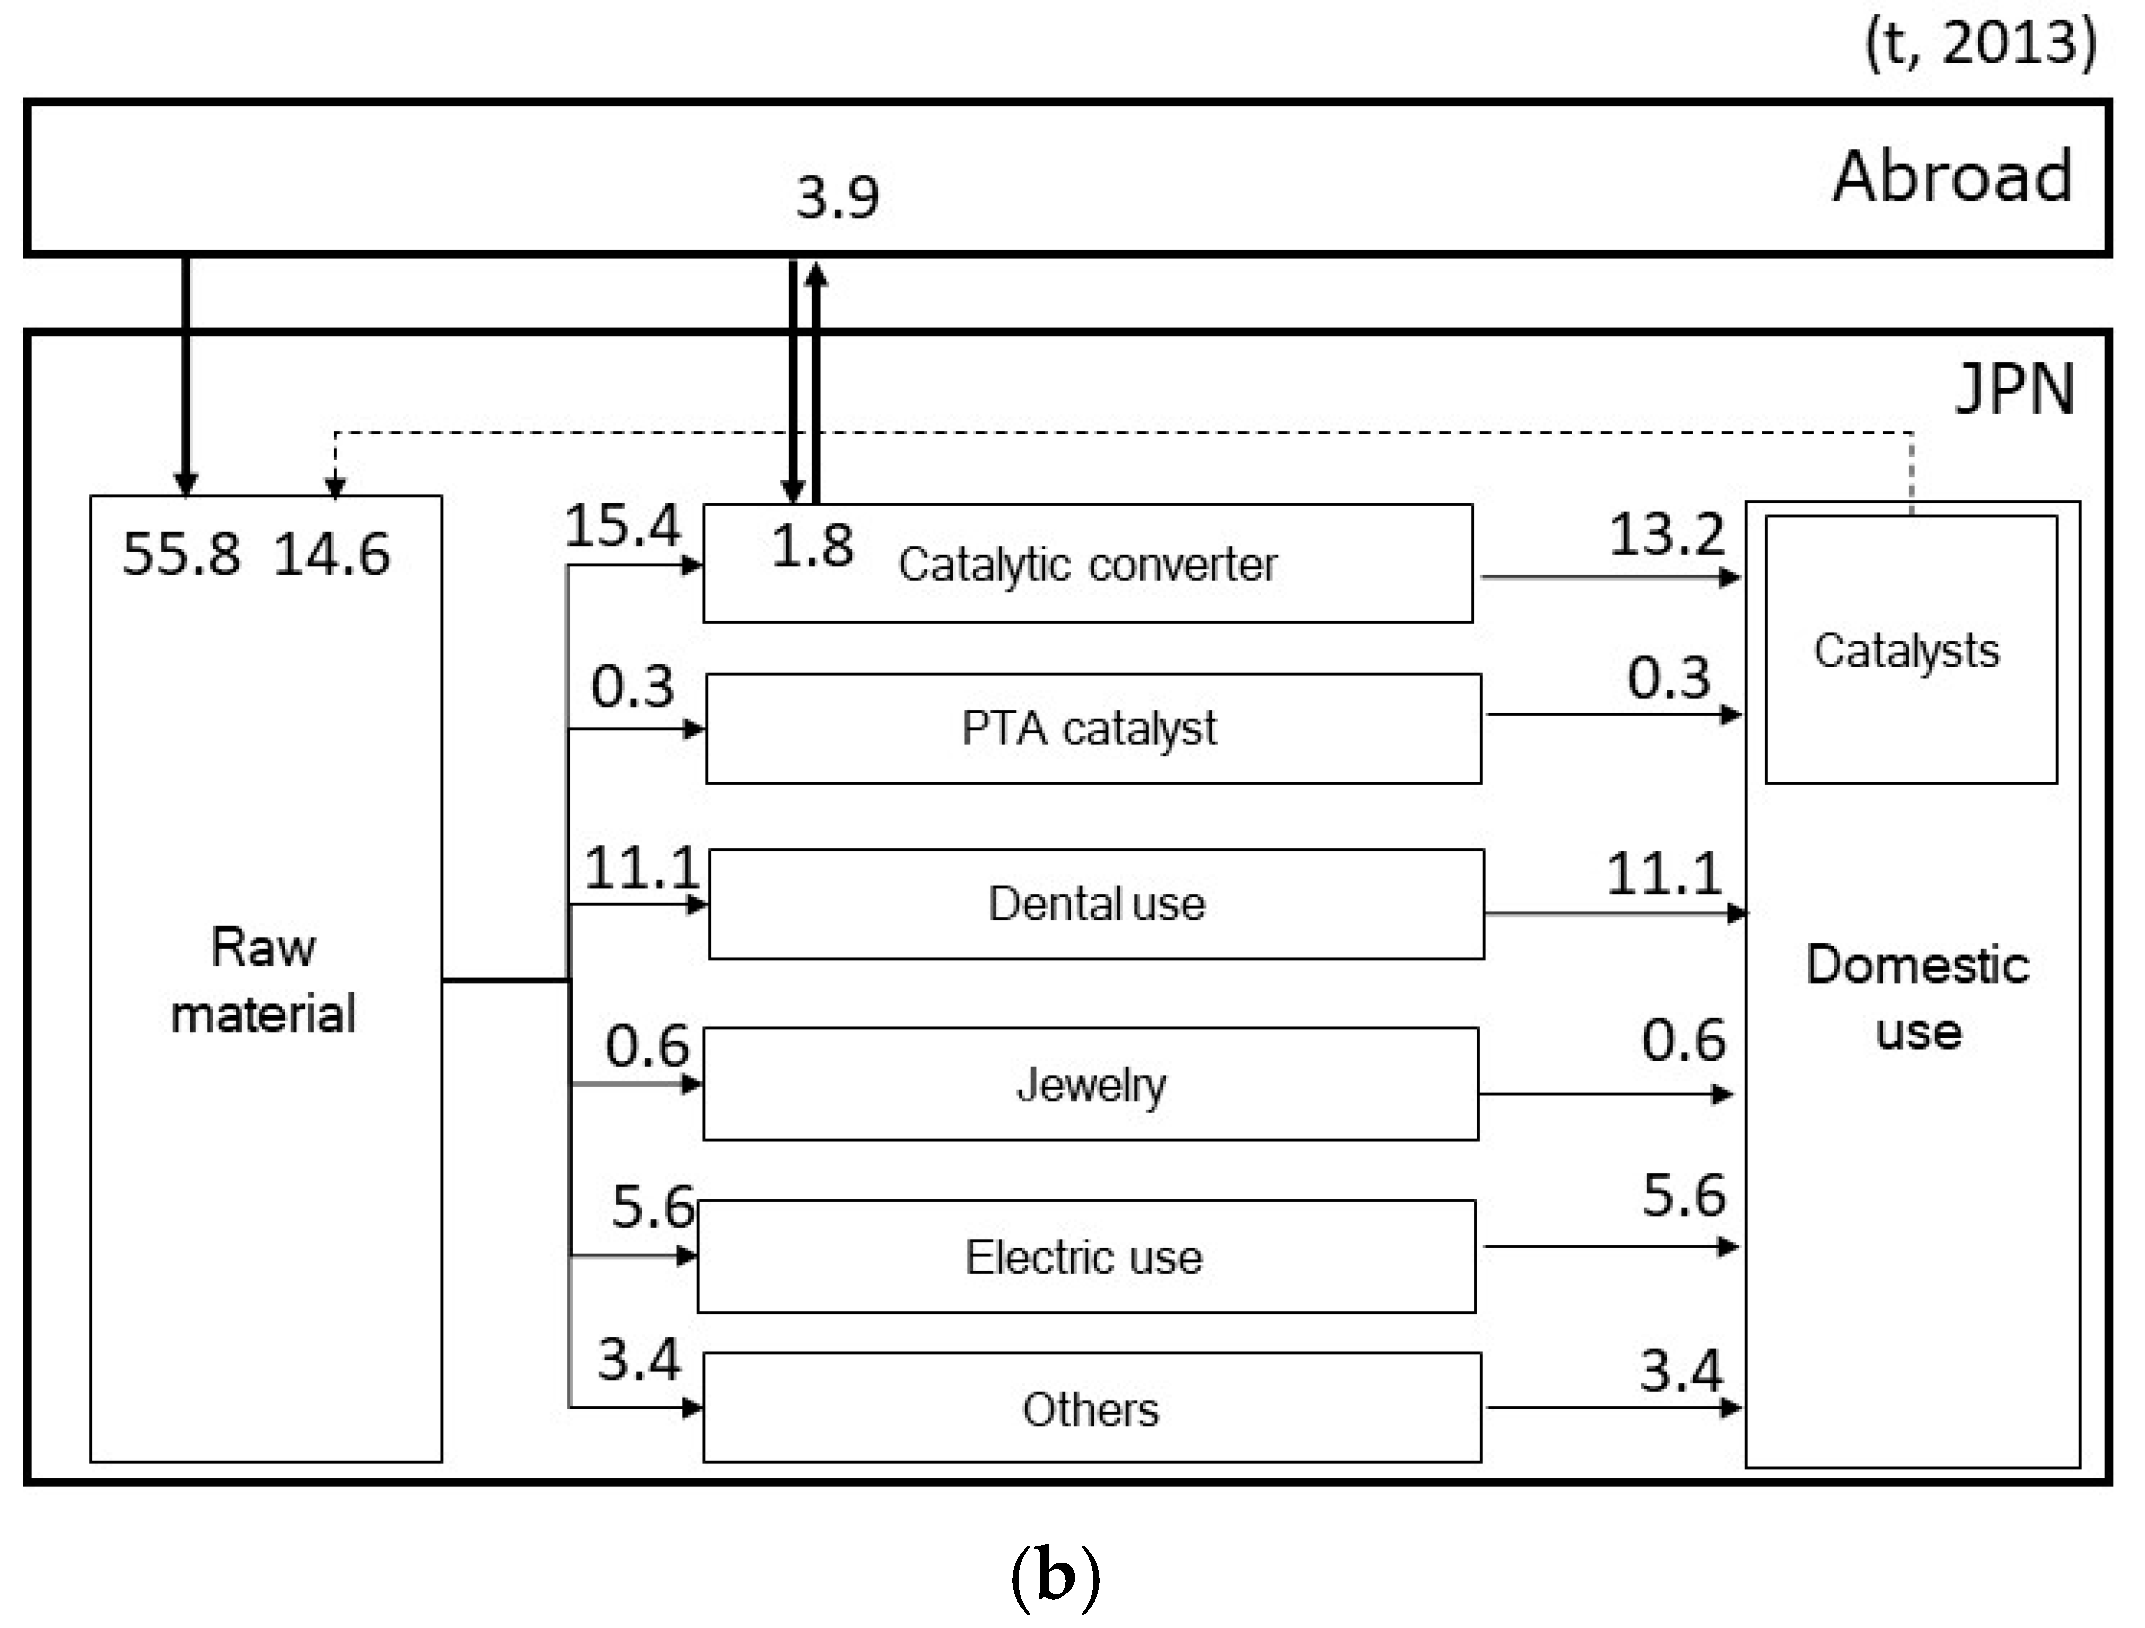
We performed an SFA to illustrate the flows of platinum and palladium in Japan in 2013 (Figure 1). In this study, the domestic flows of each were divided into four stages: (1) import of raw material; (2) fabrication and manufacturing; (3) use; and (4) recycling [25,26,27]. At the import stage, platinum and palladium are imported mainly from South Africa and Russia, according to the trade statistics of Japan [28]. At the fabrication and manufacture stage, they are chemically processed with other compounds or elements and are then ready to be converted into final products. Typical end uses were selected based on their share of historical demand [28,29,30,31,32,33,34,35,36,37,38,39,40,41]. At the use stage, they are newly stocked as end-use products in the system, while some of those go out as exports or come in as imports. At the recycling stage, in Japan, platinum and palladium are collected mostly from catalysts and recycled to raw materials. Quantification is shown as tonnage. A precise description is provided in Figure 1.
2.1. Import of Raw Materials
Japan is highly dependent on imports of raw PGMs materials from South Africa and Russia [42]. They are mostly imported as unprocessed metals, alloys, and scrap. Import volume was collected from the Global Trade Atlas [43] and the trade statistics of Japan [10]. We cross-checked data using two statistics. The concentrations of platinum and palladium in alloys and scrap were assumed to be 30 wt % and 18 wt %, respectively [44].
2.2. Fabrication and Manufacturing
We estimated the material consumption quantity (Cij) in each end-use product (j) in a year (i). End-use products (j) of platinum in this study were picked up for eight sectors: catalytic converter, silicone resin catalyst, petroleum refining catalyst, fuel cell, oxygen sensor, thermoelectric material, jewelry, and others. Those (j) of palladium were picked up for six sectors; catalytic converter, dental use, pure terephthalic acid (PTA) catalyst, electric use, jewelry, and others. Domestic production quantity (Pij) was mostly collected from published statistics from the Ministry of Economy, Trade and Industry (METI) [42] and supplemented by interviews with seventeen major manufacturers. The “others” category of both was estimated by subtracting the sum of the consumption of typical products, estimated in this study, from the total domestic consumption [1,2,3,4,5,6,7,8,9,10,11,12,13,14,15,16,17,18,19]. The proportion of platinum/palladium products in each product type (θij), the ratio of those elements (wt %) per product unit (εij), and the elements’ weight in a unit product (γij) were collected from interviews with seventeen major manufacturers and experts from two universities and two related associations (Table 1, Appendix Table A1). Consumption quantities (Cij) of platinum and palladium catalysts in catalytic converters were estimated using the below Equation (1). Platinum in silicone release coating and petroleum refining catalysts, and palladium in dental use and PTA catalysts were also estimated using Equation (1). Platinum Cij in fuel cells (polymer electrolyte fuel cell, PEFCs), oxygen sensors, and thermoelectric materials were calculated by Equation (2), respectively, which multiplies the element’s weight in a unit product (γij) instead of εij.
2.2.1. Catalytic Converter
A catalytic converter is an emission control device that converts harmful gases to harmless gases by catalyzing a redox reaction. Platinum and palladium are applied to delete hydrocarbons and carbon monoxide. Typical platinum catalytic converters are three-way catalytic converters, diesel oxidation converters (DOCs), and a diesel particulate filter (DPF). Three-way catalytic converters are used in gasoline cars. The others are used in diesel cars. The domestic production of catalytic converters (Pij) was collected from industrial statistics [41]. Platinum content (εij) in those catalysts was averaged to 0.09 wt %, and palladium content was 0.14 wt % according to interviews with Japanese catalyst recovering associations and manufacturers.
2.2.2. Silicone Release Coatings
Silicone release coatings are used primarily as release agents for stickers and labels, and some of those are coated to release films and paper in manufacturing processes. It is produced by hydrosilylation, which is widely used in the silicone industry for the preparation of monomers, containing silicone-carbon bonds, and for crosslinking polymers. Hydrosilylation reactions are catalyzed by platinum catalysts [45]. All catalysts for silicone release coatings contain platinum. Platinum content (εij) ranged from 0.5 to 5 wt %. In this study, we set 2 wt % on average.
2.2.3. Petroleum Refining Catalyst
Platinum catalyzes reforming processes in petroleum refining. They enable the octane rating of naphtha to be greatly increased and are more economical than any other refining process [46]. All petroleum refining catalysts contain platinum. Platinum content (εij) ranged from 0.3 to 0.4 wt %. In this study—we used 0.35 wt %.
2.2.4. Fuel Cell
Platinum is used in cathodes of polymer electrolyte fuel cells (PEFCs). In this study, PEFCs for housing were estimated. PEFCs for car, fuel cell car (FCV), which first released in 2015, were not counted. Platinum weight is determined to power (kW). According to manufacturers, 0.69 g of platinum is used in 1 kW PEFC unit. Therefore, we assumed 0.69 g platinum used in a unit housing use PEFCs (γij), because PEFCs for housing is mostly 1 kW per a unit. The domestic production of PEFCs for housing (Pij) was obtained from government reports [47,48].
2.2.5. Oxygen Sensors
Oxygen sensors form part of the emissions control system in a car, consisting of a sensor and a heater to activate the sensor. All oxygen sensors use platinum. Platinum content differs between different types—the platinum-plated type and the platinum-plague type. For platinum-plated sensors, platinum is used only in the cathodes of the sensor—5 mg per a unit—but not in the heater, which is made of tungsten. For platinum plague sensors, platinum is in both the cathode, at 12.5 mg per unit, and in the heater, at 37.5 mg per a unit, of which platinum totals 50 mg.
In order to estimate platinum use in oxygen sensors, we used car production quantity to estimate domestic oxygen sensor production (Pij) using Equation (2). We assumed that newly produced oxygen sensors should be used in newly produced cars in Japan. Based on the manufacturer interviews, two units of oxygen sensors are used in a car. We calculated 27.5 mg as the unit weight of platinum by using the average content of the above two types. Therefore, 55 mg of platinum (γij) was used for an oxygen sensor in a car.
2.2.6. Thermocouples
Platinum thermocouples are useful in temperature management such as steel, semiconductors and glass manufacturing. There are three different types; R, S, and B. Among those, type R holds the top share in the market, and platinum consumption in type R was chosen to estimate in this study. Thermocouples consist of a plus pole and a minus pole. The weight ratio of PGMs in thermocouples is determined by the Japanese industrial standards committee (JIS); 87 wt % platinum and 13 wt % rhodium for plus pole of R type, 100 wt % platinum for minus pole of R type. Thermocouples’ production (Pij) was collected from governmental statistics [41]. On average, 3.17 g of platinum (γij) was used in a unit thermocouple.
2.2.7. Dental Use
Gold-silver-palladium-silver alloys hold over 90% of shares in the domestic market. The composition of gold-silver-palladium alloy is determined as 12% gold, 40% silver, 20% palladium by Japanese industrial standards (JIS). Alloy production (Pij) was collected from governmental statistics [49].
2.2.8. Pure Terephthalic Acid (PTA) Catalyst
Palladium catalysts is used in the production of purified terephthalic acid (PTA). PTA is a precursor to polyesters and to polyethylene terephthalate (PET). Palladium catalyst production was obtained from industrial statistics, which assumed to 0.3% of petrochemical sector [41]. Palladium content is 0.55 wt % according to manufacturers.
2.3. Use
Domestic use was calculated using import, export, and consumption amounts of platinum. Consumption amounts of platinum and palladium in end-uses (Cij) were added to those in the imported end uses (Imij), and then subtracted from those in the exported end uses (Exij). Platinum and palladium in import/export sectors were estimated using Equations (1) and (2) in the same way as consumption amounts were estimated. The use (Uij) was estimated by using Equation (3), where i is year, j is product, Pij is the platinum and palladium consumption of product j in year i, Imij is the imported platinum and palladium of j in i, and Exij is the exported platinum and palladium of j in i [50].
In this study, we only succeeded in collecting the import/export of catalytic converters from national trade statistics [40] and those of the other sectors were ignored.
2.4. Recycling
Platinum used in factories such as oil refining and in catalysts for silicon production are replaced at the time of deterioration. Catalyst manufacturers recycle and the recycling rate is high. Regarding the recycling of catalytic converters, the converter is removed when the car is scrapped and the catalyst inside is taken out and brought to the recycling company [51]. Recovered platinum and palladium are input as raw materials. We estimated the quantity from recycling catalysts of platinum and palladium [52]. Data includes that from catalysts sectors, which was not discussed at the fabrication and manufacturing stage.
3. Domestic Consumption Trends of Platinum in Japan
We estimated the platinum and palladium flow from the stage of material import to use in Japan in 2013 (Figure 1). 54.1 t of platinum was imported as bullion, plate, powder, etc. mostly from South Africa, USA, and UK. 3.2 t was input to raw material by recovering catalysts sectors. We tracked seven major end-uses of platinum in Japan: catalytic converter (9.9 t), silicone resin catalyst (1.2 t), petroleum refining catalyst (2.0 t), fuel cell (0.05 t), oxygen sensor (0.5 t), thermoelectric material (0.003 t), and jewelry (5.3 t). In total, 18.9 t was used to manufacture those. Others (6.6 t) were assumed by subtracting the sum of consumption of the above seven sectors (18.9 t) from the total consumption compiled by Ministry of economy, trade and industry (METI) (25.5 t) [1,2,3,4,5,6,7,8,9,10,11,12,13,14,15,16,17,18,19] (Figure 1A). 55.8 t of palladium was imported from Russia, UK, etc. 14.6 t was recovered to raw material from catalysts. It was shown that 32.9 t of palladium was consumed by the following sectors: catalytic converter (15.4 t), dental use (11.1 t), PTA catalyst (0.3 t), jewelry (0.6 t), and electric use (5.6 t). Others (3.4 t) were estimated in the same way as for platinum. Jewelry made from platinum and palladium, and the electric use of palladium, were obtained from published data [1,2,3,4,5,6,7,8,9,10,11,12,13,14,15,16,17,18,19]. For the use stage, platinum, catalytic converter and jewelry were able to be estimated in this paper. For catalytic converters, 0.3 t of platinum was exported, 1.1 t imported, and 10.8 t newly stocked in 2013. For jewelry, 1.4 t of platinum was exported, 0.7 t imported, and 4.6 t newly stocked in 2013. Palladium was estimated only for catalytic converters—3.9 t was exported, 1.8 t imported, and 13.2 t newly stocked in the domestic market. It is necessary to note that there were some limitations in estimating import/export due to the shortage of data. Therefore, the import/export of other sectors were ignored when estimating the use stage.
The biggest consumption occurred in the catalytic converter sector—38% of total platinum and 42% of total palladium consumption (Figure 2). The second biggest were jewelry (21%) for platinum, and dental use (31%) of palladium. The other catalytic uses of platinum accounted for below 10%. “Others” made up 28% of total platinum and 9% of total palladium, which may include investment and other chemical uses, such as hard disks, ceramic condensers, etc.
4. Historical Consumption and Demand Forecast of Platinum
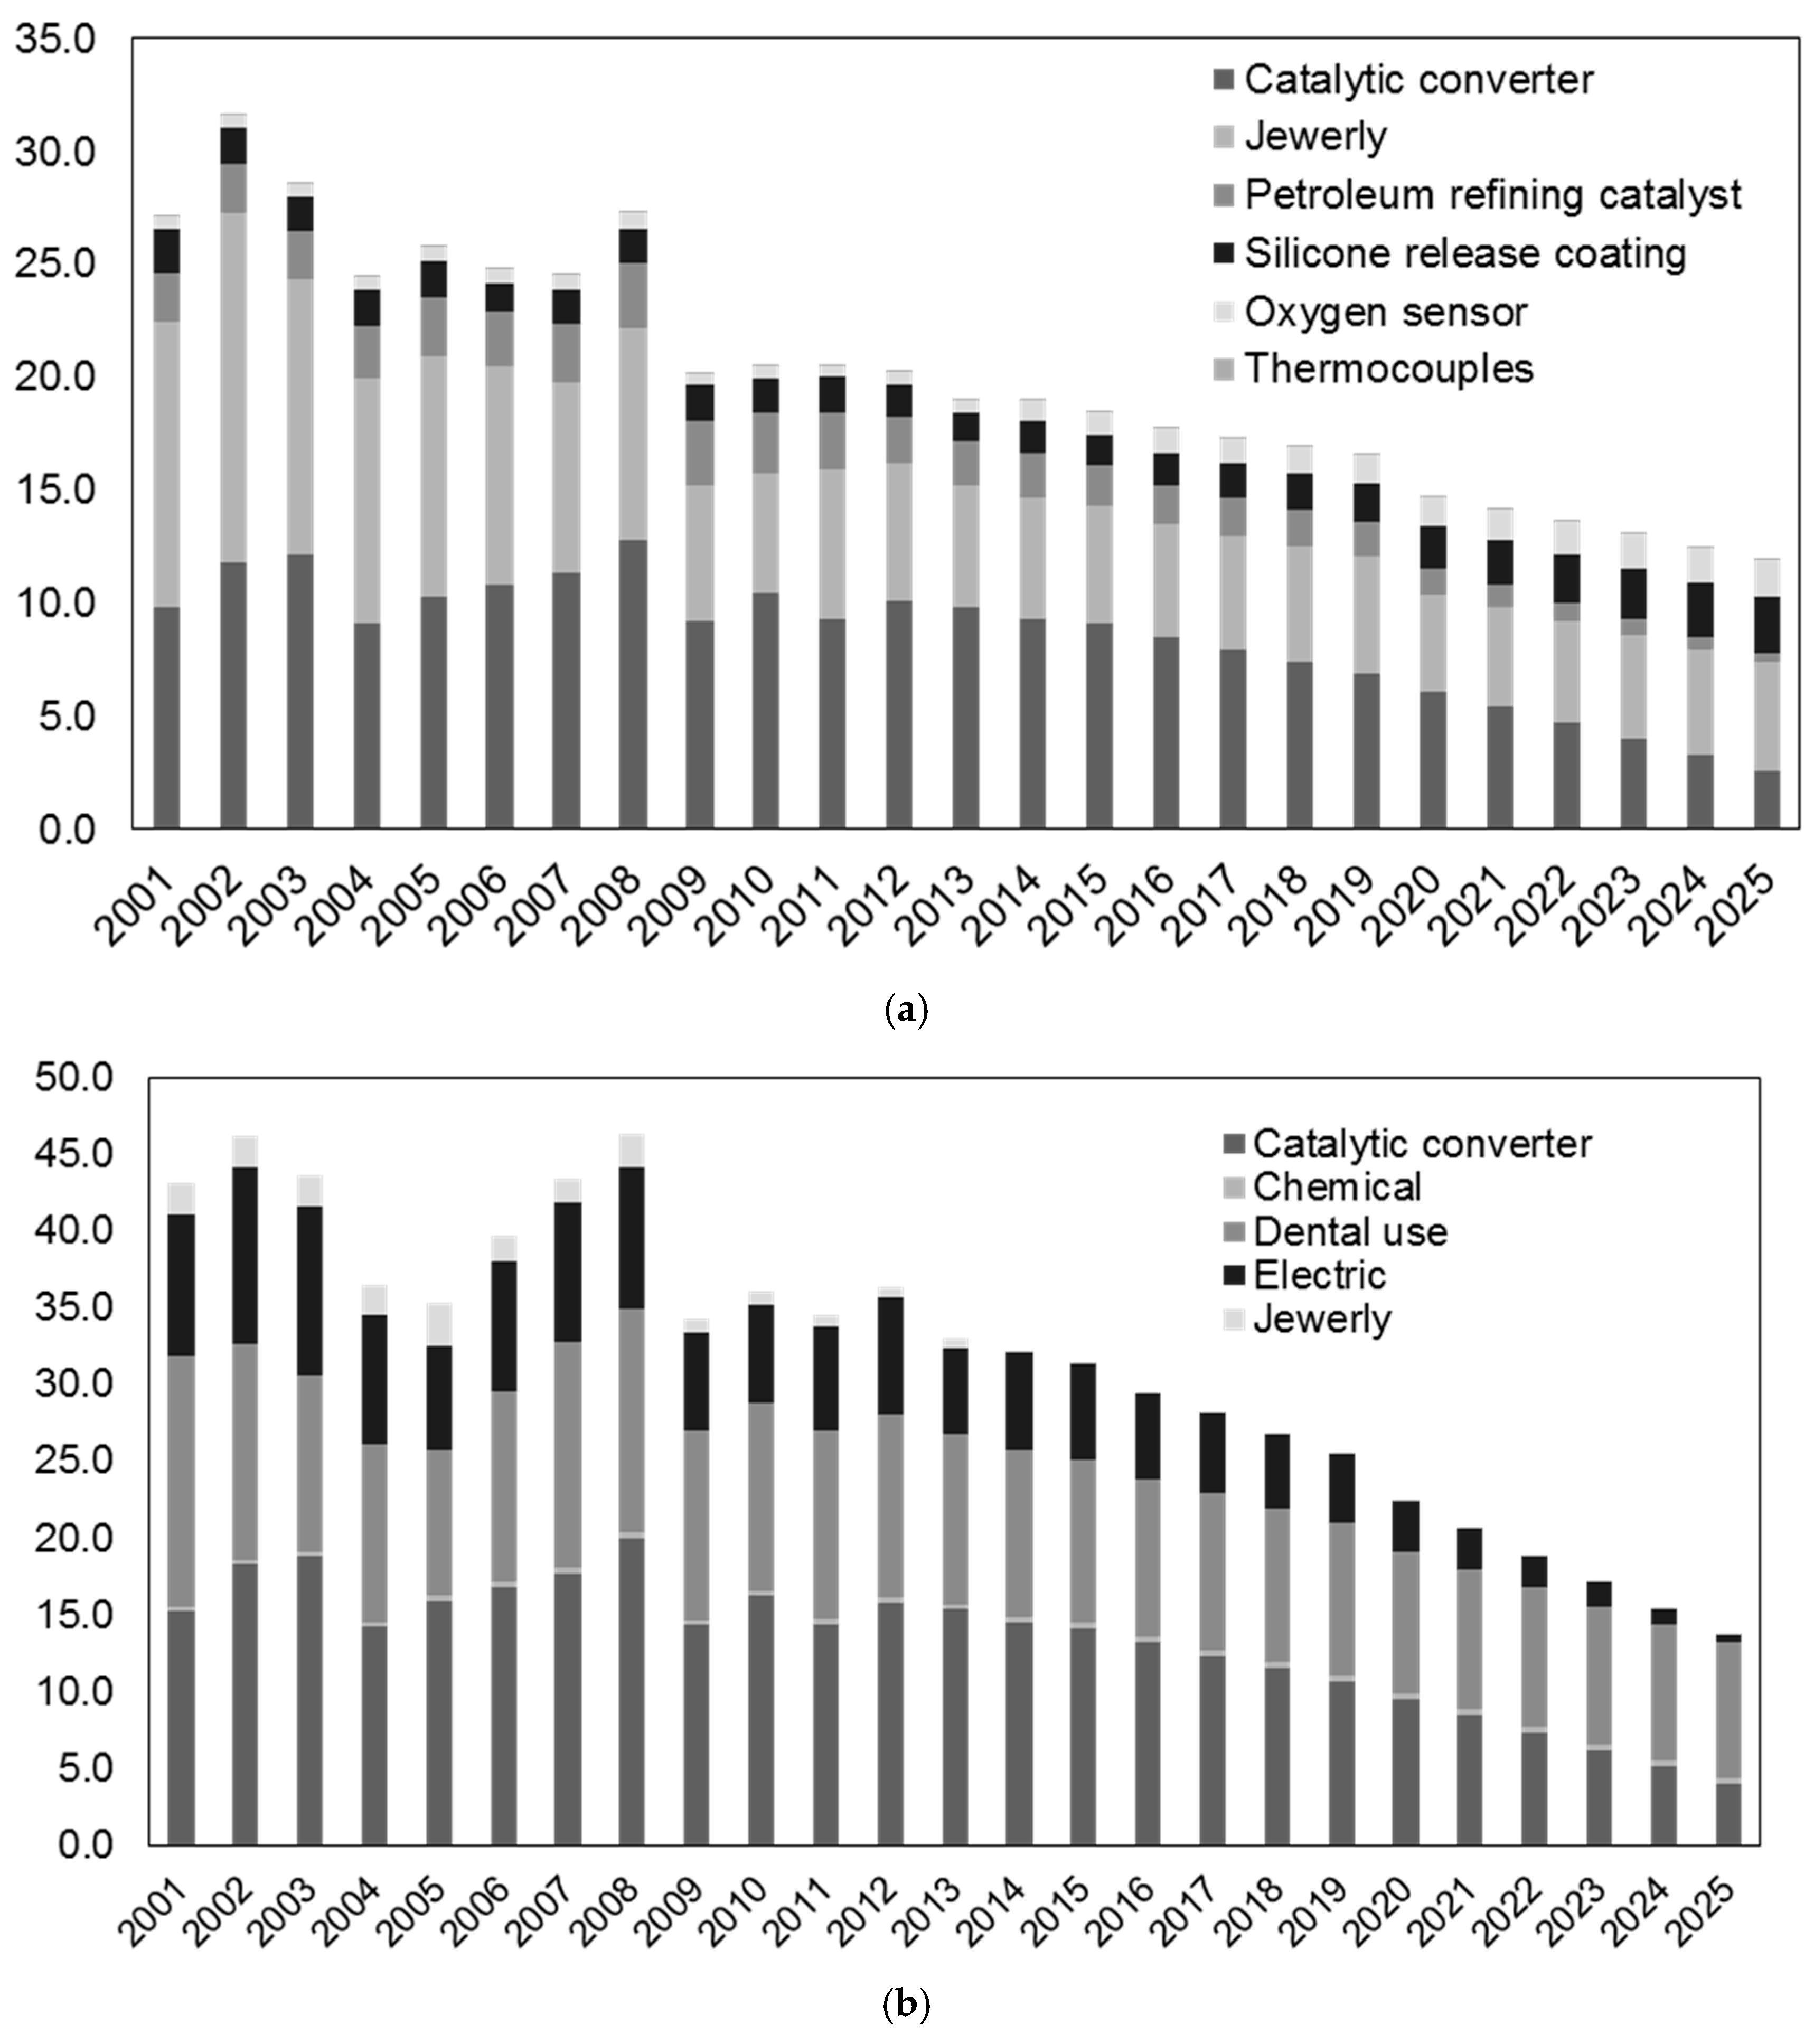
We estimated the historical consumption of platinum and palladium from 2001 to 2013 and forecasted demand up to 2030 (Figure 3). We compiled a bottom-up inventory of the domestic production and contents of platinum and palladium in each of a set of end-use products during 2001–2013. Then, we performed a demand forecast by way of multiple regression analysis using the global economic scenario SRES-B2 of the Intergovernmental Panel on Climate Change [27,50,53] (Appendix Table A2). SRES-B2 is characterized by an increasing population at a relatively slow rate, intermediate levels of economic development, and relatively slow and fragmented technological change. We assumed that SRES-B2 would be most proper due to its focus on regional and environmental concerns. The content of platinum and palladium in each year was assumed to be the same as in 2013.
Platinum and palladium markets in Japan have fluctuated until 2008. Then, both shrank in 2009 and maintained steadily up to 2013, seemingly due to the global financial crisis in 2008–2009. This fluctuation has been driven mostly by the catalytic converter sector (Figure 3).
Looking closely at platinum, it has changed from 31.6 t to 18.4 t in total use, with a surge in 2008 that was drive by the catalytic converter sector. A decline in the jewelry sector was identified, which decreased from 15.5 t in 2002 to 5.3 t in 2013. Jewelry demand in Japan had ranked first in the global market during 1990–1999, currently China is first and has been since 2000. Domestic platinum consumption in jewelry had also been down since the end of 1990s. It was deemed that the economic downturn was closely related to the jewelry market shrinking [41,54]. Jewelry could slightly decrease by 2025, 5.3 t in 2013 to 4.8 t in 2025. Platinum in catalytic converters was also shown to decrease until 2025, accounting for about a quarter in 2013. Other uses such as petroleum refining catalysts (2.0–0.3 t), silicone release coating (1.2–2.5 t), oxygen sensors (0.5–1.6 t), and thermocouples (0.003–0.005 t) have decreased somewhat or retained steadily.
For future growing demand, platinum demand in the PEFCs sector could raise the expectation for an expanding market of fuel cell vehicles (FCVs). FCVs use high platinum content—69 g per car—according to manufacturers. Japan took an early lead on the path toward a society that uses hydrogen as a major source of power. Hydrogen-powered fuel cell cars were first released by a Japanese automaker. And Tokyo’s metropolitan government is actively promoting the use of hydrogen as an energy source with moves including the creation of a JPY 40 billion (USD 348 million) fund for setting up hydrogen refueling stations and other infrastructure [55]. Japanese government targets to spread FCVs and housing PEFCs, by 2 million units, to 5.3 million units in 2030 [47,48]. Although demand for platinum is expected to increase owing to the spread of fuel cell vehicles, the price of platinum is an inhibiting factor. Many have investigated the practical applications of carbon materials as catalyst materials instead of platinum, and the development of fuel cells that use less platinum is promoted [56,57,58].
Total palladium consumption has fluctuated between 33 t and 46.3 t from 2001–2013. It is also shown that catalytic converter and dental use would occupy high consumption up to 2025 (Figure 3). It was shown that catalytic converters and electric use had driven the decline. A typical use of palladium in the electric sector is plating, which is used in connectors, electric contacts, and for decoration [59]. These electric device components are closely related to the market of smartphones, tablets, and electric vehicles (EVs), which are currently growing rapidly. However, domestic production of these has been in decline because price competition has intensified in the rest of Asia, and much production has moved overseas [60,61,62,63,64,65,66,67,68,69,70,71,72,73,74,75]. Dental use of gold silver palladium alloys also has decreased since 2005 and seemingly should continue to decrease up to 2030, which possibly depends upon gold and palladium price fluctuations, with a shift towards the use of hard resins and hybrid ceramics [76,77,78,79,80,81,82,83,84,85,86,87,88,89].
5. Platinum/Palladium Use in Catalytic Converters
Catalytic converters account for the biggest consumption sector for both platinum and palladium (Figure 3). Demand for automotive catalysis began to increase in Japan and the United States in the 1970s due to the implementation of exhaust gas regulations in the 1970s and in Europe in the latter half of the 1980s. Japan has adhered to stricter emission standards since 1975 [90,91]. In accordance with the strengthening of air pollution control laws such as the act on special measures concerning reduction of the total amount of NOx and particulate matter (PM) and ordinances for reducing particulate matter in diesel vehicles, it became obligated to comply to emission standards.
In these measures, catalysts play an important role in achieving each standard, and the quantity of catalytic converters in a unit car and PGMs content have changed along with emission standards updates [44,92]. In 2000, CO, HC, and NOx emissions for gasoline cars were set to 0.66 g/km, 0.08 g/km, and 0.08 g/km under the 10 mode cycle, respectively. In 2004, maximum CO, HC, and NOx emission levels for gasoline cars were updated again and in 2009 only NOx was updated. It has been lowered to half that of previous standards [93]. Therefore, the content of palladium and platinum has increased by about twofold [44]. However, it is also necessary to pay attention to the fact that technological developments are underway to reduce the use of platinum and palladium in industrial sectors [94,95,96,97]. This trend should influence their content in catalytic converters in the future.
6. Conclusions
This study showed chronological platinum/palladium consumption trends in Japan from 2001–2013. It was shown that domestic consumption of platinum slightly declined during 2001–2013, representing declines of catalytic converters and jewelry, although there was still high platinum consumption in 2013. Consumption of palladium fluctuated somewhat during 2001–2013, which was driven by catalytic converters. In the mid-term forecast, it was suggested that catalytic converter production could decrease, while jewelry containing platinum and dental use of palladium could be maintained at a fairly steady rate. They could reach their biggest demand in 2025, respectively. For further study, it would be necessary to discuss more extended industrial sectors and the recycling process.
Acknowledgments
This work was supported by the Grant-in-Aid for Leading New Technology for Energy and Environment program of the New Energy and Industrial Technology Development Organization (NEDO) of Japan.
Author Contributions
Yuna Seo designed the study, and wrote the initial draft of the manuscript. Shinichirou Morimoto contributed to analysis and interpretation of data, and assisted in the preparation of the manuscript. Both authors have contributed to data collection and interpretation, and critically reviewed the manuscript. Both authors approved the final version of the manuscript, and agree to be accountable for all aspects of the work in ensuring that questions related to the accuracy or integrity of any part of the work are appropriately investigated and resolved.
Conflicts of Interest
The authors have no conflicts of interest directly relevant to the content of this article.
Appendix A

Table A1.
Production Quantity of Platinum Final Products in Japan in 2013.
| Final Product Production Quantity (2013) | Catalytic Converter (t) | Silicone Release Coating (t) | Petroleum Refining Catalyst (t) | Oxygen Sensor (Unit) | Thermocouples (Unit) | PTA Catalyst (t) | Dental Use (t) |
|---|---|---|---|---|---|---|---|
| Platinum | 10,969.0 | 60.0 | 582.2 | 9,630,181.0 | 832.0 | - | - |
| Palladium | 10,969.0 | - | - | - | - | 60.0 | 55.3 |
Table A2.
Multiple Regression Analysis for Future Demand Forecast.
| R2 | Significance F | ||
|---|---|---|---|
| Platinum | Catalytic converter | 0.73 | 0.7 × 10⁻³ |
| Jewelry | 0.93 | 0.3 × 10⁻³ | |
| Petroleum refining catalyst | 0.90 | 0.3 × 10⁻⁶ | |
| Silicone release coating | 0.95 | 0.2 × 10⁻⁸ | |
| Oxygen sensor | 0.95 | 1.6 × 10⁻³ | |
| Thermocouples | 0.96 | 0.2 × 10⁻⁸ | |
| Palladium | Catalytic converter | 0.73 | 0.7 × 10⁻³ |
| PTA catalyst | 0.91 | 0.2 × 10⁻⁶ | |
| Dental use | 0.84 | 0.3 × 10⁻² | |
| Electric | 0.70 | 0.3 × 10⁻¹ | |
| Jewelry | 0.74 | 0.2 × 10⁻¹ | |
References
- METI (Ministry of Economy, Trade and Industry). Precious Metal Distribution Statistics Survey; METI: Tokyo, Japan, 1995.
- METI (Ministry of Economy, Trade and Industry). Precious Metal Distribution Statistics Survey; METI: Tokyo, Japan, 1996.
- METI (Ministry of Economy, Trade and Industry). Precious Metal Distribution Statistics Survey; METI: Tokyo, Japan, 1997.
- METI (Ministry of Economy, Trade and Industry). Precious Metal Distribution Statistics Survey; METI: Tokyo, Japan, 1998.
- METI (Ministry of Economy, Trade and Industry). Precious Metal Distribution Statistics Survey; METI: Tokyo, Japan, 1999.
- METI (Ministry of Economy, Trade and Industry). Precious Metal Distribution Statistics Survey; METI: Tokyo, Japan, 2000.
- METI (Ministry of Economy, Trade and Industry). Precious Metal Distribution Statistics Survey; METI: Tokyo, Japan, 2001.
- METI (Ministry of Economy, Trade and Industry). Precious Metal Distribution Statistics Survey; METI: Tokyo, Japan, 2002.
- METI (Ministry of Economy, Trade and Industry). Precious Metal Distribution Statistics Survey; METI: Tokyo, Japan, 2003.
- METI (Ministry of Economy, Trade and Industry). Precious Metal Distribution Statistics Survey; METI: Tokyo, Japan, 2004.
- METI (Ministry of Economy, Trade and Industry). Precious Metal Distribution Statistics Survey; METI: Tokyo, Japan, 2005.
- METI (Ministry of Economy, Trade and Industry). Precious Metal Distribution Statistics Survey; METI: Tokyo, Japan, 2006.
- METI (Ministry of Economy, Trade and Industry). Precious Metal Distribution Statistics Survey; METI: Tokyo, Japan, 2007.
- METI (Ministry of Economy, Trade and Industry). Precious Metal Distribution Statistics Survey; METI: Tokyo, Japan, 2008.
- METI (Ministry of Economy, Trade and Industry). Precious Metal Distribution Statistics Survey; METI: Tokyo, Japan, 2009.
- METI (Ministry of Economy, Trade and Industry). Precious Metal Distribution Statistics Survey; METI: Tokyo, Japan, 2010.
- METI (Ministry of Economy, Trade and Industry). Precious Metal Distribution Statistics Survey; METI: Tokyo, Japan, 2011.
- METI (Ministry of Economy, Trade and Industry). Precious Metal Distribution Statistics Survey; METI: Tokyo, Japan, 2012.
- METI (Ministry of Economy, Trade and Industry). Precious Metal Distribution Statistics Survey; METI: Tokyo, Japan, 2013.
- Emsley, J. Nature’s Building Blocks: An A–Z Guide to the Elements; Oxford University Press: New York, NY, USA, 2011. [Google Scholar]
- JOGMEC (Japan Oil, Gas and Metals National Corporation). Mineral Resource Material Flow; JOGMEC: Tokyo, Japan, 2014; pp. 51–67.
- USGS (U.S. Geology Survey). Mineral Commodity Summaries, 2014. Available online: https://minerals.usgs.gov/minerals/pubs/mcs/2014/mcs2014.pdf (accessed on 8 November 2016).
- Yager, T.R.; Soto-Viruet, Y.; Barry, J.J. Recent Strikes in South Africa’s Platinum-Group Metal Mines—Effects upon World Platinum-Group Metal Supplies; USGS Open-File Report; USGS: Reston, VA, USA, 2012.
- Johnson, M. PGM Market Report; Johnson Matthey: Hertfordshire, UK, 2001–2016. [Google Scholar]
- Daigo, I.; Fujimaki, D.; Matsuno, Y.; Adachi, Y. Development of a dynamic model for assessing environmental impact associated with cyclic use of steel. Tetsu Hagane 2005, 91, 171–178. [Google Scholar] [CrossRef]
- Du, X.; Graedel, T.E. Global in-use stocks of the rare earth elements: A first estimate. Environ. Sci. Technol. 2011, 45, 4096–4101. [Google Scholar] [CrossRef] [PubMed]
- Seo, Y.; Morimoto, S. Domestic yttrium consumption trends in Japan. J. Ind. Ecol. 2016, 20, 1064–1071. [Google Scholar] [CrossRef]
- Arum Publications. Industrial Rare Metals; Arum Publications: Tokyo, Japan, 2002. [Google Scholar]
- Arum Publications. Industrial Rare Metals; Arum Publications: Tokyo, Japan, 2003. [Google Scholar]
- Arum Publications. Industrial Rare Metals; Arum Publications: Tokyo, Japan, 2004. [Google Scholar]
- Arum Publications. Industrial Rare Metals; Arum Publications: Tokyo, Japan, 2005. [Google Scholar]
- Arum Publications. Industrial Rare Metals; Arum Publications: Tokyo, Japan, 2006. [Google Scholar]
- Arum Publications. Industrial Rare Metals; Arum Publications: Tokyo, Japan, 2007. [Google Scholar]
- Arum Publications. Industrial Rare Metals; Arum Publications: Tokyo, Japan, 2008. [Google Scholar]
- Arum Publications. Industrial Rare Metals; Arum Publications: Tokyo, Japan, 2009. [Google Scholar]
- Arum Publications. Industrial Rare Metals; Arum Publications: Tokyo, Japan, 2010. [Google Scholar]
- Arum Publications. Industrial Rare Metals; Arum Publications: Tokyo, Japan, 2011. [Google Scholar]
- Arum Publications. Industrial Rare Metals; Arum Publications: Tokyo, Japan, 2012. [Google Scholar]
- Arum Publications. Industrial Rare Metals; Arum Publications: Tokyo, Japan, 2013. [Google Scholar]
- Arum Publications. Industrial Rare Metals; Arum Publications: Tokyo, Japan, 2014. [Google Scholar]
- METI (Ministry of Economy, Trade and Industry). Industrial Statistics, 2001–2013. Available online: http://www.meti.go.jp/statistics/tyo/kougyo/index.html?utm_source=twitterfeed&utm_medium=twitter (accessed on 8 May 2017).
- Japan Custom. Trade Statistics of Japan. Available online: http://www.customs.go.jp/toukei/info/tsdl.htm (accessed on 12 December 2016).
- GTI (Global Trade Information Services). Global Trade Atlas; Global Trade Atlas®: Englewood, CO, USA, 2014. [Google Scholar]
- NIMS (National Institute of Materials Science). Worldwide Supply and Demand of Platinum Group Metals and Trends in the Recycling of Autocatalyst in Japan; NIMS-EMC MDE Report; NIMS: Tokyo, Japan, 2004.
- Larry, N.; Lewis, J.S.; Yan, G.; Robert, E. Colborn and Gudrun Hutchins. Platinum Catalysts Used in the Silicones Industry. Platin. Met. Rev. 1997, 41, 66–75. [Google Scholar]
- Morikawa, F. Industrial utilization of precious metal catalyst. J. Synth. Org. Chem. 1978, 35, 152–156. [Google Scholar] [CrossRef]
- Enecho (Agency for Natural Resources and Energy of Japan). Road Map Progress. 2016. Available online: http://www.meti.go.jp/committee/kenkyukai/energy/suiso_nenryodenchi/pdf/004_01_00.pdf (accessed on 5 December 2016).
- Enecho (Agency for Natural Resources and Energy of Japan). Production, Transportation and Storage of Hydrogen. Available online: http://www.meti.go.jp/committee/kenkyukai/energy/suiso_nenryodenchi/suiso_nenryodenchi_wg/pdf/005_02_00.pdf (accessed on 9 November 2016).
- MHLW (Ministry of Health, Labor, and Wealth). Pharmacovigilance Production Statistics Survey. 2001–2013. Available online: http://www.mhlw.go.jp/toukei/list/105-1c.html (accessed on 15 November 2016).
- Seo, Y.; Morimoto, S. Comparison of Dysprosium Security Strategies in Japan for 2010–2030. Resour. Policy 2014, 39, 15–20. [Google Scholar] [CrossRef]
- Maeda, M. Recycling of Precious Metals; Research Report on Comprehensive Research for Promoting Environmental Research; Ministry of Environment: Tokyo, Japan, 2012.
- Japan Catalyst Recovering Association (JCRA). Catalyst Recycling Report 2013; JCRA: Tokyo, Japan, 2013. [Google Scholar]
- IPCC (Intergovernmental Panel on Climate Change). Emissions Scenarios; Cambridge University Press: Cambridge, UK, 2000. [Google Scholar]
- Yano Research. Jewelry & Precious Metal Market Yearbook; Market, A., Ed.; Yano Research: Tokyo, Japan, 2014. [Google Scholar]
- Japan Governmen (The Government of Japan). Tokyo Aims to Realize “Hydrogen Society” by 2020. 2016; Volume 14. Available online: http://www.japan.go.jp/tomodachi/2016/spring2016/tokyo_realize_hydrogen_by_2020.html (accessed on 10 May 2017).
- Saito, F. Japan’s Efforts toward Utilization of Hydrogen Energy and Future Prospects; Mizuho Information & Research Institute: Tokyo, Japan, 2013. [Google Scholar]
- Uehara, N.; Ishihara, A.; Matsumoto, M.; Imai, H.; Kohno, Y.; Matsuzawa, K.; Mitsushima, S.; Ota, K. Tantalum oxide-based electrocatalysts made from oxy-tantalum phthalocyanines as non-platinum cathodes for polymer electrolyte fuel cells. Electrochim. Acta 2015, 179, 146–153. [Google Scholar] [CrossRef]
- Reshetenkoa, T.; Serovb, A.; Artyushkovab, K.; Matanovicb, I.; Starihab, S.; Atanassovb, P. Tolerance of non-platinum group metals cathodes proton exchange membrane fuel cells to air contaminants. J. Power Sources 2016, 324, 556–571. [Google Scholar] [CrossRef]
- Kitada, K. Types and characteristics of precious metal plating baths. Surf. Finish. Soc. Jpn. 2004, 55, 626–629. [Google Scholar] [CrossRef]
- Chunichisha (Japan Government Publication). Annual of Electronic Devices Components; Chunichisha: Tokyo, Japan, 2001.
- Chunichisha (Japan Government Publication). Annual of Electronic Devices Components; Chunichisha: Tokyo, Japan, 2002.
- Chunichisha (Japan Government Publication). Annual of Electronic Devices Components; Chunichisha: Tokyo, Japan, 2003.
- Chunichisha (Japan Government Publication). Annual of Electronic Devices Components; Chunichisha: Tokyo, Japan, 2004.
- Chunichisha (Japan Government Publication). Annual of Electronic Devices Components; Chunichisha: Tokyo, Japan, 2005.
- Chunichisha (Japan Government Publication). Annual of Electronic Devices Components; Chunichisha: Tokyo, Japan, 2006.
- Chunichisha (Japan Government Publication). Annual of Electronic Devices Components; Chunichisha: Tokyo, Japan, 2007.
- Chunichisha (Japan Government Publication). Annual of Electronic Devices Components; Chunichisha: Tokyo, Japan, 2008.
- Chunichisha (Japan Government Publication). Annual of Electronic Devices Components; Chunichisha: Tokyo, Japan, 2009.
- Chunichisha (Japan Government Publication). Annual of Electronic Devices Components; Chunichisha: Tokyo, Japan, 2010.
- Chunichisha (Japan Government Publication). Annual of Electronic Devices Components; Chunichisha: Tokyo, Japan, 2011.
- Chunichisha (Japan Government Publication). Annual of Electronic Devices Components; Chunichisha: Tokyo, Japan, 2012.
- Chunichisha (Japan Government Publication). Annual of Electronic Devices Components; Chunichisha: Tokyo, Japan, 2013.
- Chunichisha (Japan Government Publication). Annual of Electronic Devices Components; Chunichisha: Tokyo, Japan, 2014.
- Chunichisha (Japan Government Publication). Annual of Electronic Devices Components; Chunichisha: Tokyo, Japan, 2015.
- Chunichisha (Japan Government Publication). Annual of Electronic Devices Components; Chunichisha: Tokyo, Japan, 2016.
- R&D (Research and development). Annual of Dental Equipment and Materials; R&D: Tokyo, Japan, 2001. [Google Scholar]
- R&D (Research and development). Annual of Dental Equipment and Materials; R&D: Tokyo, Japan, 2002. [Google Scholar]
- R&D (Research and development). Annual of Dental Equipment and Materials; R&D: Tokyo, Japan, 2003. [Google Scholar]
- R&D (Research and development). Annual of Dental Equipment and Materials; R&D: Tokyo, Japan, 2004. [Google Scholar]
- R&D (Research and development). Annual of Dental Equipment and Materials; R&D: Tokyo, Japan, 2005. [Google Scholar]
- R&D (Research and development). Annual of Dental Equipment and Materials; R&D: Tokyo, Japan, 2006. [Google Scholar]
- R&D (Research and development). Annual of Dental Equipment and Materials; R&D: Tokyo, Japan, 2007. [Google Scholar]
- R&D (Research and development). Annual of Dental Equipment and Materials; R&D: Tokyo, Japan, 2008. [Google Scholar]
- R&D (Research and development). Annual of Dental Equipment and Materials; R&D: Tokyo, Japan, 2009. [Google Scholar]
- R&D (Research and development). Annual of Dental Equipment and Materials; R&D: Tokyo, Japan, 2010. [Google Scholar]
- R&D (Research and development). Annual of Dental Equipment and Materials; R&D: Tokyo, Japan, 2011. [Google Scholar]
- R&D (Research and development). Annual of Dental Equipment and Materials; R&D: Tokyo, Japan, 2012. [Google Scholar]
- R&D (Research and development). Annual of Dental Equipment and Materials; R&D: Tokyo, Japan, 2013. [Google Scholar]
- Yano Research. Survey Results on Dental Equipment and Materials Market; Yano Research: Tokyo, Japan, 2014. [Google Scholar]
- METI (Ministry of Economy, Trade and Industry). Market Trend of Catalyst and Measures to Preserve the Air Environment. 2014; pp. 50–59. Available online: http://www.meti.go.jp/statistics/toppage/report/bunseki/pdf/h16/h4a0503j3.pdf (accessed on 12 May 2017).
- MOE (Ministry of the Environment). Status of Automobile Environmental Policy Initiatives in Foreign Countries and Japan. Available online: https://www.env.go.jp/air/report/h21-01/ref3-1.pdf (accessed on 10 May 2017).
- Kuriki, S.; Daigo, I.; Matsuno, Y.; Adachi, Y. Recycling Potential of Platinum Group Metals in Japan. J. Jpn. Inst. Met. 2010, 74, 801–805. [Google Scholar] [CrossRef]
- MLIT (Ministry of Land, Infrastructure, Transport and Tourism). Emission Standards. Available online: http://www.mlit.go.jp/jidosha/jidosha_tk10_000002.html (accessed on 12 April 2017).
- Cooper, B.J. The Catalytic Control of Motor Vehicle Emissions. Honda Found. Rep. 2002, 102, 3–29. [Google Scholar]
- Wang, B. Recent development of non-platinum catalysts for oxygen reduction reaction. J. Power Sources 2005, 152, 1–15. [Google Scholar] [CrossRef]
- Jin-Hwan Kim, J.; Ishihara, A.; Mitsushima, S.; Kamiya, N.; Ota, K. Catalytic activity of titanium oxide for oxygen reduction reaction as a non-platinum catalyst for PEFC. Electrochim. Acta 2007, 52, 2492–2497. [Google Scholar]
- Serov, A.; Kwak, C. Review of non-platinum anode catalysts for DMFC and PEMFC application. Appl. Catal. B Environ. 2009, 90, 313–320. [Google Scholar] [CrossRef]
Figure 1.
Substance flow diagram for platinum (a) and palladium (b) in Japan in 2013. Units are t/year.
Figure 1.
Substance flow diagram for platinum (a) and palladium (b) in Japan in 2013. Units are t/year.


Figure 2.
End-uses of platinum (a) and palladium (b), Japan, 2013.
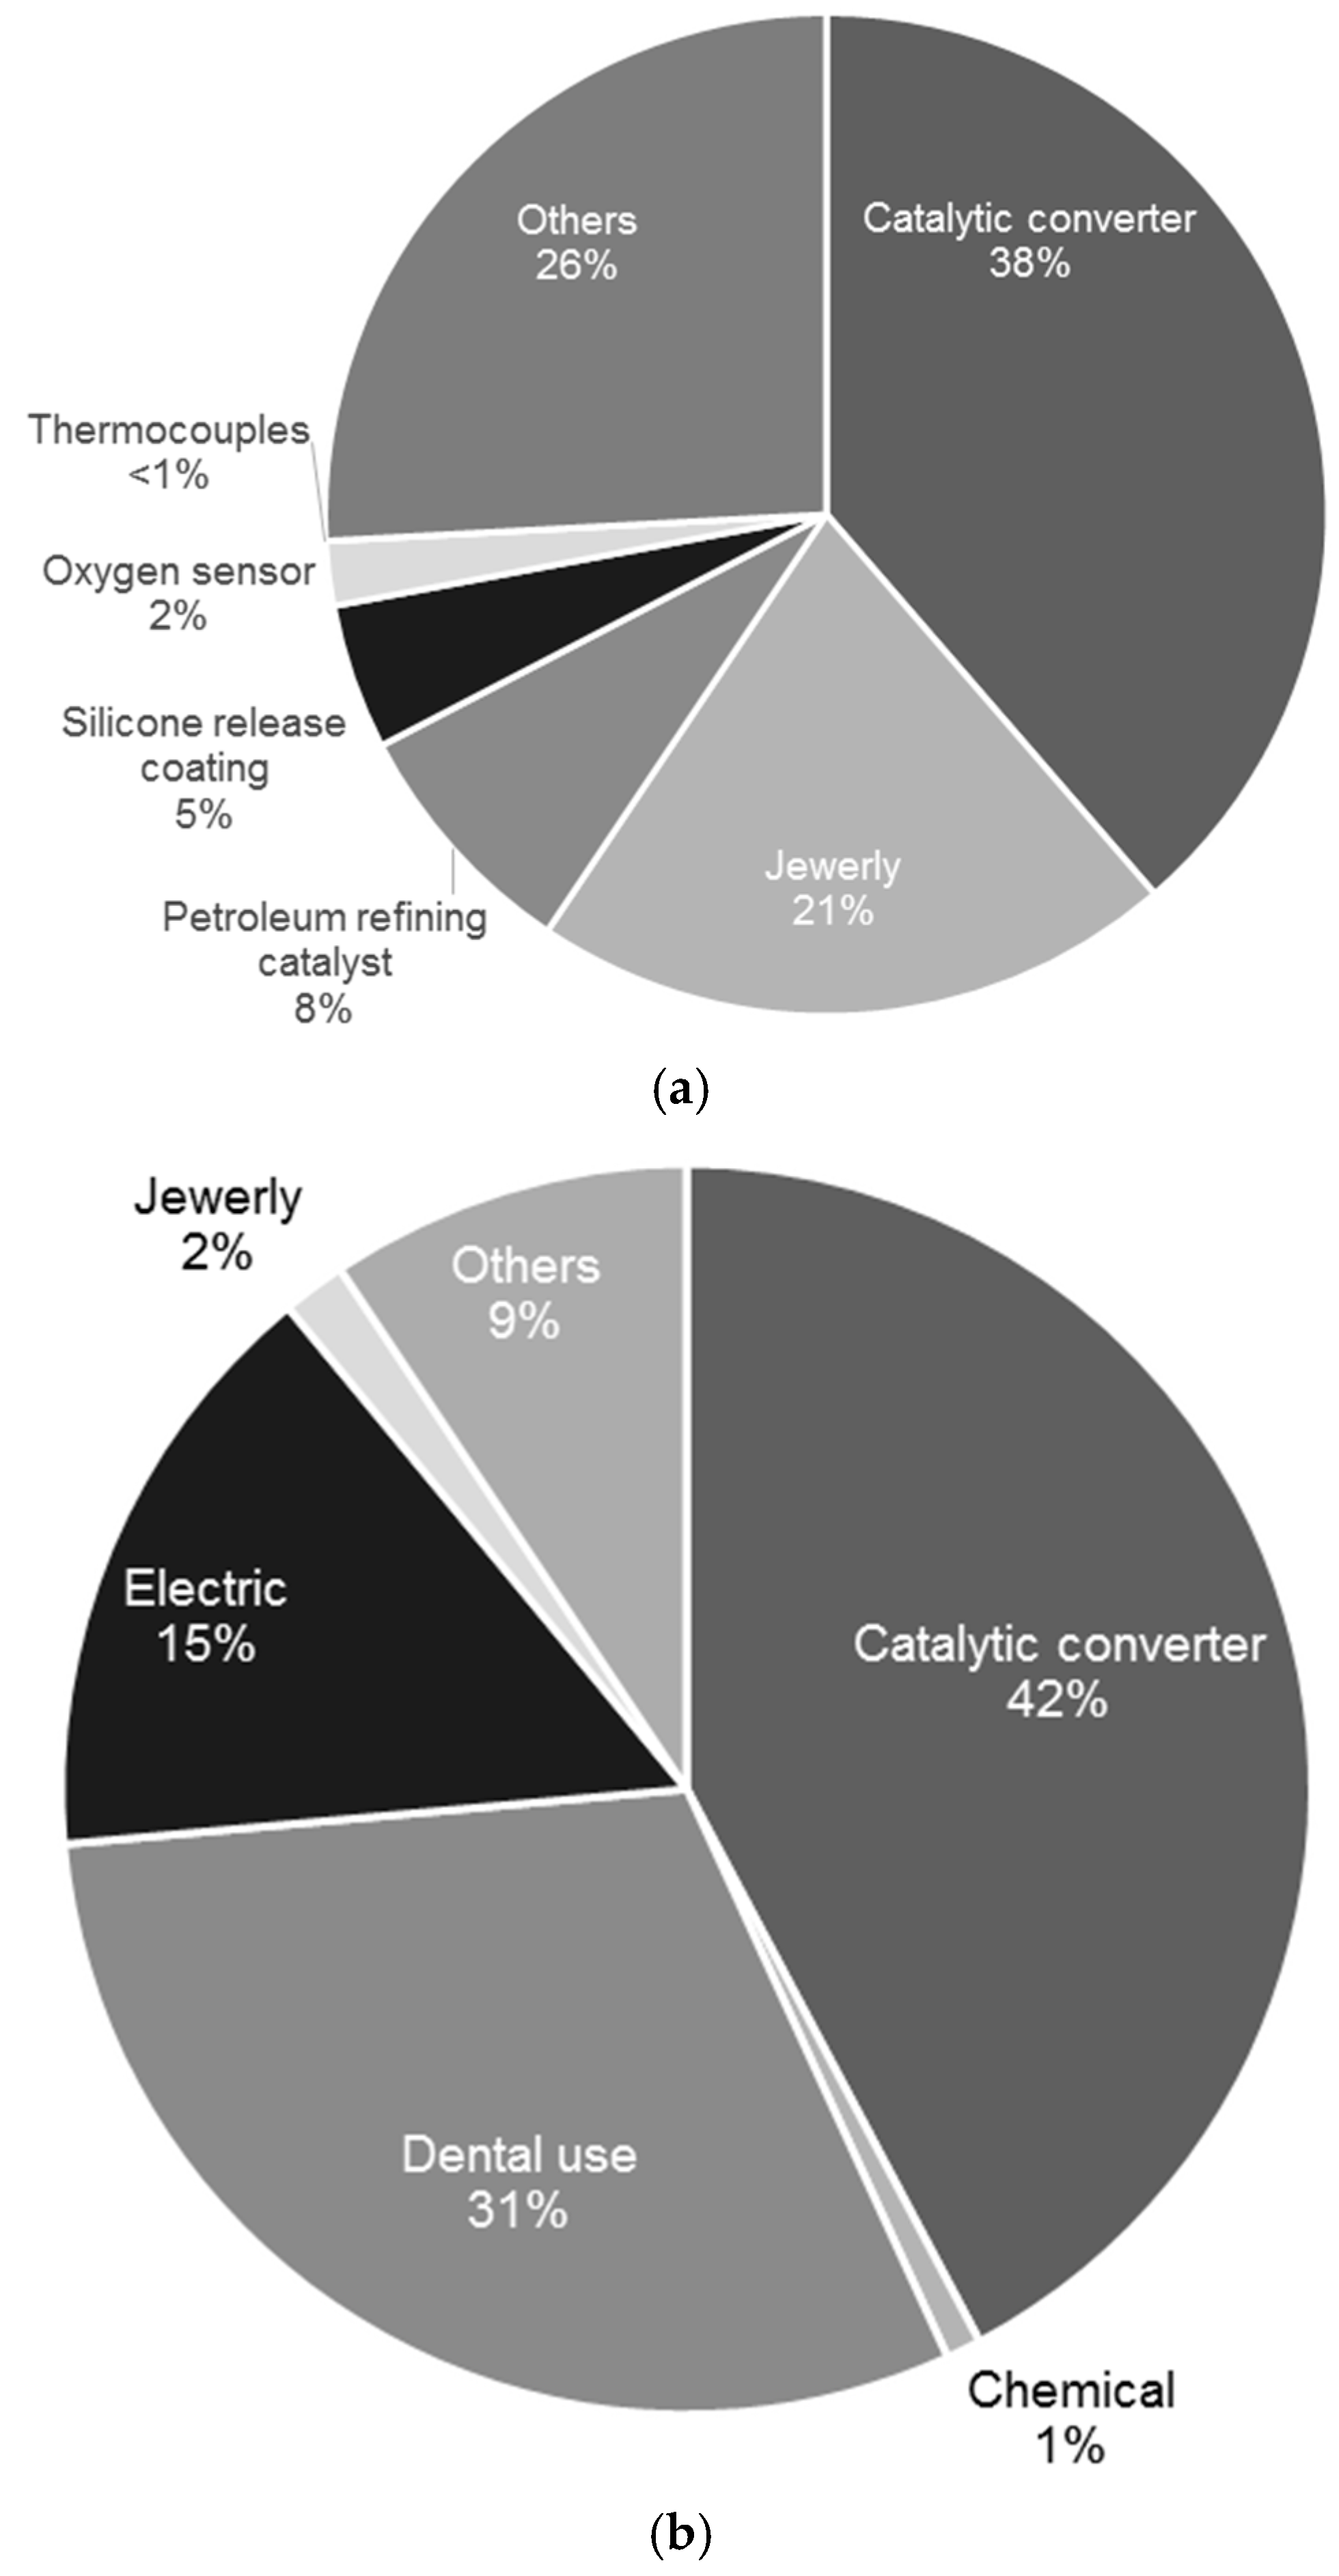
Figure 3.
Historical domestic consumption trends (ton, 2001–2013) and demand forecast of platinum (a) and palladium (b) (ton, 2014–2025).
Figure 3.
Historical domestic consumption trends (ton, 2001–2013) and demand forecast of platinum (a) and palladium (b) (ton, 2014–2025).

Table 1.
Current use of platinum and palladium in end-uses, percentage of end uses with platinum and palladium (θ), weight percentage of platinum and palladium in a unit product (ε), platinum and palladium contents in a unit product in gram (γ) as of 2013.
Table 1.
Current use of platinum and palladium in end-uses, percentage of end uses with platinum and palladium (θ), weight percentage of platinum and palladium in a unit product (ε), platinum and palladium contents in a unit product in gram (γ) as of 2013.
| Product | θ (%) | ε (%) | γ (g) | |||
|---|---|---|---|---|---|---|
| Pt | Pd | Pt | Pd | Pt | Pd | |
| Catalytic converter | 100 | 100 | 0.09 | 0.14 | - | - |
| Fuel cell (PEFC) | 100 | - | - | - | 0.69 | - |
| Silicone release coating | 100 | - | 2 | - | - | - |
| Petroleum refining catalyst | 100 | - | 0.35 | - | - | |
| Oxygen sensor | 100 | - | - | - | 0.055 | |
| Thermoelectric material | 100 | - | - | 3.17 | ||
| Dental Use | - | 100 | - | 20 | ||
| PTA catalyst | - | 100 | - | 0.55 | ||
θ (%): ratio of platinum and/or palladium using products; ε (%): platinum and/or palladium ratio in a unit product (wt %); γ (g): platinum and/or palladium weight in a unit product.
© 2017 by the authors. Licensee MDPI, Basel, Switzerland. This article is an open access article distributed under the terms and conditions of the Creative Commons Attribution (CC BY) license (http://creativecommons.org/licenses/by/4.0/).
Share and Cite
MDPI and ACS Style
Seo, Y.; Morimoto, S. Analyzing Platinum and Palladium Consumption and Demand Forecast in Japan. Resources 2017, 6, 61. https://doi.org/10.3390/resources6040061
AMA Style
Seo Y, Morimoto S. Analyzing Platinum and Palladium Consumption and Demand Forecast in Japan. Resources. 2017; 6(4):61. https://doi.org/10.3390/resources6040061
Chicago/Turabian StyleSeo, Yuna, and Shinichirou Morimoto. 2017. "Analyzing Platinum and Palladium Consumption and Demand Forecast in Japan" Resources 6, no. 4: 61. https://doi.org/10.3390/resources6040061
Note that from the first issue of 2016, this journal uses article numbers instead of page numbers. See further details here.