Abstract
Village development aims to improve the welfare of villagers and the quality of human life. The purpose of this study was to formulate a coastal tourism management model toward developing independent tourist villages. This study employed a quantitative approach by using survey methods. The data analysis was performed using structural equation modeling (SEM). There were four variables namely: the potential of mangrove ecosystem, the perception of the coastal community, the coastal tourism facilities, and the coastal ecotourism. The results indicated that there were two variables which had a significant effect on the management of coastal tourist villages, namely the perception of coastal community and coastal ecotourism. Furthermore, the management of a coastal tourist village had a significant effect on the development of independent coastal tourist villages, and the management of coastal tourist villages was a strong mediator to develop an independent coastal tourist village.
1. Introduction
The establishment of Law Number 6 of 2014 Concerning Village confirms the Government’s of Indonesia’s commitment in the political and constitutional fields to protecting and empowering the Village to be strong, advanced, independent, and democratic [1]. The Village law makes a village socially powerful, politically sovereign, economically empowered, and culturally dignified. Thus, village development aims to improve the welfare of villagers and the quality of human life, as well as reduce poverty through the fulfillment of basic needs, development of village facilities and infrastructure, development of local economic potential, and sustainable use of natural and environmental resources.
In regard to the development of villages in coastal areas, one of the potential natural resources that has strategic value and principles of benefit from ecological, economic, and socio-cultural aspects is the mangrove forest. In order to optimize the management of mangrove resources and the coastal environment, an assessment is needed to determine the potentials, problems, suitability of sustainable management strategies, and knowledge of the strategic value of mangrove forests that benefit the surrounding community in the form of providing massive environmental services, namely coastal protection from storms and erosion and direct income for the villagers through tourism activities [2,3,4,5].
Nowadays, there has been a paradigm shift for tourists both foreign and domestic tourists in choosing tourism objects. A tour to enjoy a life of an environment and its ecosystem highly attracts the attention of tourists. Such forms of tourism is called ecotourism. One of the most reliable forms of such tourism opportunities in coastal areas is mangrove-based ecotourism.
Kuta Beach in the southern coastal region of Central Lombok Regency, West Nusa Tenggara Province, has been established by the Government through the authority of the Indonesia Tourism Development Corporation Management Agency (ITDC) as a tourism development center under the name “Resort Mandalika”, which is one of ten National Tourism Destinations. Furthermore, in the context of accelerating national development, the Province of West Nusa Tenggara is included in the Master Plan for the Acceleration of the Indonesian Economic Development (MP3EI) Corridor V, which is determined based on the Presidential Regulation No. 32 of 2011 concerning the “Master Plan for the Acceleration and Expansion of Indonesian Economic Development”, with the emphasis on food and tourism as featured sectors.
The commitment of the Indonesian Government to advance the Mandalika Region tourism sector is reinforced by the direction of the Indonesian Minister of Tourism in Mataram on 8 February 2016 that the Mandalika Region is one of 10 Priority Travel Destinations of Indonesia, which prioritizes three aspects as the attractions, namely (1) Development of Cultural Tourism Destinations; (2) Development of Natural Tourism Destinations, and (3) development of Artificial Tourism Destinations. In addition, Mandalika Region is one of three regions designated as “Special Economic Zones” along with Tanjung Lesung Beach in Banten Province and the Morotai Islands in North Maluku Province, along with seven other locations as “Strategic Areas for National Tourism”.
Mertak Village as one of 11 coastal villages in Central Lombok Regency and one of the six Coastal Villages in Pujut District has good prospects for tourism development; with the establishment as a Coastal Tourism Village it will have a high chance of becoming an independent tourist village. This research was conducted to obtain variable information and decisive indicators on the development of tourist village to create independent tourist village. Therefore, the purpose of this study was (1) to analyze the relationship between variables in the management of coastal tourist village and independent coastal tourist villages; and (2) formulate a model for improving coastal tourism village management to develop an independent coastal tourist village in Central Lombok Regency.
2. Research Methods
This research was carried in Mertak Village Central Lombok Regency (research locations in Figure 1) by employing a quantitative approach specifically survey method taking a sample of 174 random respondents from the villagers and village government officials. Questionnaires were distributed to collect the data. Which were analyzed by means of the Structural Equation Modeling (SEM).
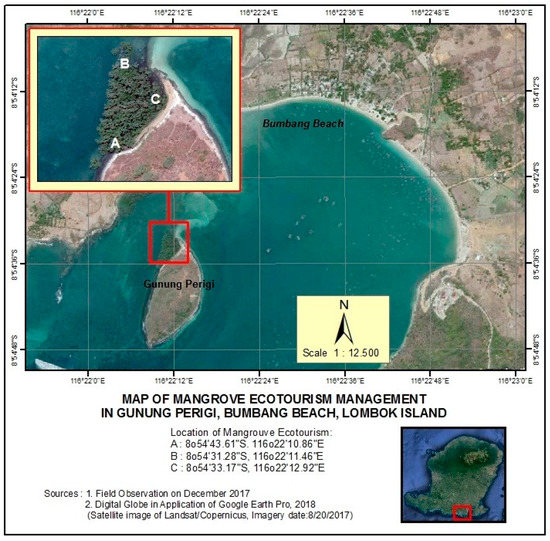
Figure 1.
Research locations.
The conceptual framework of this research was based on the theoretical foundation of various references and supported by the results of previous research such as: Law No. 6 of 2014 Concerning Village [1]; about Tourist Satisfaction with Mangrove Ecotourism Service [6]; the characteristics of mangrove forests [7]; Integrated Mangrove Ecosystem Management [8]; the Collaborative Approach between Tourism and Coastal Communities [9]; Mangrove Ecosystem as Natural Tourism Object [10]; Tourist Village Development Based on Local Community Participation [11]; the Development of Facilities and Infrastructure to Support Sustainable Coastal Tourism [12]; The level of participation in Mangrove ecotourism development [13]; Factors Affecting the Empowerment Level of Coastal Communities [14]; Effect of Soil Quality on the Survival Rate of Mangrove Vegetation [15]; vulnerability analysis of mangrove forest status as a tourism area [16]; based on the description above, the research conceptual framework is presented in Figure 2.
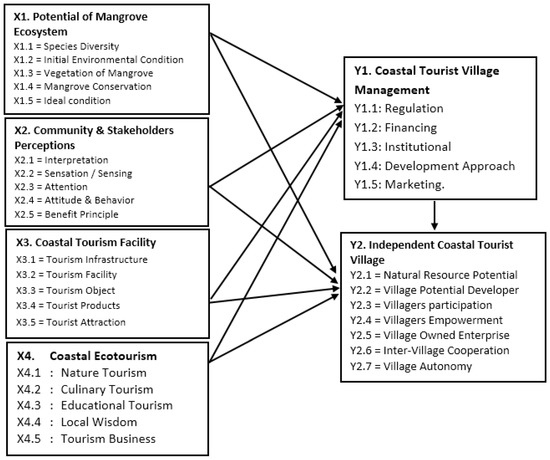
Figure 2.
Research conceptual framework.
Based on the conceptual framework of research, it can be arranged hypothesis: (1) It is suspected that there is a significant positive relationship between the potential of mangrove ecosystems, community perceptions and stakeholders, coastal tourism facilities and coastal ecotourism to the management of coastal tourism villages and independent village of coastal tourism; (2) Management of Coastal Tourism Villages suspected significant effect become a strong mediator for the establishment an Independent Village of Coastal Tourism.
The measurement of research variables involved some indicators and items of indicators. The data of this research were ordinal data scale obtained from the respondents’ perceptions. The respondents’ perceptions were taken from a structured questionnaire and the responses in the form of ranking ranging from Strongly Agree, Agree, Moderately Agree, Disagree, and Strongly Disagree had been prepared. The score for each answer in the questionnaire was: Strongly Disagree had 1 (one) point; Disagree had 2 (two) points; Moderately Agree had 3 (three) points; Agree had 4 (four) points; and Strongly Agree had 5 (five) points. The indicator and items of indicator from each latent variable can be seen in Table 1, Table 2, Table 3, Table 4, Table 5 and Table 6.

Table 1.
Indicators and indicator items of Mangrove Ecosystem Potential Variable.
Table 2.
Indicators and indicator items from the research variables Perception of Coastal Communities.
Table 3.
Indicators and indicator items from research variables coastal tourism facilities.
Table 4.
Indicators, indicator items from the Coastal Ecotourism research variables.
Table 5.
Indicators, indicator items from research variables for Coastal Village Tourism Management.
Table 6.
Indicators, indicator items from the Independent Tourist Village (Y2) research variable.
3. Data Analysis Method
This research employed a Structural Equation Modeling (SEM) analysis tool that is a combination of two statistical methods namely factor analysis with simultaneous equation modeling. Validity and reliability tests in this study were carried out using the rules in SEM with the help of LISTREL software because the model compatibility in the SEM method could directly explain the validity and reliability. The validity of statements which are indicator variables in measuring certain latent variables is assessed by looking at the real loading factor. T-statistic value was >1.96 (α = 0.05). Test normality was performed with the LISREL program, the assumption of normality could be tested with statistical values z for skewness and kurtosis. The assumption of normality is met if the p-value of both types of tests is more than 0.05 [17,18]
Structural Equation Modeling (SEM) independent and LISREL 8.8 software (Scientific Software International, Inc.: Skokie, IL, USA) were used to analyze and process the data. One of the advantages of SEM is that it can measure a relationship that cannot be measured directly [17,18]. In this case, the level of community participation, the level of residential environmental infrastructure services and the role of the community could not be measured directly or called latent variables. Satisfaction of services in managing environmental infrastructure and responsible behavior could not be measured directly.
When the input matrix was processed, the goodness of fit index value of the standard solution model was assessed. The following are the tests that can be used as a guide to get the appropriate model in SEM [17,18,19].
a. Chi-Square value and probability (P)
It is testing the expected results with a data matrix using Chi-Square. A good model requires the value of Chi-Square with a value smaller than the value of the degree of freedom.
b. P-Value
P-value with p > 0.05 is a significance different test. If the test results show it is not significant, it means that the input matrix and the alleged matrix are not different or the same, then the proposed model is considered suitable. The p-value ranges between 0 and 1 the structural equation model will get better if the p-value approaches 1.
c. Goodness of Fit Index (GFI)
This test shows how much the model is able to explain the diversity of data. The greater the value obtained, the better the model. The match level target is ≥ 0.90, as a suitable model reference.
d. Adjusted Goodness of Fit Index (AGFI).
AGPI is a modification of GFI by accommodating free degrees of models with other models being compared. The suitability level target value is ≥ 0.90.
Based on the description above, the manifest indicator of a model factor of increasing the management of coastal tourist village in developing an independent village of coastal tourism in Central Lombok Regency used LISREL (Linear Structure Relationship) software.
4. Results and Discussion
The research and discussion results are explained within three subjects, (1) description of the respondents’ answers towards research questionnaire; (2) confirmatory factor of measurement model (Outer Model); and (3) Goodness-of-Fit of Structural Model (Inner Model).
4.1. Description of the Respondents’ Answers
This descriptive analysis was performed in order to find out an overview of the answers given by respondents to each indicator or item of question in the questionnaire. This assessment could be administered by dividing respondents’ answers into classes based on certain intervals. The value of class interval in this study was
Based on the class interval, the answer assessment category could be arranged as follows.
Based on Table 7, general descriptions of respondents’ answers to all research variables (i.e., potential of mangrove ecosystem, community participation, coastal tourism facilities, coastal ecotourism, coastal tourist village management, independent coastal tourist village) and indicators or items of questions in the questionnaire are presented in the following Table 8.
Table 7.
Assessment Category.
Table 8.
General description of Respondents’ Answers towards to all research variables and indicators.
4.2. Confirmatory Factor of Analysis Measurement Model (Outer Model)
Confirmatory factor analysis in smartPLS for the measurement model or outer model was aimed to examine the validity and reliability of each indicator in the research variable, and extract the latent variables from the indicators. In PLS analysis using smartPLS raises a possibility to use two types of latent variable indicator models namely reflective and formative model. The validity of the reflective model can be seen by using the convergent validity criteria and discriminant validity. The validity of the formative indicator model employs the significance criteria from the outer weights of each indicator, in which the notion of significance is fulfilled if the T test statistic value of each indicator is T < −1.96 or T > 1.96. As the researchers observed the path diagram used in this study, all the latent variables used were classified as reflective models, so that the convergent validity criteria and discriminant validity were used. Convergent validity is performed to determine the validity of each indicator used in the study. An indicator is said to be valid if the outer loading is >0.50. Discriminant validity is determined based on the value of cross loading whether the cross-loading indicators have the greatest value on the corresponding latent variable. On the other hand, the reliability of the measurement model is seen based on the percentage or diversity proportion of latent variables that can be explained by the indicator. The criterion that can be used is Composite Reliability (CR) > 0.70. The following is the validity and reliability of each latent variable used within the study.
4.2.1. Potential of Mangrove Ecosystems (X1)
The potential of mangrove ecosystems was thought to be manifested or reflected in indicators of species diversity, initial environmental condition, mangrove vegetation, mangrove forest conservation and ideal condition. In Table 9, the outer loading of all X1 indicators was more than 0.50, therefore it could be said that the research instrument used met the convergent validity requirement. It meant that the research instrument consisting of indicators and items of indicator in the questionnaire could be utilized to measure the Potential of Mangrove Ecosystems. The number shown in the outer loading value indicated how far the indicators reflected each latent variable.
Table 9.
Convergent validity (outer loading) indicator of potential mangrove ecosystem variable (X1).
Based on the outer loading value in Table 9, it could be stated that the most dominant mangrove ecosystem potential was determined by indicators of mangrove forest conservation since this indicator had the largest outer loading. This was in accordance with the opinion of References [20,21] that conservation is an effort to use natural resources wisely by referring to the principle of conservation; it is needed as a planned management of natural resources in a sustainable manner, and a natural balance between diversity and the process of evolutionary change in an environment. If it is associated with the operational definition, mangrove forest conservation is the respondent’s perception of the conservation activity programs that become the responsibility of all parties such as the government, community, non-governmental organizations and universities; conservation benefits for people’s lives, both economically and biologically through the function as a place of recreation and natural tourism; the management and utilization of mangrove ecosystems ought to prioritize the protection function because it has distinctive and unique characteristics. The previously explained definition showed that people in the study area already had a high awareness towards the importance of conservation and who was in charge for it.
The most dominant indicators determining the potential of mangrove forest ecosystems according to the study of Reference [22] explained that management of natural resources by means of restoration or improvement of mangrove forests is considered to have succeeded in achieving conservation goals both in terms of economics and environmental conservation and has a positive influence towards government, management, and NGO sides. If mangrove conservation is not carried out based on the results of the study [23], it explains that the rapid decline of mangrove forests in many parts of the world today have caused significant environmental and economic products, as well as services loss including forest products, food, and fish habitat.
The test that revealed whether all indicators used are able to reflect the potential of the mangrove ecosystem can be seen on the analysis’ report in Table 10 as follows.
Table 10.
Discriminant validity (cross loading) and reliability (composite reliability) of potential mangrove ecosystem variable (X1).
Based on Table 10, it could be seen that these indicators tended towards discriminant validity. Therefore, the indicators could be concluded as valid. Besides, the CR (critical ratio) value of this measurement model was 0.863, it meant that this value was more than 0.70. Thus, indicator of species diversity (X1.1), initial environmental condition (X1.2), mangrove vegetation (X1.3), mangrove forest conservation (X1.4), and ideal condition (X1.5) used to reflect variables the potential of mangrove ecosystems (X1) in addition to being valid were also reliable. Therefore, the indicators forming potential of mangrove ecosystem variable (X1) were suitable to be employed within the analysis of the structural model (inner model). The first hypothesis which inferred that the potential of mangrove ecosystem was reflected in indicator of species diversity (X1.1), initial environmental condition (X1.2), mangrove vegetation (X1.3), mangrove forest conservation (X1.4), and ideal condition (X1.5) was proven to be true or truth-tested.
4.2.2. Perception of Coastal Communities (X2)
The second hypothesis in this study was that the perception of Coastal Community indicator (X2) was manifested or reflected in the indicators of Interpretation (X2.1), Sensation/Sensing (X2.2), Attention (X2.3), Attitude and Behavior (X2.4), and Benefit Principle (X2.5). This hypothesis would be proven as true or false on Table 11 as follows.
Table 11.
Convergent validity (outer loading) of coastal community perception (X2).
Based on Table 11, all outer indicators of X2 were worth more than 0.50, so that these five indicators could be used in subsequent analyzes. Therefore, it could be stated that the research instrument used to explore the perception data of coastal community was able to meet the convergent validity requirements. If it is viewed based on the outer loading value, the perception of coastal community can be reflected as follows: interpretation, sensation/sensing, attention, attitude and behavior, and benefit principle. The most dominant variable sequence in reflecting perception of coastal community were namely as, the attention indicator (0.848), interpretation indicator (0.832), sensing/sensation indicator (0.810), and attitude and behavior indicator (0.759). The most dominant perception of coastal community was determined by attention indicator since it had the largest outer loading. That result is consistent with the opinion of Reference [24], that one of the factors that plays a role in building perception was Attention as the concentration or centralization of all individual activities aimed at a set of objects that will be perceived. If it is associated with the operational definition, attention is the respondent’s perception that everyone has a sense of desire to know clearly an object, a role facilitated obtaining information that is considered as new and important and an option as an assessment decision can be set easily. Furthermore, the definition also portrayed that people within the study already had a high awareness on the importance of wanting to know the object, the role of new information, the decision making related to community choice clearly.
The results of this study is in accordance with the results of the study from Reference [14], that the development of human resources supporting the Blue Economy (balanced economy, ecology, social) is formed by decision making indicator. High curiosity from coastal community in this research area showed that the community’s ability was good. This is supported by the result of the conducted study of Reference [25], that human resources capabilities are formed by knowledge/intelligence, skills, and traits indicator. The dominant perception of coastal community was reflected in high curiosity and the consideration of taking new information related to the conservation and protection of forests including mangrove forests as very important, was accurate. It is supported by the results of a studies from References [16,26] which states that intentionally or unintentionally, natural resources, such as protected forests and conservation forests, suffered from serious damage. It can be caused by the misperception of community paradigm in understanding the environmental system and benefits of natural resources. The wrong paradigm begins with ignorance and inability to assess and conduct economic assessments of natural resources.
The test displayed the indicator of interpretation, sensing/sensation, attention, attitudes, and behavior and benefits principles reflecting the perception of coastal communities, is presented in Table 12 as follows.
Table 12.
Discriminant validity (cross loading) and reliability (composite reliability) of perception of coastal community variable (X2).
Table 12, the value of cross-loading indicator that had the greatest value on variables was the perception of coastal community (X2). It depicted that these indicators tended towards discriminant validity. Therefore, these indicators could be assumed to be valid. Besides, the CR (Ccritical ratio) value of this measurement model was 0.890, which meant this value was higher than 0.70. Thus, indicators of interpretation (X2.1), sensing/sensation (X2.2), attention (X2.3), attitude and behavior (X2.4), and benefit principle (X2.5) that were used to reflect Coastal community perception variables (X2) in addition to being valid, were also reliable. Therefore, the indicators forming the perception of the coastal community variable were feasible to be used in the analysis of the structural model (inner model). The second hypothesis which assumed the coastal community perceptions reflected in indicators of interpretation (X2.1), sensing/sensation (X2.2), attention (X2.3), attitude and behavior (X2.4), and benefit principles (X2.5) was proven to be true or validated.
4.2.3. Coastal Tourism Facility Variable (X3)
The third hypothesis in this study that was inferred as indicator of coastal tourism facilities reflected in indicators were Tourism Infrastructure (X3.1), Tourism Facilities (X3.2), Tourism Object (X3.3), Tourist Products (X3.4), and Tourist Attraction (X3.5). The validation of this hypothesis is explained based on Table 13 as follows.
Table 13.
Convergent validity (outer loading) variable indicator for coastal tourism facility (X3).
Based on Table 13, all X3 outer indicators were valued more than 0.50; therefore, these five indicators could be administered in the subsequent analysis. Moreover, it could be said that the research instrument used to explore data on coastal tourism facilities was able to meet convergent validity requirements. The number shown in the outer loading value indicated the extent to which the indicators could reflect the latent variable. When it was viewed based on the outer loading value, the coastal tourism facilities could be reflected in tourism infrastructure, tourism facilities, tourism objects, tourist products and tourist attractions. Coastal tourism facility was predominantly determined by tourist attraction indicator since this indicator had the largest outer loading. This is in accordance with Law No. 10/2009, tourist attractiveness shall mean anything having uniqueness, beauty, and value in terms of natural wealth, culture diversity, and the man-made results being the target or destination of the tourists visit. If it is associated with the definition of tourist attraction, it is meant as the respondent’s perception of the distinctive, unique, interesting, and competitive nature. Human resources who have the skills and artistic value to design a blend of natural diversity, culture, local wisdom, and man-made results, will increase the number of tourist visits. Increasing tourist visits has a positive effect on local community income and village income.
The hypotheses test showing that tourism infrastructure, tourism facilities, tourism objects, tourism products and tourist attraction may reflect coastal tourism facilities is displayed in Table 14 as follows.
Table 14.
Discriminant validity (cross loading) and reliability (composite reliability) of coastal tourism facility variable (X3).
Table 14, the value of cross-loading indicator that had the greatest value on variables was the Coastal Tourism Facility Variable (X3). It depicted that these indicators tended towards discriminant validity. Therefore, these indicators could be stated as valid indicators. Moreover, the CR (critical ratio) value of this measurement model was 0.863, it was higher than 0.70. Thus, the indicators used to reflect the variable coastal tourism facility (X3), in addition to being valid were also considered as reliable. Therefore, the indicators forming the coastal tourism facility (X3) variable were suitable to be used in the analysis of the structural model (inner model). The third hypothesis which assumed that coastal tourism facility (X3) were reflected in tourism infrastructure indicator (X3.1), tourism facility (X3.2), tourism objects (3.3), tourist products (3.4), and tourist attraction (3.5) was proven correct or truthfully tested.
4.2.4. Coastal Ecotourism Variable (X4)
The fourth hypothesis in this study that inferred as the indicators of coastal ecotourism (X4) were natural tourism (X4.1), culinary tourism (X4.2), educational tourism (X4.3), local wisdom (X4.4), and tourism businesses (X4.5). Table 15 explains the truthfully tested hypotheses as follows.
Table 15.
Convergent validity (outer loading) variable indicators for coastal ecotourism (X4).
Based on Table 15, all X4 outer indicators were worth more than 0.50, so these five indicators could be used in subsequent analyzes. Therefore, it could be affirmed that the research instrument used to explore Coastal Ecotourism data (X4) have met the convergent validity requirements. The number shown in the outer loading value indicated the extent to which the indicators could reflect the latent variable. If it was perceived based on the value of outer loading, the Coastal Ecotourism (X4) that could be reflected in coastal ecotourism (X4) were as follows: natural tourism (X4.1), culinary tourism (X4.2), educational tourism (X4.3), local wisdom (X4.4), and tourism business (X4.5). Coastal ecotourism predominantly determined by the indicators of local wisdom, because this indicator had the largest outer loadings. This was in accordance with Law No. 10 (2009), that the availability of everything that had uniqueness, beauty and value in the form of cultural diversity of natural wealth and man-made results were considered as the target and tourist attraction of tourist visits. The operational definition of local wisdom was the respondent’s perception of the role of tourism as a form of community compliance with the social rules that apply in their environment. Tourism promoted benefits to foster a proactive attitude and creativity in manifesting the Independent Community by promoting the value of wisdom amid the effects of globalization; and it also boosted the benefits of maintaining and retaining the sustainability of local wealth owned by the Village.
Hypothesis testing portraying the indicators of coastal ecotourism namely natural tourism (X4.1), culinary tourism (X4.2), educational tourism (X4.3), local wisdom (X4.4), and tourism business (X4.5) could reflect coastal ecotourism can be seen in Table 16 as follows.
Table 16.
Discriminant validity (cross loading) and reliability (composite reliability) of coastal ecotourism variable (X4).
Table 16, the value of cross-loading indicators of natural tourism (X4.1), culinary tourism (X4.2), educational tourism (X4.3), local wisdom (X4.4), and tourism business (X4.5) disclosed that the largest indicator was the coastal ecotourism facility variable (X4). This indicated that these indicators tended toward discriminant validity. Therefore, these indicators could be affirmed as valid indicators. In addition, the CR (critical ratio) value of this measurement model is 0.852, which had a higher value than 0.70. Thus, the indicators used to reflect coastal ecotourism variables, in addition to being valid may also be considered as reliable. Therefore, the indicators forming the coastal ecotourism variables were feasible to be used in the analysis of the structural model (inner model). The fourth hypothesis which assumed that coastal ecotourism was reflected in the following indicators, namely natural tourism (X4.1), culinary tourism (X4.2), educational tourism (X4.3), local wisdom (X4.4), and tourism businesses (X4.5) was proven to be true or it had been truthfully tested.
4.2.5. Management of Coastal Tourist Village Variable (Y1)
The fifth hypothesis in this study was that the suspected indicators of coastal tourist village management (Y1) were Regulation (Y1.1), Financing (Y1.2), Institutional (Y1.3), Development approach (Y1.4) and Marketing (Y1.5). The validation results of the analysis of this hypothesis are proven in Table 17 as follows.
Table 17.
Convergent validity (outer loading) variable indicator for coastal tourist village management (Y1).
Based on Table 17, all Y1 outer indicators were worth more than 0.50, hence, these five indicators could be executed in subsequent analyzes. In addition, it could be concluded that the research instrument used to explore data on Coastal Tourism Management was able to meet the convergent validity requirements. Based on the outer loading value, Coastal Tourist Village Management (Y1) could be reflected in Regulation (Y1.1), Financing (Y1.2), Institutional (Y1.3), Development approach (Y1.4), and Marketing (Y1.5). The most dominant Management of Coastal Tourism Village was determined by the development of approach indicator, because this indicator had the largest outer loading. This was in accordance with Reference [27] statement saying that a strategy step was needed in formulating a plan of activities through a development approach that determined the goals and direction of action and the allocation of resources needed to achieve the goals.
The development approach was the respondent’s perception of the role of development as a guide to resource management by prioritizing preservation and long-term oriented aspects. Furthermore, the role of development was balancing tourism development activities with natural conditions and local location characteristics. It also oriented to the value of benefits for local communities and the role of development in regulating harmony between tourism development needs, the environment and local communities.
Hypothesis testing portraying that the Regulatory indicators (Y1.1), Financing (Y1.2), Institutional (Y1.3), Development approach (Y1.4), and Marketing (Y1.5) can reflect the coastal tourist village management results, are presented within analysis in Table 18 as follows.
Table 18.
Discriminant validity (cross loading) and reliability (composite reliability) of coastal tourism management variable (Y3).
Based on Table 18, cross-loading of the Regulatory indicators (Y1.1), Financing (Y1.2), Institutional (Y1.3), Development approaches (Y1.4), and Marketing (Y1.5) displayed the greatest value of management variables coastal tourism village (Y1). This shows that these indicators tended towards discriminant validity. Therefore, these indicators could be assumed as valid indicators. In addition, the CR (critical ratio) value of this measurement model was 0.861 which was higher than 0.70. Thus, the Regulatory indicator (Y1.1), Financing (Y1.2), Institutional (Y1.3), Development approach (Y1.4), and Marketing (Y1.5) used to reflect the variables of coastal tourism village management (Y1) were also reliable, in addition to being valid. Therefore, the indicators forming the variables of coastal village management (Y1) were suitable to be utilized in the analysis of the structural model (inner model). The fifth hypothesis suggested that coastal tourism village management reflected in the Regulations (Y1.1), Financing (Y1.2), Institutional (Y1.3) indicators, Development approaches (Y1.4) and Marketing (Y1.5) was proven to be true or truthfully tested.
4.2.6. Independent Coastal Tourist Village Variable (Y2)
To prove the sixth hypothesis in this study stating that the inferred indicators of independent coastal tourist village variable (Y2) were respondents’ perceptions related to natural resource potential (Y2.1), village potential development (Y2.2), villagers participation (Y2.3), villagers empowerment (Y2.4), village-owned enterprise/BUMDes (Y2.5), inter-village cooperation (Y2.6), and village autonomy (Y2.7); the indicators are thoroughly explained on Table 19 below.
Table 19.
Convergent validity (outer loading) variable indicators of independent coastal tourist village (Y2).
Based on Table 19, all outer indicators of Y2 were worth more than 0.50, hence these five indicators could be used in subsequent analyzes. It could be affirmed that the research instrument used to explore the data of the Independent Coastal Tourist Village (Y2) was able to meet the convergent validity requirements. It also meant that the research instrument consisting of indicators of natural resource potential (Y2.1), village potential development (Y2.2), villagers participation (Y2.3), villagers empowerment (Y2.4), village-owned enterprises/BUMDes (Y2.5), inter-village cooperation (Y2.6), and village autonomy (Y2.7) could be administered to measure the Coastal Tourism Village Management variables (Y1). Based on the value of outer loading, the independent Coastal Tourist Village (Y2) could be reflected in the potential of natural resources (Y2.1), the development of village potential (Y2.2), villagers participation (Y2.3), villagers empowerment (Y2.4), Village-owned enterprises/BUMDes (Y2.5), inter-village cooperation (Y2.6) and village autonomy (Y2.7). The independent coastal tourist village was predominantly determined by indicator of village-owned business enterprise/BUMDes since this indicator had the largest outer loadings. This was in accordance with the opinion of [28], that regulated the establishment of village-owned business entity (BUMDes) which was intended to manage assets, resource potential, services, and other businesses for the maximum possible welfare of the village community and also as a source of original village income. Village-owned business entity/BUMDes is the respondent’s perception of the role of BUMDes as a community economic institution that has a strategic function of running a business in the economic field and public services in the village; the role of BUMDes in increasing the income of rural communities and as a source of village original income through the management of village assets and the available natural resource potential.
Test hypotheses showing that the indicators of natural resource potential (Y2.1), village potential development (Y2.2), villagers participation (Y2.3), villagers empowerment (Y2.4), village-owned enterprises/BUMDes (Y2.5), inter-village cooperation (Y2.6), and village autonomy (Y2.7) could reflect the Coastal Tourism Independent Village can be seen in Table 20 below.
Table 20.
Discriminant validity (cross loading) and reliability (composite reliability) of independent coastal tourist village variable (Y2).
Based on Table 20, cross-loading indicators of natural resource potential (Y2.1), village potential development (Y2.2), villagers participation (Y2.3), villagers empowerment (Y2.4), village-owned business entity/BUMDes (Y2.5), inter-village cooperation (Y2.6), and village autonomy (Y2.7) portrayed the greatest value of the variable coastal tourism Independent Village (Y2). This depicted that these indicators tended towards discriminant validity. Therefore, these indicators could also be said as valid indicators. Moreover, the CR (critical ratio) value of this measurement model was 0.886 which was higher than 0.70. Thus, the following indicators, namely natural resource potential (Y2.1), village potential development (Y2.2), villagers participation (Y2.3), villagers empowerment (Y2.4), village-owned enterprises/BUMDes (Y2.5), inter-village cooperation (Y2.6), and village autonomy (Y2.7) which were used to reflect the variables of independent coastal tourist village (Y2) were also reliable. In addition to previous explanation, the indicators that form the variable of independent coastal tourist village (Y2) were considered to be suitable to be used in the analysis of the structural model (inner model). The sixth hypothesis suggested that independent coastal tourist village was reflected or portrayed in the following indicators, namely natural resource potential (Y2.1), development of village potential (Y2.2), villagers participation (Y2.3), villagers empowerment (Y2.4), Village-owned enterprises/BUMDes (Y2.5), inter-village cooperation (Y2.6), and village autonomy (Y2.7) was proven to be true or truthfully tested.
4.3. Goodness-of-Fit of Structural Model (Inner Model)
After obtaining a measurement model of latent variables which were valid and reliable, the results of the measurement will be used in the analysis of structural models or inner models. The evaluation of the inner goodness of fit model of each endogenous latent variable was determined based on the R-square value or coefficient of determination. The goodness of fit of structural model as a whole was measured by Q2 predictive relevance. A structural model was declared to be good fit if it had Q2 predictive relevance > 0.50. The R-square value in the structural model of this study is presented in Table 21 below.
Table 21.
The R-square of latent variables of structural model.
Based on the R-square values of the two endogenous latent variables presented in Table 21, the management of coastal tourist village (Y1) and independent coastal tourist village (Y2) could determine the predictive relevance Q2 value, namely
Q2 = 1 − (1 − 0.609) (1 − 0.648) = 0.862 = 86.2%
This value indicated that about 86.2% of the diversity of latent endogenous variables in the structural model could be explained by the model formed from exogenous variables, namely the potential of mangrove ecosystems (X1), the perception of coastal community (X2), coastal tourism facilities (X3), coastal ecotourism (X4), while the remaining 13.8% was explained by other variables outside the model and error. Because the Q2 value of predictive relevance was more than 0.50, it could be inferred that this structural model was good fit. An exogenous latent variable was said to affect endogenous latent variables if T statistics were worth more than 1.96 or less than −1.96. The test results are shown in Table 22 below.
Table 22.
Hypothesis testing results relationship between latent variables.
Based on the test results in Table 22, it could be asserted that: coastal community perception variable (X2) had a positive and significant effect on coastal tourism village management variables (Y1); coastal ecotourism variable (X4) had a positive and significant effect on the variable of coastal tourism management (Y1); meanwhile the variable of coastal tourism village management (Y1) contributed a positive and significant effect on independent coastal tourist village (Y2). The model for improving the management of coastal tourism villages in manifesting an independent village of coastal tourism is illustrated in the following Figure 3.
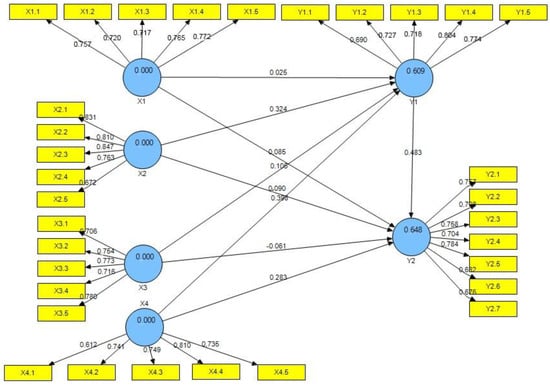
Figure 3.
An improved model of coastal tourism village management in manifesting an independent coastal tourism village.
Based on this model, it could be stated that independent village of coastal tourism could be directly pursued through the management of good coastal tourist village (because the Y1 variable was a good moderator). Furthermore, the management of coastal tourist village was strongly influenced by the perception of coastal tourist communities and coastal ecotourism. Therefore, these two variables also indirectly affected the independent villages of coastal tourism through the management of coastal tourist villages. In another sense, the management of coastal tourist villages became a strong mediator between community perceptions and coastal ecotourism in realizing an independent village of coastal tourism. Management of the coastal tourist village became an important variable, the decision of the management of a sustainable tourism destination will be successful if there is political support and sufficient planning from decision-makers. It is supported by the results of a studies from Reference [29].
5. Conclusions
From the scenario results in this research model, it can be concluded that the management of a coastal tourist village was strongly affected by society perception and a coastal ecotourism variable, while the endogenous variable of coastal tourist village management became a strong mediator to develop an independent coastal tourist village. There was a positive and significant influence between coastal tourist village management towards independent coastal tourist village. Thus a good management of tourist village is required to develop an independent coastal tourist village.
Author Contributions
Conceptualization and methodology are M.H. and N.H.; Validation is L.H.; Formal Analysis are M.H.; Investigation are A.H.; Writing-Original Draft Preparation is M.H.; Writing-Review & Editing is N.H.; Visualization is N.H.; Supervision is A.H.; Project Administration is a M.H.; Funding Acquisition is M.H.
Funding
This research did not receive external funding, (Independent research).
Conflicts of Interest
The authors declare no conflicts of interest.
References
- Republic of Indonesia Law Number 6 of 2014 Concerning Villages. Available online: http://www.dpr.go.id/dokjdih/document/uu/UU_2014_6.pdf (accessed on 25 October 2018). (In Indonesian).
- Nuddin, H. The Economic Valuation of the Mangrove Forest Ecosystem and Its Application in Planning the Coastal Area; Graha Ilmu: Yogyakarta, Indonesia, 2010. [Google Scholar]
- Wardhani, M.K. Kawasan Konservasi Mangrove: Suatu Potensi Ekowisata. J. Kelaut. 2011, 4, 60–76. (In Indonesian) [Google Scholar]
- Azkis, F.A. The Compability of the Mangrove Ecosytem and the Ecoowisata Development Strategy in the Demak District; Tesis Program Magister Ilmu Lingkungan Pascasarjana Universitas Diponegoro: Semarang, Indonesia, 2013. [Google Scholar]
- Harahab, N.; Setiawan. Compatibility Index of Mangrove Ecotourism in Malang District. ECSOFiM Econ. Soc. Fish. Mar. J. 2017, 4, 153–165. [Google Scholar]
- Zaki, A.M.; d Saman, F.M.; dan Kamaruzaman Jusoff, Z.H.H. Tourists’ Satisfaction on Kilim River Mangrove Forest Ecotourism Services. Merok, Kedah Malaysia; Faculty of Business Management, Universiti Teknologi Mara (UiTM): Selangor Darul Ehsan, Malaysia, 2009. [Google Scholar]
- Cunha-Lignon, M.; Coelho, C., Jr.; Almeida, R.; Menghini, R.P.; Schaeffer-Novelli, Y.; Cintron, G.; Dahdouh-Guebas, F. Characterisation of Mangrove Forest Types in View of Conservation and Management: A Review of Mangal at The Cananeia Region, SaoPaulo State, Brazil. J. Coast. Res. 2011, 64, 349–353. [Google Scholar]
- Kustanti, A.; Nugroho, B.; Kusmana, C.; Darusman, D. Integrated Management of Mangrove Ecosystem in Lampung Mangrove Centre (LMC) East Lampung Regency, Indonesia. J. Coast. Dev. 2012, 15, 209–216. [Google Scholar]
- Ratnayake, P.U. A Collaborative Approach Between Tourism and Coastal Community; A Present-Day Need and Opportunity for Mangrove Management and Conservation in Sri Lanka. Shar. Lessons Mangrove Restor. 2012, 63, 1–10. [Google Scholar]
- Sawitri, R.; Bismark, M.; Karlina, E. Ekosistem Mangrove Sebagai Obyek Wisata Alam Di Kawasan Konservasi Mangrove Dan Bekantan Di Kota Tarakan (Ecosystem Mangrove as an Ecotourism in Conservation Area for Mangrove and Proboscis Monkey at Tarakan City). J. Penelit. Hutan Konservasi Alam 2013, 10, 297–314. (In Indonesian) [Google Scholar] [CrossRef]
- Urmila Dewi, H.; Fandeli, H.; Baiqun, M. The Development Rural Tourist Village Based in the Village in the Jatiluluh Village, Tabanan, Bali; Fakultas Ekonomi Universitas Udayana-Bali: Denpasar, Indonesia, 2013. [Google Scholar]
- Fajriah, D.; Mussadun, S. The Development of Tools and Infrastructure to Support Sustainable Coastal Tourism; Jurnal Pengembangan Wilayah: Planologi Undip, Semarang, Indonesia, 2014; Volume 10, pp. 218–233. [Google Scholar]
- Idajati, H.; Pamungkas, A.; Kukinul, S.V. The level of participation in Mangrove ecotourism development, Wonorejo Surabaya. Procedia Soc. Behav. Sci. 2016, 227, 515–520. [Google Scholar] [CrossRef]
- Riniwati, H. Blue Economy in Motion: Factors Affecting the Empowerment Level of Coastal Communities. Int. Res. J. Financ. Econ. 2015, 141, 47–65. [Google Scholar]
- Harahap, N.; Soeprijanto, A.; Lestari, R.A. The Effect of Soil Quality on the Survival Rate of Mangrove Vegetation. J. Eng. Appl. Sci. 2015, 10, 154–156. [Google Scholar]
- Harahab, N.; Riniwati, H.; Abidin, Z. The Vulnerability Analysis of Mangrove Forest Status as a Tourism Area. Ecol. Environ. Conserv. J. 2018, 24, 968–975. [Google Scholar]
- Wijayanto, N. Accounting Information System; Erlangga: Jakarta, Indonesia, 2008. [Google Scholar]
- Gozali, I. Application of Multivariate Analysis with SPSS Program; Diponegoro University Publishing: Semarang, Indonesia, 2005. [Google Scholar]
- Akter, S.; D’Ambra, J.; Ray, P. An evaluation of PLS based complex models: the roles of power analysis, predictive relevance and GoF index. In Proceedings of the 17th Americas Conference on Information Systems, Detroit, MI, USA, 4–8 August 2011; pp. 1–7. [Google Scholar]
- Masud, M.M.; Aldakhil, A.M.; Nassani, A.A.; Azam, M.N. Community-based ecotourism management for sustainable development of marine protected areas in Malaysia. Ocean Coast. Manag. 2017, 136, 104–112. [Google Scholar] [CrossRef]
- Rifai, M.A. Biology Dictionary; Balai Pustaka: Jakarta, Indonesia, 2004. [Google Scholar]
- Walters, B.B. Local Management of Mangrove Forests in the Philippines: Successful conservation or Efficient Resource Exploitation? Hum. Ecol. 2004, 32, 177–195. [Google Scholar] [CrossRef]
- Ron, J.; Padilla, J.E. Preservation or Conversion? Valuation and Evaluation of a Mangrove Forest in the Philippines. Environ. Resour. Econ. 1998, 14, 297–331. [Google Scholar] [CrossRef]
- Walgito, B. Introduction to General Psychology; Andi Offset: Yogyakarta, Indonesia, 2004. [Google Scholar]
- Riniwati, H. Blue Economy in Motion: The Role of Ability, Opportunity, and Motivation of Human Resource to Performance of Organization. Ecol. Environ. Conserv. 2016, 22, 567–576. [Google Scholar]
- Riniwati, H.; Harahab, N.; Abidin, Z. Loss Estimation of Protected Forest Damage and Its Impact on Fishery Sector in Goa Cina Beach, South Area of Malang Regency. 2016. Available online: http://www.internationalresearchjournaloffinanceandeconomics.com (accessed on 9 November 2017).
- Ruttan, V.W.; Hayomi, Y. Toward a Theory of Induced Institutional Innovation. J. Dev. Stud. 1984, 20, 203–223. [Google Scholar] [CrossRef]
- Dan Suhana, C.S.K. Community Empowerment in Education in the Era of Regional Autonomy; Cakra: Bandung, Indonesia, 2011. [Google Scholar]
- Nižić, M.K. Spatial resources in the development of tourism destinations (case study Kvarner). Tour. Hosp. Manag. 2014, 20, 29–43. [Google Scholar]
© 2018 by the authors. Licensee MDPI, Basel, Switzerland. This article is an open access article distributed under the terms and conditions of the Creative Commons Attribution (CC BY) license (http://creativecommons.org/licenses/by/4.0/).