1. Introduction
As the world has been facing the ongoing COVID-19 (COronaVIrus Disease 2019) pandemic, governments and public and private organizations must prioritize public well-being in their decision-making process. The challenges the COVID-19 pandemic presents, both in individuals’ emotional and psychological well-being, raise the need to collect health-related data and, moreover, to build dashboards that show critical information, make it easily accessible, and gather the day-to-day data of the pandemic progression and ongoing infection rates and fatality, among other statistics. However, emotional health, previously studied in other geographic locations such as the United States [
1] and Mexico [
2] has also shown to have long-term implications for the well-being of the populations and how it is affected by news and government decisions related to the pandemic. This situation presents the need for a tool to measure the impact of communications transmitted to the population, which can also serve as a feedback mechanism to better adjust future announcements. Such a mechanism faces many challenges: data recollection, processing capabilities, and deciding what measurement instrument to utilize.
Acquiring and processing this amount of information is not easy, as this is a perfect example of the challenges encountered by the three Vs of big data: volume, variety, and velocity [
3]. We adhere to the most common definition of big data based on
the three Vs, first introduced by [
4]. However, there are multiple definitions containing different aspects of these architectures, such as analysis, value, computer power, visualization, variability, and veracity, among various others. An in-depth description of these definitions is described by [
5], but suffice to say that this research work adheres to the big data concept by most definitions. It presents several problems, such as those listed next:
Acquiring feedback on the emotional state is both expensive and time-consuming.
Having these data available presents a significant challenge in processing capabilities and comes with a long wait time to receive feedback.
Building such systems is costly, regardless of the volume variations in the data.
Traditional survey methods, such as interviews or surveys, are prohibitive. Besides the high expense, they require significant time to gather feedback on a small portion of the population, providing information on discrete periods rather than a continuous flow. Twitter is a mature, well-established, and popular microblogging service that offers users a platform to share their opinions, conversations, reviews, and other information. A large corpus of heterogeneous data was collected [
6], which we refer to as the COVID-19 Twitter chatter dataset. It includes raw text, tweet metadata, images, videos, URLs, and popularity. This corpus is an excellent candidate for performing sentiment analysis to follow public opinion on any given topic or event but presents several challenges, including the high computing resources needed for the research and a curated, well-defined training corpus. Furthermore, the advances in technology nowadays allow the processing of data in large volumes, at a fast velocity, and from numerous heterogeneous sources, making possible the analysis of sentiments on a near real-time basis [
7].
Sentiment analysis is a discipline that allows the determination of the sentiment classification and polarity of any given free-form text. While there are multiple sentiment analyzers, they all share the same basic pipeline: preprocessing, where we normalize the input text and transform it into a form that a machine can process; the actual sentiment classification or polarity determination, which a language model calculates; and postprocessing, where the outputs need further normalization or interpretation. We often find two types of language models: rule-based models, where we try to construct an expert system to interpret the text, or statistical-based models, often used with deep learning architectures, which provide the most robust and best-performing models to date. However, we train and evaluate these models using a curated corpus of data, from which we calculate their intrinsic measurements. These intrinsic measurements can be optimistic and do not guarantee that a well-performing model will remain so when used on real-world data, for the model will evaluate data significantly different from the data used during training.
For these reasons, we provide an empirical study comparing these language models to each other in terms of this real-world extrinsic task: the emotional response of the Mexican population by performing a sentiment analysis on COVID-19-related tweets. In addition to presenting a summary of each model’s measurements, we compare how this affects the said study, highlighting their relevance and cost/performance trade-offs. This work is organized as follows. The introduction showed the context of the problem, a brief overview of the proposed solution, a general background of existing COVID-19 studies based on Twitter data, and an overview of the language models to be evaluated. The Methods section highlights the evaluation process and an in-depth review of the language models included in this work. Experiment and Results show the measurements taken and the results gathered, with some explanations of the meanings and interpretations drawn from the results. Finally, we close this work with a brief discussion of the conclusions drawn here, as well as future steps that can be taken to explore this area further.
Literature Review
Next, a quick literature review is presented, dividing the literature into two parts: language model evaluation and sentiment analysis performed for COVID-19-related data taken from Twitter. Natural language processing has recently seen novel architectures implement language models in a way that provides robustness and accuracy. All implementations use nonlinear statistical models as language representations, in different ways, from vast attention-based deep learning architectures to simpler dictionary-based deployments, such as VADER [
8]. VADER is an open-source, rule-based robust language model that can handle commonly employed complex grammar structures commonly used in social media. For training data, it utilizes a curated corpus evaluated by humans. BERTweet [
9] is based on BERT [
10], using a pretraining procedure somewhat similar to that utilized by RoBERTa [
11], both of which use publicly available tweets in English for training and evaluation. TimeLMs [
12] introduces a time concept into the language model by utilizing continuous learning and thus accounts for future and out-of-distribution tweets it might encounter. This language model also uses publicly available tweets in English for training and evaluation.
The implementer of each novel language model architecture provides a set of metrics that serve as the basis for each of the improvements provided. These are intrinsic metrics, for they evaluate the model’s performance against a previously defined test corpus, which is usually part or a superset of the training dataset.
Table 1 provides a summary of these metrics for different implementations of language models. However, the behavior of the models can be different when faced with the real world, as the data might present another distribution or present new cases that were not part of the training. This makes it indispensable to evaluate models using real-world data on real-world conditions with a real task. This evaluation method is known as an extrinsic metric, where the model is not directly evaluated but compared with other models based on its performance on a real-world task. For example, TweetEval [
13] evaluates a few selected language models, with the single exception of VADER which was measured in a different study [
14], training and evaluating them under a curated corpus appropriate for the task [
15], collecting metrics, and concluding on a single clear winner. However, we have no information on how such a winner model would behave with accurate, non-curated data.
Table 2 displays a summary of sentiment analysis studies performed on Twitter data related to COVID-19, where we found them to utilize a small dataset, either in volume or in the length of the analyzed time frame. In general, only tweets written in English were accepted, restricted to the U.S., with just a few exceptions. For example, the study in [
16] restricts the studied tweets to those that originated only in Australia, in contrast to the survey [
17], which uses a global dataset. Note that most of these studies [
1,
16,
17,
18,
19,
20,
21] focus on panel data analysis, except for [
2,
22,
23,
24,
25,
26], which use a time series analysis. There have been other works that provide additional information; for example, the study [
27] in the U.S. and [
28] in Canada, which provide ample evidence on the correlation of beliefs shared on Twitter and the social distancing practices in real life, providing good indicators for risk management. Since the study [
2] also provides a public dataset and enough details of the technology and language model utilized, we focused our methodology on matching it as closely as possible and performing comparisons with the other models accordingly.
2. Data and Methods
We collected a dataset of tweets from an open-access repository of global COVID-19-related tweets, which we refer to as the COVID-19 Twitter chatter dataset [
6]. The dataset was designed to collect every tweet related to the COVID-19 pandemic and included metadata to facilitate analysis and filtering before consumption. This COVID-19 Twitter chatter dataset provides a broad collection of tweet IDs, geographical locations, and detected language, utilizing the following schema:
[tweet_id, date, time, lang, country_code]. However, we encountered schema inconsistencies over time. For example, the annotation of
country_code, which is necessary for filtering before requesting a tweet lookup, was not introduced until the second half of the year, and even then, a large number of tweets lacked this metadata annotation.
For this reason, we had to load them via Twitter’s public API to filter out tweets originating from outside Mexico, which may have left out data from those users who chose not to share their location. We used this information to download each tweet in Mexico, discarding all other metadata provided by Twitter’s API for privacy reasons. Specifically, we retrieved COVID-19-related tweets posted in Mexico from 1 February 2020 to 31 December 2020. All tweets were scrubbed of personally identifiable information to ensure user privacy and comply with ethical practices in social networks, resulting in the following simplified schema:
full_text, id, time_stamp. It is worth mentioning that this dataset included tweets in both English and Spanish, for a large part of the population engages on social media in English. This methodology followed the same consumption strategy previously followed [
2].
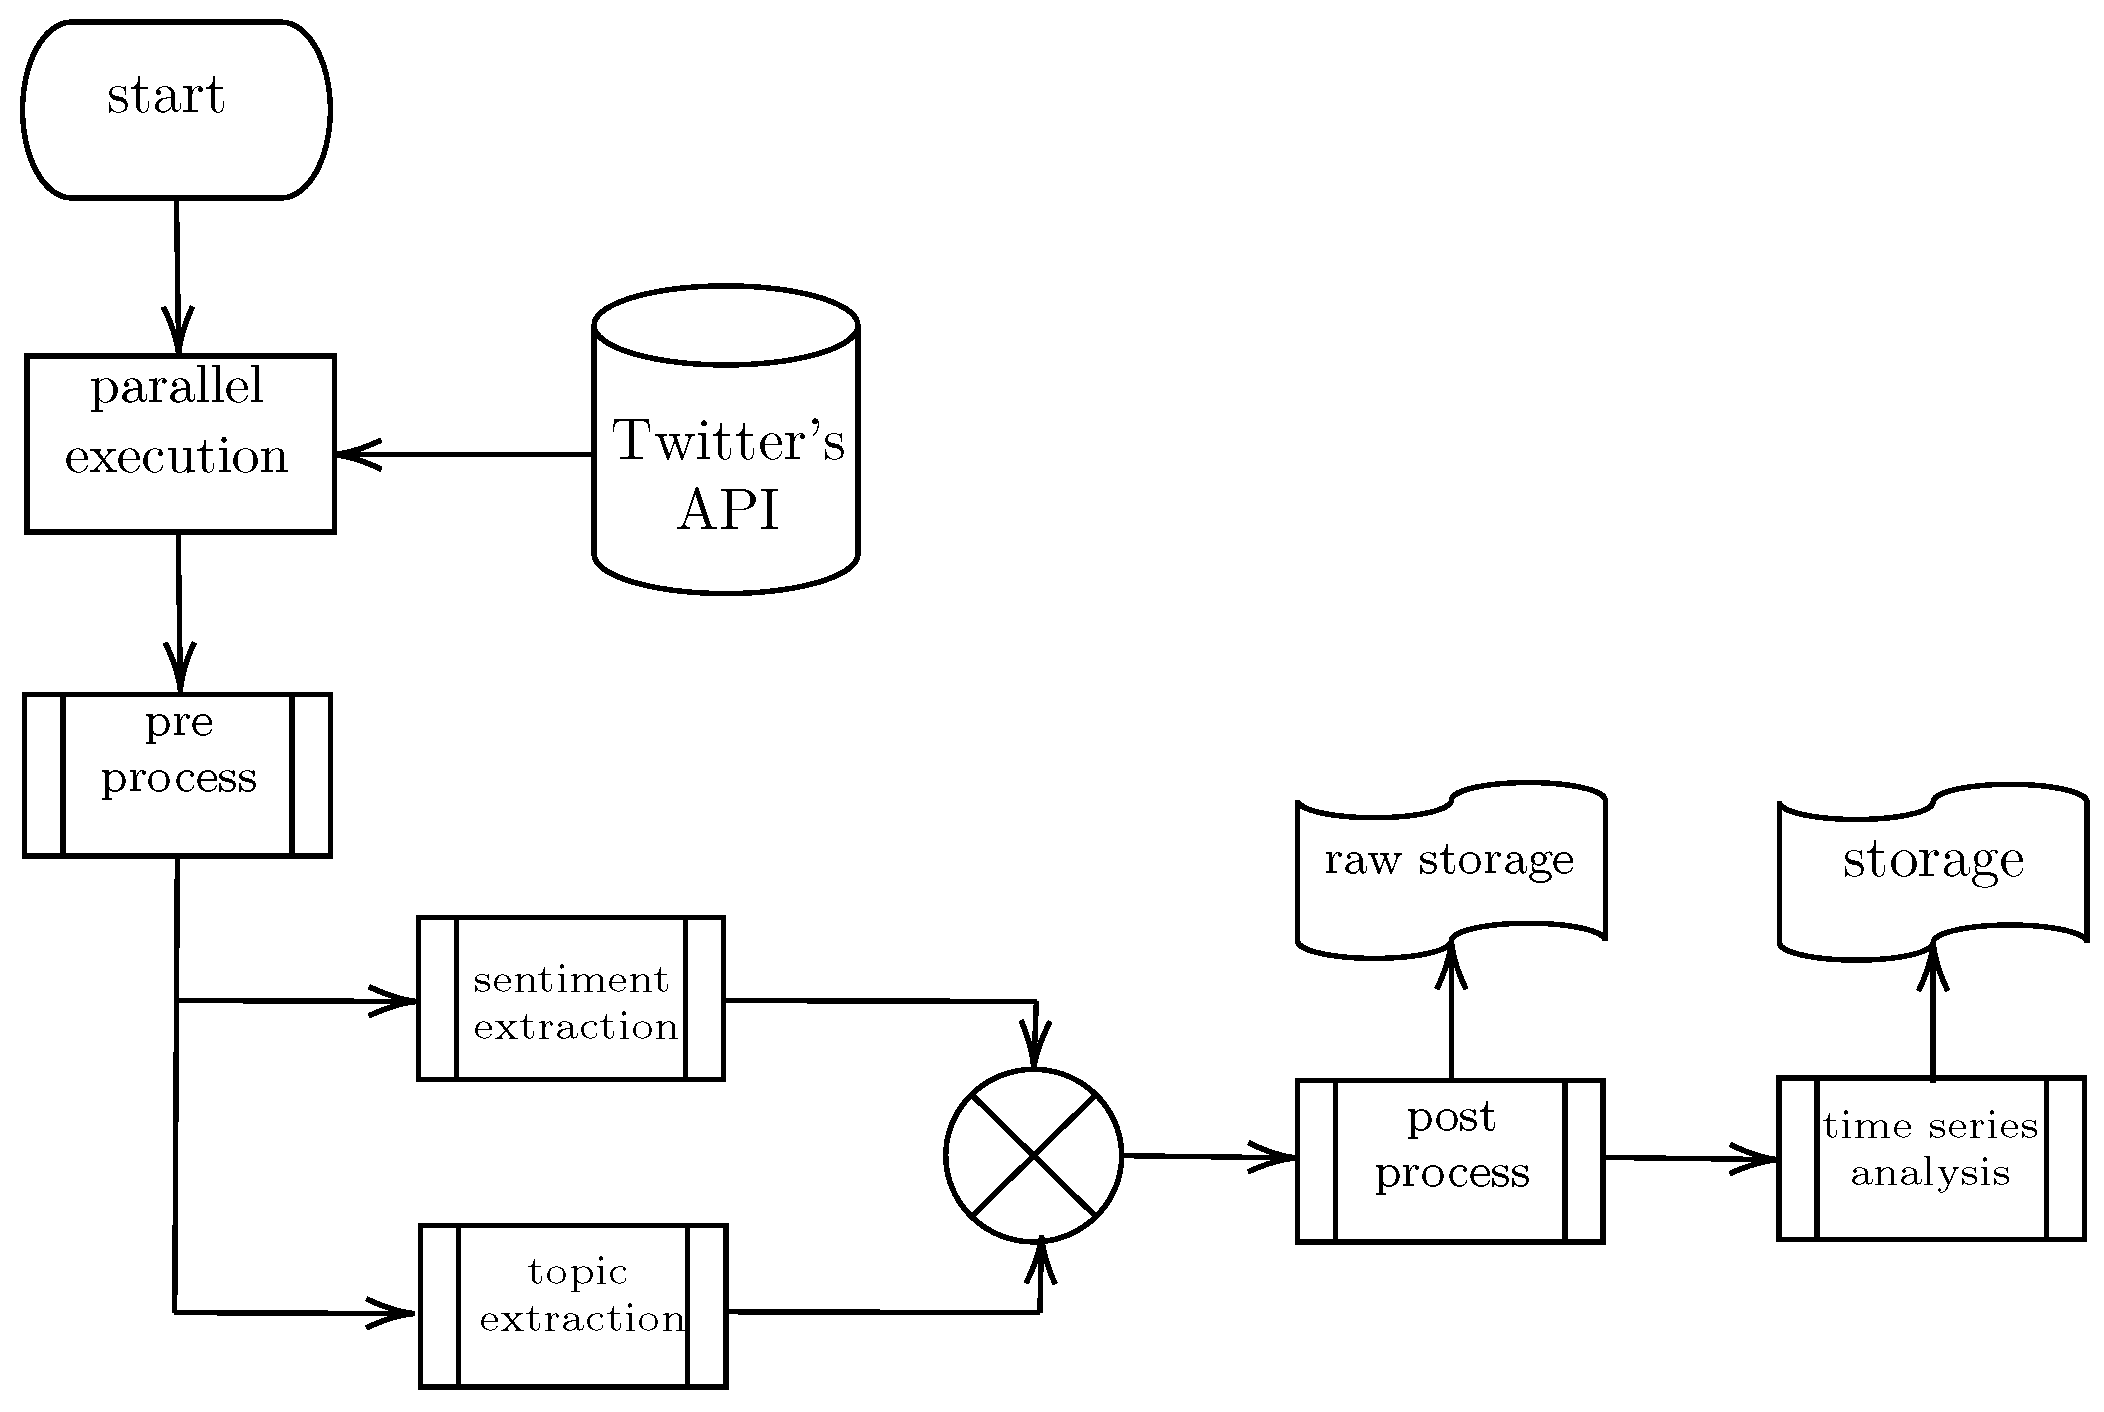
Figure 1 shows the data ingestion pipeline, for which we used the regular lookup V2 API. Note that the resulting sample size for the dataset was quite large, consisting of
n = 2,142,800 unique tweets, resulting in an ample sample to perform this analysis. Previous studies, summarized in
Table 2, used large-scale sentiment analysis to accurately predict public mood and how it applied to several domains, including those of emotional and psychological well-being [
29].
Natural language processing has recently seen novel architectures implement language models, increasing robustness and accuracy for several natural language tasks, such as sentiment polarity determination. These implementations, particularly those compared in this work, are listed in
Table 1. All implementations use nonlinear statistical models as language representations, in different ways, from vast attention-based deep learning architectures to more straightforward dictionary-based implementations, such as VADER. These are the language models evaluated in this work, and we briefly describe each. VADER [
8] is an open-source rule-based robust language model that can handle complex grammar structures commonly employed in social networks. VADER is reliable, fast to deploy, and needs few resources to evaluate new text entries. However, for training, it utilizes a curated corpus evaluated by humans, making adapting it, or incorporating new data, a difficult task. BERTweet [
9] is based on BERT [
10], using a pretraining procedure similar to that utilized by RoBERTa [
11] and uses publicly available Tweets in English for training and evaluation. TweetEval [
13] already has scored and compared both BERTweet and RoBERTa, finding better performance in this particular task in the former. Both provide a robust language model, which is enormous both in size and evaluation resources needed. Still, we can quickly update the model if required by exploiting pretraining and multilanguage support. TimeLMs [
12] introduces a time concept into the language model by utilizing continuous learning, gaining the ability to account for both future and out-of-distribution tweets the model might encounter. The TimeLMs language model also uses publicly available tweets in English for training and evaluation. This results in a robust language model that prefers novel entries and can deal with out-of-distribution evaluations. However, it is susceptible to adversary attacks, and its performance can fall over time. Although we can mitigate this issue by following standard MLops practices, this last language model is not part of this study.
TweetEval [
13] proposes a metric comparing multiple language models with each other, evaluated using a properly curated corpus provided by SemEval [
15], from which we obtained the intrinsic measurements for all models except VADER, for which [
14] calculated its measurement. This strategy is appropriate as TweetEval uses a standardized protocol consisting of seven NLP tasks, one being sentiment analysis, and uses Twitter corpora to train the models. It also provides a single global metric, which is handy though somewhat straightforward, as it averages the scores for each task [
30]. The scoring used standard averaged F1 scores, an harmonic mean of precision and recall defined by Equation (
1), for most tasks except sentiment analysis, which relies on recall alone. The results for the sentiment analysis task are in
Table 1, along with a small summary of the models. However, while there is extensive use of Twitter corpora in training these language models, the measurements are still considered to be intrinsic, which leaves the question of the performance of these models over real-world data open. This remains true even if the data in question are another Twitter corpora.
For the time series analysis, we employed a similar methodology to that of [
2], presented next. We consumed data using the Twitter public API, which were then stored in hard storage, triggering change events that fed the entries into a data pipeline, making it easy to swap them for near-real-time tweet streams. Data were then cleaned and stored in a sizeable non-SQL database, from which we queried data for exploration, experimentation, or model training. Once again, we used data triggers to feed them into the sentiment polarity calculator, ending in another large non-SQL database instance. This final instance was a source for aggregation and analysis, from which we could calculate daily aggregates. For the time series analysis, we started by denoising the series. We opted for a moving average of seven days as we also found solid weekly seasonality in the data. Next, the data were detrended by fitting a regular time series model. Several partial autocorrelation tests were performed to find a good initial parameter approximation and validate the model. The residuals and the box tests revealed a good fit of the model, resulting in a
for the sentiment polarities calculated by all models. These steps were repeated for several aggregation statistics, keeping the mean and the standard deviation relevant, as they summarized the behavior observed in the data well. More details are available in the
Experiments section.
This study also followed the technical implementation suggested by [
2], as it is easy to replicate and flexible enough to alter without significant changes for our purposes. The system was implemented on top of Google cloud services (GCP), allowing a tight
TensorFlow integration, loose coupling, and dynamic scaling, and was written in
Python 3.6, with its data-focused libraries, such as
TensorFlow. Using this technology allowed the integration of MLops practices, making it easy to update models.
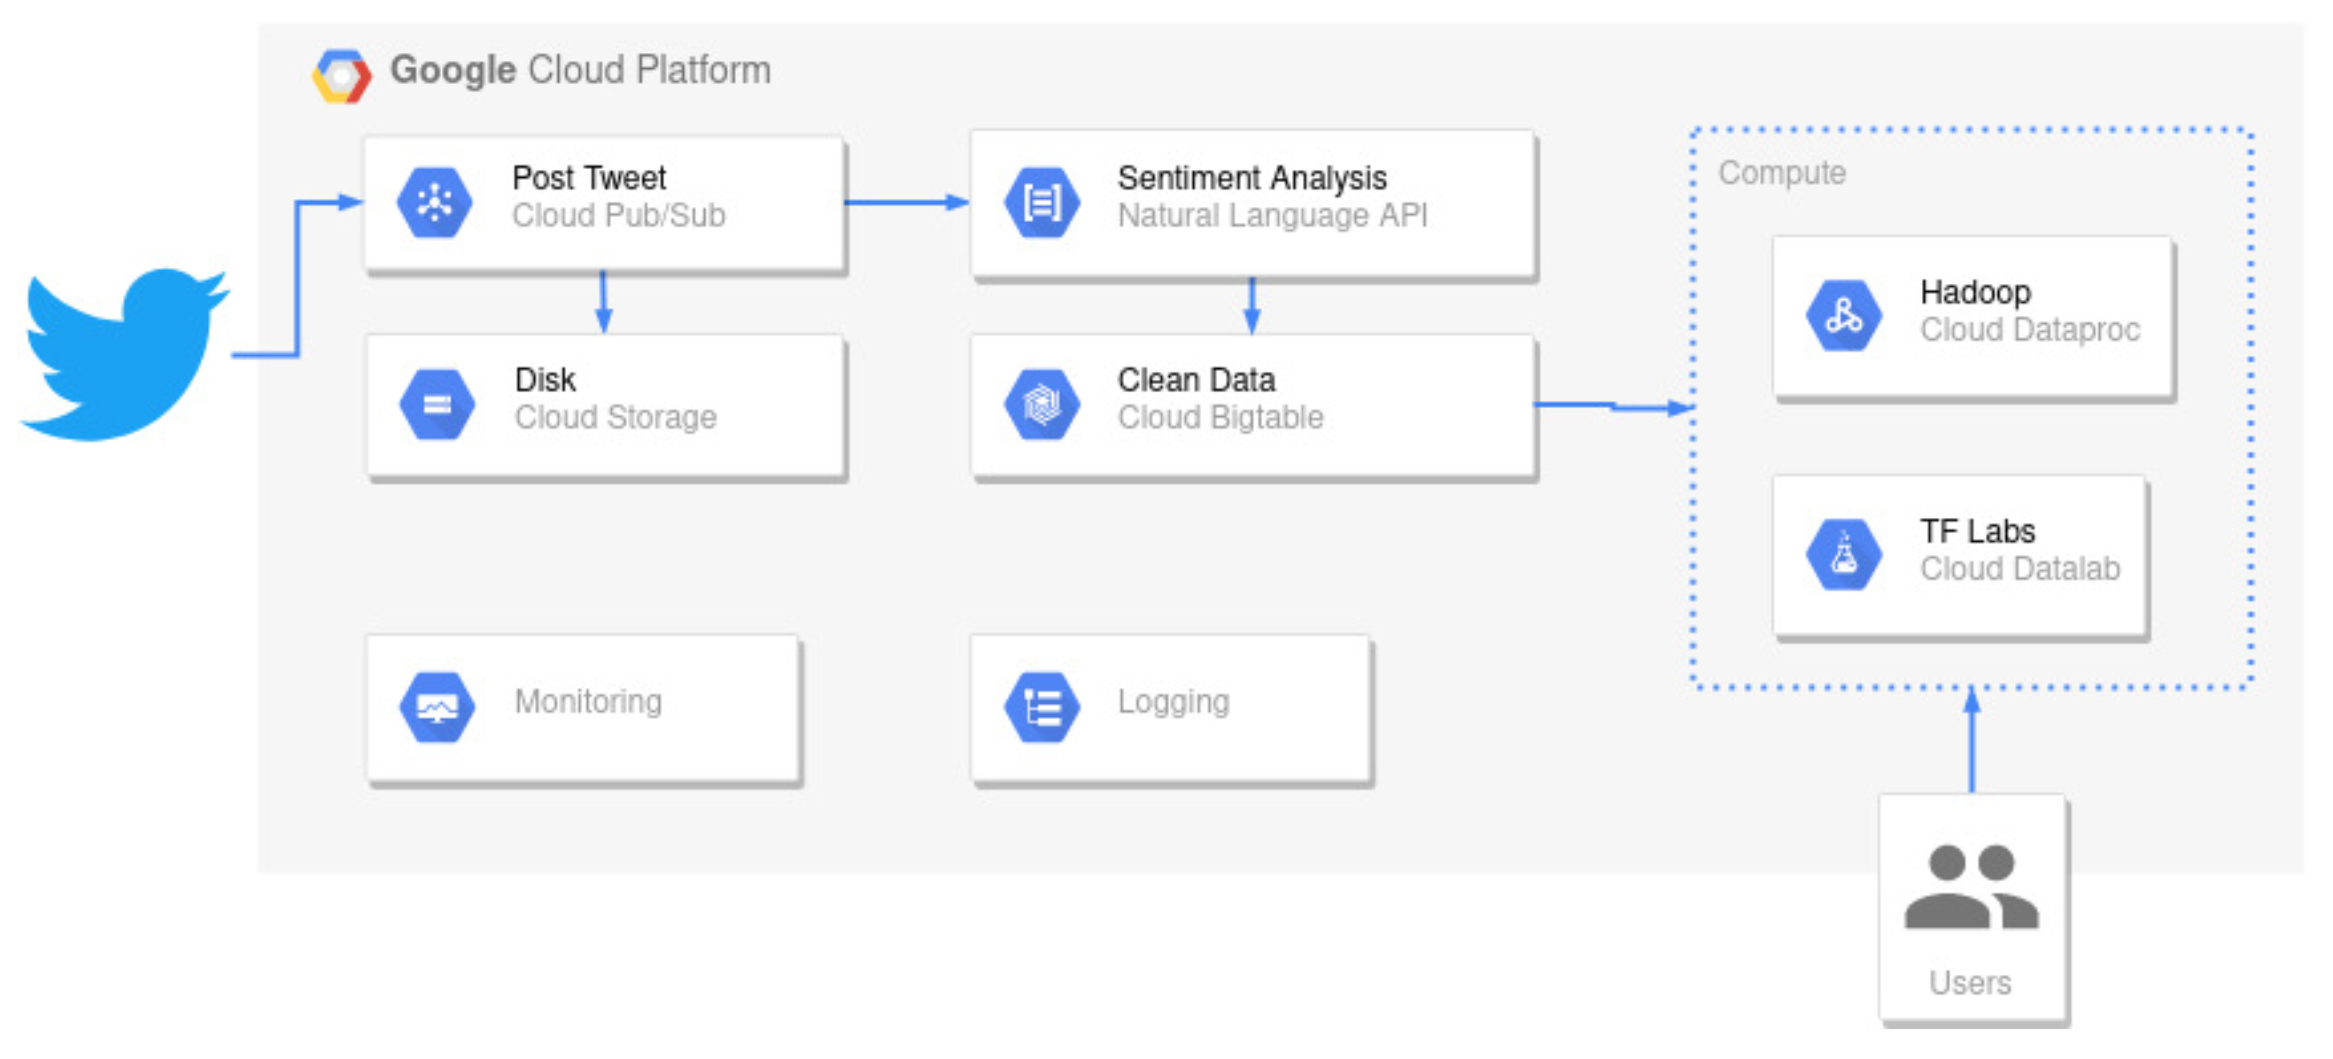
Figure 2 shows an overview of this technical architecture. The general flow is as follows:
- (1)
Data are ingested directly from Twitter, using the identifiers provided by the COVID-19 Twitter chatter dataset and the general query API provided by Twitter.
- (2)
We then publish the tweet in Pub/Sub, which is written directly in cloud storage for future reference and debugging.
- (3)
Pub/Sub feeds this data entry into a serverless function, which then evaluates the tweet polarity using: VADER [
8], BERTweet [
9], and RoBERTa [
11] implementations, all of them written in Python and
TensorFlow, and post the results again in
Pub/Sub to be fed into
BigTable for final consumption.
- (4)
The data are now ready for consumption by a managed Dataproc instance with two different approaches:
- (a)
One where we execute periodic batch jobs to calculate the daily aggregations, stored in cloud storage and BigTable for easy access.
- (b)
Another is where we publish dynamic and executable Jupyter notebooks for manual data exploration.
Regarding the time series, VADER uses a composed metric obtained by normalizing both the positive and negative scores and using an external factor to better approximate a 1 to −1 distribution [
8],
where
is the simple addition of positive and negative polarities, and
is initialized as
. We need to adjust this
for every operation based on a heuristic and the lexicon collected by the language model. This alone gives us a clue regarding the differences found in the time series, for the deep-neural-network-based language models implement a
layer that already provides this normalization for us. However, we considered this difference by adjusting the results accordingly, calculating the
used by VADER to replicate its distribution approximation used for normalization. Although this would not be necessary for either BERTweet or RoBERTa, as the deep learning network uses a
layer to calculate this distribution, we wanted to match the methodology as much as possible. Still, it is something to keep in mind moving forward.
With these adjustments in place, we generated the time series using a rolling average of 7 days to denoise the data, which we found to work best, and it was aligned with the seasonality found [
31] while also matching the strong weekly seasonality found in this analysis. Then, we detrended the data by fitting a regular time series model. We performed several partial autocorrelation tests to find a good initial parameter approximation and validate the ARIMA model, revealing good results using the residuals, providing seasonality and trends. Although there was a precise offset in the data, the model fit, trends, and seasonality followed by the time series were similar. We confirmed this by conducting a simple Pearson correlation test, which yielded low correlation levels on the time series with the lag present, which was not an issue in our case. We present more details in the Experiments and Results sections.
3. Experiments
We performed a sentiment analysis on COVID-19-related tweets posted in Mexico from 1 February 2020 to 31 December 2020, forming a corpus of 760,064,879 tweets, which after preprocessing and filtering came to a total of
n = 2,142,890 utilized tweets, retrieved from the
COVID-19 Twitter chatter dataset [
6]. Note that the ranges of polarity values went from
(i.e., entirely negative) to 1 (i.e., completely positive), where 0 was considered a neutral value or an utterly objective tweet (but given that these tweets were for the most part opinions, this was rarely the case). We performed this sentiment polarity determination using three language models: VADER, BERTweet, and RoBERTa.
Table 3 presents a monthly summary of the sentiment polarity for a given month, but the analysis was performed with daily granularity.
We calculated a smoothed time series, where the box-test showed a
for all models, indicating a high probability of encountering autocorrelations in the data. This led to a further exploration using a partial ACF (auto correlation function). These ACF values are reported in the
Appendix A. Here, we observed strong indications of weekly autocorrelations, which helped us quickly find the correct coefficients for fitting an ARIMA (autoregressive integrated moving average) model and decomposing the time series. Although the coefficients suggested a substantial similarity in the ARIMA models, there were some differences as well, more noticeable in the VADER model. Thus, we performed a Pearson correlation test for the different language models. These models should present no time lag nor noise in the time dimension, making this test a good candidate as opposed to a more time-consuming and resource-intensive test, such as the dynamic time warping distance [
32].
Table 4 summarizes the Pearson correlation index between the language models for the compound sentiment polarity, while
Table 5 shows the same correlations for the positive polarity only. This shows a strong correlation between BERTweet and RoBERTa, an expected behavior given that both are based on the BERT architecture and use Twitter data for fine-tuning. However, there is a stronger correlation with VADER for the positive polarity. Remember that compound polarity is calculated based on positive and negative polarities, and VADER uses a heuristic-based approximation replicated for both BERTweet and RoBERTa. We executed these experiments in the GCP pipeline described by
Figure 2 using a CPU-only solution for VADER and a GPU configuration for evaluating both BERTweet and RoBERTa. Nevertheless, the time series analysis was evaluated in a CPU-only managed instance inside GCP. A more in-depth analysis and visualizations are presented in the next Section
Results.
4. Results
We performed a sentiment analysis on a corpus of 760,064,879 tweets posted from Mexico from 1 February 2020, to 31 December 2020 in multiple languages, which after preprocessing and filtering came to a total of
n = 2,142,890 utilized tweets, retrieved from the COVID-19 Twitter chatter dataset [
6]. We performed this sentiment polarity determination using three language models, VADER, BERTweet, and RoBERTa. The resulting smoothed time series showed a
, indicating a high probability of encountering autocorrelations in the data. Here, we observed strong indications of weekly autocorrelations, which helped us quickly find the correct coefficients for fitting an ARIMA (autoregressive integrated moving average) model and decomposing the time series. For comparison, we performed the Pearson correlation test, for we did not expect to see any time warping in the time series.
From the
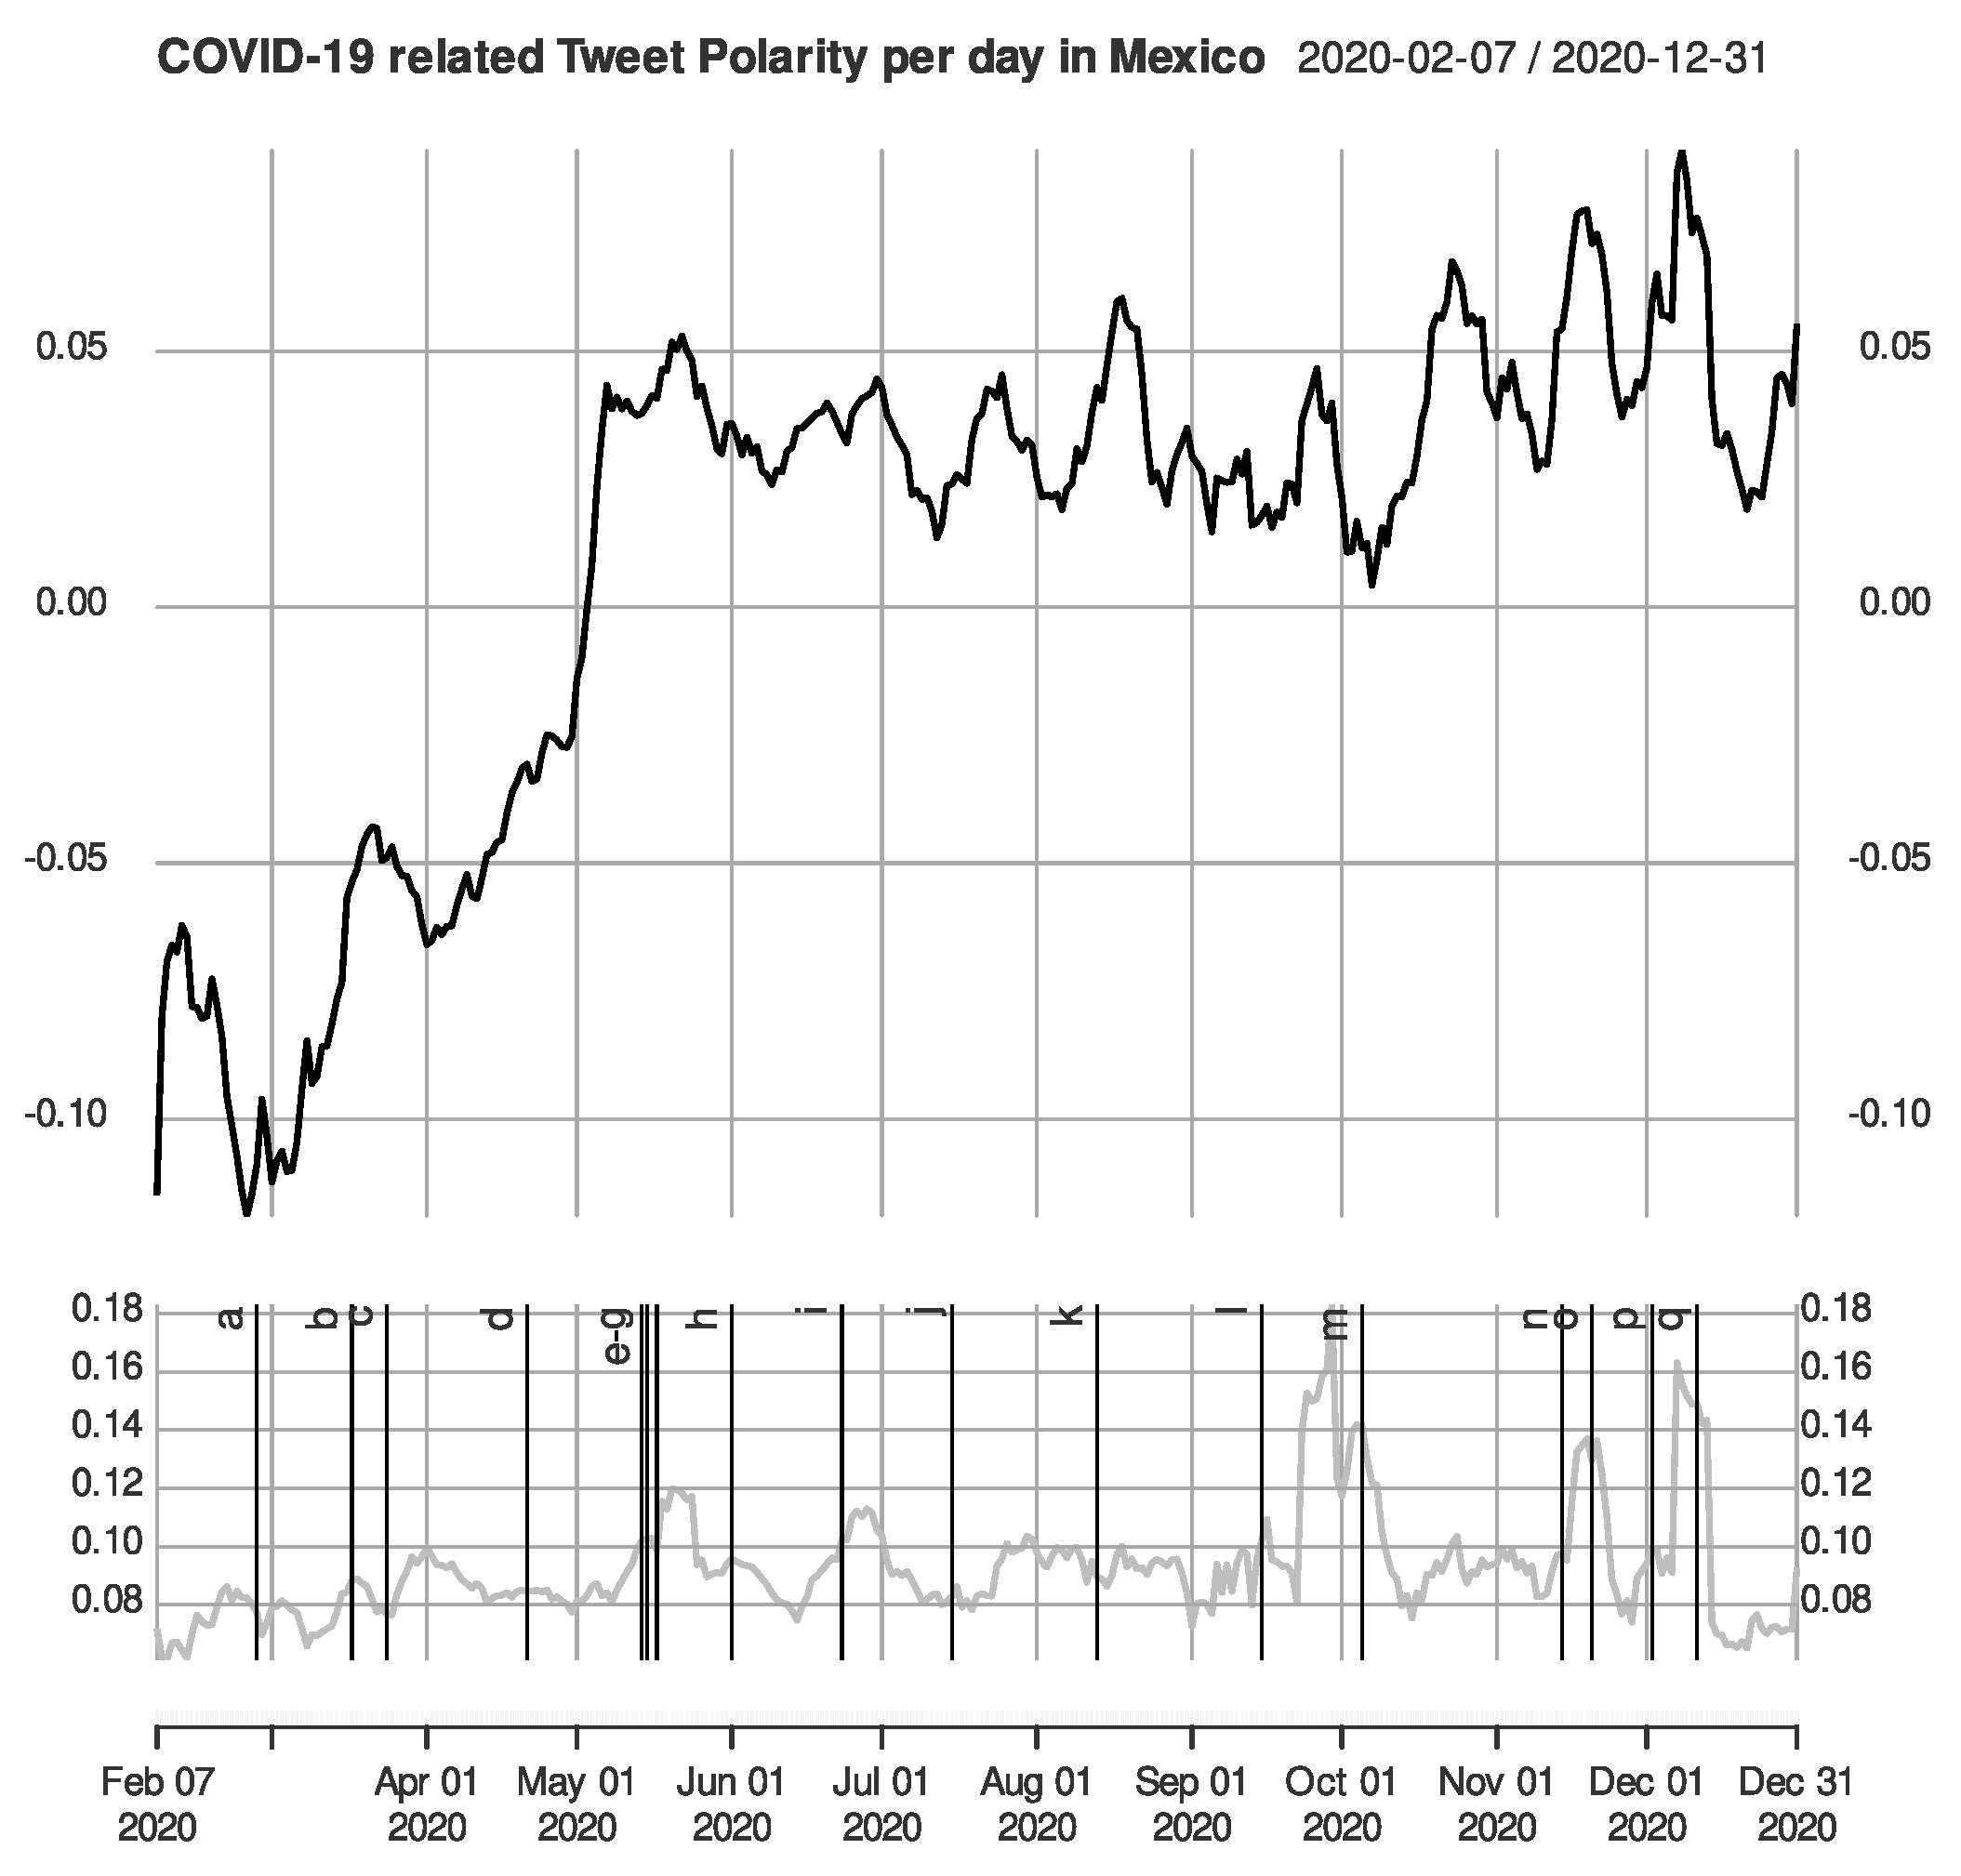
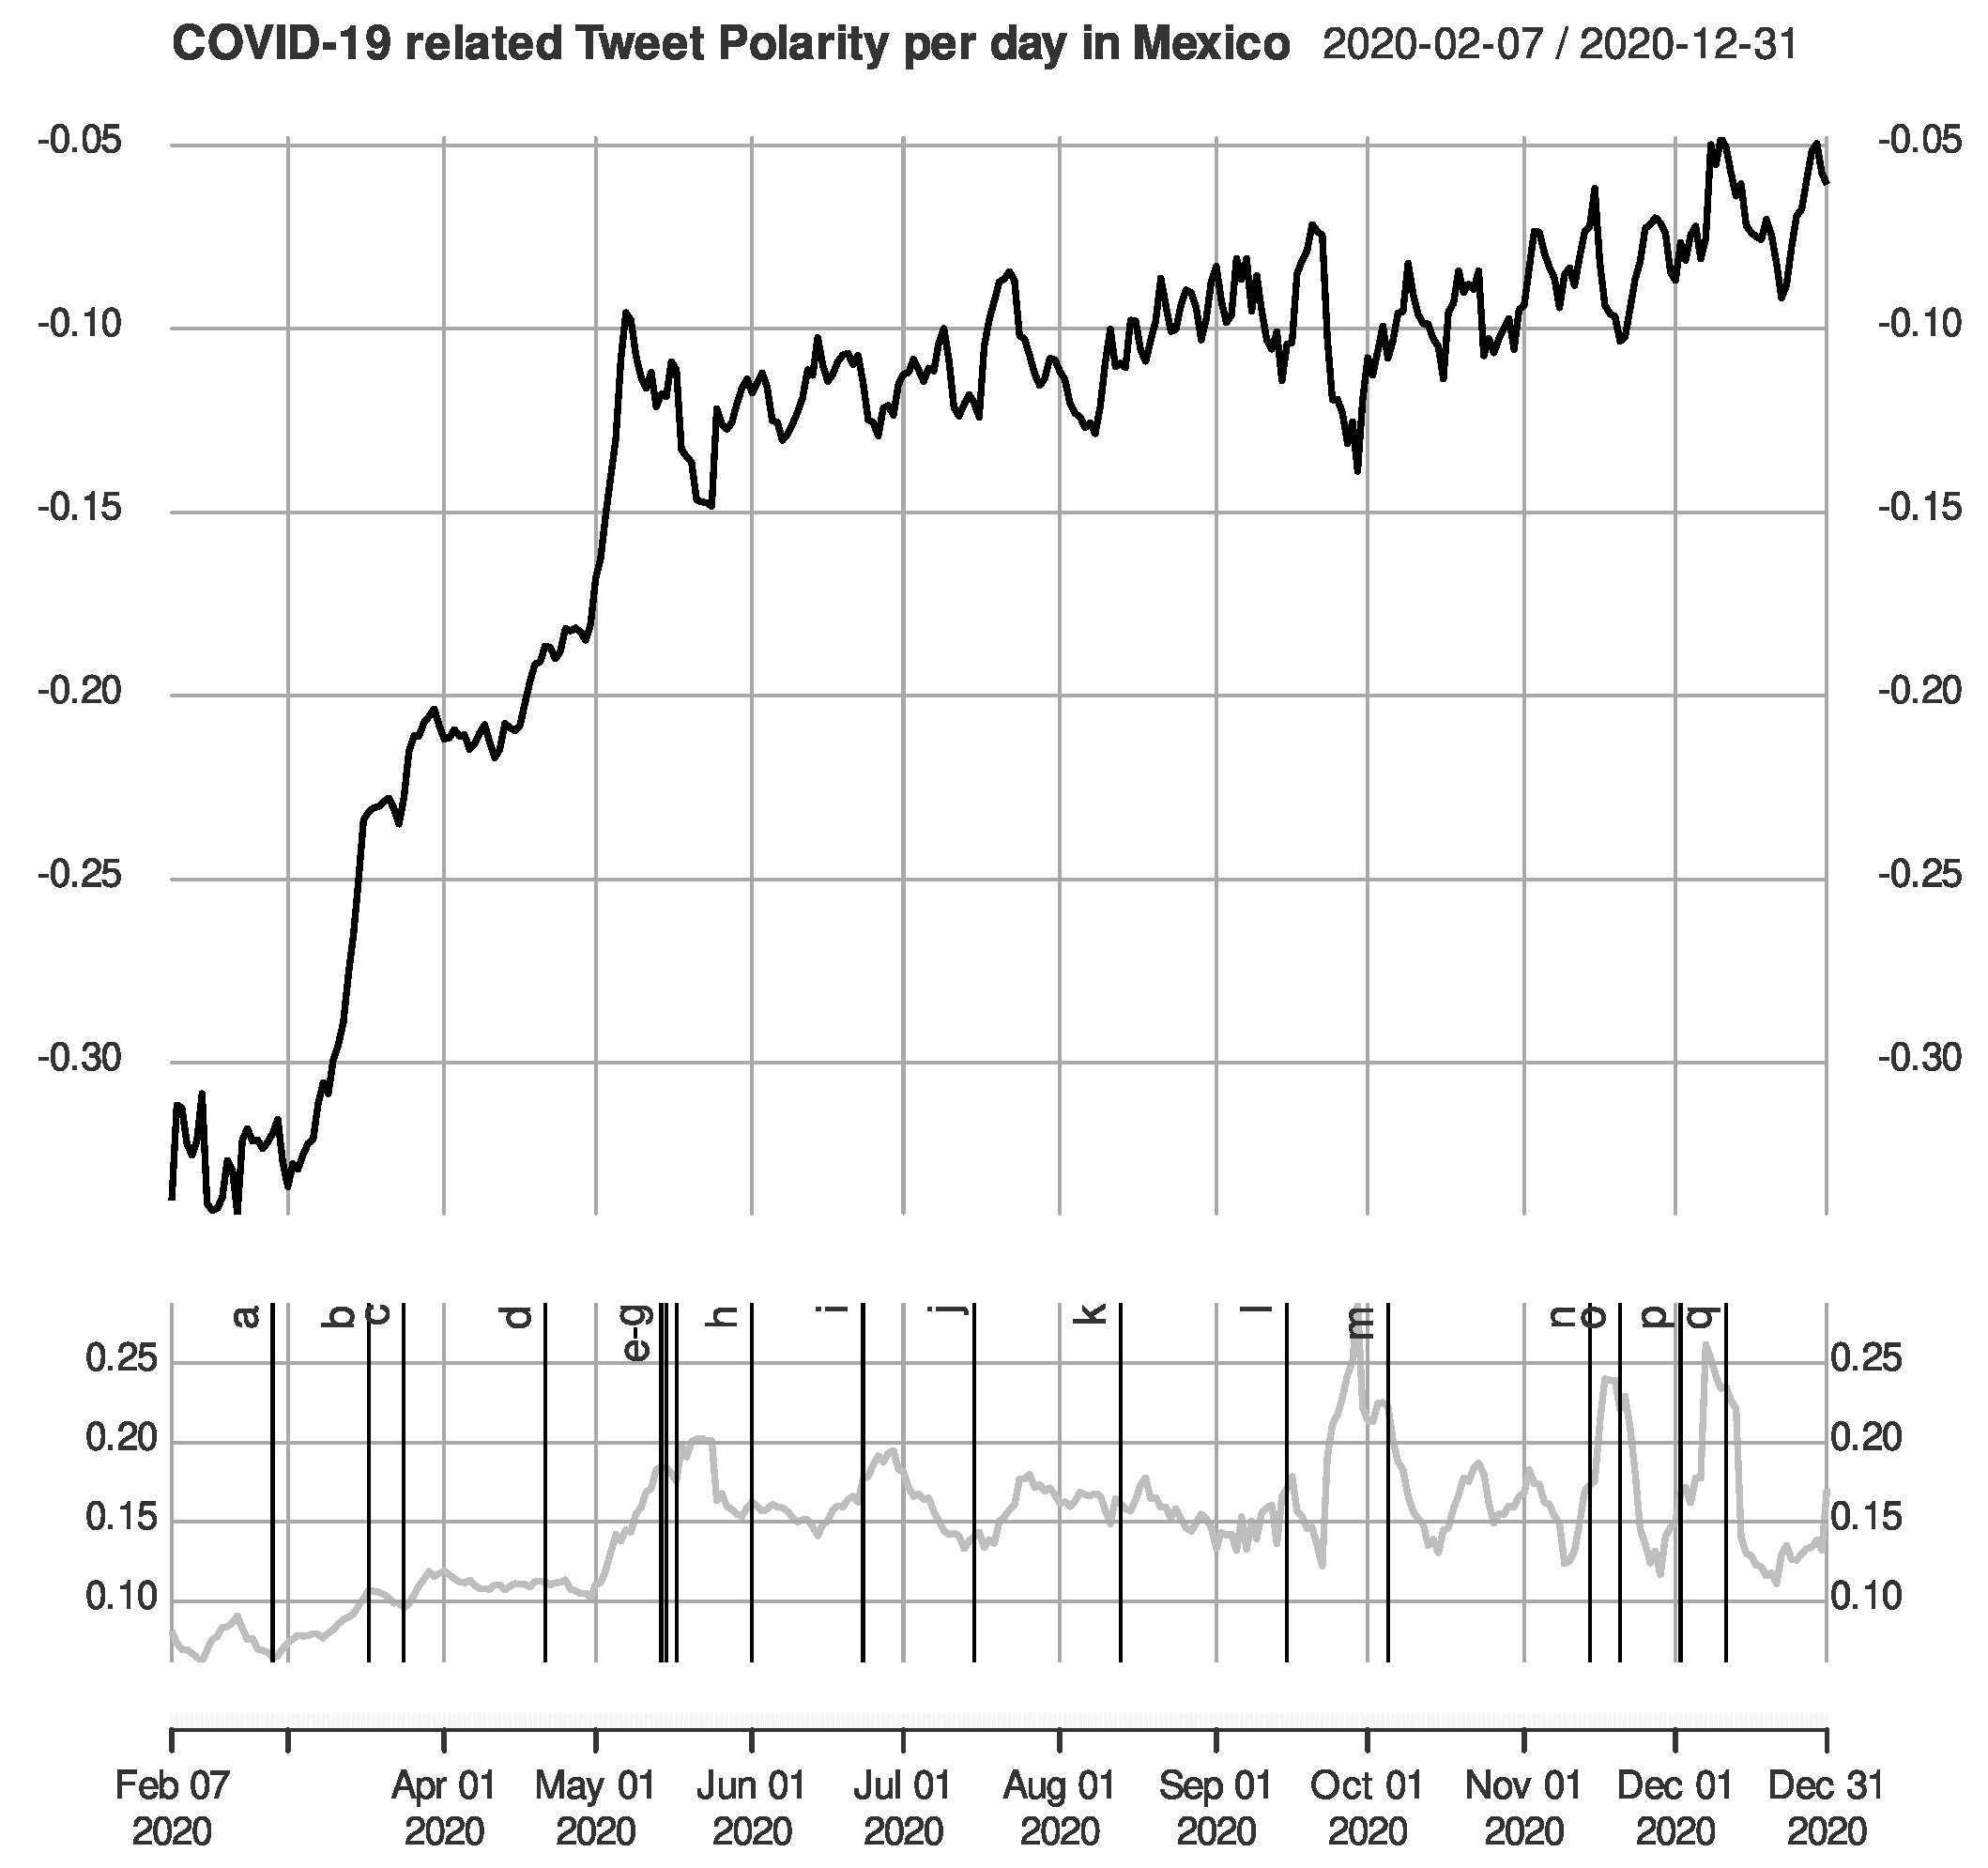
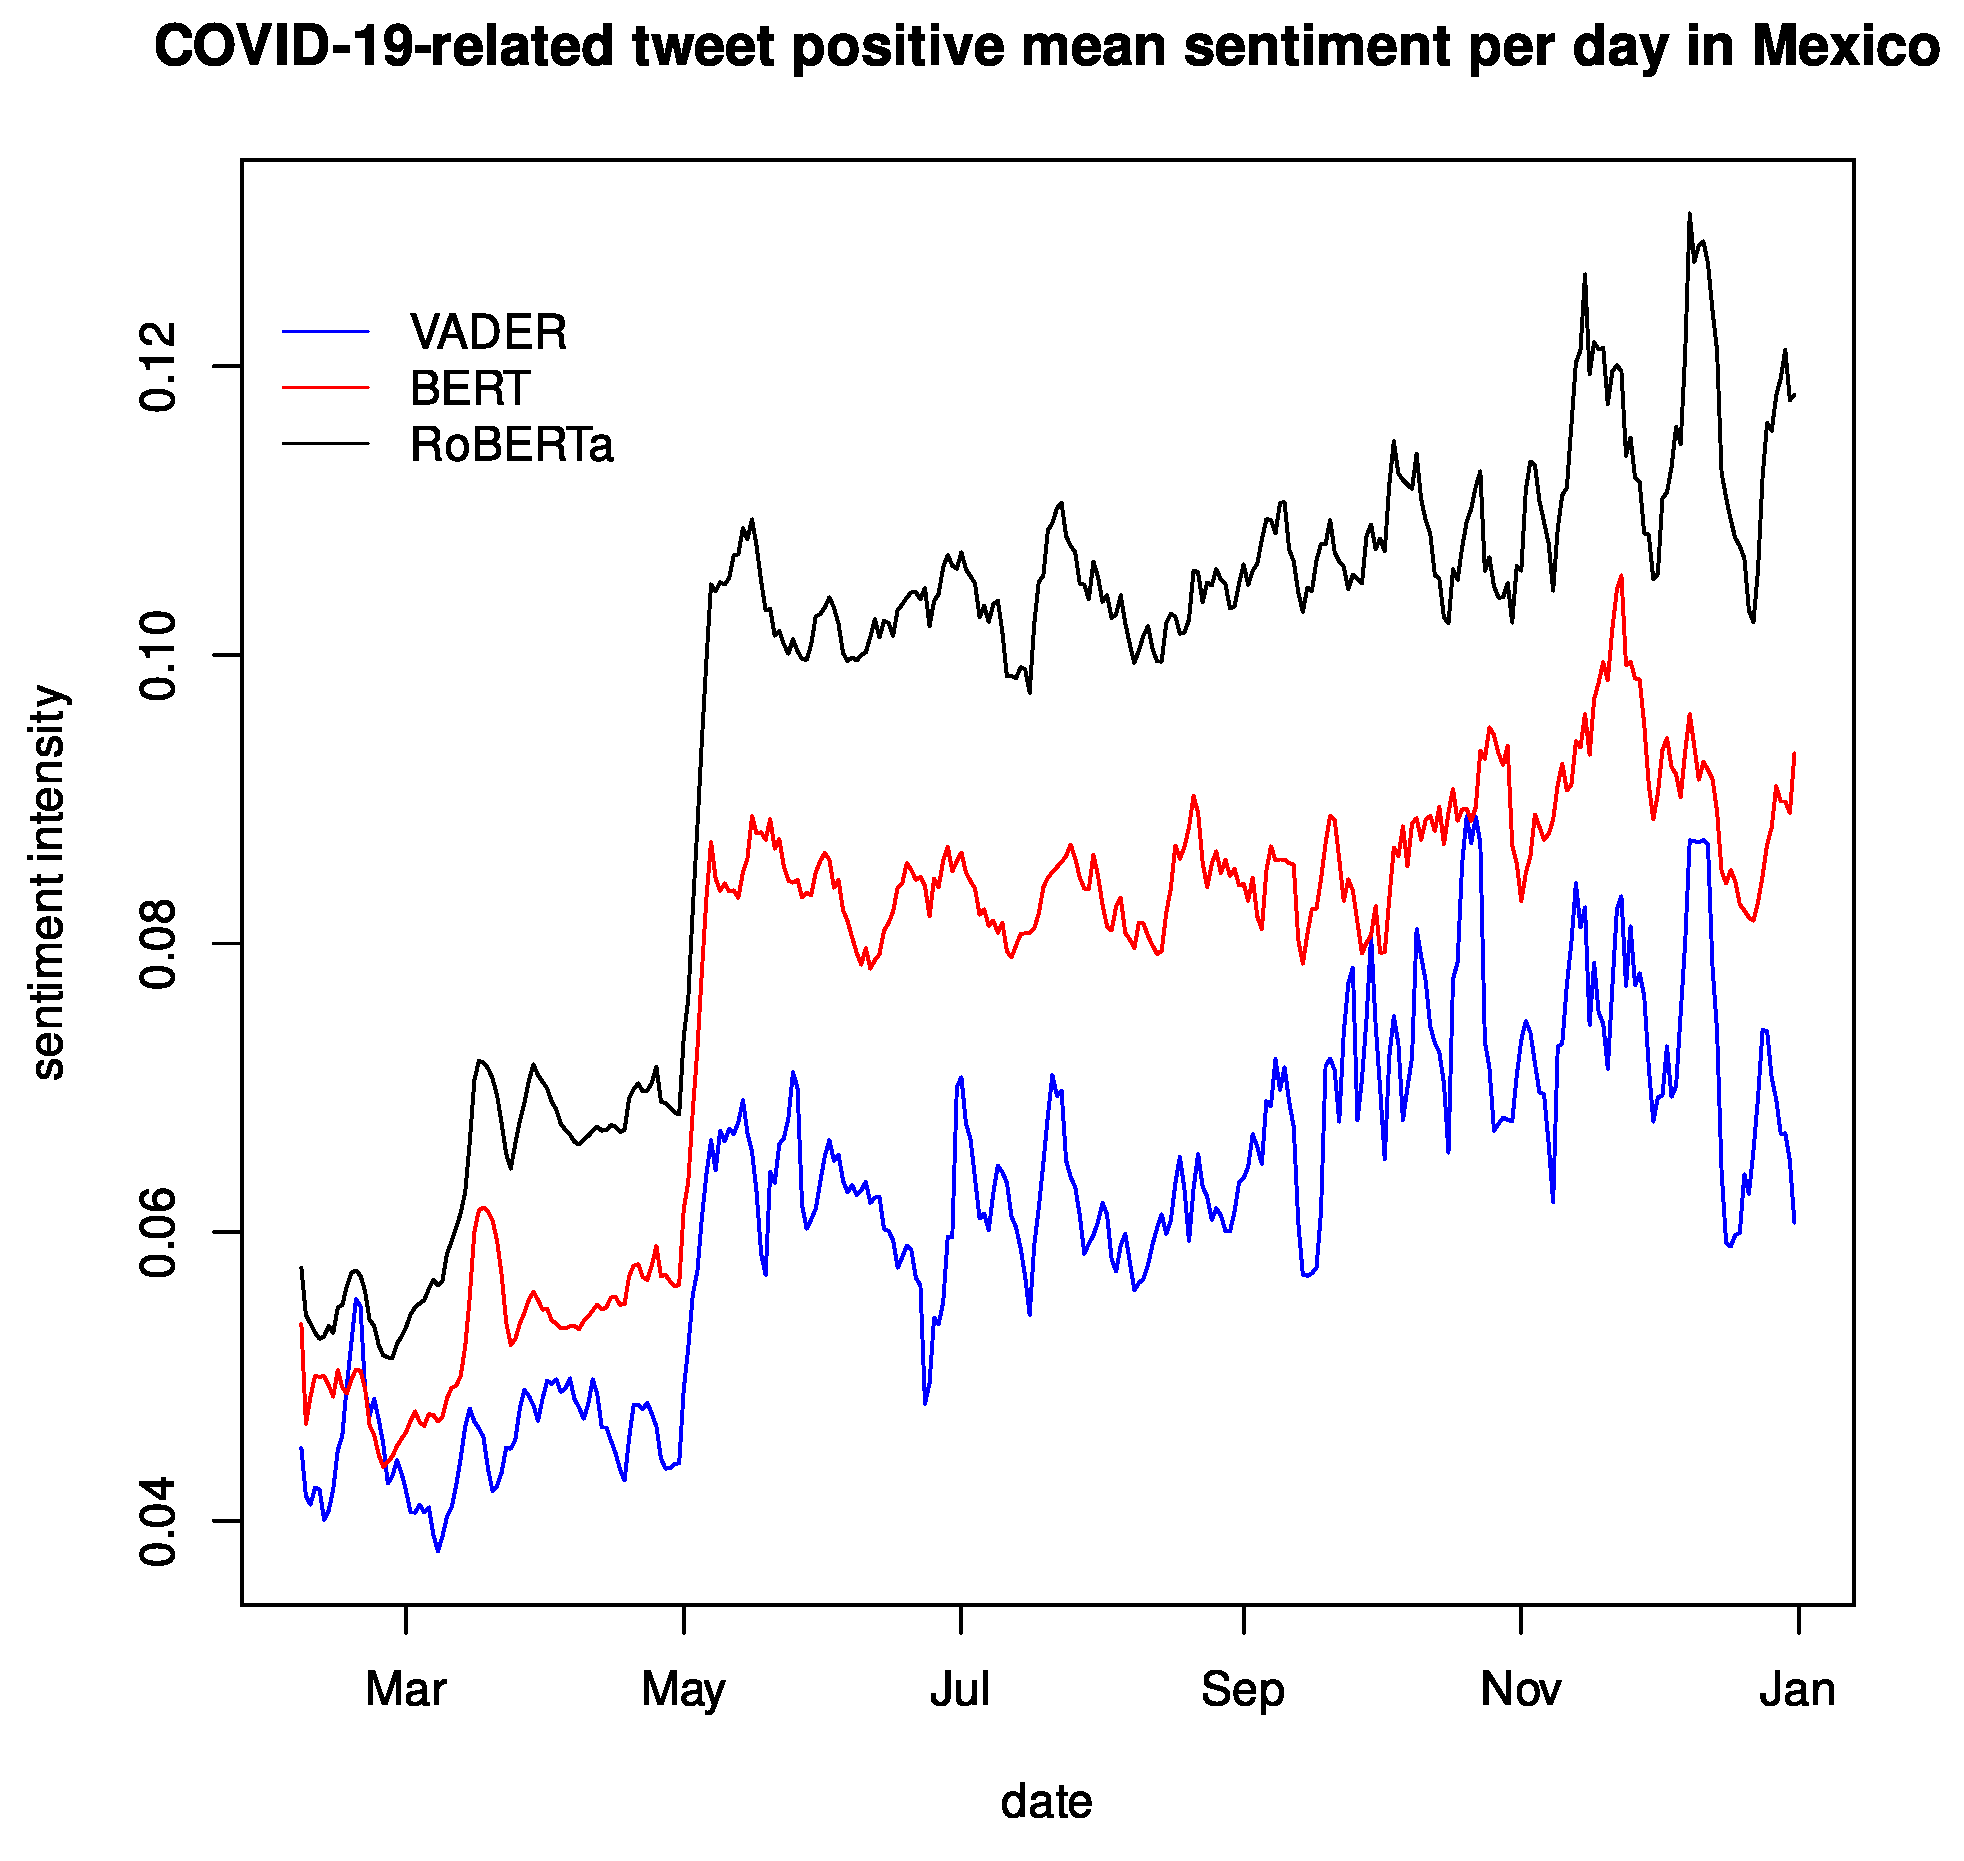
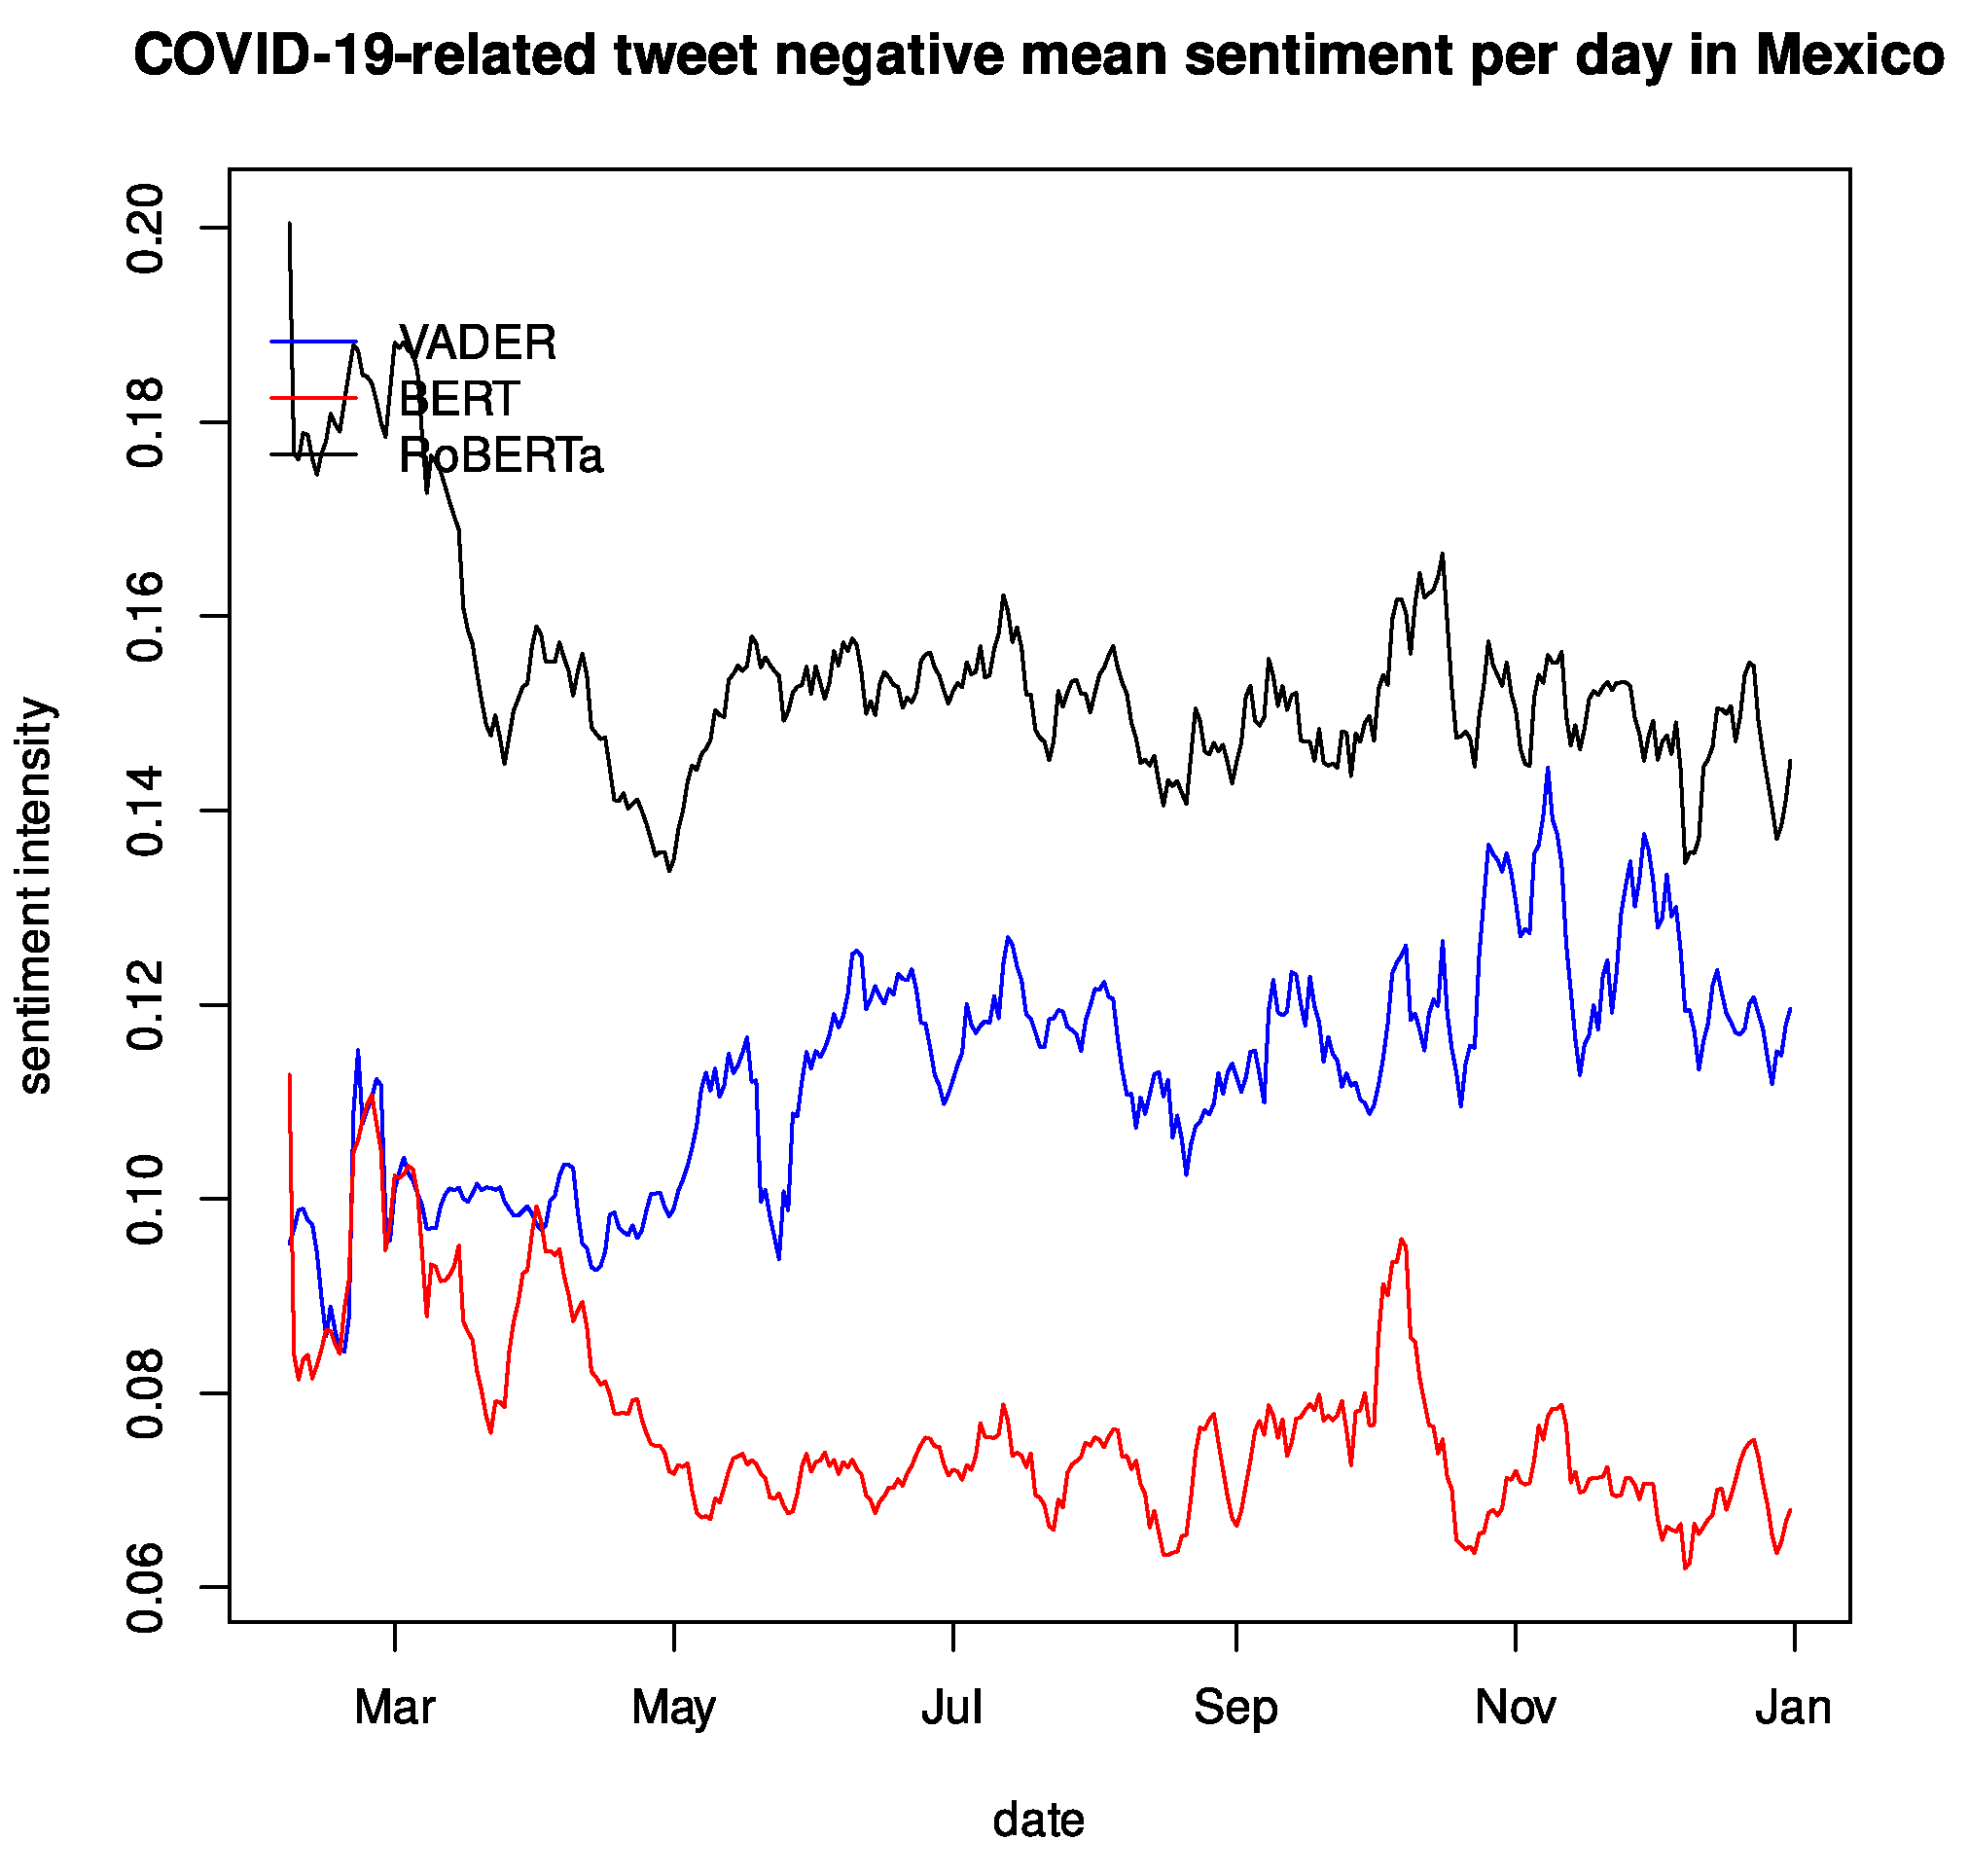
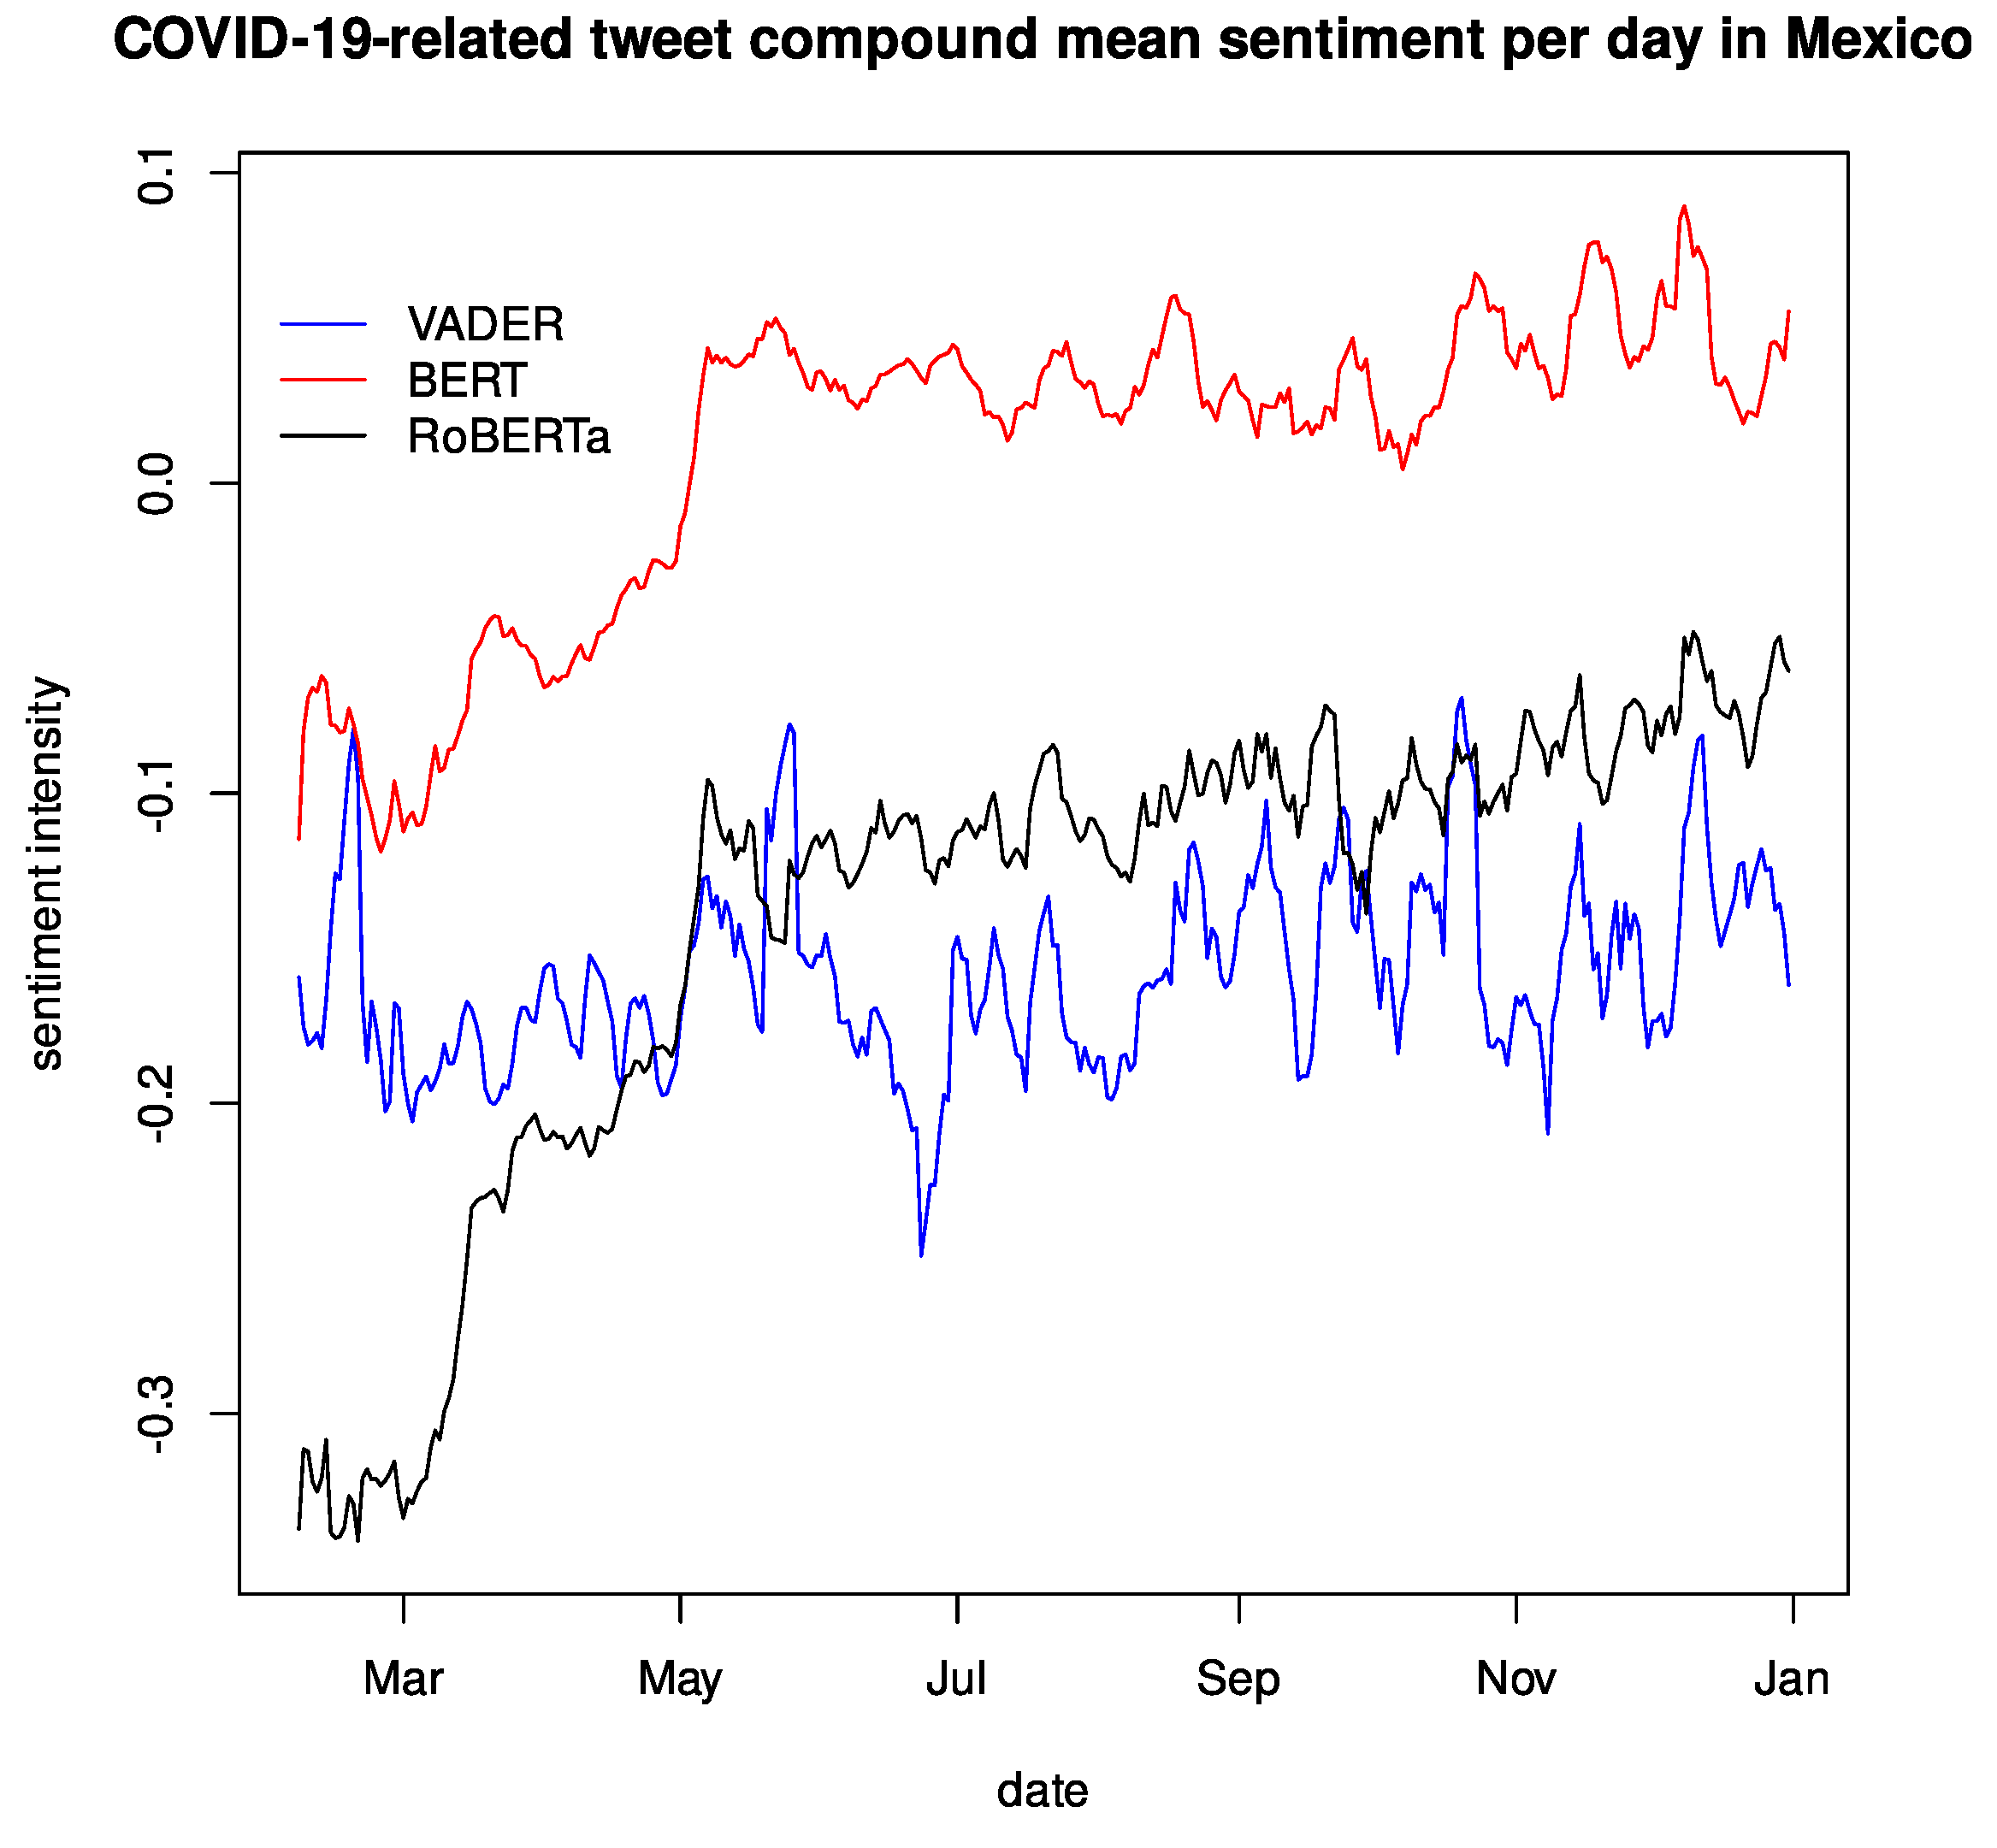
Figure 3,
Figure 4 and
Figure 5, we observe a somewhat similar shape in the data, and all language models agree on the spikes caused by important events or governmental decisions, as reported [
2]. For a detailed list of these events, please refer to [
2], but they were all nationwide events or official announcements regarding COVID-19 by the relevant authorities. While the magnitude is not precisely the same, the spikes exist on similar dates, indicating a “good-enough” sensibility of the measurement tool to repeat the analysis and reach the same conclusions, at least as far as the sensibility of the data to important real-world events.
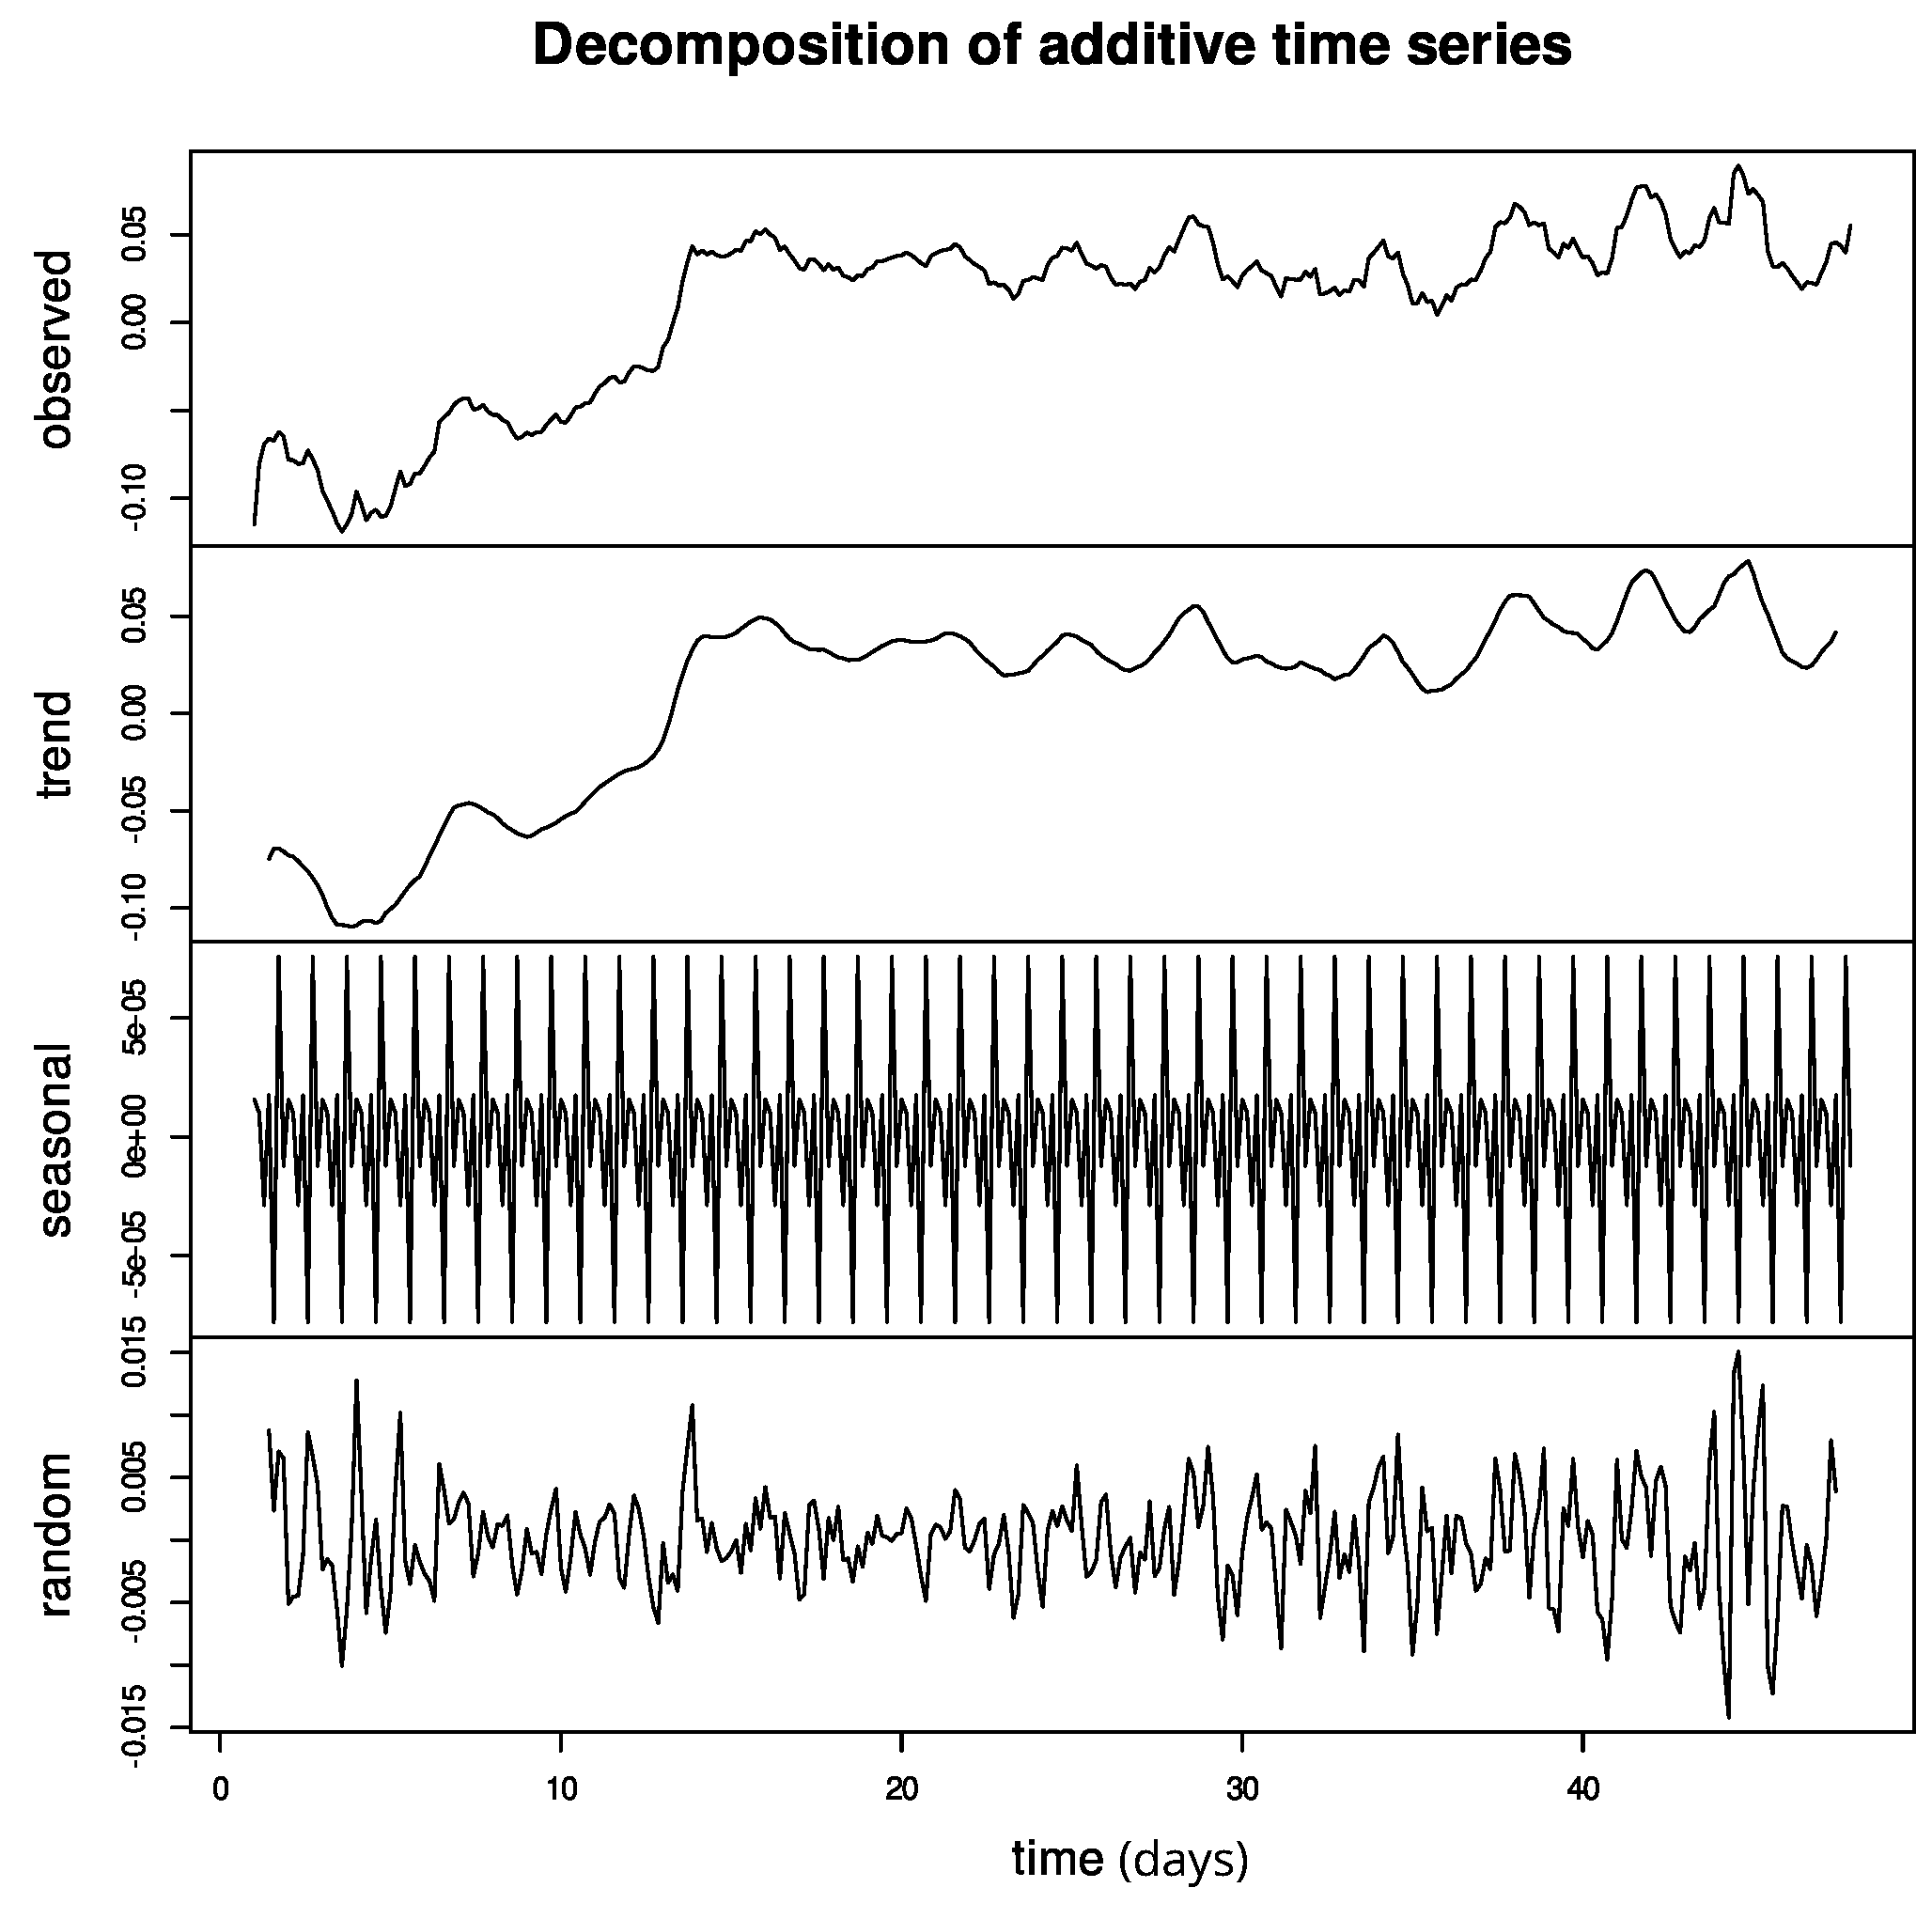
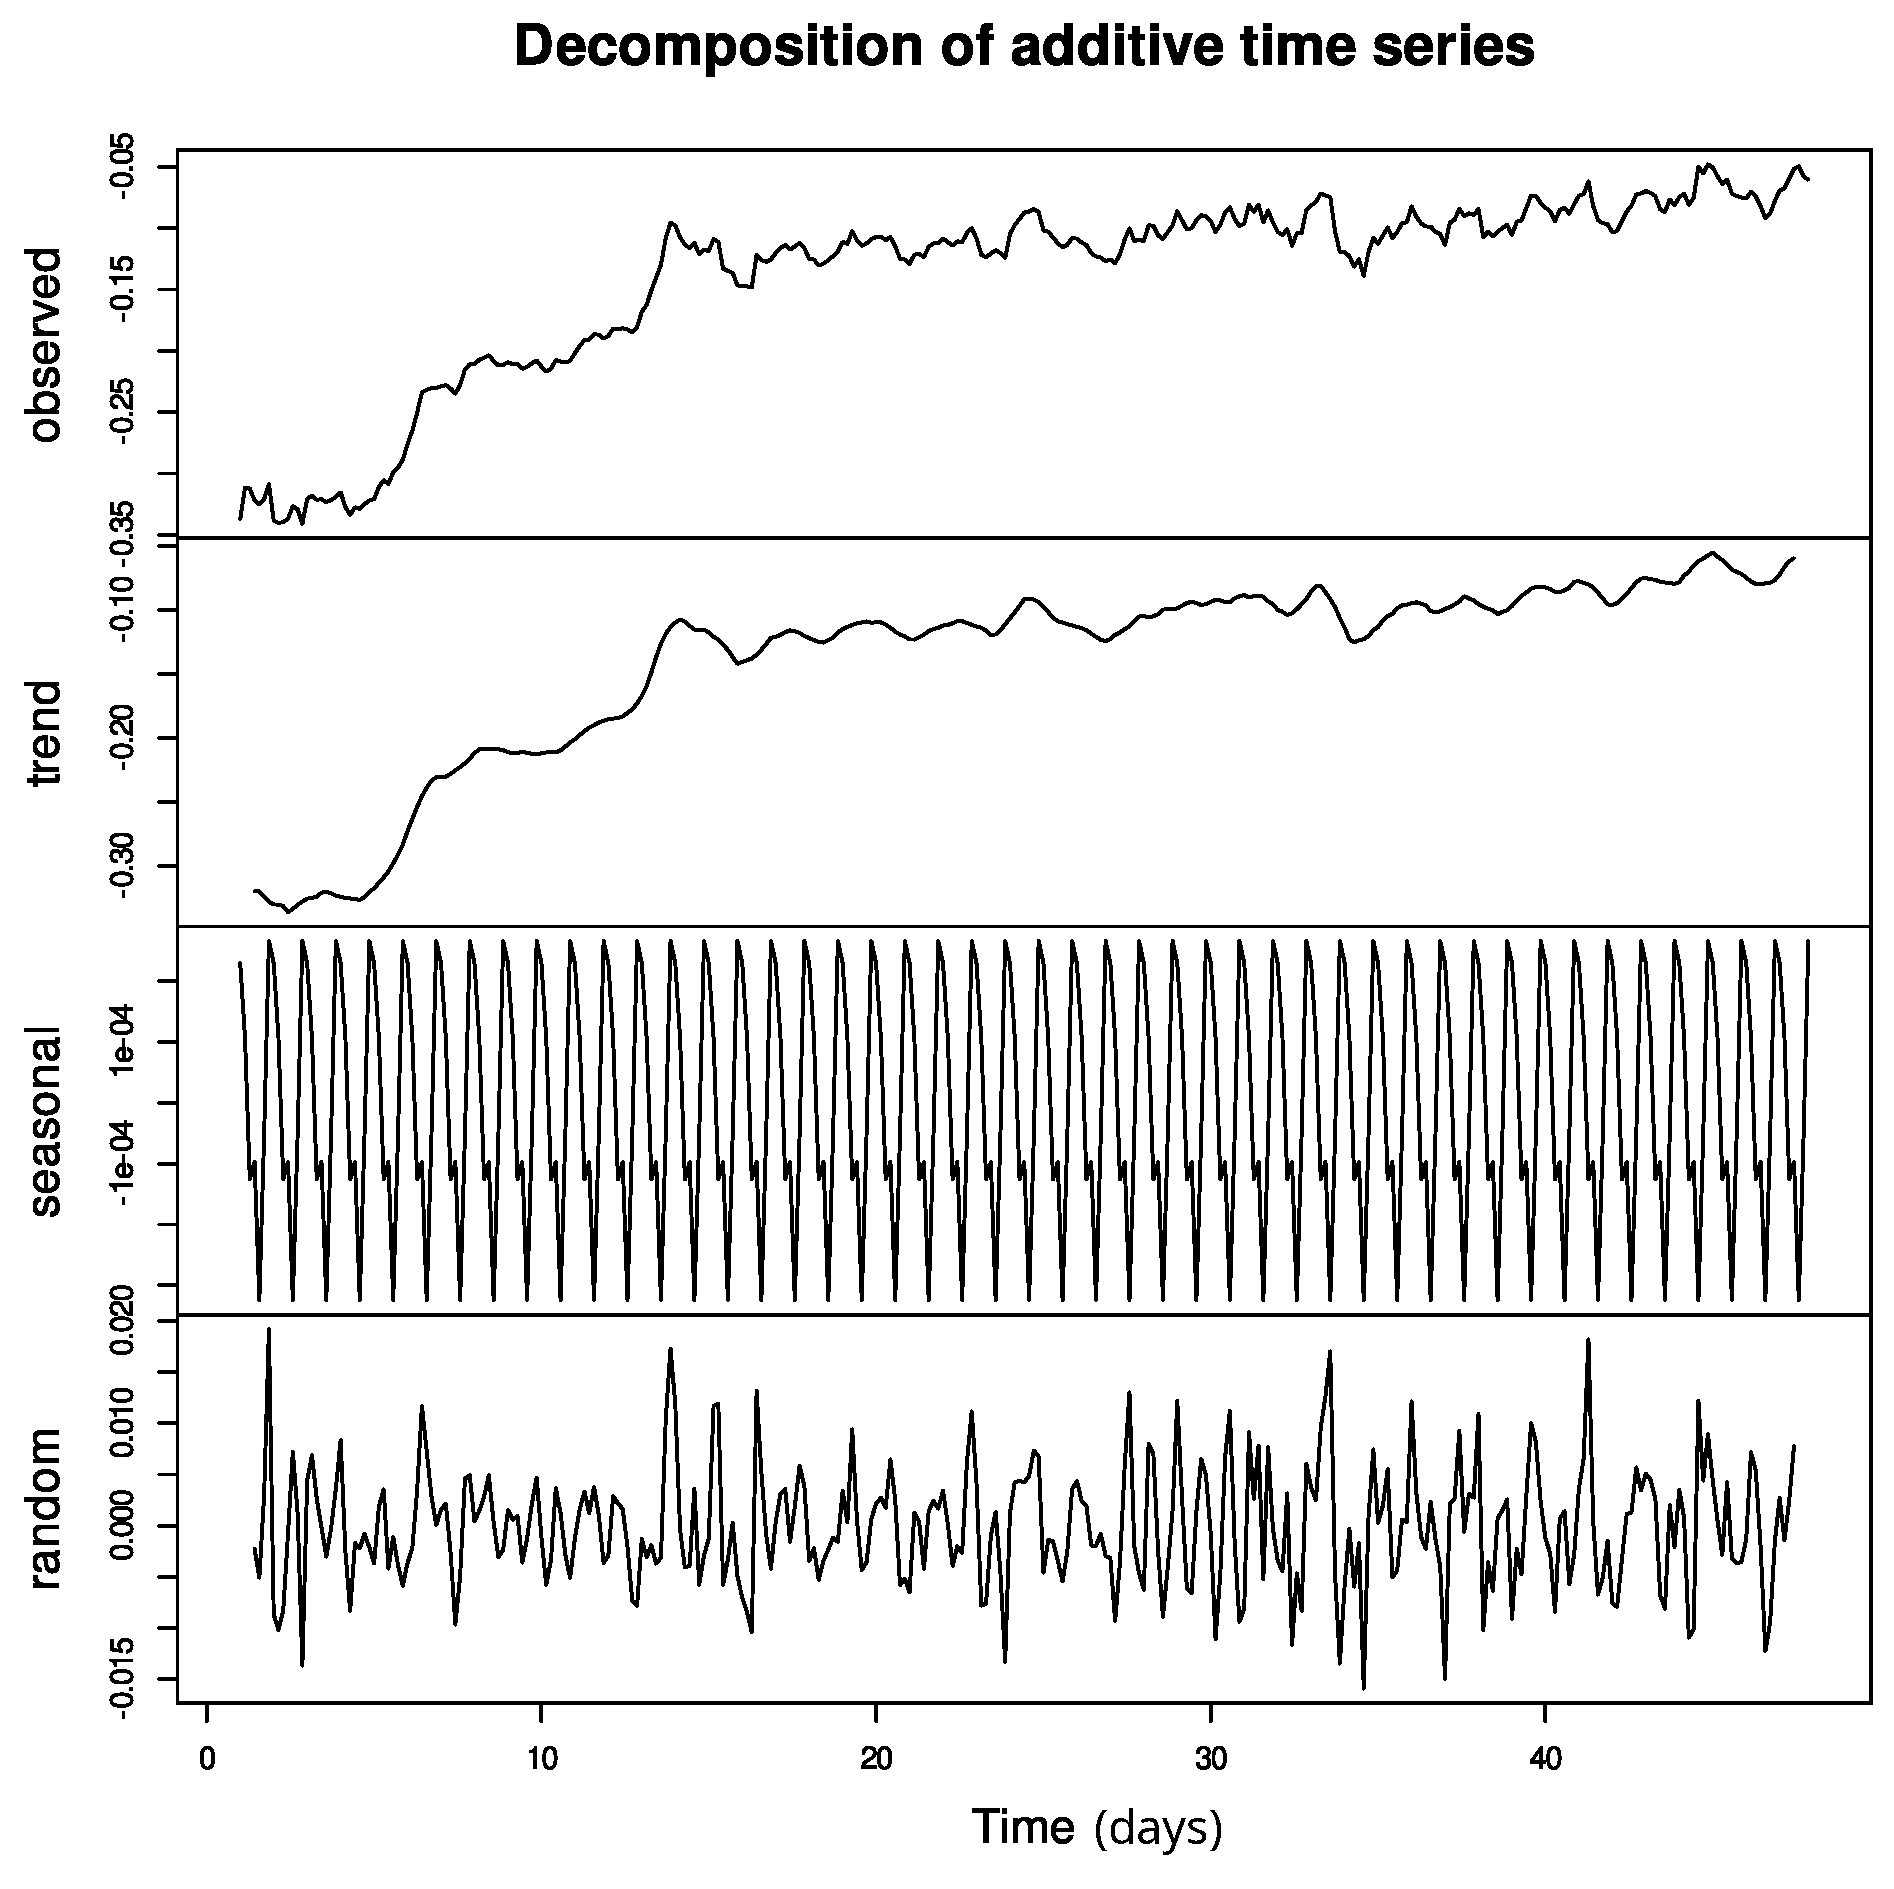
Figure 6 presents the time series decomposition, that is, the raw data, the trend, seasonality, and Gaussian noise, from which we can observe a robust weekly seasonality and a trend of
. The appendix includes the same charts for VADER (
Figure A1) and RoBERTa (
Figure A2), excluded here for clarity, showing similar trends in all of the language models (
for VADER,
for BERTweet, and
for RoBERTa) as well as a similar seasonality.
Table 1 summarizes a compound metric evaluating different implementations of language models. This single global metric follows a similar methodology as GLUE [
30] in that it uses an average of the relevant metrics for the given dataset. The metric utilized for this sentiment analysis task was the macroaveraged recall.
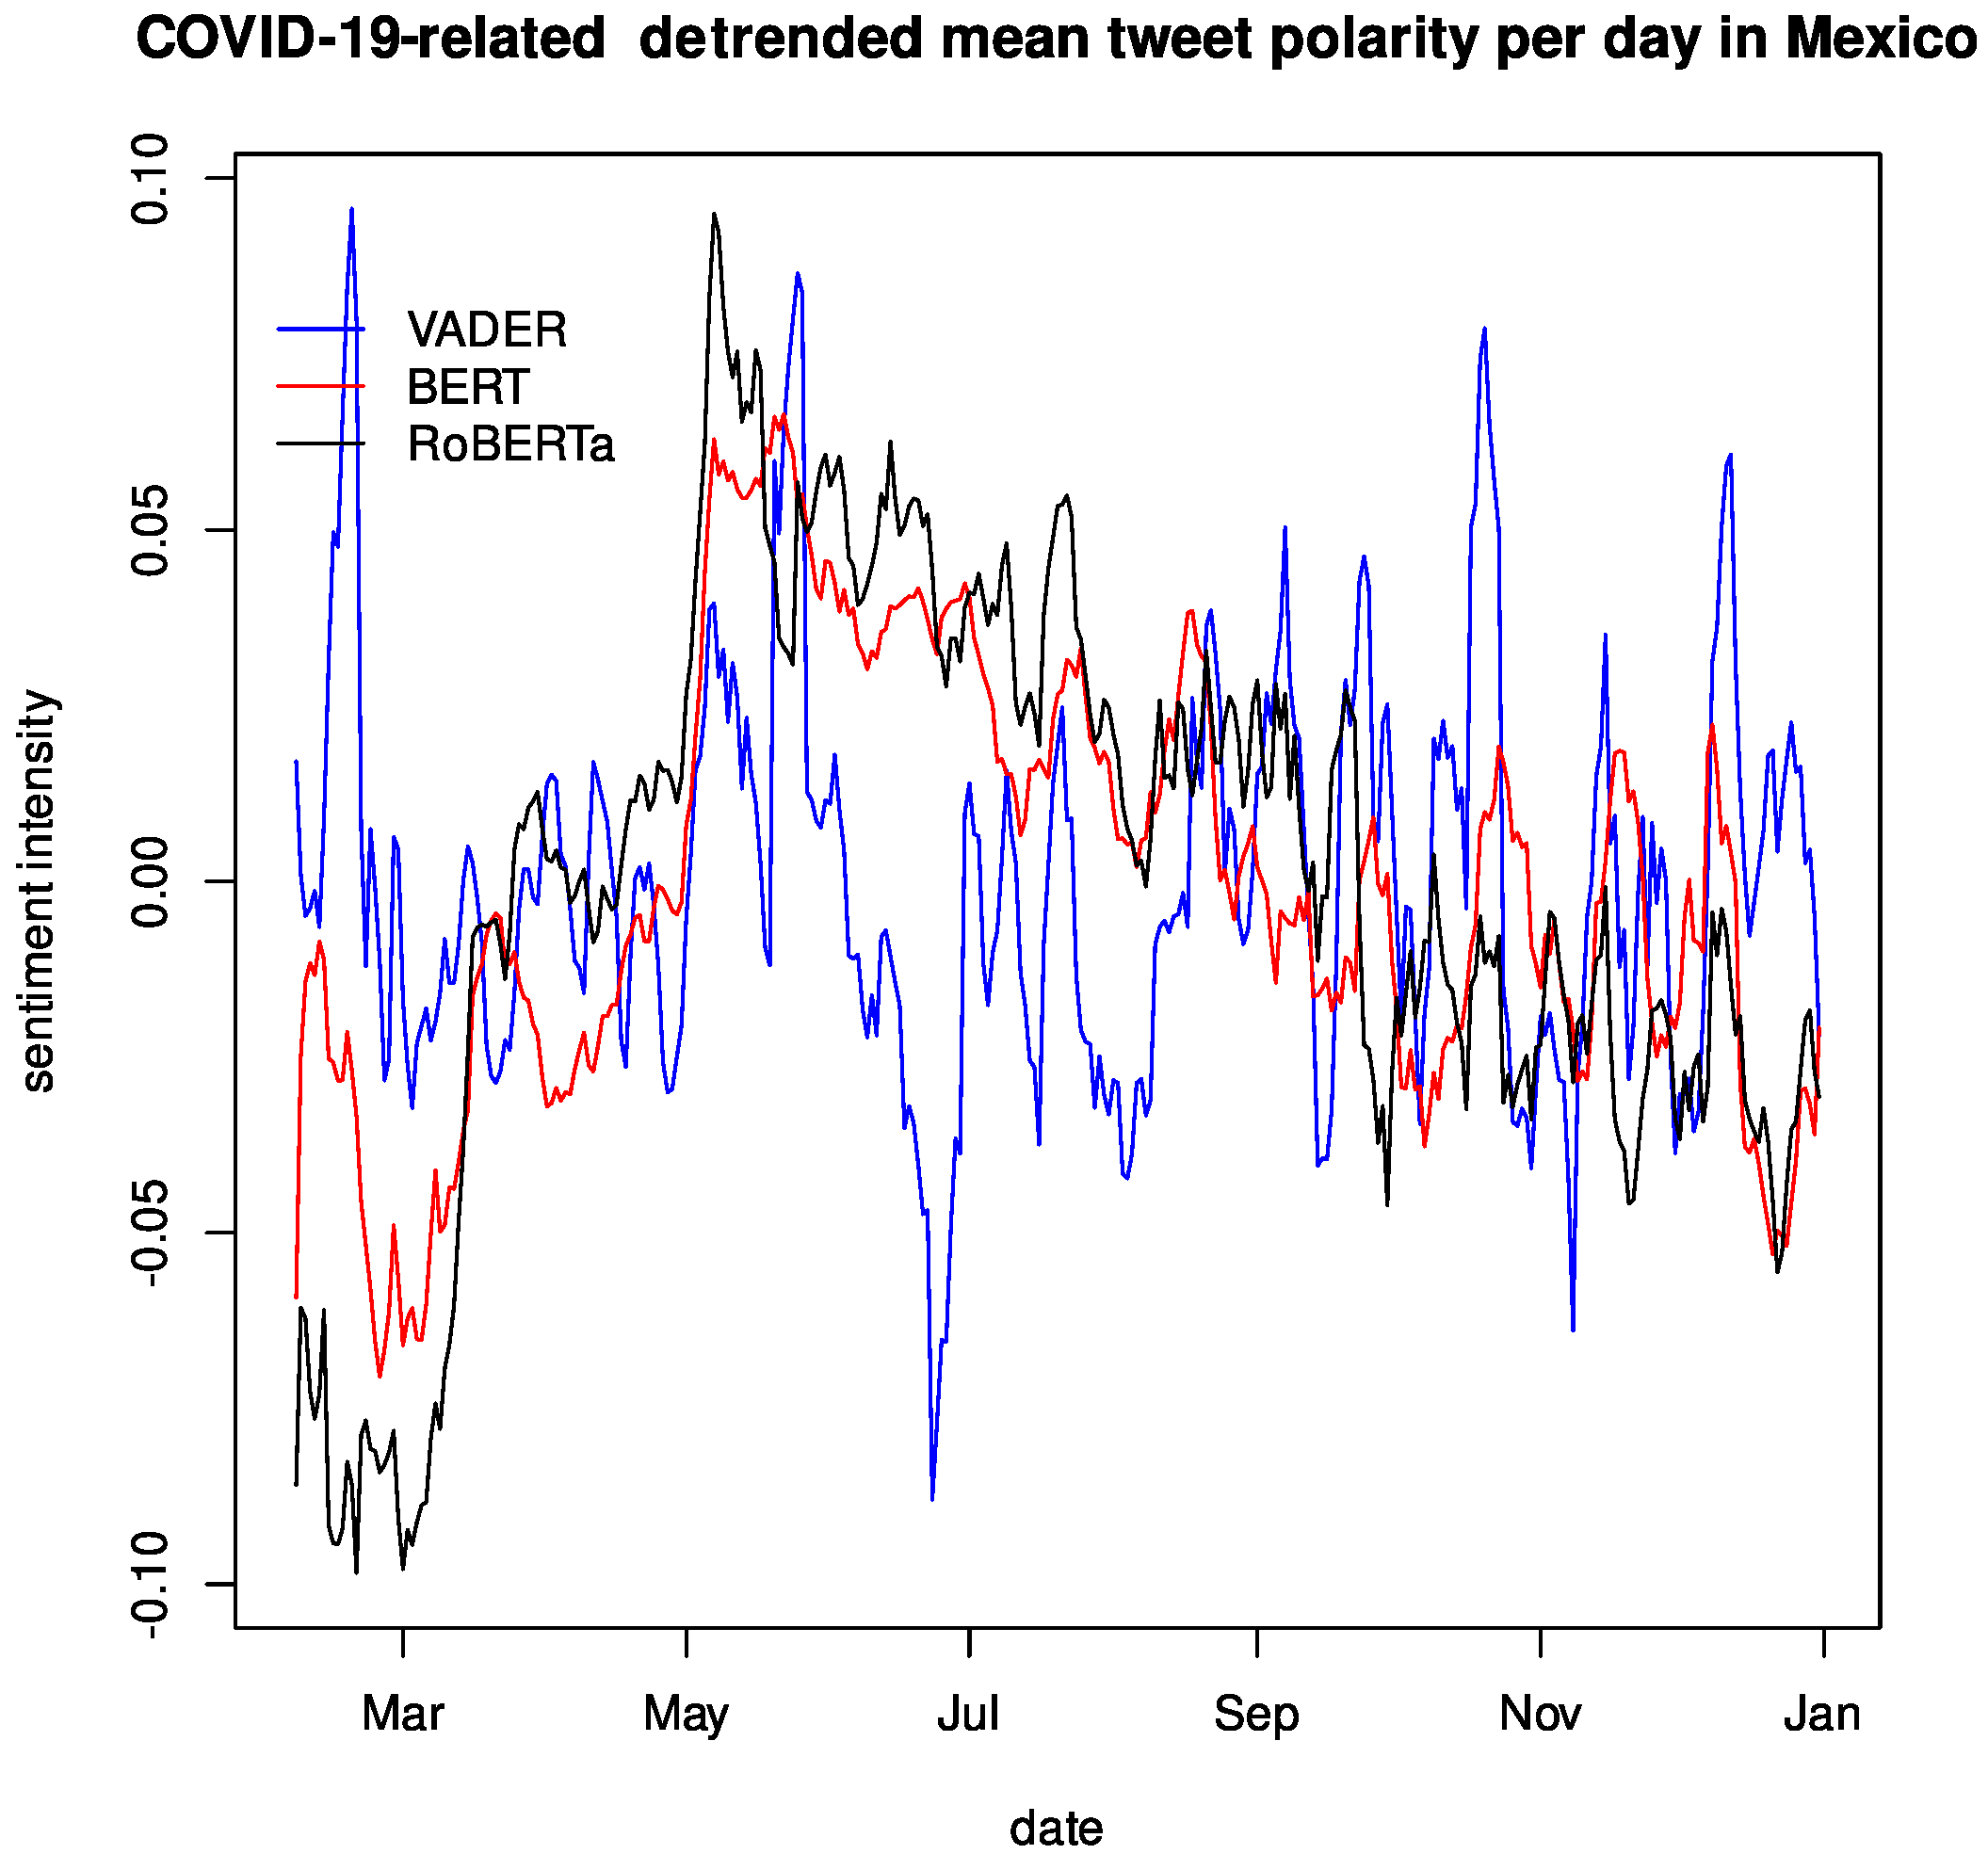
Figure 7 shows the daily average of the detrended compound sentiment polarity ranging from 2 February to 31 December 2020. Note that the
Appendix A contains the average positive, negative, and raw compound sentiment polarity for the same period. This time series was smoothed over a 7-day rolling average, for we found a solid weekly seasonality, which matched the seasonality previously found [
31] as well. We see an offset in each language model from here, but they follow a similar trend and present peaks at similar points, though their magnitude can be somewhat different, resulting in a similar sentiment intensity between VADER and RoBERTa, BERT having the group’s least intense magnitude. This behavior was expected as the RoBERTa implementation uses English tweets as a dataset for fine-tuning.
Table 4 and
Table 5 summarize the
Pearson’s correlation test indexes obtained when comparing the models. It is interesting to see a strong correlation with positive sentiments, particularly with RoBERTa, which should not be surprising as this model was also trained on Twitter data. However, when we calculated the compound sentiment polarity using VADER’s coefficient (see Equation (
2)), we saw low results typical of noisy signals. This would suggest that the most significant difference and drawback in utilizing VADER is its approximation function, defined in Equation (
2), for calculating the compound sentiment polarity.
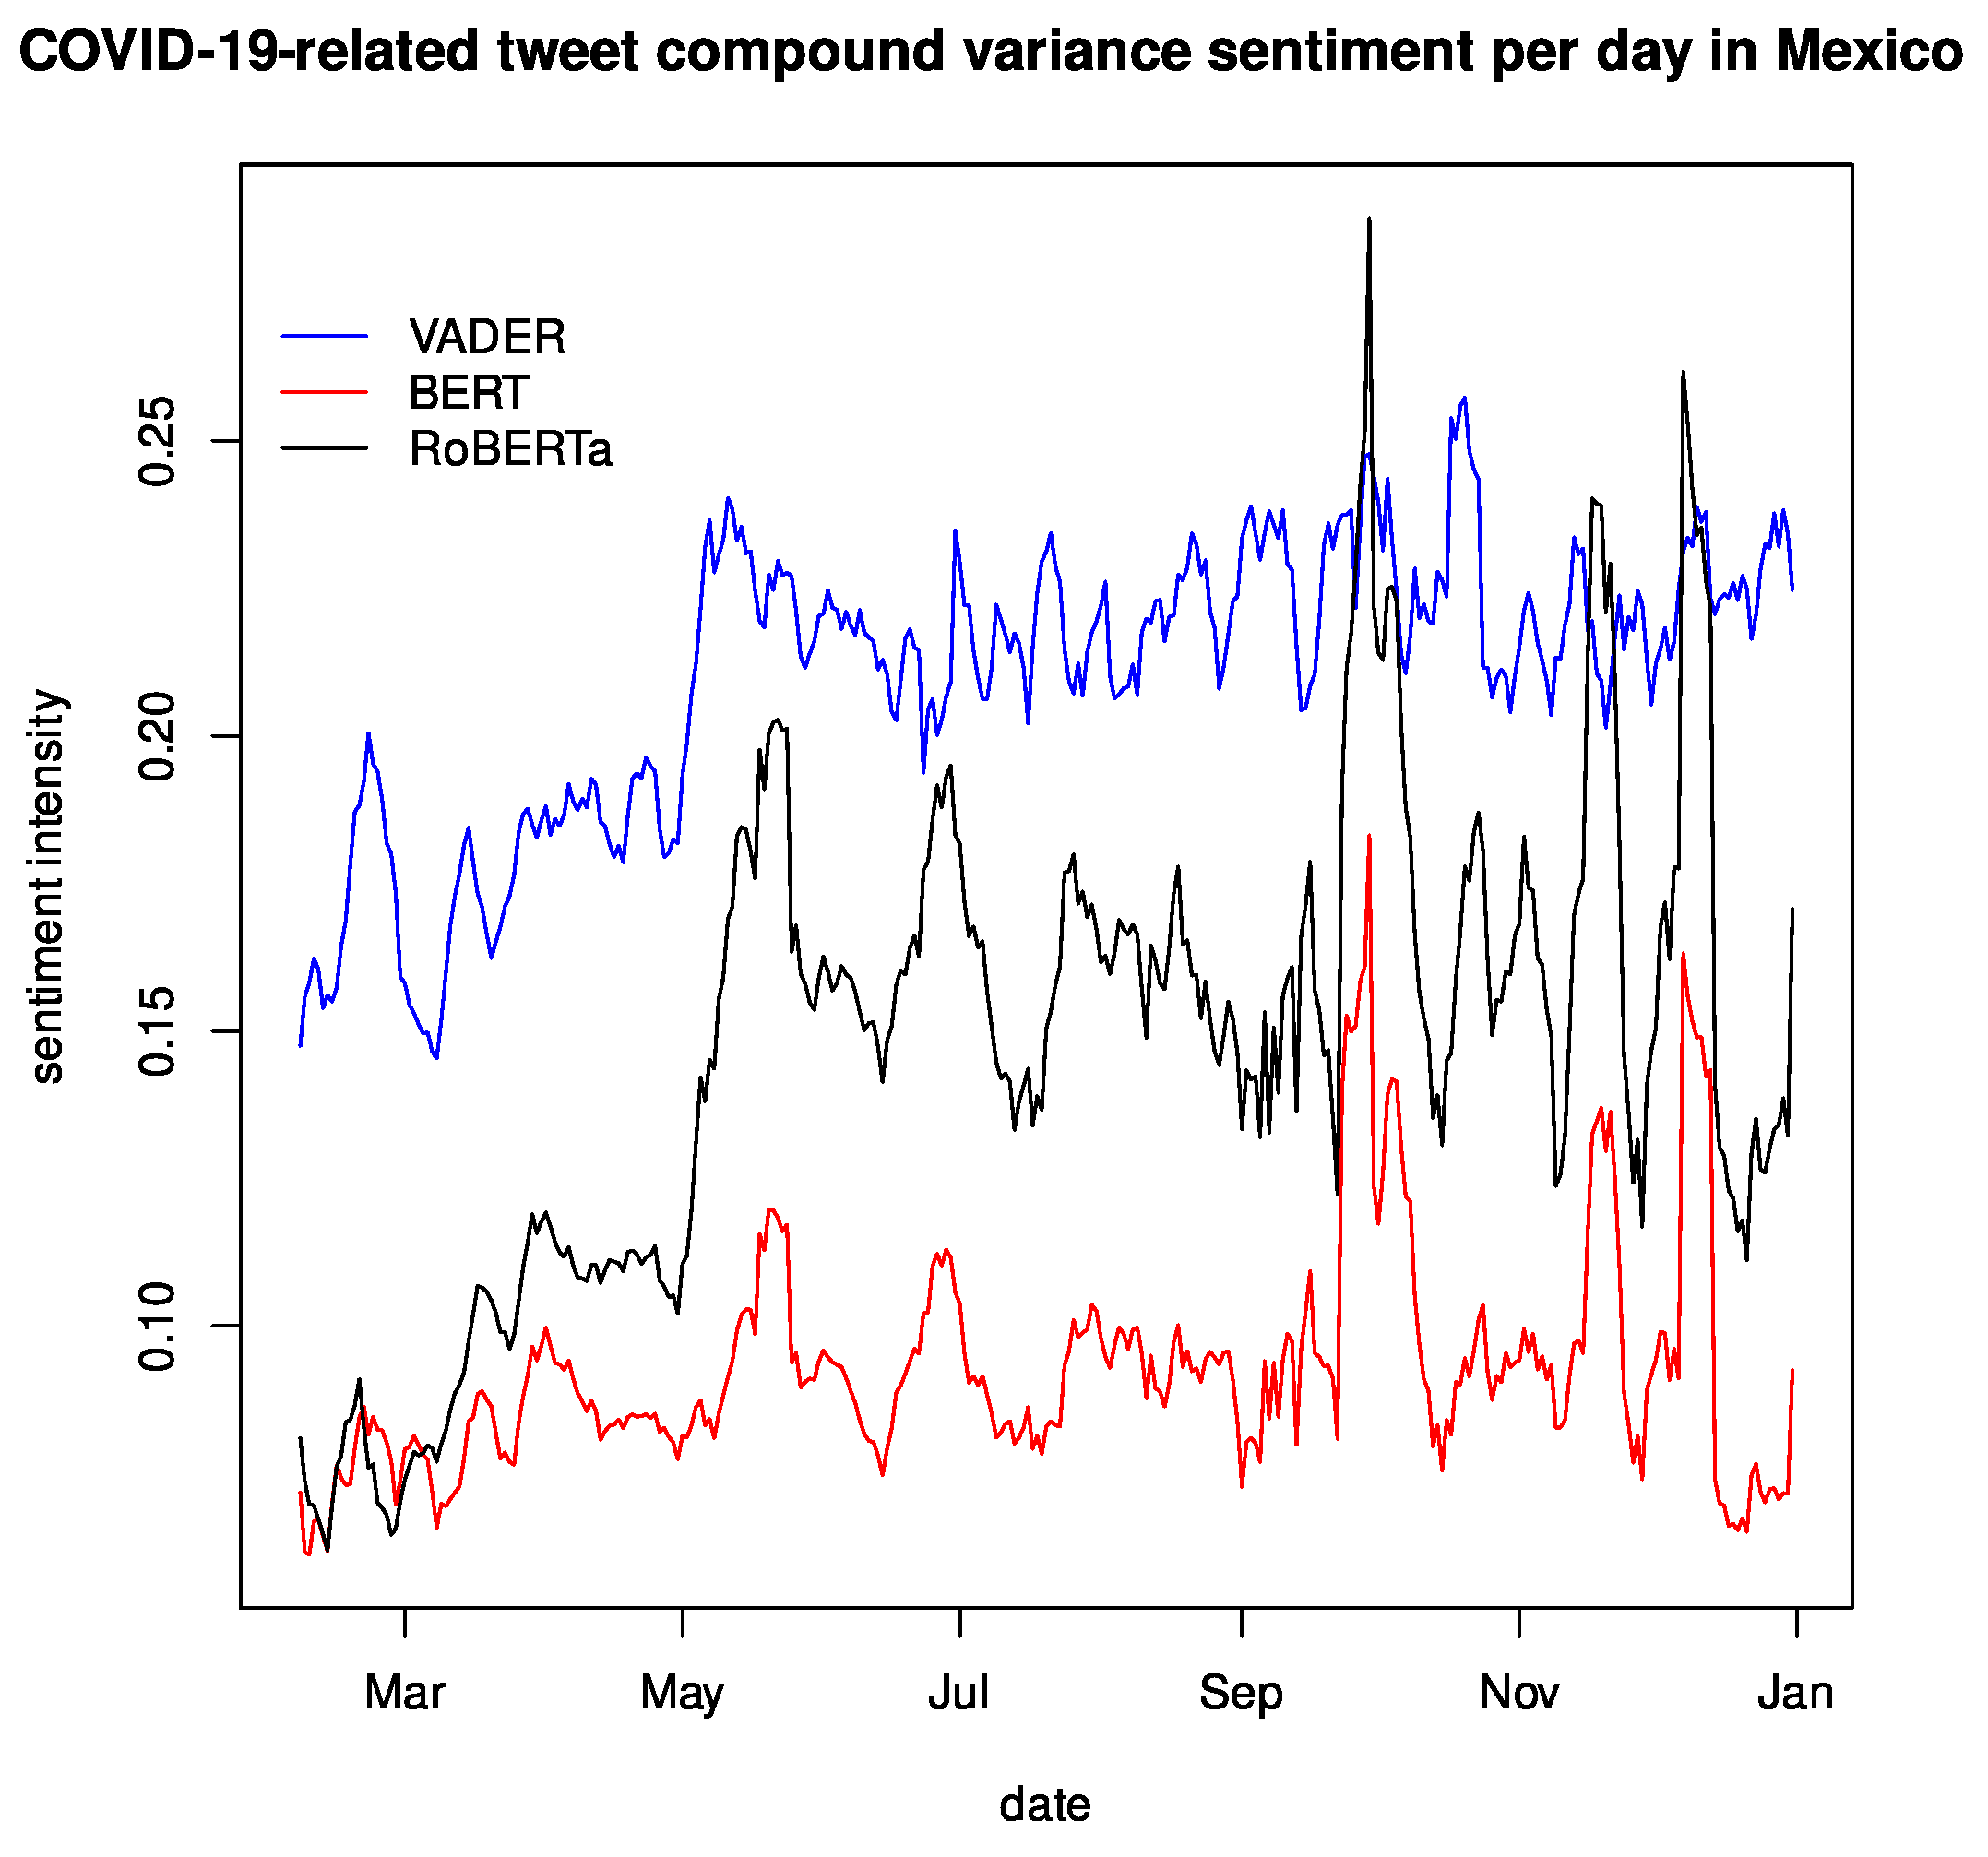
BERTweet and RoBERTa are large, deep-learning-based language models, sharing the same architecture BERT uses. A pretraining dataset of 80 GB is used for both, containing 850M English-only tweets. This architecture comes with two optimization levels, where BERTweet requires 135 M parameters and RoBERTa 355 M parameters, both for forward and backward propagation, resulting in an expensive training and evaluation architecture. Meanwhile, VADER needs human intervention to tag the data, but the model is a lightweight, rule-based language model. This makes VADER much cheaper to use and deploy; however, as
Figure 8 shows, the variance in BERT is significantly better than all other models, leaving VADER as the least stable model.
Another exciting result lies in the Pearson’s correlation test, which shows a strong correlation between the models, as is shown in
Table 5. This suggests temporal stability in the language models and that their difference lies in the magnitude of the sentiment polarity. Of course, this is the expected behavior as we are analyzing the same Twitter corpus. There is no reason why a particular language model would cause temporal warping in the time series. As summarized in
Figure 7 and
Figure 8, there is an offset in magnitude between the different language models. The same is true of the variance. Regarding the ARIMA models, we have a good fit for all language models with a
, and a robust weekly seasonality is present in the data. The charts for these models can be found in the
Appendix A. As expected, the trend is almost 0 with
for VADER,
for BERTweet, and
for RoBERTa.
These results make the different language models analyzed for this particular sizeable twitter-based task similar in terms of robustness and stability but not so in terms of sentiment polarity intensity. However, this last metric can be compensated for by normalizing all three results and adjusting the results gathered by VADER, though better results are obtained by utilizing either the positive or negative polarity. Given these minor differences but the similar trend, seasonality, and event reaction, we can draw similar conclusions from this data analysis project, making the language models interchangeably. The only real difference lies within the magnitude of the variance of the sentiment polarities, which should be considered when deciding on any given language model.
5. Discussion
We performed a sentiment analysis on a large COVID-19-only Twitter-based corpus [
6], restricted to Mexico, and ranging from February to December 2020, collecting a total of
n = 760,064,879 unique tweets. To enable this study, we implemented a flexible software architecture based on cloud-native and serverless technologies to adjust the scale and handle large datasets and streaming data while allowing one to swap out different language models promptly and effortlessly. This solution utilized micro triggers to produce and process a data stream with the modularity of a single tweet, thus allowing one to change data sources and provide the sentiment polarity in a near-real-time fashion. The same was valid for the preprocessing and a portion of the analysis made. We followed the same time series analysis to compare the impact of choosing VADER, BERT, or RoBERTa, as the measurement instrument for determining the sentiment polarity.
To safeguard the users’ privacy and comply with international and Twitter’s privacy policy, we stripped down all data from personally identifiable information and any metadata, regardless of whether it could be used against a user. To this end, the final schema only had two points, the raw tweet text and the timestamp, adding the needed sentiment polarity calculations for the multiple language models utilized. Doing so did impose some limitations on the data analysis we were able to perform. For example, [
16] ranked users and followed the trends and topics for the most popular users, regardless of whether it was COVID-19-related or not. This was not possible for us, as we did not keep users’ IDs, nor did we consume tweets that had nothing to do with the COVID-19 pandemic. Another self-imposed limitation of the study was to consider data only from the geographical location of Mexico and only for the year 2020. This was chosen to better align with a previous study [
2] and due to a limitation of resources since we preferred to analyze a large data corpus of
n = 760,064,879 and have multilanguage data there. Another limitation that can be addressed in the future was the inclusion of other families of language models. We only selected the top state-of-the-art architectures in terms of performance, but it would be interesting to see how other language models, particularly ones with different implementations, perform when executing this extrinsic task. Finally, other authors have performed an additional analysis using as a base the sentiment analysis, such as correlating it to following social distancing during the COVID-19 pandemic [
27]; however, this study was limited to the sentiment polarity time series analysis and the language model comparisons.
We provided a time-series analysis of n = 2,142,800 comparing the results of different, popular, state-of-the-art language models reusing a methodology that relied solely on the VADER implementation. The results showed a better stability of modern architectures, especially BERT, which its training dataset could explain. While BERTweet uses a general, curated corpus, RoBERTa utilizes a Twitter-based corpus for fine-tuning, allowing BERTweet to handle better text outside the known distribution. On the contrary, the magnitude of the sentiment polarities varied slightly. Modern architectures showed a more vital polarity, but when adjusting for VADER’s distribution estimation for normalizing results, VADER and RoBERTa produced similar results, with smaller peaks observed in the latter. However, all models showed similar trends and reacted similarly to real-world events, making all three good options for large-scale sentiment analysis systems. RoBERTa is built with 355M parameters, making both forward and backward propagation an expensive operation. In contrast, VADER being a rule-based language model provides a faster, less-expensive solution.


 ,
, 


